policy uncertainty in japan · uncertainty on economic performance, but they show that our epu...
TRANSCRIPT

Policy Uncertainty in JapanSteven J. Davis
Research with Elif C. Arbatli, Arata Ito, Naoko Miake and Ikuo Saito
RIETI Workshop on Uncertainty, Trade and Firms
Tokyo, 18 April 2018

After Reaching Historic Peaks, Global EPU Fell Sharply in 2017
1

How Can High (Policy) UncertaintyHarm Economic Performance?
• By causing businesses to delay or forego investment and hiring when they are costly to reverse
• By raising the cost of debt and equity finance, thereby discouraging investment
• By causing households to behave more cautiously, cutting back on spending
• By intensifying monopoly pricing distortions when prices are sticky
• By undermining confidence?
Plan of Talk1. New Economic Policy Uncertainty (EPU)
indices for Japan, building on approach of Baker, Bloom and Davis.
– Each index reflects the frequency of newspaper articles that contain certain terms pertaining to the economy, policy matters and uncertainty.
2. Display and discuss results for our Japan EPU indices
3. Cover details of index construction, auditing, etc., if time permits.

What Do Our Policy Uncertainty Measures Seek to Capture?
All of the following:• Uncertainty about who will make economic policy
decisions – e.g., who will win the next election?• Uncertainty about what economic policy actions
decision makers will undertake, and when.• Uncertainty about the economic effects of policy actions
– past, present and future actions• Economic uncertainty induced by policy inaction • Uncertain economic ramifications of national security
and other policy matters that may not be mainly economic in character

Constructing our Overall Japan EPU Index
1. Flag articles in four major Japanese papers (Yomiuri, Asahi, Mainichi and Nikkei) that contain at least one term in each of the E, P and U term sets listed to the right.

Constructing our Overall Japan EPU Index2. For each newspaper and month, scale the raw
EPU article count by the count of all articles.3. Standardize each newspaper’s series of scaled
EPU counts to the same variability over time.4. Adjust for seasonality at the newspaper level.5. Average over papers by month to get EPU index. 6. Multiplicatively normalize the EPU index to a
mean of 100 from 1987 to 2015.We construct uncertainty indices for Monetary Policy, Fiscal Policy, Trade Policy and Exchange Rate Policy in the same manner by specifying additional criteria (beyond E, P and U)

Japan EPU Index, Jan. 1987 to March 2017
Shaded areas denote recessions.
The Japan EPU index fell further after March 2017 and has been below 100 since May 2017.

Japan EPU Index and Option-implied Volatility Of Nikkei Equity Index Compared

Japan EPU Index Behavior1. Our Japan EPU index rises around contested
national elections and major leadership transitions, during the Asian Financial Crisis, and in reaction to the Lehman failure, the U.S. debt downgrade in 2011, the Brexit referendum and Japan’s recent decision to defer a consumption tax hike.
2. The Japan EPU index tends to drift down during periods of political stability, as indicated by lack of turnover at the Prime Minister level
3. The index co-varies positively with implied volatilities for Japanese equities, exchange rates and interest rates and with a survey-based measure of political uncertainty.

Category-Specific PU IndicesTo construct our Monetary Policy Uncertainty index, for example, we flag articles that meet the E, P and U criteria and contain one or more of these terms:

Japan Monetary Policy Uncertainty Index

Japan & U.S. Uncertainty Indices forMonetary Policy Compared
Correlation of about 0.3, althoughthe US and Japan Monetary PUindices co-move closely in certainperiods, e.g., 2007-2011.

Japan Fiscal Policy Uncertainty IndexCorrelation with Japan Monetary Policy Uncertainty Index is 0.68.

Japan Fiscal Policy Uncertainty Index and Ito’s Political Uncertainty Index Compared

• Ito’s survey-based measure of political uncertainty in Japan weighs the approval ratings of ruling and opposition parties.
• His measure and our Japan Fiscal PU index reflect some of the same underlying developments. Both rose during 1997-98, peaking with the LDP’s defeat in July 1998 and the resulting Twisted Diet. They rose again in the 2007-12 period characterized by frequent turnover of the Prime Minister.
• His measure correlates with our Japan Fiscal PU Index at 0.31 in monthly data and 0.44 at the annual frequency. In contrast, his measure correlates at only 0.07 with our Monetary PU index.

Japan & U.S. Uncertainty Indices forFiscal Policy Compared
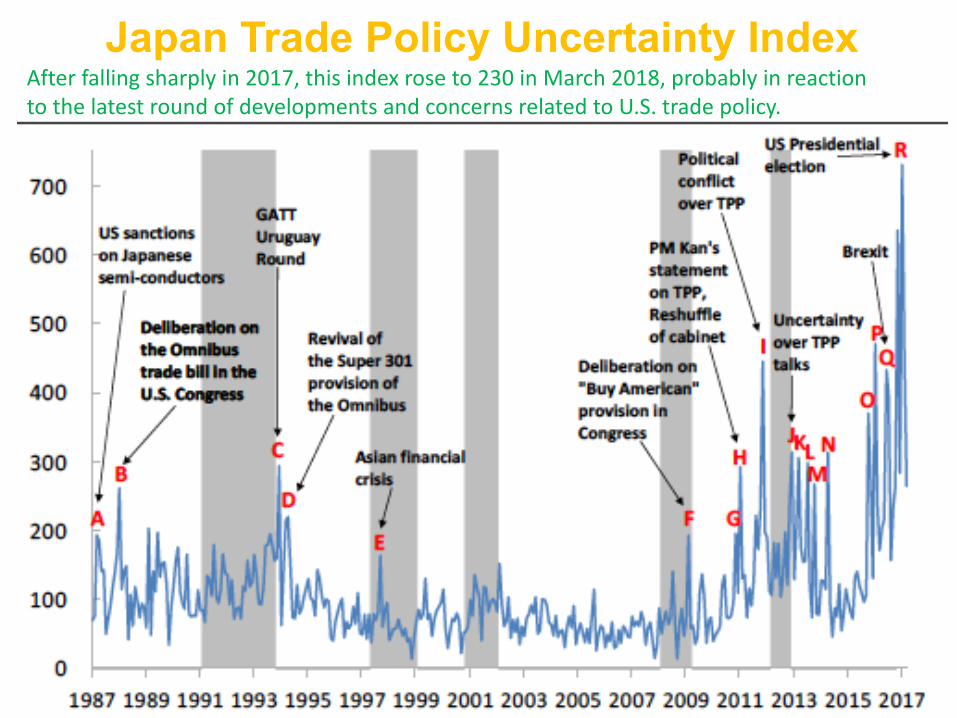
Japan Trade Policy Uncertainty IndexAfter falling sharply in 2017, this index rose to 230 in March 2018, probably in reaction to the latest round of developments and concerns related to U.S. trade policy.
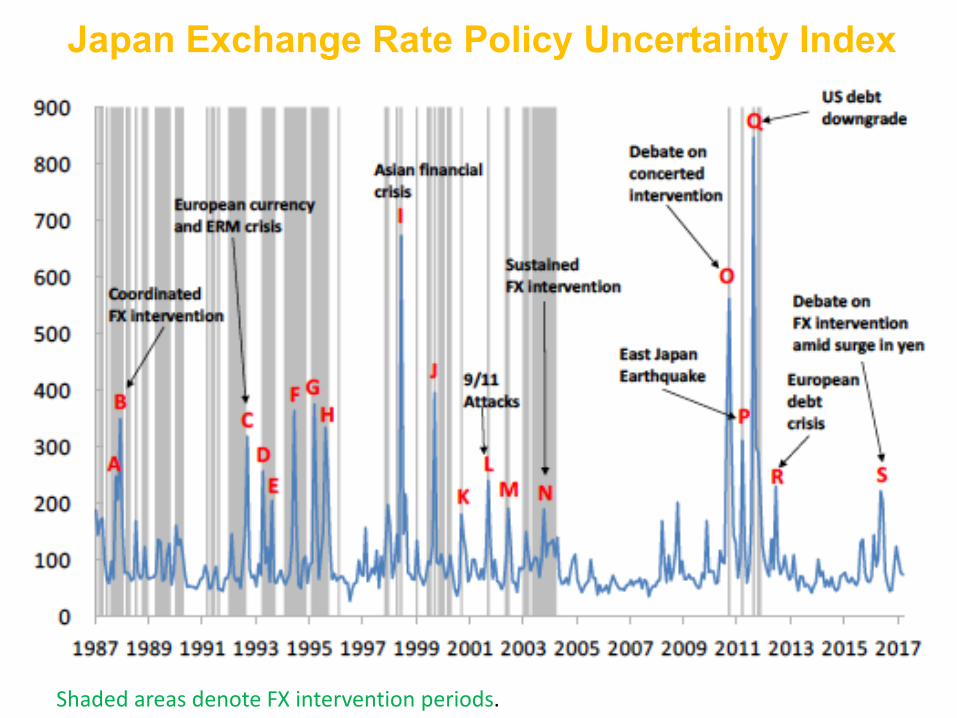
Japan Exchange Rate Policy Uncertainty Index
Shaded areas denote FX intervention periods.

Proximate Sources of Japan EPU
19

Policy Uncertainty and Aggregate Economic Performance
• We consider VAR models that yield response functions for output, employment, consumption, investment, etc.
• Shocks identified by standard Cholesky decompositions. Log(Japan EPU) ordered first, unless noted otherwise.
• Other variables: log Nikkei stock price index, nominal interest rate (yield on 2-year JGBs), log employment, log GDP or industrial production (or major components), log household consumption expenditures or synthetic consumption index, and log gross private investment.– Some specs include log(option-implied Japanese equity
volatility) and log(Global EPU)20

Policy Uncertainty and Aggregate Economic Performance
• Two lags in all specs, selected based on Akaike and Schwarz information criteria.
• Baseline samples run from 1994M1 to 2016M12 for monthly data and from 1987Q1 to 2016Q4 for quarterly data.
21

IRFs to Unit St. Dev. EPU Innovation1987Q1 to 2016Q4
22
95% Confidence Intervals
A unit standard deviation upward EPU innovation foreshadows a peak fall in real GDP of about 0.3 percent after 4-5 quarters.

23
Peak investment responseis much larger – about 1% after 6 quarters.
Employment response smaller but more drawn out, with a peak responseof about 0.2%

Historical Contributions of Japan EPU Shocks to GDP and Investment Fluctuations, Quarterly Data
24
25
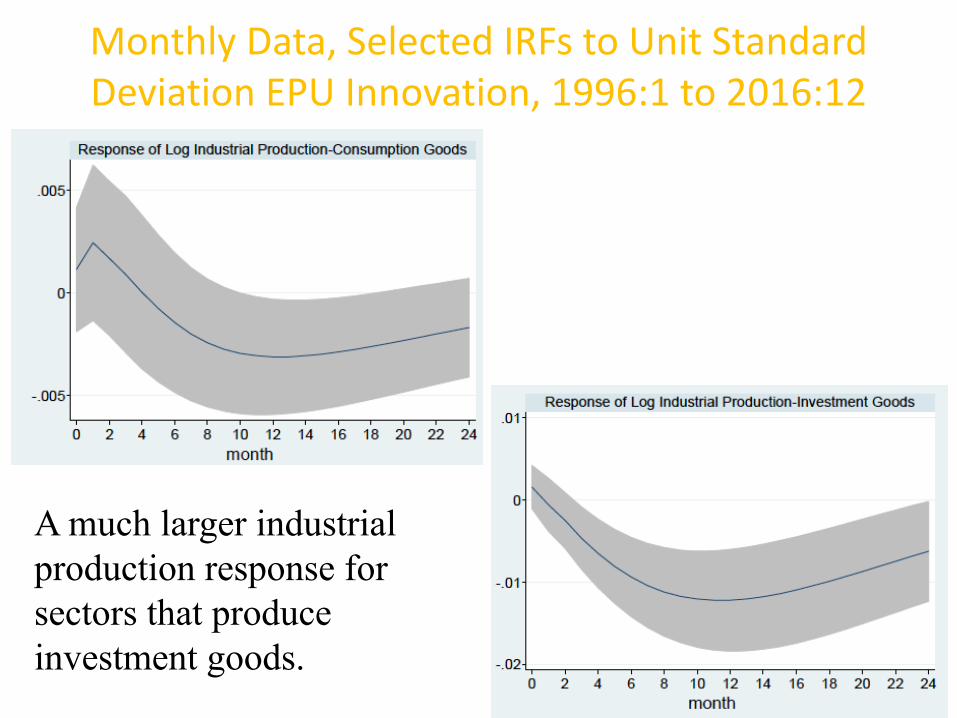
Monthly Data, Selected IRFs to Unit Standard Deviation EPU Innovation, 1996:1 to 2016:12
A much larger industrial production response for sectors that produce investment goods.
26
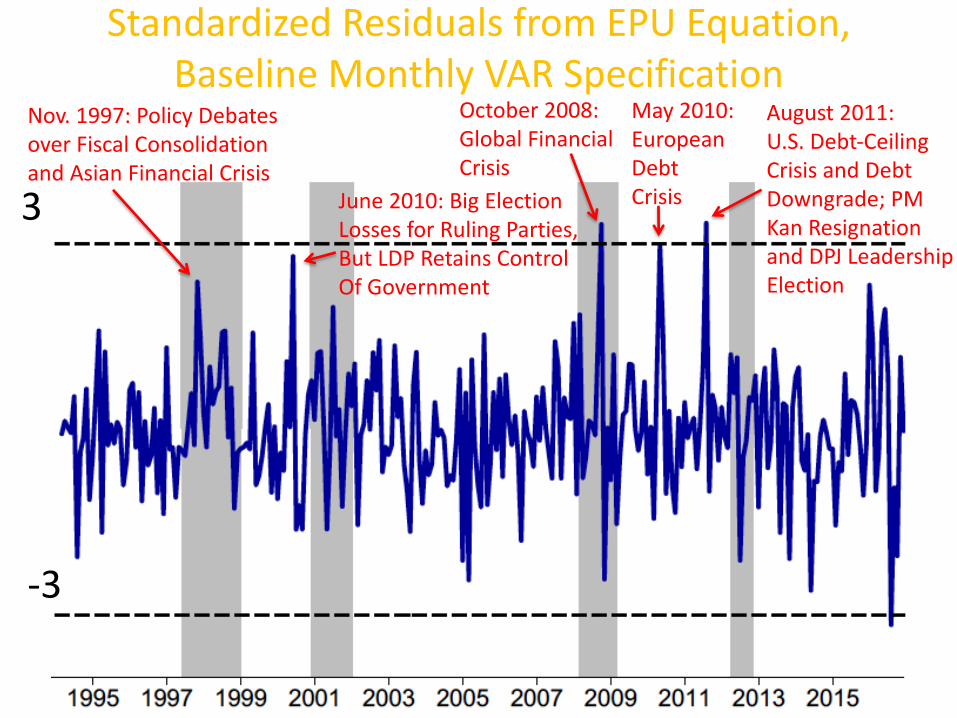
Standardized Residuals from EPU Equation, Baseline Monthly VAR Specification
3
-3
Nov. 1997: Policy Debates over Fiscal Consolidation and Asian Financial Crisis
August 2011: U.S. Debt-CeilingCrisis and Debt Downgrade; PMKan Resignationand DPJ LeadershipElection
May 2010:EuropeanDebtCrisis
October 2008: Global FinancialCrisis
June 2010: Big Election Losses for Ruling Parties,But LDP Retains ControlOf Government

Taking Stock of the VAR Results
27
• Big EPU shocks occur outside recessions. Recessions do not necessarily involve big EPU shocks.
• Upward EPU innovations foreshadow deteriorations in Japan’s macroeconomic performance, as reflected in impulse response functions for investment, employment and output. – These results are similar to results in Baker et al. (2016) for the United
States and for a panel of a dozen countries
• These VAR results do not prove a causal effect of policy uncertainty on economic performance, but they show that our EPU index contains useful information not captured by other (standard) forward-looking indicators.
• Upward innovations to our EPU index for Japan foreshadow larger declines in macroeconomic aggregates than innovations to the Japan EPU index in Baker et al. (2016), suggesting that our efforts to improve the index deliver a better measure and stronger results in downstream econometric work.

28
Broadly speaking, three possible interpretations:1. An upward EPU innovation corresponds to an unforeseen
policy uncertainty shock that worsens macroeconomic performance through real options effects, cost-of-capital effects or other mechanisms.
2. An upward EPU innovation reflects bad news about the economic outlook that is not (fully) captured by the other variables in the VAR system, and that bad news triggers a rise in EPU that has harmful effects on the economy. Under this interpretation, EPU amplifies and propagates a causal impulse that originates elsewhere.
3. EPU has no role as either an impulse or a propagation mechanism; instead, it simply acts as a useful summary statistic for information missing from the other variables in our system. It’s hard to reconcile with evidence of policy uncertainty effects in studies that use micro data, which allows for more compelling identification strategies.

The Complex Interplay between Policy Uncertainty and Economic Performance1. Causal effects operate in both
directions, through multiple channels, and differently across episodes.
• Consider potential causal effects of (bad) shocks/performance on policy uncertainty. – In the near term, the Global Financial Crisis of
2008-09 confronted policymakers with extraordinary and complex challenges. There was great uncertainty about how they should and would respond, and what would be the economic consequences. 29

– Re longer term effects: Funke, Schularick and Trebesch (2016) draw on data for many countries over roughly a century to document a pattern of rising political polarization in the years following systemic financial crises, contributing to higher levels of policy uncertainty.
• In the other direction, policy uncertainty potentially affects economic performance through several channels.
• According to New Keynesian models, the harmful effects of policy uncertainty are greater when the economy is at the ZLB or the monetary authority otherwise unable to respond.
30

2. Policy uncertainty co-moves with other factors that influence economic performance.
• Some of these other factors are themselves hard to measure with precision: – Confidence about future economic performance – Political polarization– Governance quality in the public sector
31

3. The potential for negative shocks to create harmful policy uncertainty depends on the underlying environment, which in turn is shaped by institutions and previous policy decisions. – Example 1: The case for discretionary fiscal stimulus
in response to negative shocks is weaker when robust automatic fiscal stabilizers (AFS) are in place. AFS diminish the need for discretionary fiscal stimulus, along with the political conflicts and policy uncertainty that often accompanies efforts to deploy discretionary tools.
32

– Example 2: Stronger capital requirements, living wills, stress tests, and bankruptcy reforms for financial institutions all aim to make the financial system more resilient to shocks and curtail negative spillovers. If successful in these aims, such reforms lower the likelihood of another Lehman moment and the need for extraordinary, discretionary policymaker actions, and the attendant policy uncertainty.
– Example 3: The Asian Financial Crisis in 1997 prompted several governments to accumulate large foreign exchange reserves and adopt more flexible exchange rate regimes. Both strengthened their resilience and reduced domestic policy uncertainty in the wake of the GFC two decades later.
33

– Example 4: Consider proposals to raise the central bank’s target rate of inflation (e.g., Blanchard et al., 2010 and Ball, 2014). The logic behind these proposals is straightforward: Raising the underlying rate of inflation reduces the likelihood that monetary policy bumps against the ZLB in future downturns. In this way, a higher target rate enlarges the scope for using traditional monetary policy tools to stabilize the economy and lessens the need for quantitative easing, forward guidance, direct credit market interventions and discretionary fiscal stimulus. Because less is known about the effectiveness of less conventional policy tools, their use involves greater uncertainty about effects.
34
4. Employment and investment are less responsive to cuts in interest rates and taxes in the wake of an increase in (policy) uncertainty, according to real options theory.
– Greater uncertainty widens inaction regions.– Thus, a rise in policy uncertainty near the onset
of a recession reduces the potency of countercyclical stabilization policy.
35

5. Aspects of the complex interplay for Japan • Contested elections, major political transitions and
Twisted Diet outcomes are often associated with higher levels of EPU in Japan.
• PM Abe’s election at the end of 2012 brought greater political stability, a clearer policy direction, and several years of declining or low policy uncertainty. A similar pattern held during the long tenure of PM Koizumi.
• These periods of political stability contributed to a moderation of policy uncertainty, and the relatively benign/hopeful economic outlook during these episodes helped sustain stable political leadership.
• The Asian and Global Financial Crises triggered large upward Japan EPU innovations. 36

On Our Measurement And Index Assessment Efforts
1. Compared to the Japan EPU index in Baker et al. (2016), we:
– Expand coverage from 2 to 4 major newspapers.– Investigate & adjust for changes in archive coverage.– Deploy better term sets that reflect our auditing
efforts and expertise in Japanese economic policy. – Seasonally adjust scaled frequency counts at the
newspaper level to deal with pronounced and distinctive seasonal patterns in certain papers, due to their coverage of periodic company reports.

2. Unlike Baker et al. (2016), we also: – Develop indices for several policy
categories, which are helpful in diagnosing the proximate sources of policy uncertainty and useful in analyzing policy uncertainty effects on industry- and firm-level outcomes.
– Conduct a detailed descriptive assessment of key economic and policy developments associated with heightened levels of policy uncertainty according to our Japan EPU indices.

Next Steps1. We have gathered daily data on equity
returns for listed firms in Japan.2. We are investigating how the realized
volatility of firm-level equity returns respond to our Japan Policy Uncertainty measures.
3. Which firms respond? And by how much?
4. Do movements in our policy uncertainty measures account for sizable shifts over time in the firm-level structure of equity returns volatility?

Summary and Conclusions1. Our Japan EPU index rises around
contested national elections and major leadership transitions in Japan, during the Asian Financial Crisis, and in reaction to the Lehman failure, 2011 U.S. debt-ceiling crisis, Brexit referendum, and Japan’s recent decision to defer a consumption tax hike.
2. Our uncertainty indices for fiscal, monetary, trade and exchange rate policy co-vary positively but display distinct dynamics.

3. Fiscal matters are the most important proximate source of policy uncertainty in Japan, according to our newspaper-based results.
4. Upward EPU innovations foreshadow deteriorations in Japan’s macroeconomic performance, as reflected by impulse response functions for investment, employment and output.
• Peak responses are modest for output and employment, larger for investment.

5. Our results favor the view that high policy uncertainty undermines macroeconomic performance.
– By acting as an impulse behind fluctuations, a mechanism for amplifying and propagating causal impulses that originate elsewhere, or both.
6. Past policy decisions and institutions shape the policy uncertainty response to contemporaneous economic shocks. In particular, well-designed policy institution and rules can limit the scope for negative shocks to trigger large jumps in policy uncertainty.

EXTRA SLIDES

Correlation of Japan EPU Indices with Other Uncertainty Measures
44
45
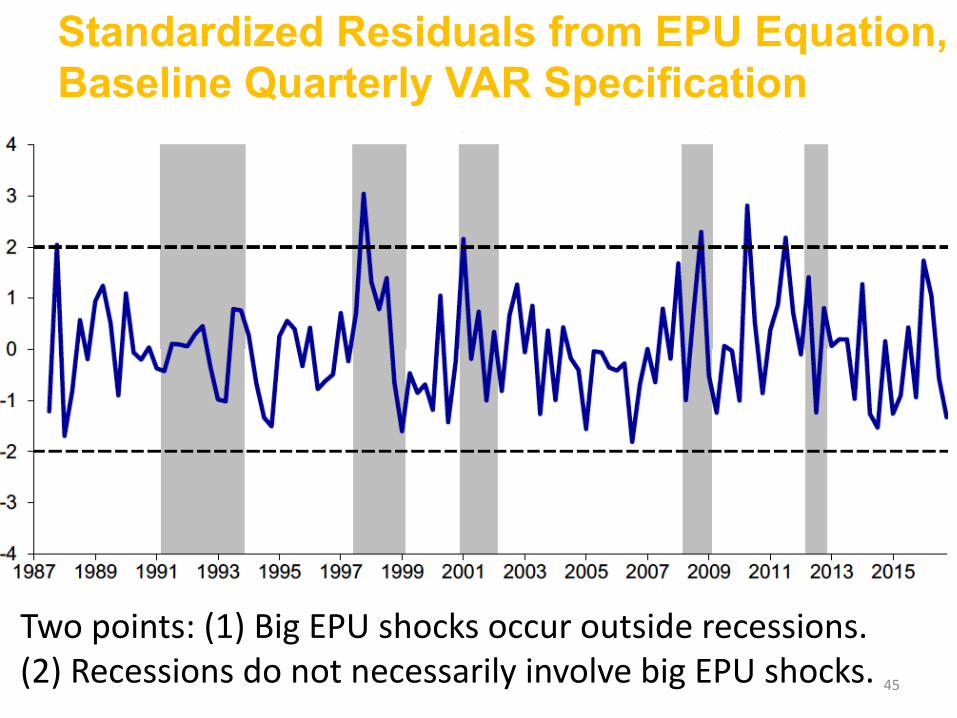
Standardized Residuals from EPU Equation, Baseline Quarterly VAR Specification
Two points: (1) Big EPU shocks occur outside recessions. (2) Recessions do not necessarily involve big EPU shocks.
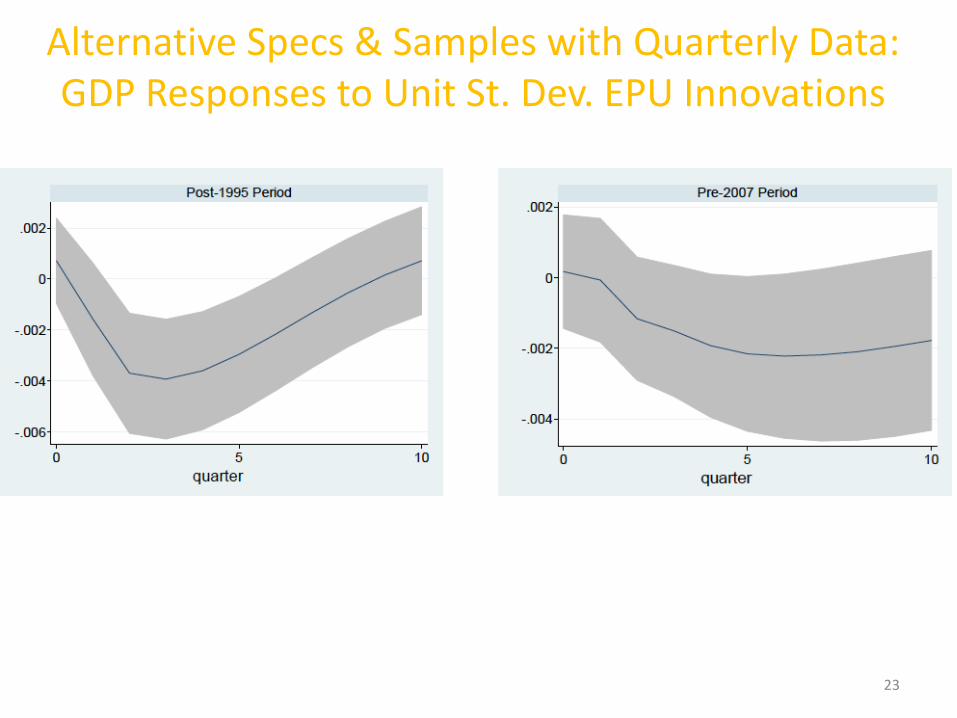
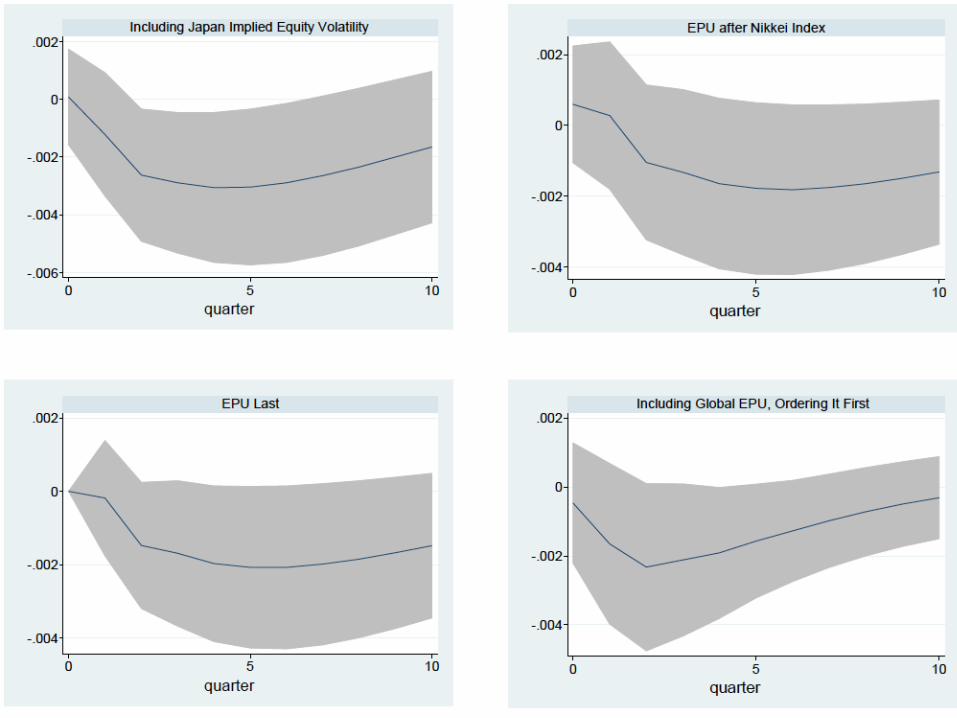
Alternative Specs & Samples with Quarterly Data: GDP Responses to Unit St. Dev. EPU Innovations
46
Alternative Specs & Samples with Quarterly Data: GDP Responses to Unit St. Dev. EPU Innovations
23
Alternative Specs & Samples with Quarterly Data: GDP Responses to Unit St. Dev. EPU Innovations
47