policy research working paper - … · policy research working paper t..t x x .. w ,_, ... copies...
TRANSCRIPT

_______ WP§ //yL42LAS
POLICY RESEARCH WORKING PAPER
t..t X X .. w ,_, S~~~~~ . ,
Energy Price Increasesin Developing Countries
Case Studies of Colombia, Ghana,Indonesia, Malaysia, Turkey, andZimbabwe_
Einar HopeBalbir Singh
The World Bank
Publiic Economics eDivisio
March 1995 :

I POLICY RESEARCH WORKING PAPEk 1442
Summary findingsWhen domestic energy prices in developing countries fall industries are flexible enough to substitutc whcn energybelow opportunity costs, pricc increases are recom- prices increase. Energy prices tended to increase inmended to conserve fiscal revenue and to ensure efficient adjustment and liberalization programs, and industrialuse of resources. Using six case studies, Hope and Singh output usually increased even with the higher energyinvestigate the effect of energy price increases on the prices. This suggests that the effect of the price increasepoor, inflation, growth, public revenues, and industrial is modest compared with the effects of other changes incompetitiveness the environment. There are exceptions, of course, such
The effect on households in varinus income classes as energy-intensive industries with limited possibilitiesdepends on the energy commodity's share in the for substitution.household budget and the price elasticity of demand. For Estimating the effects on public deficits is straight-energy as a whole (electricity and fuels, traditional and forward, even with uncertainty about demandcommercial), budget shares often decline with income. elasticities: Energy price increases reduce the drain onSo in terms of income distribution, taxing energy is not public resources significantly.ideal. But commercial fuel consumption increases greatly It is harder to trace the effects on inflation and growthwith income, so any subsidies applied will largely benefit in national income. The effects on inflation will generallynonpoor urban households. For each commercial energy not be severe, and inflation may even be reduced in thesource (electricity, kerosene, diesel, and gasoline) intermediate to long run, through lowered publicproportionate household spending will generally be deficits. Income growth rates were generally higher afterlower, and some energy sources will be luxuries. In no the years of energy price adjustments than they were ininstance does energy spending exceed 10 percent of the the years before the price increases (with one exception)typical household budget for any income group. and the years of the price increases (with onc exception).
The effect on industry is generally modest, since cost Income growth rates were higher during the years ofshares for energy typically range from 0.5 to 3 percent price increases than before in about half of the case-study(with the typical value being 1.5). In addition, many countries.
Thispaper-aproduct of thePublicEconomicsDivision, Policy ResearchDepartnent-is partof alargereffort inthe departmenttostudythe distributionalandenvironmentaleffectsof energypricing policies. lestudywas fundedin partbytheBanks ResearchSupport Budget under the research project "Pollution and the Choice of Economic Policy Instruments in Developing Countries"(RPO 676-48). Copies of this paper are available free from the World Bank, 1818 H Street NW, Washington, DC 20433. Pleasecontact Carlina Jones, room N1O-063, extension 37699 (91 pages). March 1995.
Te Poicy Researc Workig Paper Siea dimnts the findns of work hi progss to encorg the exxange of ies aboutdoelpmtieiesAnAx obectiv of thd wris is to gett d fndigs ot quiky cmen if the presetatiom are kss thn fsdly polishd Thepapers any the names of authors and should be sed Wand cited accordinly. *Ihe findings, mterpretatios and conlusins are theauthos'n and should not be attrbued to the Wail Bank, its Exetive Board of Dirchtors. or any of its member couwrie&
Produced by the Policy Research Dissemination Center

Energy Price Increases in Developing Countries:
Case Studies of Malaysia, Indonesia, Ghana, Zimbabwe,Colombia and Turkey
Einar Hope'Balbir Singh
FOUNDATION FOR RESEARCH IN ECONOMICS AND BUSINESS ADMINISTRATIONNORWEGIAN SCHOOL OF ECONOMICS AND BUSINESS ADMINISTRATION
DEPARTMENT OF ECONOMICS - UNIVERSITY OF OSLOBERGEN
The authors, consultants to the World Bank, than Gunnar S. Eskeland, Shanta Devarajan, and JohnBesant Jones and others for assisance and comments. The views expressed are those of the authors. Thestudy was funded under Research Project 676-48.

CONTENTS
Summary mad CncikonsImpacsofEnergyPriceIncreases: TeIndustrialSector ..................... 1ImpactsofEnergyPriceIncreaes:bTheHousehold Sector .................... 3MfacroonomnicImpacts ......................................... S
1. Energy Price ness In Developing Countries3ackwoud ................................................. 8Energy Price Changes: Survey and Methodology ............... ........... 11
A Framework .. ........................................ 13Energy Demand in the Indusia Sector . .............................. . 14Eney Demand of the Hoehold Sectr .. ........................ 15MnbceconomnicImpacts . ......... ..................... 15Policy Impluentation lie Time Path ......... . ............................ . 16
Annex 1.1 Average Differences Between Domestc and BorerPe .........Bord.... 18Annex 1.2 Domestic Kerosene Prices . .................. .................. . 19Annex 1.3 DonesticDieselPrices .... ...... . 21Annex 1.4 Domestic Gasoline Price;s ....... . 23Anex 1.5 Input Price Incree and Input Demand ........................ . 25Annex 1.6 Energy Price Incas, Household Demand and Welfare ........ . ..... 27Amex 1.7RevenueEffect . ....................................... 30
2. Malaiysa Diel and KrosnePice In eases M14-8Introuction ................................................. 31The Econmy ................................................ 31The Energy Sector . ............................................ 32
Strture of Energy Denmand .................................. 32EncrgyPolicyandPriceas .................................... 32
Effec of Energy Price Changes .................................... 34DiewelPricelncreasnsl984-85:ThIlndustrialSector ................... 34Kerose Price Increases 19445: The Household Sector ............... 35Macroeconomriclmpacts .................................... 38
DataSources ................................................. 41
3. hdomnesi Diesel and Kerosene Price Increms M9435Introduction............................................ ... 42IbeEconomn ................................... . . . . ... 42TheEnergySector ......................................... 43
Stuctu of Energ Demand .................................. 43Energy Policy andPdc ..........Pri.......................... 44
Effects of Energy Price Changes .................................... 45DieselPrice lnreLse1982-SS:Thelndustrial Secor .................. 45Kerosene Price Increases 1982-85: The Household Sector ............... 48Macroeconomicnmpacts ..................................... 49
DataSources ................................................. ,2

4. Ghama Disel md Kerosene Price Increase 198388Intrduction ................................................ 53Mm Economy .... ................................... 53TIMEnergy Sector ... ......................................... 54
Structue of Energy Demand ................................. 54EnergyPolicy andPrices ........... ...................... 55
Effec of Energy Price Chanps ........... .. .. . .. . .. .. . ............ 55DiselPrice cemascs 1983-88: TheIndustrial Setor.... S55KerosenePriceChagsl1987-88:TheHouseholdSector ............... S8MacroemouincImpacts ................................... 60
DataSources ................................................ 62
S. Zlmbobwe Elecicty Pice Iwnr 198-84Introduction ................................... 63The EconomY .................................... 63The Energy Sector ............................... 64
Structu of EneqyyDenand ................................. 64EnergyPolicy andPrices ................................... 65
EffectsofEnergyPrice Changes . . .65Electriity Price Incrases 1983-84: duesIndustrial Sector ... 65Electricity Price Increases 1983-84: The Household Sector .............. 68MacroeconomicImpacts ......... .......................... 69
DataSourcs ............................................... 71
6. ColombIc Elecricity Nice Inmases 1985-38Inrduction . ............................................... 72TheEcnomy ............................... ' 72TheEoergySector ............................................ 73
StructamofEnergyDemand ................................. 73Elctricity Policy andPrices ...................................... 73
Effects of Eey Pre Changes . ................ .................. 74Ecriity PriceIncraes 1985-88:TheIndustrialSector ...... ........ 74Eletricity Price Increases 1985-88: The Household Sector . . 78Macroeconomic Impacts .. ............. 79
Anex 6.1 Colombia: Evolution of the Foreign Debt of the Power Sector ........ .3 1Data Sources . ................................................ 82
7. Turkey: ORl md Ectrrkity Prke Increases 1986-88Intrduction ........................... 83lTiEconomy ............................ 83Tbe Energy Sector .......................... 84
Stuure of Energy Demand .. 84Energy Policy and Prices......................................... 84Effects of Energy Price Changes ................................... 85
Dieseland EktricityPrice Changes1986-88: TheIndutrial Sector 85....... Electricity Price Change 1983: The Household Sector . . 97Macroeconomic Impactss ................................... 90
Da Souces ................................................ 91

1
SUMMARY AND CONCLUSIONS
Th policy recommendation that domestic energy prices should reflect the scarcity of energy resources has
been emphasized in a number of developing countries. However, while there seems to be general
agreement tabout the costs of subsidizing energy, views differ concerning the economic and welfare
consequencis of increasing energy prices. Consequently, although some countries have increased energy
prices, others continue to contemplate such changes with trepidation. This study draws on the recent
experience of countries that have implemented domestic energy price increases and analyzes the economic
consequences. These consequences can be categorized into two groups; (1) direct partial-impacts on
producers and consumers, and (2) overall macroeconomiic impacts of energy price increases. Direct pardal-
impacts include effects on costs, output and consumption in the industrial sector and impacts on
consumption and weLfare of household consumes Macroeconomic impacts include effects on the general
price level, govenunent revenues, energy subsidies and aggregate output
A sample of six countries, which unplemented significant increases in prices of different fuels and
electricity duing the 1980s, was identified for detailed analysis: Malaysia, Indonesia, Ghana, Zimbabwe,
Colombia and Turkey. The choice of countries was guided by factors such as income level, economic
structur geographic dispersion, and export or import of oil.
Impacts of Energy Pfice Increases: The Industrial Sector
The inpact of an increase in Ihe price of energy on industial output depends on ihree parameters:
(1) the importance of energy inputs in produc,ion as represented by energy cost shares, (2) the ease with
which eney can be substituted by other inputs, and 3) the ability of the producers to pass on the increase
in energy costs to the consumers, as measured by the elasticity of demand for output
These parameters may vay across production activities and countries. With the exception of energy
intensive activities such as metal- and non-metallic nmneral products and pulp and paper, energy cost shares
in most of the industries in the sample are relatively low, between 0.5 to 3 percent, with the modal value
being around 1.5 percen Shares for individual fuels are even lower, as most industrial activities use more
tan ame type offueL We can distinguish between two types of substitution in response to a change in ihe
fuel price: (1) a sibft to cheaper fuels and (2) interfactor substitution as firms reduce energy use. Indonesia
is the only counoy where information is available to assess substtution possibilities in industrial subsectors.
Hweer, in most ofthe counties energy consumption pattems reveal interfuel substitutio. In particulr,

2
in Malaysia, Indonesia amd Turkey, a shift in favor of electricity is observed as domestic diesel prices
inased. Alhough a part of fiis hif towad electricity can be explained by improved access to electricity
supplie, a sipuifcmit cross-price elasticity between diesel and electricity has also been observed in
Indonesia In Colombia, ash in favor of gas ca be observed as electricity prices increase. In general, h
sift faors domestic energW resource endowments in these countries. Interfactor substitution from energy
to labor has also been observed in YndonesiL
Table I sunmmizes changes in energy prices and industrial output The responses varied across
dt coutries in the sanple. For Ghana and Indonesia, increased growth rates in mufacuin output i
observed in the years of ihe price increases (Output Change II), as well as in 1he following years. In
Malysia (198445), Turkey (1988489) and Zimbabwe (1982483), sectoral growth rate fell during ihe years
of price increases In Zimbabwe, the fall in output was due to the response of the energy intensive
industies to increases in electricity prices, in particuar metal-smelting, where electricity is a large share
ofproduction cost and the possibilities for interfuel substitution are limited. Because of ihe competitive
nature of the inaional metal markets, individual producers are price takers and have limnited
possibiities for passing on tho increase in energy costs to consumers. In both Malaysia and Zimbabwe,
thr was a madked recover y manufacturg output in the year following the reform as indicated in
output IJI (table 1).
Table 1: Output Impacts of Ehergy Price Increases: The Andustrial Sector
Pr; inrRn'Sl FuI Qspitfh h
Cor Period % Chanje' Tpe Cost Share%2 I _I m
Mlayia 194- 17 Diesel 1.0 - 6.2 6.3 2.1 7.2Indonesa 198245 310 Diesel 0.3 - 8.0 0 5.1 6.2Ghan 1983-87 214 Diesel 0.3 - 12.0 -19 22.5 2.2Zimbabwe 1983-84 95 Ectricity >6.0 7.9 -1.7 9.7Colmxbia 1985-88 42 Electricity 1.2 - 6.8 n.a. La. n.a.Ture 198748 84 and 80 Dis. & Elec. n.a. 10.6 1.5 9.5
BA. - ming dat.Nosm. 1. Pric chane. refer to changi read prices (1986 local currency) over the whole period of th refrm.2. Cost urm for Ghm and Colombia are for all petrleum products and energy respectively.3. Oulput figre reafr to av* ama grwth rates (percent) of manuiacturing output for dute diffrnt periodr. I
-2 years preceding tpe- reform, I- Drin the refora, and M - 2 years following the reform. For IndonesiaOutput I refers only 1 yea preceding the price reform, and for Turkey, Malaysia and Zimbabwe output m refes to1 year folowing the pic reform For Ghana, output gowth ates are unweighted averages.

3
For WI th countries, growth rates in manufacturing were higher after the reforms (Output Change
111) than before the reforms (Output Change 1), except for Turkey, where growth rates were high both
before and aflter.
Theperiod of energy price changes coincided with widespread changes in economic policies under
the structural adjustment programs being implemented in these countries during this time. To better
undesand these direct output effects we need to examnine ihe overall economic policy environment in ihesecountzies. For example in Ghana, prior to the period of reforms, capacity utilization in the industrial sector
was betwe 10-18 percent Output prices for most of the commodities were detennined by their scarcity,
and there were high levels of quota rents. An important part of the adjustment programn was the
mobilization of foreign resources from bilateral and multilateral aid programs. In addition, widespread
reforms involving the introduction of flexible exchange rates, abolition of price controls and general
liberaization of the economy were implemented during this period. All these measures improved the
availbility of essential inputs for the industrial sector. It is most likely that domestic energy price increases
in Ghana were absorbed by producers via reductions in profit margins while output increased.
Impacts of Energy Price Increases: The Household Sector
Kerosene and dectricity are the two most important conunercial fuels' used by the household
sector. More recently, LPG has also become important in some countries. Changes in the relative prices
of these fuels would affect household consumptionm It is the welfare effect of the changes in household
consumption dat are of interest for policy purposes. The two most important parameters determining the
effect of an increase in fuel prices on ? lusehold energy consumption are dependence of the household on
tiese fuels, measured by the fiel budget share, and househoid flexibility both with respect to substitution
between different fuels and between energy, and other consumption goods and services.
The share of household expenditure on commercial energy vanes according to the income and
geographic location of the household. Ihe case studies confirm an inverse relationship between income
levels and energy budget shares, with higher-income households typically having lower energy budget
sbares tm low-income households. Rural households tend to have a lower budget share for commercial
energy as compared to urban households. his is expected, given rural access to non-commercial fuels such
'In this sudy we dingish betweea commercial and non-commercial fiues. Commid fels conist of coil,petoleum producb, gs and electicity. Non-commeril fiels include all other types of fiels sh as a icuhurresiues, duDg, fiwvood, etc.

4
as agricudtur waste nd firewood. Urban low-income households wore observed to have the highest budgat
shares for commercial energy. In absolute terms, the highest budget shares for kerosene lie between 3.6
and 6 percent. For electricity the relevant range is 1 to 9 percent.
There are few reliable estimates to gauge the flexibility of households with respect to interfuel
substtion and subsiton between energy and other consumption goods. Where elasticity estimates are
available, the elastcity of demand for kerosene is close to -1, i.e., a one percent increase in price leads to
close to a one percent fill in consumption. The price elasticity of demand for electricity is relatively low
and lies between -0.08 and -0.32. Ihe loss of welfare depends on the elasticity of demand, the expenditure
share and the price change; the upper bound on the welfare effect is when the demand elasticity is zero.
Table 2 swunrizes the welfare effect of domestic energy price changes for the countries analyzed.
Analysis indicates ta the welfare effect (expressed as a loss in consumer surplus) due to an
increase in domestic kerosene p:ices is equivalent to 1.3 to 2.23 percent of household income For
electricity price chnges, the welfare loss was estimated to be between 2.2 and 3.35 percent of household
noome. Th figures reported in table 2 are for groups of households showing the greatest loss as compared
to oder households in the countzy. In all 1he cases these are low-income ihouseholds residing in urban area.
Table 2: Welfare Impacts of Energy Price Increases: The Household Sector
Price' Budget Assumed Welfare2Countzy Year (% change) Fuel share (%) elasticity (% change)
Malaysia 1985 33.0 Kerosene 4.0 -0.81 -1.3Indonesia 1983 50.0 Kerosene 6.0 -1.02 -2.23Ghana 1983-87 39.0 Kerosene 3.6 0 -1.4Zimbabwe 1984 38.7 Electricity 5.0 -0.08 -2.2Colombia 1985-88 35.5 Electricity 9.4 0 -3.35Turkey 1988 80.0 Electricity 3.01 0 -2.4
Noir. 1. Price chanes genc;dly zfcr to chne n real prices (1986 local cunrracy) over the prcvious year's prcs-for Ohana theavmg ince over the ya For Columbia, cstma refer to changes in price between 1985 and 1988.
2. Wefarc impt mt tD the k in counwmer swplus (CS). Estimates are sportd ass peent ofincom fer the housholds vihlighcat om. FwTue,C Ghana nd Columbia, the estimates of welfae ss can be interprted asthe dwoft eae umuio as itis banedon thc asumpin th price dLsticity of dmnd is equal to zero.

S
Macroeconomic Impacts
Key macroeconomic indicators are influenced by a number of factors. Isolating the effects of
anrgy pnce changes from ft effects of other factors wvoud require an extensive modelling exercise, which
is beyond the scope of this study. However, a preliminary analysis of macroeconomic trends is usefu.
An increase in domestic energy prices can be expected to shift cost structures in the user sectors
and thereby the consumer price level. Depending on the response of nominal wages to an increase in th
CPL an energ price iase may spread hroughout the economy leading to a general price increase. Tho
energy soecor in these countries is dominated by public enterprises. An increase in energy prices charged
by these enterprses, which -esults in an improvement of operating surplus for these finns, also leads to
bwer fiscal subsidies to the sector. To fte extent lower subsidies result in lower levels of taxation for other
inputs, the impact on the price level would be moderated. Anotier source ofien used to finance energ
subsidies is state borrowing from the central bank In this case, higher energy prices, which reduce
subsidies and fiscal deficits of the public enterprises, woud lead to less money creation Thus, the
aggrgate effiect of raising energy prices on the general price level will deperd on both cost-push iflation
and lower inflation due to less money creation. The net effect will depend on the structural and policy
variables in each case sht. Table 3 summarizes key macroeconomic variables.
As table 3 shows, the response of the price level to energy price increases varied across different
countries. Most countries show no large increases in the CPI during the period of energy price increases
(Price chamge II) as compared with te preceding two years (Price change I). This can be explained pary
by the fact that food prices are the most important element affecting the index in addition to its direct
ec, the impact of energy prices on the CPI thus crucially depends on the sensitivity of the food or
agricuture sector to energy prices. However, the importance of energy inputs in agculture is ofte
neglgible (for instance uith small-scale peasant farmers). In general, the revenue effects of increases in
eny pnces were substantl in most of he counties. Combied wi th ihe austeity in public expenditures,
which was a charac tic of the stabilization programs under implemention at the time in thes
countWies, the mild effect of an energy price increase on the price level is expected.
For countries where an increase in energy prices coincided with high inflation, there is ltde
evidence to suggest tt iflaion was directly due to an increase in energy prices. In Ghanm one important
factor that led to higher inflation was a substantal depreciaton in exchange rates under the stabilizafion
progmn In two cases Colombia and Zimbabwe, an increase in the CPI was influenced by crop failures

6
Tabke 3: Macroeconomic Indicators and Energy Price Changes
Price level' GDP(% chnnac) (0/o chan )4
County Rcfiorm Fucl Price I II III Rcvcnuc I H mchange ex3 impact %/e2
Malaysia 1984485 Diescl 80.0 4.9 2.1 1.1 2 6.3 3.3 3.3Kcrosenc 69.5
Indonesia 1982-85 Diescl 21.8 9.0 9.2 9.6 18 3.5 3.9 5.4Kcrosenc 23.0
Ghana 1983-87 'Dicscl 4.0 82.4 99.6 32.3 38 -5.1 4.0 5.5Kerosenc 3.0
Zimbabwe 1983-84 Dicsd 39.7 11.3 13.2 8.1 6 5.7 0.7 7.6Kerosene
Colombia 1985-88 Dicscl 36.22 -12.6 13.7 n.a. 4 2.5 4.8 3.9Kerosene
Turkey 1987-88 Diesel 33.3 45.5 56.6 61.5 20 6.9 2.6 8.2Kerosene 23.5
LI. = missing data.Note: 1. Prie leve figures refcr to average amual gowth rates (percent) of Consumer Price Index CPI for three different
periods: I = 2 years preceding the price reform, II = During the reform, and II = 2 years following the refomL2. Revenue impacts of the pnc- refoam arc for the last year of thc reform period and reported as a percent of total central
govemment revenues for the orrcsponding year. Dis. = Dicsel, Kcr.= Kerosene and Elec. = Electricity.3. Nominl prices in the year prior to the begiuming of the reform (base year) exprcssed as a permcntage ofte price in
dhe last year of 'he reform.4. Outp figws rcfir to avea aumal gowth rates (percent) of GDP for three different periods: I = 2 years preceding
the price refaom, II = During the reforn, and m = 2 years following the refrm.
caused by drought Another important factor was an increase in wages, which cannot be traced directly
to the energy prices increase. Rising wages were the result of govrnment policy either to correct the
racialy-based wage stncture (Zimbabwe) or to obtain relief from erosion of real wages, which occurred
due to economic conditions prior to the period of energy price reforms (Turkey). An increase in eneW
prices could have added to -hese inflationazy conditions. However, there is hardly any evidence in the
analysis to support the hypothesis of energy price increases triggering inflation.
In the early 1980s ihe domestic prices of diesel, kerosene and electric were subsidized in most
of the countries analyzed Toward the end of the 1980s the domestic price increases, combined with a

7
seerl fl in intentionl oil prices, left domesfic diesel and kerosene pricks above borde prices. lu
only exception was Indonesia, whor domestic prices for diesel and kerosene reman below borderprices for mos of the 1980s Dospite the price Increases, domestic prices for electricity rmained blow
the avoep incrmtal cost of power systom expansion in most of these countries durg th Peiod
analyzed.For tr countrie, gowth rafts (GDP Change 1I were higher during the time of nrg price
increases as compared to the preceding two years (GDP change 1), but not for Mayia, Turkey And
Zimbabwe. For Maysi Turkey and Zimbabwe the fall in growth rates was temporay, and during th
period that followed the price reforms they quickly saw a recovery in output (GDP chan M). Asmentioned eaier, is was a period of economic policy reforms in most of these countries and recovery
in aggregate output was a result of aff these combined policy changes. To the exent tht onergy price
ires led to afal in subsidies and thereby lower taxe and distordons in prices of ohr input these
complementary changes contributed to the generd economic recovely in theo couni.

8
1. ENERGY PRICE INCREASES I[N DEVELOPING COUNTRIES
Background
Economic perfomance in developing countries during the last two decades can be divided into the decade
of shocks (1970s) and the decade of adjustment (1980s). Extemal shocks affecting these countries were
the commodity boom and the first oil price shock during the early 1970s, a rise in interest rates staring late
in 1978 followed by a slowdowm in ihe world economy after 1978, a second oil price hike in 1978-80 and
softening of oil and other primary commodity prices during the early 1980s. At the same time natural
disasters and domestic policies created an urgent need for internal adjustment programs, which were
implemented by country governments initially in collaboration with the IMF and later also with ihe World
Banl.
Producdon and distribudon of commercial energy, particularly electricity, in developing countries
has often been reserved for the public sector. Diverse arguments based on efficiency and equity have been
used to explain the highly centralized organization of ihe sector, including the presence of increasing returns
in production and distrbution, the infiastructural role of the energy sector, and provision of energy to low-
income groups in the society, etc. Pricing of energy by the public sector has often been held below average
supply costs. Although the need for increasing domestic energy prices was emphasized in adjustment
policies' undertaken during the 1980s, the actual implementation was relatively slow, paricularly for
electricity and kerosene.
Average taiff levels (in constant USS) for electricity in developing countries were relatively stable
during the period 1979-83. During the next four years (1983-87) average electricity tarffs fell by around
35 percent, although there was no change in cost, thereby reaching a level of rouy half the average
incremental costs of power system expansion for these countries.3 Figure 1.1 shows the development in
average electricity taiffs from 1980 to 1988 for developing countries and the OECD. Incremental supply
costs for 1987 are also shown in the figure.
' World Ban (1990), Su_may Data Sheets of 1987 Power and Commercial Energy Statistics for 100 DeelopingCountri_, Energy Seris Paper No. 23, lindusty and Energy Depqtment Woding Paper, Washington, D.C.
2 Blal, B. (1981), Stucturl Adjustmnt Policies in Developing Economies, World Bak Staff Working PaperNo. 464, Mm World Bank, Washington, D.C.
2 Se. World Bak (1990): Review of Electricity Tariffs in Developing Countries During the 1980., Eergy SeraPaper No. 32, Industry mu nerg Dep_utnet, Wasington, D.C.

9
Rgure J.1: 7end in Awerage Electricdy Tariffs of Developing Countries and OECD Countries, 1980-8
7 69
6
2
0198D 1981 19Z 198 1964 196 196 1967 196
I I Develaplig OE Co_tia -_ AvOgCcuM kw= Cco
Alhough domestic petroleum product pricing policies vaied across products and coutie,
dzation was not as w _despred as for deecicity. Diesel subsidies wero used in oil exporting contie
Kersene subsies oocurred in oil expot g ad pording counries. Gasoline, onthe contay, ws tae
in anumber ofcounes In geera level of subsidies wer much higer durmg toh early 196s tha
afier 1985. Toward the end of he 19830s most of t oil exporting counties bad subdies on petrlum
produc. Figure 1.2 shows the avep diffece (as a pecentage of domestic pnce) betwom domestic
and border prices for kerosene for a selected group of coims
Two ma ftos contied towards the fall in subsidy leves in dte latter part of 1980s: a fall in
th inenational ofl prices (Le., a fal in the opporauity costs of petroleum) am it d cm in
domestic prices For most of the countries, te fall in internationa ol pnces during th 1930t led to
dnges im subs* levels. although administed piincrases designed to bring domesic prices n ine
wit the border prices were also prsued in a few countries.5
' So 1.1 for dimel ndl psob. pr distodiam.
S g - 1.2 to 1.4 fw wdupwkt in pirm pmdmt pr. uinutbcea ctu.

10
F;lgw 1.2 aag.pDhfferew sbewnDomesicond BorderPricesfor Kerosene in Selected Countries,&dSub (-). Tax (+)
10000 *
iaom
4000
20MD
-60m
-80m
Ca~~~~~~~~0
Tepolicy changes tha led to an increase in domestic energNy prices have been controverial
Ppmt of£prcincreaes point lo the benefits of domestic resource mobilization in the public secor
(ruUg an rduced fisca and curent accountdeficits) and improvred interna resource aellocaion. Criticsar oncre abut neatve impacts suc as the risk of output losses, inflation, loss oinernaioinal
_ ,ptiiaiu undesirble effcts on the welfar of the poor, and in som cueos envirnmeta
Whe pcs ae lass thn he maria costs of Rsupply an increase in price would reduce distortoin the use of energy, i desiale outcome on grounds of efficiency. In practie~, equity considertos mn
enrypricig have also been an imortn facstor for policy makers. An eneg price icease c beexpected to reult in chngs in intepesnl distribuion of incom. Whte the price in_ae isprogese oreesve mn conseu_ce will deped on the structue of demand for energy ui tboprsec of othrwefr policies pusued at th time of adjustmnt Althouh there sen to be an
untcenngtecss o fa subsidies rslig fro onmergy ries te eiscito the welar _ueune, which mae the policy issue more complex.

11
Energy Price Changes: Survey and Methodology
Although the emphasis may differ across countries, the following range of objectives have
doninat energy pricing policies both in developed and developing countries:
* Economic growth and development* Equity considerations, such as Ihe provision of cheap energy to lower-income groups
Macroeonomic stabilizadon (to generare surplus in ihe public sector and influence exportsand imports to achieve intemal and extemal balance)
* Environmental protection.
The first two objectives have often been used as argmnents for maintaining low prices for energy inputs;
an implicit economic argument for such practice can be ihe presence of some positive exemalities ariig
fiom the provision of energy i c To what extent this is a valid argumert and fhse policies have
or have not contributed to the achievemert of these objectives is open to discussion. One of the reasons
quoted for low energy prices is that they promote industrial development Even if we consider industi
developmet as a goal in itselt low energy prices introduce a bias in favor of energy-intesve industies.
Given that enewy intensive industies such as metal-smelting paper, petrochemicals are aso capital-
intensive, tis pattem of development may not be the most appropriate for developing countries with
abundant labor resources.
In terms of equity, it is not cle that the poor benefit from energy subsidies. Gasoline subsidies
are not necessariy diely beneficial to the poor, as ownership of motor vehicles is relafively low amongst
tis gnWp6 One of the jusfificalions for a subsidy on diesel is *hre it benefits the poor to the extt it keeps
pubic trnsportation costs down. However, in this case, it could be more appropriate to directly subsidize
public transportation res rather ian diesel given that such distortions have led to increased and often
ineffct dieszation of industri equpment and automobiles in these countries. A subsidy for kerosene
may bejustified to the extent tat it is used for cooking and lighting by poorer households. However, it is
agan not clear that hese subsidies affect their target groups. Kerosene is an income deastic good and the
bulk of household kerosene consumtion in developing countries is coentatmed in urban areas where
income level are bigher. Consequently a major portion of ihe benefits of these subsidies might accrue to
'Excet to t exta psoline is used for pmbiec tanpata Howeve, it nay be m ti tt TWAj_m t filu im pubrie _fpoution is diesel.

12
urban middle-income groups.7 In cases where kerosene subsidies are combined with rationing, the urban
poor might also not benefit as rationing schemes often require a permanent placo of residence, a
requirement that disqualifies a large portion of urban poor living in unauthorized slums.
The last two objectives are of more recent origin. The macroecononic instability experienced in
the early 1980s and the need for austerity in public expenditures in these developing countries brought
energy pricing polices under scrutiny. Subsidized prices have often been identified as an important source
of deficits in public enterprises in the energy sector. Energy price increases are expected to improve the
finmcial position of these enterprises. However, the extent of these effects also depend on the wage and
employment policies of these public enterprises.
The environentall sensitive nature of energy adds another dimension to pricing policies The
relationship between energy use and environmental degradation has become a subject of debate in recent
years. However, how energy pricing policy can be used to attain environmental objectives may be quite
ambiguous, and depend on the nature of environmental problems. In the developed countries, the cunrent
focus is on the global problem ofgreen-house gases and reduction of carbon dioxide emissions originating
from he conbustion offossil fuels. The energy pricing implication of this policy is an upward adjustment
in energy prices, especially for fossil fuels. In the developing comtries, the current envinme focus
is more often the local problem of deforestation and soil erosion. In this context, a substantia increase in
domestic pnices of commerca energy mwybe considered undesirable to the extent it generates substitution
of commerci energy by non-commercial energy such as firewood, thereby furdter accelerating
deforestation and soil erosion. Given that deforestation contributes to global warming, the implications of
enviromnental issues for energy pricing policies are quite complex.
The ieratur analyzing the impacts of energy price changes falls into two groups of stxdies. One
group analyzes intenational oil price shocks during the 1970s and iheir economic impacts on both ihe
OECD and developing countries, although the literature on developing countries is limited. The second
group analyzes economic adjustment policies in developing coutries during the 1980s. Few of them
directly address issues related to domestic energy price changes. However, to the extent ese studies
7 DU& for Ilanieg ineate. thas t poord 20 pnt of Xth popai rciVe lo da 10 of thekwmsui..

13
address the role of public sector pricing in adjustment policies, their conclusions are also relevant for the
analysis of energy price changes.'
Methodologies of analysis used in these studies fall into three subgroups. The first subgroup is
based on taditional demand-oriented macroeconometric models9 involving structural systems comprising
behavioral equations and identities to determine aggregate output and price level through interaction of
aggregate demand and supply. While differing in the degree of disaggregation of demand and supply and
the extent of industrial and market detail and functional specifications of behavioral relationships, the main
focus is on anabling the impacts on GNP of sudden increases in intemnational oil prices. A major limitation
of these studies is the treatment of the supply side effects of the energy price changes. The second subgroup
consists of energy-economy models belonging to Computable General Equilibrium (CGE) models based
tially on general equilibrium theory and neoclassical theory of economic growth." The emphasis in
CGE studies is to simulate the efrects on relative prices, resource allocation and welfare consequences of
energy policy dcanges Lastly, there are some studies that analyze the energy price increase on a sectoral
or industry basis within a partial equilibrium fimework.
A Framework
Economic impacts of domestic energy price increases can be categorized into two groups: (1)
direct partial impacts of price increases on producers and consumers, and (2) overall macroeconomic
inmpacts on price level, govenment revues and output To analyze both the micro and macro impacts and
draw policy conclusions, it is important that the framework be sufficiently disaggregated to account for
differences in the demand structures of industrial and household consumers of energy. It should also be
based on a consistet economywide fiamework although not necessarily an economywide modeL to allow
for an analysis of macro impacts.
' Ainrad, P. and Grnis, W. (194: Macoonomic and Diriutionl Impficatis of Secord PolicyInteein. An Applicatin to hailand. World Bak Staff Woring Papers No. 627, Washington, D.C.; Glhw,N. amd S. lhiri. (1984): Short-nn Energy Economy Ieactions in Egypt, World Dovelopment, Val. 12, pIp 799-820; Panh, L d H. Sarar, (1990): Rosoum= Mobiliztioa through Administerd Prioes in an Endian CGB, inTaylor, L. ad. (1990) Socially Relevant Policy Analysis, Manssast, The Mrr Press: World Baik (1983)Idoesi Selcted isse of Ener Pcing, Repoit No. 4285-IND, Wahigton, D.C.
Hichkana B.G., and othe (1987): oom Ihpactp of EneWr Shoch, A _sterdam, North-Holl
"0 See Bergman, L. (1988): Enery Policy Modelling; A Survey of General Eqllbrnm Approchs, Joumnl ofPolicy Modeling, Vol 10, pp. 377400.

14
Accordingly, each countly analysis in this report is organized as follows:
Outline of the general economic enviromnent of the country prior to and during the energyprice policy reform.Analysis of the direct parTial-impacts on costs, output and energy consumption in theindustrial sector and consumption and welfare of household consumers.Analysis of overall macroeconomic impacts on aggregate price level, govemmentrevenues, subsidy levels and output.
Such an analysis for each country requires detailed information about the structure of demnd for
different categories of enerEy consumers, as well as economic policies and structural constraints. Because
this information was not always available for all the countries analyzed, the degree of detai in the case
studies will vary.
E:nergy Demand in the Industrial Sector
The industial sector consists of a large number of firms with different production structures
producing a variety of goods. To analyze the impact of energy price changes we need to operate at a
meaningful level of disaron. An additional complexity in establishing a cause and effect relationship
arises due to the fact that energy policy is only one element oftthe economic environment facing a finm The
impact of energy price changes will depend on how the other elements, for example industrial poley and
trade policies, are adjusted.
There are various analytical frameworks to analyze the demand for energy by commercial users,
such as the industrial sector. Assuming perfect competition in the goods and factor markets and cost
minimization behavior on the part of the firm, which is subject to constant returns to scale in production,
demand for energy by an industrial firm can be considered as a two-stage optimization process. Realizing
that energy is a composite good comprised of various fuels, the firm in ihe first stage chooses the fuel-mix
dtht minimizes de cost of prviding a unit of aggregate energy input In the second stage the frm chooses
te factor-mix, i.e., labor, capital and energy (assuniing three inputs) to minimize the cost of producing a
wit of output Since, in the short-run, the capital stock is given, the decision at this stage is to detemine
the mix of energy and labor. In the medium- and long-run the firm could adjust its stock of capital in
ergy-usig equipment and thereby have more flexibility in adjusting its energy use. Thus, the impact of

15
energy price chmges on the fim will depend on both the interfiel substitution possibilities and the
possibilites of substituton between energy and other priry factors of production"
EAw& Demad ofthe Hourehold Sector
Households usenery for lgt cooldg healn cooling refrigan, washing etc Demand
is depedent on the stock of enery-using appliances in of the household, their pefeences for the above
sic mnd o nernn-ee gwods, and income In the short-run, it is reasonable to assume tht tho stock
of appli.nces is fixed and dws the impact of an increase in energy price on the household demand for
energy is detrmined by a change in the rate of use of tih exsting stock of appliances (depending on
prences between aer and non-energy goods, and income). In the long-run, households can adjust
heir stock of appliances. Tbe main implications of ftis infle7ibility in the adjustnt of applianc stoc
and rigidity of preferec for household energy demand is that in the short-mn the impact of an energy
price incre on household demand woud be lower as compared to the long-tem. when both now
appliances can be acquired and preferences may change.' Ths implies that the wdfare cost of a
pice ncreasewod be reduced infhe long-nm, when houseolds have a chance to fiuly adjust in respos
to the cne in prices.
MAcroeconmic In pacf
An increase in domestic energy prices can be expected to shift cost stuctres in h user sectors
ad theby the conmer pr level. Depending on the response of nomina wages to an raem i
coumer pnre leve, an energy price crease may spread throughout the economy and icrease th
general price IekV3 An increase in energy piices chged by public enteprises, provided it leas to an
iceae in he opeaig suues of tese finns, shoud also resut in lower fiscal subsidies To the tnt
lowe subsdies resuilt lower levels of taation for other inputs, the inflationuy impact of an eneY price
increse would benmodea Eney subsidies are ofen finaced through state borrowng firom th cent
bak In this case, higher energy prices that reduce subsidies and fiscal deficits of th public enterpi
"For a gmel f _imuafio the ne of th fim to an anew price izmm, am ax 1.5.
F For a gmw. fonmlijof debs hun3o'l respa to an mrgy pace incea amam 1.6.
"Fora ydir wl wokadaluuig - ip - -- inpof fdomealcnmrypri oI g s.eWoidB*k(1983): I i, Suatod dI. of 13.p Pi Polii, VL I, }lpatn No. 4285-DID, pp. 49-52,W=ui,gtmu D.C.

16
would lead to less money creation. Thus, the aggregate impact of raising energy prices on general price
levd will depend on both the e£ects on cost-push inflation and lower inflation due to less money creation.
The net effect remains ambiguous" and will depend on the structural and policy variables in each case
study.
The impact of an increase in domestic energy prices on govemment revenues will depend on the
effect of lhe price increase on the operating surplus of the energy sector enterprises and the extent to which
the govemment succeeds in collecdng this surplujs. The former depends on the wage policies of these
enterises, the effeveness of the govemnment budgetary control, etc., whereas the latter depends on the
tsfer mehnms (tx policy, royalty agreements. etc.) applicable to ihese enterprises. At one extreme,
if an imcrease in revenues from price changes is completely offset by higher wage bills, one might not
observe any improvenent in ihe operating surpluses and, most likely, no improvement in govenmment
revuws. At te other extreme, if govrment adopts restrctive wage policies and implements an effective
budgetay control of these enterprises it may be able to obtain a large portion of the increase in revenues
generated by price increases. To calculate the exact revenue effects of energy price increases requires a
deiled anabsis of the financial statements of the energy sector enterprises, which is beyond the scope of
this study. However, the revenue impact for a given price reform can be estimated as the difference
between the estimated net revenues in that year and the hypothetical level of net revenues in the same
period had the reforms not been implemented.'5 For petroleum products, net revenues are defined as ihe
difference between gross sales minus the domestic production costs (border prices) for net oil-eorting
(imporing) counties For the electricity sector, in the absence of reliable estimates of domestic production
costs, only changes in gross revenues are reported. To give an idea of the dimension of these revenue
effects, the sane are also compared with total govermment revenues for the same year.
PolicyMplementadon: The 7lme Path
Policymkes may contemplate altemative time paths for implementation of policy changes. In the
context of energy price policies, some of the altenaives are a one-shot adjustment followed by prices
which could be either const or fluctuate in line with, for example, border prices. A gradual increase
spread over a period of time is another altemative.
'4See Taylor, L (1991): Vaieties of Stabliain Experience, Clarendon, Oxford.
' See mnx 1.7 fiw dei.

17
lhe policy of abmpt adjustment followed by either a period of constant or fluctuating prices has
importan economic consequences. Given the derived demand nature of the energy inputs and partial
adjusun0t in stock of energy-using app1iances, abrupt changes in energy prices can lead to higher short-nm
adjusunent costs for usems. Equaly important is the decision concerning policies to be followed after such
an iniial adjustment. Governments could follow a "crawling-pegN and undertake periodic adjustments or
it could continualy adjust prices in line with the border prices. In the latter case, there are again two
altematives: energy prices remain admistered or the govenmnent deregulates and resorts to market-
determined energy prices Adjustment costs imposed by such policies will also depend on the uncertainty
in intemrational oil prices. In the case of wide fluctuations in intemational prices, policies where domestic
prices adjust m lne wih inmteationa prices could limt govemmenifs ability to shelter the domestic market
from the intenational mar, thereby mcreasing unctty for ivestment decisions. Simlarly, consumers
may delay sbUdng out of their energy nffcifent capital stock A price policy thst involves gradual change
may m mize adjustment costs or it may also dely adjustnent towards energy efficient technology. Thereis also te risk of speculative boarding especially of fossil fuels, by the private sector. In the present
conte4 however, enear pnce increases m developing counties durmg the last decade have been primarily
motivated by urgent macroeconomic stabilization needs in these coutries in which case one-shot
adjusument is perhaps the only altemative.

18
Anne 1.1
Average Diferences Between Domestic and Border Prices for Diesel In Selected Countries.Subsidy (-), Tax (+)
200.00 -
150.00 D
-50.00
-100.00*
Avage Differenes Between Domestic and Border Prcesjfr Gasoline In Selected Couwnes,Subsidy (-), Tax (+)
350.00-
300.00 -
250.00-
200.00-
-50.00
0 * *90 Ca
jE1980-84 0 1985-8

19
Annex 1.2
Domestic Nominal Kerosene Prices Including Taxes to End-users(local currencyper liter)
County 1980 1981 1982 1983 1984 1985 1986 1987 1988 1989
Colombia 9.04 11.67 14.51 17.79 17.79 23A0 28.87 35.62 45.64 58.47
Ghana 0.92 1.32 1.20 2.90 7.70 11.95 19.50 24.20 37.40 41.80
bIdia 1.54 1.64 1.81 1.80 1.86 2.03 2.24 2.26 2.24 2.23
Indonesia 37.98 37.98 60.11 99.87 134.05 165.22 165.22 164.81 164.45 166.72
Malaysia 0.35 0.46 0.46 0.46 0.62 0.66 0.54 0.53 0.68 0.67
MA"OrCO 1.85 1.72 2.11 2.42 2.30 3.12 2.26 1.64 3.10 3.11
Pakidstn 2.S1 2.75 2.74 2.73 2.45 3.29 3.01 3.01 2.98 3.00
Philippines 2.40 3.13 3.12 3.44 5.04 5.78 4.81 5.28 3.72 4.98
Thailand 5.68 6.12 6.14 6.15 4.98 6.20 6.10 6.13 4.97 6.14
Turkey 0.00 36.77 57.75 69.03 98.98 136.04 0.00 194.20 579.59 1209.12
Zimbabwe 0.29 0.30 0.31 0.35 0.36 0.36 0.35 0.59 0.59 0.62
Domestic Real Kerosene Prices Including Taxes to End-users(local 1986 constant currencyper liter)
County 1980 1981 1982 1983 1984 1985 1986 1987 1988 1989
Colombia 32.63 33.64 33.74 33.76 27.83 29.66 28.87 28.25 36.42 46.25
Ghana 10.07 8.3 5.96 6.61 13.18 16.86 19.5 17.22 19.73 16.9
India 2.41 2.35 2.42 2.24 2.16 2.20 2.24 2.08 2.08 2.07
Indonesia 70.01 57.59 83.30 124.94 148.83 169.44 165.22 152.75 147.44 154.09
Mldysia 0.39 0.50 OA9 0.47 0.60 0.63 0.54 0.54 0.65 0.64
Morocco 3.03 2.58 2.91 3.12 2.74 3.42 2.26 1.53 2.97 2.99
Pakistan 3.87 3.87 3.52 3.27 2.73 3.42 3.01 2.89 2.79 2.75
Philippins 6.36 7.30 6.64 6.65 7A5 6.36 4.81 5.07 3.43 4.52
Thailand 7.18 7.00 6.62 6.40 5.10 6.32 6.10 5.93 4.72 5.78
Turkey 0.00 180.07 209.12 194.11 199.91 187.52 0.00 143.96 380.30 730.49
Zinmxawe 0.55 0.50 OA6 0.44 0.40 0.39 0.35 0.53 0.53 0.58

20
Border Pricesfor Kerosene(local curencyper liter)
CXuhy 1980 1981 1982 1983 1984 1985 1986 1987 1988 1989
Columbia 13.27 14.80 17.06 18.97 24.11 31.30 27.08 33.78 40.78 56.50
Gmn.s S.89 5.75 5.6 5.04 8.89 12.47 13.33 23.76 30.27 41.76
ndia 1.94 2.66 2.90 2.97 2.61 2.81 1.82 1.80 2.23 2.59
Indonsia 160.S1 19S.56 195.S3 261A3 233.29 240.71 138.99 211.17 223.18 246.20
Maloayd 0.6 0.71 0.69 0.67 0.53 0.54 0.28 0.32 0.35 0.38
&3OOcO. 0.96 1.59 1.85 2.09 2.03 2.29 1.32 1.16 1.26 1.32
Pakista 2.42 3.04 3.64 3.85 3.23 3.45 2.33 2.39 2.70 2.97
Philppins 1.92 2AS 2.52 3.20 3.80 4.03 221 2.64 2.79 3.02
Thuailnd S.24 6.75 6.80 6.61 5.38 5.89 2.85 3.30 3.35 3.57
aIbty 20.09 36.56 53.30 71.56 92.70 129.17 10.08 132.89 248.56 367.30
Zinbabwe 0.17 0.22 0.24 0.31 0.31 0.39 0.26 0.24 0.30 0.36
Shadow exhag rae for 1980 through 1983 assuned to be IUSS-20 cedis, official exchange ratesthereafter.

21
Annex 1.3
Domestic Nominal Diesel Prices Including Taxes to End-users(local currency per liter)
Counby 1980 1981 1982 1983 1984 1985 1986 1987 1988 1989
Colombia 9.04 11.67 14.51 17.79 19.93 28.4S 3S.53 44.36 49.41 SS.03
Ghana 0.47 1.06 1.0 2.81 .34 11.62 20.03 28.24 36.96 42.49
India 2.28 2.67 3.02 3.22 3.27 3.46 3.48 3.51 3.S1 3.48
Indoncsia 44.58 52.84 85.87 144.25 220.29 242.32 200.26 200.45 200.99 200.07
Mlaysia 0.38 0.46 0.46 0.47 0.58 0.59 0.46 0.46 0.53 0.57
Morocco 1.85 2.56 3.27 2.74 2.63 3.45 3.45 3.45 3.44 3AS
Pkidstan 2.82 3.06 3.45 4.01 3.60 4.26 3.83 3.84 3.86 3.4
Philppines 2.40 3.11 3.12 3.44 5.23 5.73 4.76 S.23 3.72 4.98
Thailand 6.54 7.40 7A1 7.00 5.65 6.69 6.31 6.33 6.10 6.8
Turky 36.89 35.80 55.99 71.93 100.17 129.85 188.08 272.42 565S.22 1184.69
Zimbabwe 0.34 0.34 0.35 O.S0 O.S1 O.S3 0.54 0.63 0.63 0.63
Domestic Real Diesel Prices Including Taxes to End-users(local 1986 constant currencyper liter)
Counhy 1980 1981 1982 1983 1984 198S 1986 197 1988 1989
Colombia 32.63 33.64 33.74 33.76 31.17 36.06 35.53 35.18 39.43 433
Ghana 5.S 6.66 4.96 6.40 14.27 16.40 20.03 20.1 19.S 17.8
India 3.57 3.83 4.04 4.01 3.79 3.76 3A8 3.23 3.26 323
Indonesia 82.19 80.12 119.01 180.47 244.58 248.51 200.26 185.78 180.20 184.91
Maaysia 0.43 0.50 0.49 0.48 0.56 0.56 0.46 0.47 0.51 05S
Morocco 3.03 3.83 4.51 3.52 3.13 3.78 3.45 3.21 3.31 3.32
Pakistan 4.36 4.31 4.43 4.81 4.01 4.43 3.93 3.69 3.61 3.S2
Philippines 6.36 7.25 6.64 6.65 7.73 6.30 4.76 5.01 3.43 452
ThIand 8.28 8.46 7.99 7.28 S.78 63.82 631 6.12 5.79 5.72
Turkey 311.27 175.20 202.80 202.27 20232 179.00 188.08 201.5 370.37 71S.74
Zinbabwe 0.65 0.58 0.52 0.63 0.57 0.58 0.54 0.56 0.57 059

22
Border Prices for Diesel(local currency per liter)
Country 1980 1981 1982 1983 1984 1985 1986 1987 1988 1989
Colcmbia 11.27 13.44 15.63 17.43 23.10 30.13 24.90 31.99 37.87 54.62
GhanaO 5.09 5.24 5.16 4.7 8.56 12.05 12.37 22.61 28.34 40.51
Maia 1.84 2.44 2.69 2.74 2.49 2.61 1.58 1.76 2.09 2.28
Inuocsia 149.69 178.32 184.10 245.20 203.22 217.09 133.69 205.69 228.44 251.45
Mdaysia 0.52 0.65 0.65 0.63 0.46 OA9 0.27 0.32 0.36 0.38
Morocco 0.91 1.46 1.71 1.93 1.93 2.12 1.14 1.13 1.19 1.16
Pakisn 2.29 2.79 3.37 3.56 3.08 3.20 2.02 2.33 2.54 2.62
Philippius 1.79 2.23 2.38 3.00 3.31 3.64 2.12 2.57 2.86 3.09
Thaland 4.89 6.16 6.40 6.20 4.68 5.31 2.74 3.22 3.43 3.65
Tuukey 19.18 33.80 49.68 66.63 88.96 121.09 97.48 130.35 236.63 329.86
Zimbabwe 0.16 0.21 0.23 0.29 0.29 0.36 0.23 0.24 0.28 32
*Shadow exchange rate for 1980 through 1983 assumed to be IUS$20 cedis, official exchange ratesthereafter.

23
Ann=e IA
Domestic Nominal Gasoline Prices Including Taxes to End-users(ocal crny per lIter)
C tnty 1980 1981 1982 1983 1984 1985 1986 1987 1988 1999
Cokwubia 11.18 13.84 16.86 20.11 20.16 32.13 38.60 46.37 63.99 67.64
Oahna 1.66 2.85 2.49 4.84 12.32 19.43 30.8 39.6 SO.59 S9.5
Indis 5.28 5.68 6.24 6.29 6.42 7.29 7.48 7.4 853 8.56
Indonuja 219.63 219.63 360.63 399.47 400.53 440.58 44058 445.44 383.73 385.84
Malayia 0.90 1.08 1.08 1.03 1.06 1.14 0.95 0.92 1.16 1.14
MGxoM 3.65 3.96 3.22 4.78 5.47 6.05 6.05 6.05 6.05 6OS
Pakitm 5.20 5.65 5.97 6.50 7.03 6.92 7.61 7.71 .61 55
ilippziu 4.49 5.26 5.26 5.47 8.27 8.90 6.92 7.50 5.81 7.05
Thalmd 9.78 11.89 13.42 12.60 11.68 11.68 890 893 843 8AS
TMIky 46.76 56.62 92.15 105.57 188.43 193.24 26624 366.82 780.77 1203.01
Zibabwe 0.48 0.58 0.69 0.95 1.00 1.03 1.16 1.16 1.16 1.16
Domestic Real Gasoline Prices Including Taxes to End-users(ocal 1986 cnstant currencper liter)
rCO=by 1980 1981 1982 1983 1984 1985 1986 1987 1988 1989
Colokbia 40.34 39.89 39.21 38.15 31.53 40.71 38.60 36.77 51.07 53.50
haa 1B18 17.92 1Z36 11.03 21.09 27.42 30.8 28.19 26.69 24.06
ndi& 8.28 8.14 8.34 7.82 7.44 7.91 7.48 6.88 7.93 7-94
1zulsia 404.88 333.03 499.83 499.76 444.69 451.84 440.58 412.85 344.02 356.60
Malayai 1.01 1.17 1.15 1.05 .2 1.08 0.95 0.94 1.11 1.10
M&OrCO S.98 5.93 4.45 6.16 6.52 6.3 6.05 5.62 5.81 5.82
Pakiun 8.03 7.97 7.68 7.78 7.83 720 7.61 7.42 8.06 737
FPpiz 11.88 12.27 11.18 1058 12.22 9.79 6.92 7.20 535 6.41
Thalnd 12.37 13.61 14.47 13.11 11.95 11.91 89 8.63 8.00 T
Turly 394.60 277.26 333.78 296.89 380.57 266.37 266.24 271.93 S12.30 726S80
Zimb 0.90 0.98 1.01 1.20 1.13 1.12 1.16 1.04 1.05 1.08

24
Border Pricesfor Gasoline
(local curency per liter)
Colzdry 1980 1981 1982 1983 1984 1985 1986 1987 1988 1989
Colombia 12.00 14.57 17.13 18.33 22.56 31.41 26.13 36.52 45.25 76.29
Ghmau* 5.31 5.67 5.6 4.87 8.32 12.47 12.83 25.51 33.21 55.57
India 2.00 2.52 2.68 2.76 2.79 2.97 1.70 1.90 2.49 3.18
Idonmsia 158.81 186.82 184.92 244.38 242.76 250.80 169.35 216.46 247.04 314.08
Malqayia 0.55 0.68 0.65 0.62 0.55 0.56 0.34 0.33 0.38 0.48
moromco 0.99 1.51 1.71 1.95 2.16 2.42 1.23 1.22 1.41 1.62
Pldaman 2.50 2.88 3.35 3.59 3.45 3.64 2.18 2.51 3.01 3.66
Philippnis 1.90 2.34 2.39 2.99 3.95 4.20 2.69 2.71 3.09 3.86
Thailand 5.19 6.45 6.43 6.18 5.S9 6.13 3.47 3.39 3.71 4.56
Turkcy 20.62 34.60 49.14 66.62 97.74 135.04 102.67 138.01 243.12 440.43
Zimbabwe 0.17 0.21 0.23 0.29 0.32 0.41 0.24 0.26 0.29 0.34
Not. *Shsw cIU xehangf ti for 1980 tuough 1983 assumed to be IUSS20 cfdis, offidal cxchange rats helcafr.Smm nten_mdEneAgy a(usuc) onataAdm'don, Depncut ofEneWahntonD.C. Doet
Petrom Ptode um FPsAooomieMvuwyUnt EnaegyDeprtnment, Ihe Word Bank, July 1984. Ghana Min5ty oflUcs andEnU,EnewgSafuicaDivion.

25
Annex 1.5 Input Price Increase and Input Demand
Defining the production function for x as
x = i(z 1, z2)
where z1 are the factor inputs employed in production of x. Assuming constant rems to scale in
pioduction of goodx, effect on demmad for an input z ofa unit change in input price wj can be represented
by the following relation
alog Zj = alog + alog h (w*w/)
alog Wj alog wi alog w;
The fst term on the RS, is ihe output effect which occurs if factor proportions were held constant and
output changed in response to a chamged output price resulting from a change in input pzice. he second
term on the RHUS. is the substitution effect (holding output constant), which occurs due to a change in
factor proportions in response to an increase in factor price.
For empirical purposes, it is oflen convenient to express the above equation in tems of price
elasticity of demand for output, substitution elasticity and input cost shares. For a two-input producto
function, the above relation can be expressed as
11= 2V3 - (l-V1)S1 2
where E11 is the own price elasticity of demand for input z1, v3 is the cost share of zl, v. is the price
elasticity of demand for output and
SM2= ,alOg(Z1 /* = _ alog(z0S11z
&0og(W1w2) alog(Aflf2)
is the direct elasiciy of substitution which measures the proportional change in z1 z asso ed wit a
ange in relative margina products of f1/f2, which are in the next instnce equal to relative pices wl1w2.
For a geral case, own and cross price elasticities of demand, otlier input prices holding constant
and output price adjusting can be written as:
ei = VA(eC,. + an)
Eii = Vj (F,, - O,J

26
whae by dediniion
iis th len elasticity of substtution
h above decomposi f price elasicity of demand for input into the output effect and a substution
affect shows that the effect on demand for an input of a unt increase in its price is dependent an threeimpon palate These are th imrtance ofthe iW in production, as represented by its coil sh
te p=ahs ofdmanifr dIpgo and lastly the ease wth which the input whose price inraescan be substitud by the odtr inputs; the ease of substitution being measured by the output constant
oLdcities of subsdtudon.

27
Annex 1.6 Energy Price Increase, Household Demand and Welfare
Define an individual demand function for good x as:
where p. is the price of good x and pi represents te price of other goods and y represents the income or
the budget level of the indvidual consumer.
Effect on demand forx of a unit increase in price of x can be represented by tie following relaton
also referred to as the Slutsly equation:
Bix ax axap = hap ju=u -x ay
where ihe fit tnm on the RHS. is the substitution effect, assuming that consumer is compensated such
that the utility is held at the same level as prior to tie price change, and tie second term is the income
effect
For empical purposes, it is often convenient to express the above equation in tenns of price and
icome dasdlices'6 and exeditur shares, Thus multiplying both sides of the above equation by pux and
the last term by y/y and rearranging tenns we can express the above as follows:
1Lup = I)'P - v., qy
where ij, is the own price elasticity, i'. is ihe substitution elasticity w.r.t. other goods, v. = x/y is the share
of consumers income spent on good x and nq is the income elasticity for good x.
lTus total impact of a price change on demand will depend on the sign of both price and income
elasiches. For a normal good, both income and substitution effects work in the same direction opposite
to that of ihe price change. For an inferior good, income and substitution effects work in tie opposite
m a31sticity of a dependan variale with respct to the independent variable is defined as tho perentage chanin do depemlat vaiable due to a 1 percent change in the independent variable assuming all other independentvaoiable remai unchanged. Thus own price elatiy measures the percentage chance m demand for x in resoeo toa I percent chang in pnce of good x; all other pices and income constant. Elticities are not ncessariy constmntead snce empirical estimat ae often based on observations involving small pnce chamges, these elasciti aefmidly viM for anayzing smal p chages.

28
direction, although fte substitution effect will dominate the income effect such ftat price and quantity
demanded will still move in the opposite direction.
Price Chonge and Welfare
B a BinaOOA +B.*C.a CaqiNWCsag Vainuam
Pt
II I ~~D
°1 Y- C XO E 1 O
(a) (b)
Panel a ilustats he change in welfare due to the change in prices. Let DD and DVD be the respective
ordiny demand curve and compensated demand curve' for good x These curves are derived from the
com in II utiuft maidmizdtionproblem illustated in panel b. At the initial price pO the consumer buys xO
and hastle ut ylevelu0 . Let pt be the new price and the consumer buys xi and has alower utflity level
ul. In cm the consumer income levels are adjusted to keep the consumer at the initial ufility level U6, the
consmer buys x, The monetay equivalent of ihe change in the utlity levels of the consumer due to
change in pric can be expressed by three different measures; namely the compensating variaion," the
equivalent variation" and the change in consumer surplus. Differences in these measures are mainly due
n? Caqimated dommu cum which i a locu of point which relats pns and quanties asu_mng tha imlevek m always adjustd to keep the consmer an the initial utility leveld .
'tonq_ufing Vaiaon (CV): Given the stalt of dho world S3. the CV is the compesaing chag in l budgetwhich is ceuy for enabling de conumer to wahieve the inii utility levl u% frm the actual now lvl ul.
1Epivaut Vaiatio (V): Give d sate of the world SO, the EV is the compensatg cag in the budgetwhich d m m he _rconume from ho ini ufility level ; to the actula chbnged level u,.

29
to the way in which the income effect of a change in price is measured. In case the income effect is small,
either because the share of income used on the good x is small and/or that the income elasticity of good
x is low, the ftree measures would be approximately identical. In general, the value of a change in
consumer surplus would always lie between the compensating variation and the equivalent variation
associated wi& a given pnce change In this report welfare effects of price increases are calculated in tenns
of changes in consumer surplus.
In panl a, the shaded area "A" approximates the hange in consumer surplus due a change in pice
and 1he value is defined by the integral
PiACS =I D(p)dp
PO
Calcuation ofthe chmge in consuner surplus in the above manner requires infonnation conceming the
funcional form oftie demand finction. However, most often we only have information about the nitial
an final pes and quanies or price elasticities Given this limited information, if we assume that the
demand funcion is linear witin the range x, and xD, the change in consumer surplus can be approximated
by the relation
ACS = x (p1- )+1/2 (xo-xl(p -Po)
The linearity assumption, for example, in panel a, would lead to an upward bias equal to area "B" in
estimating the change in consumer surplus. However, keeping in mind ihe uncertainty related to the true
fimctional fonn of the demand finction, this bias may not be serious.
Given a starting point xo, po, the welfire loss ACS is linear in the price elasticity and quadratic in
tie new price:
&CS - ab 1O) (I+5xsxPr PoPo
Ihe way in which the welfare loss depends on dte price elasticity can be illustrted, seeing c = 0
and c = 4 as proidgabigb andalow case forthe welfare loss: At a price lasficity of zero, the welfae
loss wil be proportiond to the price change. At a price elasticity of one, the welfare loss will be reduced
by 5 percent for a 10 percent price dhange, and by 50 percent for a 100 percent price change.

30
Anex 1.7 Revenue Effect
Net revenue effect of a given price reform is calculated as follows:
pLIPi~~~~~~~ S
*s C
3 \
Pb -- '------'--'-
' ' \D
Qn Qih Q
Net-revenue effect R for the reform is given by:
R = (P3-C)Q5 <-'C)Qh
Q = Qa(1 +1(Pb-P)/)
P and Q refers to the prices and quantities respectively. Subscripts b refers to the base year, i.e., the year
prior to ihe stifing year for the reform and subscript n refers to the ending year, iGe, ihe year when ihe
price efonn was completed. Quantity C? is the hypothetical quantity traded assuming no reform in prices
was implemetd C is the domesic supply cosft and inp is the price elasticity of demand. The net-revenue
effect of the price reform is equal to the difference between two terms: the first term on the RHS represents
net-revenues im period n given the price-increases implemented under the policy reform and the second
term repreents the hypotheical net revenues in the same period assuming no price reform was
unapiementd
For oil expatiug cmuirs a cot estimte of USS 20 per bmael of refined composit paotleam product is usedfiw eutug do ad mwvz ecfft. For oil impog cories, cost rfen to dbo border pice for relevvpirleam pro_tp Cost eatimtaes convued to local unrry using curent officia exch ae.

31
2. MAIAYSIA: DIESEL AND KEROSENE PRICE INCREASES 1954485
Entroduction
Malysia coons oft mainn pennula and the stats of Sarawak and Sabah on the island of Boneo.
The country, siuated in South-East Asia, has an equatorial climate and covers a total area of 329,293
square kilometers. Et has a total population of 17.9 million and GNP per capita of USS 2320, placing itamongst the middle-income countries in the region.21
The Economy
Malaysia is one of the faste growing economies with annual growth rates of per-capiincome
during the last decade averging over 5.2 percent per year. During the 1960s it was a traditional primary-
commodity supplier of rubber, tin, timber and palm oil and since the mid-1970s it has developed into a
diversified, net oil-exporting country. The average annual growth rate of GDP was 5 percent during the
1960s, when rubber and tin sectors contributed 40 percent of the GDP, accounting for 80 percent of the
export eamings and absobi 35 percent oft e work force. Ever since mdependence in 1957, the five-year
economic develop=mt plms bave emphasid diversif and of agricuft and miineral
secon and dave1opment of heexport-oriented asector, especially resource-based industries.
The results of this stategy have been quite encouragin& During the 1970s economic growth aveaged a
record high of 7.2 percent per year. Major changes during this period were a fail in te share of t.
agrculue sectorfrom 32 prcent in 1970 to 25 percent of GDP in 1979, expansion im the ufng
sector from 12 percent in 1970 to 19 percent in 1979, and an increase in the importance of the oil sector
share in export earings from 4 percent in 1970 to nearly 16 percent in 1979. Ihese achievemens were
a result of active govement policy and te commodity boom, both for oil and other primary c
outl in the 1optimistic development plans of the government for the 19B0s. Basic to these
expectations was the assumpton of a continued upward trend in comnmodity pnces.
MaLysian economic perfonnance during the 1980s has been determined by periods of shock and
adjustnent Two importan shocks began ihe decade. An extemr shock arose from the general decline in
wodd trade and a recession in ihe OECD, which also resulted in a deteriorafion in the extetna terms uf
trade An internal shock arose from the Malaysian governmenrts attempt, dunng 1980-84, to counter the
21 Do fir 199.

32
_endl bck by amitLous fiscd expansion involving high annual public sector deficits, which peaked at
MS11.3 bigion or neary 18 percnt of fte GDP in 1982. High economic growth of 7.3 percent was
mainaned during 1979484, while inflation peaced from a traditionally low average level of 4.9 percent
during 196540 to nealy 10 percent in 1981. The growing balance of payments deficit and debt burden
indicated the non-sustnability of govemment policy in the long-rn and a need for adjustment in the
economy. A domestic energy price hike during 1984-85, involving mainly diesel and kerosene, was one
of the measures implemd
The Energy Sector
Sructre ofErD Demand
Over 80 percent of total commercial energy demand is met by petroleum products. The other
important sources are eliectricity (13%) and coal (3%). Users of commercial energy in Malaysia are the
industrid ad trasport sector, each accounting for 40 percent of the total conunercial energy demmd.
Nefy 75 pert o ff industrial sector demand is met by petroleum products, ihe most important being
diesel and fuel oiL The other ue of commercial energy are households, which account for around 14
prcent 5 Electri provides over half of residential sector commercial energy needs, followet by
kerosee and LPG. Table 2.1 gives the structure of conunercidal energy demand.
EnergyPolicy and Prices
Given de dominance of petolewn product demand in the country, the emphasis of the Malaysian
Nation Energy Policy iniated m 1979 has been diverification and efficiency in the use of the fossil fuels
and hydro power. Efficient fuel switching in favor of natur gas and electricity has received high pnority
by poicymakes Energy pricing policy is considered an important instrument to diversi1f the fuel-nmx
Figure 2.1 shows the first major change in energy prices during 198445.
As figure 2.1 shows, he 198485 price anges targeted diesel and kerosene, the former being the
most importam fuel for th industi sector and the latter being used by the household sector. While
gasoline prc wee also inreased margialy in 1983, electricity prices continued to fall. The negative
I A sub_1tial bm of hauebolds prmmy eU doamn is mt by non-commercial surcos of enr suchu fad wood, -e _bus, dc.

33
trend in elecricity pices was dcrcteristic of the 1980s and shoud be seen in .elation to the ovall energmpolicy ofthe govenment to encourage fuel switching from oil to electricity and gas.
Table 2.1: Malaysta: Commercal Energy Demand, 1984 (000 tons oil equivalent)
Ridentialand Totd
commercial Industial Transport end use Percet
Naural gs 47 $7 - 134 2
Perleum (tota) 488 2,545 3,271 6,304 32LPG 155 33 - 188Gasoline - 33 1,892 1,925Keosene & aviaton ofiul 333 24 371 728Diesd - 1,B93 1,008 2,901Fuel oil - 528 - 34Refinega s - 34 - 34
Col&cd - 270 - 270 3
Elecicity 553 453 - 1,006 13
Total 1,088 3,35S 3,271 7,714 100
Soarer. Wod Bank (197
Figure 21: Malaysia: Enrgy Price Changes in Malaysia (percentage p.a. in ,eal twmns)
30%
25%
20%
15%
IL 10%IL
5%
0%
-5%
-10%1983 1984 1985
*0 O Eiectricity Qao Gooin Kosmnej

34
Effbcts ofEuery Prce Clma_u
Diesel Price Incrases 1984-85: 7he Indurtrial Sector
Given thWeimp c of diesel to the industrial sector, what was the impact of 1984-85 diesel price
increase for this sector? Industrial subsectors may differ both with respect to the importance of energy
inut in dw production process and the ease of substitution between energy and other priay inputs and
substituion between differet fuels Table 2.2 shows ihe structure and growti of production in the
industrial sector.
As table 22 shows, advities that dominate the Malaysian industrial sector are not pariculry
aw naDivec ITh tare of en cost in ihe total cost of production in dif&erent subsectors lies between
0.7-1.9 pern, with the exception of non-metallic mineral products such as ceramic and glass industries
whero energy cost share is 6.2 percent The impact of an increase in diesel prices on industral output
depends on the share of diesel in the cost of production, interfuel substitution possibilities and the demand
elasticity for output of these sectors. Given the low cost share, the effect of a diesel price increase on
industi output would be laively small. For sectors where output demand is inelastic the effect of the
pnce icrease on eutput would be fiurher reduced. The lack of a significant output loss during 1984, as
reported above, is to be expected. However, one observes a fail in mau g output during 1983,
mainy in wood and rubber products and non-metallic mineral products, subsectors where energy cost
hares Hlie between 1.4 and 6.2 percent
Table 2.2: Maladia Index ofIdustrial Production (1981 = 100) and Energy Cost Shares
Weight -1992 1983 1994 1985 1986 Enem cost share
Mining 304 105.4 132.0 165.4 166.4 192.4 -Manufacturing 65.7 103.6 112.6 125A 117.6 126.1 1.4
Food manufag 10.6 109.0 109.5 122.9 134.3 154.7 0.7Wood,woodandcorkproducts 5.5 108.4 121.4 99.9 89.0 90.1 1.9Industial chemicals 0.9 86.4 88.7 101.4 106.8 99.5 1.3Rubberppmduct 1.7 105.7 108.4 119.2 112.9 124.4 1.3No_uinctaicmidrproducts 3.5 94.8 99.9 111.3 99.4 58.2 6.2Electicl mac y 9.8 126.7 148.5 201.3 151.9 - 0.9Trnspotcquipmcnt 2.0 96.0 111.1 119.7 120.2 72.3 1.3
Nt Enow. cot are Is defined a. amd cds a perlag ofoupuL
35
What was the impact of diesel prce increase on demand for diesel in tho industrl sactorl This
would depend on both the size ofoutput loss, if any, and the ease of substitution fom diesel to other enorgy
inputs In th present context substitution possibilities ar primarily between diesel and electricity. Diesel
is used in powr genaon equipment and demand for diesel for back-up power-generation by industrial
consumes in developiug couries ofte arises due to the low reliability of electric power supplies. Erratic
power supples, due to nsufficient capacity during system peak hours, impose substantial outage costs in
ten of lss ofproduction, dm to dectic motors and loss of working hours for labor. Bwak-up power
geeraion is ofte used to improve the quality of electricity supplies for production. Producers substitute
diesel with elcticity during worldng shifts such that electricity-using production facilities ao operated
during off-peak hours. Also, substtution between diesel and electricity in the short- and medium-tenn
arises due to the ease of replacing smaR diesel engines with electric motors. In other words, one w^".;d
expelt greater substitution of electricity for diesel in response to an increase in diesel prices.
Closer observation of the data reveals that prior to the diesel price change in 1983. the share of
disel ir indhtria laery demand was over 65 percent and it feli to under 50 percent by the end of 1986.
In absolute Wrms, diesel consumption by the industrid sector between 1983 and 1986 fell by nearly 25
pecent as a result of a 28 percent increse in prices, implying an arc elasticity of -0.9. The relatively high
asicdty of demand is quite reasonable given the substtution possibilities between diesel and eleciricity.
During 1983-85, inerfel subsitution data in the industrial sector indicates that conmption and relative
shares of ectiity, natr gas and coadcoke have incrased, while consumption and the share of diesel
decreased. Fge 2.2 ilustates te dhanges in the structure of energy consumption in the industrial sector
during te 1980s
Th oer importat policy issue reated to increased diesel prices is the subsidy effect Figure 2.3
shows the difference betweem domestic and border prices (i- a percentage of domestic price) for diesel.
KerosenePriceIncreases J984-85: TheHousehold Sector
Oil and electricity are the main sources of commercad energy in the household sector. Ofthe oil
products, kerosene is wed most often, while more recentdy fi'! use of electricity and LPG has increased.
In the prest context, the inc in kerosene prices is directy relevant The two most important policy
issues related to the kerosene price icease in 1984-85 are welfare consequences for households of
changes in kerosene prices, and the subsidy effect of tiese price changes.

36
Flgure 2.2; Malaysia: Energy Consumption ofArndustrial Sector(share by we offel)
% Shuc90.80-
SO- - -
70.
50.40.30'. O. ~
'L, L1 L, LU hXJiih7do LiII, 1978 199 19W 1961 1962 1963 1964 1965 1986 1987 1968
|N.So EWFcarcty *CmaCo -Diued oFudOii -Tn Pet EPd
Flgure 2.3: Malaysia: Difference between Dome.tic and Border Pricesfor.Diesel,Subsidy (-), Tar (+)
ODm .
AdDDO
0 S I - 1 :-,--_ ,1 0,n a -20Dm -
JOOO .

37
To calculate welfare consequences (loss in consumer surplus) of an increase in kerosene prices for
different households, we need information concerning the share of energy in tota household expenditure.
Expenditure shares can vay across different groups of households depending on income level, urbanrural
nature, and geographic location. Thus, it is reasonable to expect the welfare effects of an energy price
increase to also vary across households. Table 2.3 gives the expenditure _hares of fiuel and power for
different categories of households.
Table 2.3: Malaysia: CurrentExpenditure Shares on Fuel and Power
Malay -Chinese ...JIdian_
Urban Rural Urban Rural Urban Rural Urban Rural
Employer 0.08 0.04 0.02 0.01 0.01 - 0.03 -
Employee 0.05 0.04 0.02 0.02 0.04 0.02 0.04 0.01
Self employed 0.01 0.03 0.02 0.02 0.02 0.01 -
Otds 0.06 0.02 0.09 0.02 0.03 0.06 -
Noe.The sh of consumption ecpendittres on energy varies acrss diffeent households. In genurl, he shaw are higher for urbnhouseholds u compared to nru areas. elizing that the income levels in the urban aeas ar higher than in the ral ueas, 1kdifferencas we obuyto expectations given that energy is a normal good with income elasticity less Un on. Hwever, the mast Iilycxplnation forhis outm lE in hc struche of energy consumption in rurl arms. A lag porlion oftthe eae nymion in nalarea is non-commenial al rwhosc value is likely to be understimated in the data underlying above caculatioL
Another important parameter for calcuating welfare effects is price elasdcity. In ihe absence of a
reliable ansis of residential demand for kerosene for Malaysia, we can draw some indicative esimates
for price elsicity by exniiring ihe actual response to the change in prices during the 1980s. Kerosene
conumpIon by the household sector between 1983 and 1985 fell by nearly 35 percent as a result of a 33
percent inrease in prices, implying an arc elasticity of -0.81. We can illusta the welfare effect of the
price incease as follows: in a household with a per capita consumption of 35 lite of kerosene per month
and a budget sbare for kemsene equal to 4 percent of the total household expenditure, the cnge in
consemer surplus due to the 1984-85 kerosene price increase would be appoximately equal to -1.3 percent
D Asmption in this scenrio awe that a low income urba houweold b lEimied 1to csouns of energy and an incom of aound MS 400 per month.

38
of total mondtly household expenditure. Assuming a price elasticity of zero, altematively, an upper bound
for the wlfare effect for the same household would be 1.5 percent.
The subsidJ effect of the increase in kerosene prices was quite substantial. Figure 2.4 shows the
domesfic and border pices for ksene for ihe penod 1980-89. As figure 2.4 shows, domestic pices were
below ite border prc prior to 1984, ihe fiast year of the price reform. From 1984 onward domestic prices
remained above border prices.
FIgure 2.4: Malaysia: Diferences between Domestic and Border.Pricesfor Kerosene.Subsidy (-), Tax (+)
loom
hcoeonomcmas
20Wo
0.00
dOml
f&actrdtrih areconomic l,pact s
What were the macroeconomic impacts of ihe domestic diesel and kerosene price incases? A
cucial fiaor de ng the n impact of an energy price hike is the effect on the conswner
price index (CPI) and subsequeny the response of nominal wage to an increase in CPL The 1983-44 price
irease is reflected in the CPI for rent, fuel and power for the same period. However, the change n CPI
is reatively low. is is largely due to ihe lack ofresponse to kerosene and diesel price changes in the most
important item he price offood. The lack of response of food prices to energy price changes indiates t
share of energy inputs to the agictural sector are low. The other uca factor deteming
macroeconomic effects is the response of wages to small changes in CPI during tis period. MTe period
1983347 has beem characteized by rsing wage rates and an increased share of wages in nation income

39
while shwe earned by capital was declining. The reason for these wage inreases has been the presence of
inflexible labor contcts negotiated during tight labor market conditions around 1983. The wage level of
new enarats did not increase On the contrazy, one observes a fill in marginal wage for new entrats from
19S4-M85. There is little evidence to link wage rises to the increase in energy prices. Table 2.4 gives
selected macroecononmc indicators for ihe Malaysian economy during 1982-87.
Table 2 4: Malaysia: Selected Macroeconomic Indicators, 1982-87 (M million)
1982 1983 1984 1985 1986 1987
GDP 50430 53582 57741 57150 57859 60595
(Percent growth) 5.9 6.3 7.8 -1.0 1.2 4.7
Total revenues 16690 18603 20805 21114 19518 18143
(Percent growth) - 11.5 11.8 1.5 -8% -7%
Change in Price Index (.p.a.)General price level 3.3 4.9 5.2 -1.5 -8.4 5.0CPI 5.8 3.7 3.9 0.32 0.7 1.5Food prices 8.26 0.91 3.7 -2.46 0.24 0.49Gross rent, fuel & power 6.28 6.53 7.5 4.2 1.58 0.57Transport & comnication 3.34 2.42 4.99 2.17 0.41 3.09
Using the estimate of price elasticity of demand for diesel equal to -0.9 and -0.81 for kerosene,
we can assess the revenue effect of ihe price increases. Had the energy price chanes not bee
implemened, the estimaed shorffa1l in revenues in 1985 due to ihe 1984-85 price increas would have
beem equivalent to SM million 398 or 2 percent of lhe government revenues in the same year. Moreover,
actual data for t period indicates a substnta reduction in deficits from 1983 onward and th by 198S
the fiscal deficit was reduced to SM million 5617 or 7.2 percent of G(P. Although tldis was a peiod of
adjus nt and change i govarmment reveue resulting from a number of fiscal poicies, an incras
domestic petroleun prices most lky woiud have been one source of reduction in Oh public sector
' See Wol Bank (1988), p 31-35.
2 Sm ox 1.7 for detaiat to cdaculai of Revem effect. Se abso dicsion of iiqpd in CbRL L
40
deficit his is furter subsnatd by the fact that profitability, measured as the rate of return after tax on
assets of de public entrprises (PEs) in the edmtive industries, recovered substandally during this period.
Becase ith group of PEs is doninated by PETRONAS, the state-owned oil company whose profits to a
lre etent are also dependent on domestc petroleum prices, dhanges in domestic oil product prices would
have contributed to better financial performance of this enterprise.'
Using 1983 as ihe base year, GDP growth peaked at 7.8 percent during 1984, ihe firstyear of the
energy price reforn. It was primarily th'e demand stimulus of the expansionary fiscal policy and the
property boom, which strted in the early 1980s, that sustained this growth. The negative side of the
expansionary fiscal policies and construction boom was a tight labor market with rising real wages and
appreciai of real echag rate, which led to a loss of intntional compettiveness in the mufacturng
sector. The recession in the following year was parily a result of these negative development and fiscal
polic es whih involved, for example, cutbacks in public investment resultng in a wfihdrawal of the
demand stiuus ofthe eary 1990s.
I overnm rweauso fimn pdolaum dividekda, icrse from MS 500 n in 1983 to over MM30 milin 1985.

41
Data Sources
Chun, Chin Pen, (1990): 'Energy for Sustainable Development. Te Case of Malysia". Paper presentedat the Bergen Energy Conference 1990, Center for Applied Research, Bergen.
Demezy, D. and L Demeiy, (1992): "Adjustment and Equity in Malaysa, Development Studies Center,OECD, Paris.
Pyatt, G. and L and JJ. Rowd, (1984): Improving Macrecononic Data Base. A SAM for Mal*ysia1970, World Bank Staff Worling paper No. 646, Table 3.9 pp. 297, The World BankWashington,D.C.
World Bank, (1987): Mlaysia Power Sector Issues and Options, Report No. 6466-MA, East Asia andPacific Regional Office, Washington, D.C.
World Bank (1988): Malaysia, Matching Risks and Reward in a Mixed Economy, Report No. 7203-MA,Vol. L Washington, D.C.
World Bak (1988). Malysia, Matching Risk and Reward in a Mixed Economy, Report No. 7208-MA,VooL HL Staistical Annex, Washingtn, D.C.
World Bank, (1992): World Development Reporl Washington, D.C.
World Bank, (1993): Stu on Impact of Energy Prices on ElectriciLy Twiffs amd Industi Developmentin Malaysia, Paper prepared for the Govemment of Malaysia, Economic Pl _ng Unit, KualaLumpur.

42
3. INDONESIA: DIESEL AND KEROSENE PRICE INCREASES 1982-85
Introduction
The Republic of Indonesia has an equatorial climate and covers a total area of 1,905 thousand square
kilometers, including half as archepelagic seas separating the islands. It has a total population of 178.2
million and GNP per capita of US$ 570, makdng it one of the most populous low-income countries in the
world.
The Economy
Since the establishment of the "New Order" Govemnment in 1967, Indonesia has developed from
a low-income country with per capita income of US$ 50 in 1967 to achieve annual growth rates of per
capita income during the last two decades averaging over 4.5 percent per year. Common objectives of
economic policies during 1967-84 were to achieve stability, growth and equity. These objectives were
outlined in a series of five-year plans (Repelitas), which were open to annual review. In these plans one
observes a transition from food production and infratructure in Repelita I to improvement in living
standards and equitable distribution in Repelita II, which ended in March 1979. The achievements during
the first two plans were impressive. The second plan period averaged a record 7.7 percent growth per year,
with sectoral growth rates averaging 4.6 percent for agriculture and 13 percent for industry. The
achievements during this period were a result of active goverment policies, as outlined in Repelita I and
'1, and the commodity boom for oil and other primary commodities.
The 1980s began with a favorable extema shock initiated by the second intemational oil price hike,
which led to a substantial increase in revenues from the oil sector. Indonesia's revenues from oil export
peaked at nearly US$ 16.5 billion in 1981-82. However, the subsequent faill in intemational oil prices led
to a continuous fall in oil revenues to 50 percent by 1985-86, or US$ 9 billion. The prices of other primary
exports also fell during this period.2 ' These adverse developments set in motion a number of adjustrnent
measures, one of them being an upward revision of domestic energy prices. Substantial domestic energy
price increases for petroleumn products (except gasoline) and electricity were implemented during 1982-85.
n Data for 1990.
9 In 1985. the World Bank index of 33 primazy commodities was 20 percent below its level in 1979-81 and reachedits lowest level in the 27 years since the index has been compiled.

43
The Energy Sector
Structure of Energy Demand
Primary energy consumption in Indonesia is sourced by commercial and non-commercial energy, where
the latter accounts for nearly 60 percent of final demand. The primary sources of commercial energy are
oil and gas, with mninor shares of electricity and solid fuels. Sectors using commercial energy include
industry (35%M/), transport (28%) and households (21%). Over 80 percent of industrial demand for
commercial energy is met by fuel oil and diesel. Another important source is natural gas. Together oil and
gas account for over 97 percent of industrial demand. There is a similar pattern of fuel demand by the
households, the dominant source being oil, maindy kerosene, with marginal contributions from gas and
electricity. Table 3.1 gives the structure of energy demand in Indonesia in 1982, when the first substantial
price increase was implemented.
Table 3.1: Indonesia: Primary Ewergy Consumptfion by Major Sectors, 1982(thousand of TOE)
Indonesia Solid Oil Gas Eectricity Non-conmn. Totafuels fuels
Total final consunption 131 21210 3694 479 38053 63565
Total industry 91 7712 917 238 1808 10765Iron and steel 18 - - - - 18Chemical/petrochem. 73 908 917 - - 1898Non-spec. industry 6804 - 238 1808 8849
TransportationAir 40 7192 - - - 7232Road - 256 - - - 256Rail - 6625 - - - 6625Intmationalnavigation 40 - - - - 40
- 311 - - - 311Other sectorsResidentia - 5431 2777 241 36245 44693Non-spec. other sect - 5408 29 - 36245 41682
- 23 2748 241 - 3011Non-enrgy uses - 875 - - - 875
Sowrce: IEA (1994).

44
Energy Policy and Prices
Domesfic energy prices in Indonesia in the early 1 980s were highly subsidized. Energy subsidies
financed by the budget or from special credit programs of the government of Indonesia during 1981-82
amounted to $2.3 billion, an increase of 40 percent over the previous year. The economic cost, i.e., the
difference between domestic and border prices of these subsidies was almost double the budgetary cost
and nearly 5.4 percent of GDP in the same year.29The first increase in domestic oil products and electricity
prices was implemented during 1982-85. This was motivated by the need to reduce the fiscal burden of
energy subsidies and to encourage efficient use of energy through pricing that reflected the scarcity of
energy resources. Figure 3.1 shows the changes in energy prices implemented during 1981-85.
Figure 3. 1: Energy Price Changes in Indonesia(percentage p.a in real terms)
60%
50%
40%
*30%
220%
10%
0%
-10%
-20%1981 1982 1983 1984 1985
Diesel O Electricity l GasOine Kerosene
'See World Banlk (1983).

45
Effects of Energy Price Changes
Diesel Price Increases 1982-85: 7he Industrial Sector
What was the impact of these price increases on the industrial sector? The output effect of an
increase in energy prices are determiined by energy costs in total cost of production and elasticity of demand
for output for different subsectors. Table 3.2 shows the share of energy in total costs and the index of
industrial production for a selected group of industries for the period 1981-88.
As table 3.2 shows, except for glass and glass products, energy cost shares are relatively low and
lie between 0.26 percent for tobacco and 2.93 percent for cement. The pattem of changes in output is as
expected, with highest output losses for industries with high shares of energy costs and lowest changes in
output for those with low energy cost shares. During the first year of the reform, output for glass and glass
products fell by nearly 20 percent For other industries the change in output varied between 0 and 11
percent. Food processing and the tobacco industiy did not experience any changes in output For the whole
period of the reform, the largest losses were observed for industies such as yam and thread, weaving mills
and plywood, a sub-group where energy costs constitute a relatively high share of total costs. Loss of
output in the motor vehicle industry as fuel costs increased during ihe period of pnce reform. is as expected.
However, the general index of production shows a gradual increase in aggregate output during the period
of energy price increases.
The effect of a price increase on demand for individual fuels occurs as a result of a reduction in
aggregate demand for energy, interfuel substitution generated by price increases and price elasficity of
demand for industial output The effect on aggregate demand for energy depends both on the output effect
of the energy price change and a substitution effect which occurs between energy and labor. Interfuel
substitution on the other hand will be determined by the extent to which relative fuel prices are altered.
Given that price changes during 1982-85 covered all petroleum products and electricity, interfuel
substitution should be less important. To get m idea about likely effects on energy consumption we may
draw upon the findings of an earlier World Bank study (1983), which analyzed energy price changes in
Indonesia. Vanous energy price scenarios were simulated and table 3.3 presents the results of two
scenarios.30 As expected, the change in energy consumption is much higher when wage rates are held
constant as compared to wage rates that are allowed to increase by 26 percent Moreover, the change in
The energy price change scenario underlying these simulations assume increases in product price as follows:Scenario A. electricity (+39%), gasoline (+60%). fuel oil (+66%). diesel (+66%), kerosene (+60%) and a 28 percetincrease in wage rates. Scenario B is the same as scenario A except that wage rate is assumed constant. See World Bank(1983).
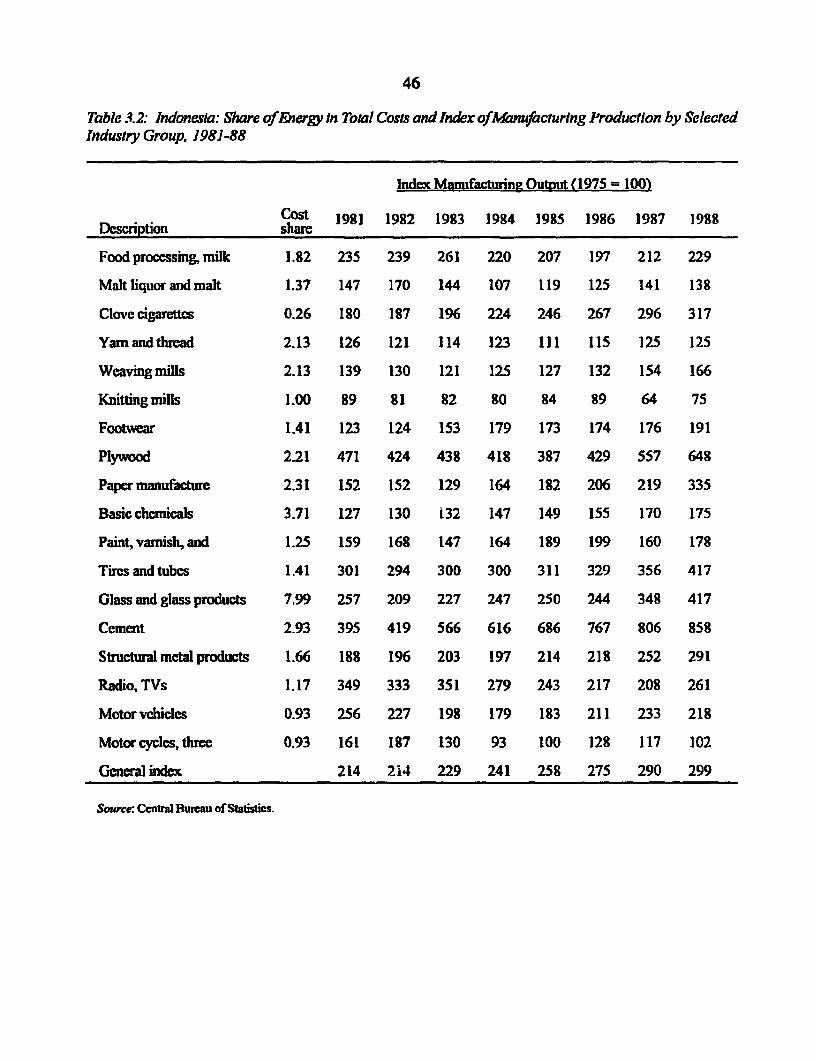
46
Table .3.2: Indonesia: Share of Energy In Total Costs andIndex ofManufacturing Production by SelectedIndustry Group, 1981-88
Index Manufaching Output (1975 = 100)
Cost 1981 1982 1983 1984 1985 1986 1987 1988Description share
Food processing, milk 1.82 235 239 261 220 207 197 212 229
Malt liquor and malt 1.37 147 170 144 107 119 125 141 138
Clove cigarettes 0.26 180 187 196 224 246 267 296 317
Yamrandihread 2.13 126 121 114 123 111 115 125 125
Weavingmills 2.13 139 130 121 125 127 132 154 166
Knitting mills 1.00 89 81 82 80 84 89 64 75
Footwear 1.41 123 124 153 179 173 174 176 191
Plywood 2.21 471 424 438 418 387 429 557 648
Papermanufacturc 2.31 152 152 129 164 182 206 219 335
Basic chemnicals 3.71 127 130 i32 147 149 155 170 175
Paint, vamish, and 1.25 159 168 147 164 189 199 160 178
Tires andtubes 1.41 301 294 300 300 311 329 356 417
Glass and glass products 7.99 257 209 227 247 250 244 348 417
Cement 2.93 395 419 566 616 686 767 806 858
Structral metal products 1.66 188 196 203 197 214 218 252 291
Radio,TVs 1.17 349 333 351 279 243 217 208 261
Motorvehiclcs 0.93 256 227 198 179 183 211 233 218
Motorcycles,three 0.93 161 187 130 93 100 128 117 102
General index 214 214 229 241 258 275 290 299
Source: Central Buneau of Statistics.

47
Table 3.3: Indonesia: Changes in Energy Consumption and Subsidy Effects of Domestic Energy PriceChanges (percent)
Scenario A ScAnario B
Sector Chage in enWgy Subsidy Change in aey Subsidy
Food processing -14.04 -24.41 -27.87 -41.69
Other food fioducts -14.40 -26.61 -27.65 -43.68
Beverages -12.28 -28.26 -26.67 -48.23
Tobacco -11.34 -33.69 -25.09 -54.89
Spinning and weaving -8.68 -22.53 -21.76 -43.34
Textiles -9.31 -24.10 -21.90 -44A0
Weaing apparel -5.41 -25.82 -14.96 -50.46
Leather and leather substitutes -10.24 -26.18 -23.01 -46.16
Leaffier footwear -7.76 -28.46 -17.74 -49.74
Wood and wood pnducts -10.19 -31.52 -19.19 -48.93
Woodfiwniure -2.67 -31.10 -2.63 -51.09
Paper and paper products -10.54 -25.80 -20.84 -43.09
Priting and publishing -5.38 -27.04 -12.89 -49.35
Basic chemicals -12.54 -25.77 -24.18 -42.56
Other chemical products -9.44 -29.39 -19.66 -48.71
Rubber -11.35 -25.29 -23.02 42.86
Plastic wares -11.56 -25.84 -23.32 -43.53
Ceramic and porcelain -11.03 -21.73 -21.92 -37.90
Glass and glass products -13.18 -21.07 -25.95 -37.12
Cement and cement prducts -14.89 -28.06 -30.75 -47.22
Structural clay products -17.59 -24.16 -32.20 -40.10
Othernon-metallic metal products -17.40 -27.38 -31.A9 43.67
Fabricated Metal Products -11.06 -26.90 -22.99 45.52
Machinery -8.22 -25.97 -19.12 -46.72
Electrical mahiney -10.67 -27.83 -22.21 -46.71
Transport equipment -9.62 -29.44 -20.21 -48.96
Measming and optical equipmcnt -6.35 -22.59 -14.97 -43.00

48
economic subsidies, due to a change in domesfic eergy prices, is a decrease of between 20 to 33 percent
in scenario-A, and an even luger decrease in scenario-B. The difference is due to lower levels of energy
consumption in scenario B."'
Anotheriott policy issue related to the increase in diesel prices is the subsidy effecL Figure
3.2 smows the relaionship betwoen domestic and border prices for diesel for Indonesia during th 1980s.
Despite the large price chnges, domestic prices for diesel remained below border prices for most of the
1980s.
1 igure 3.2: Indonesia: Differences Between DomesticandBorder PricesforDieselSubsidy (-), Tax (+J
6rn
2rnrn9 _ __F
-Om .
Li~L
Kerosene Price Increases 1982-85: 7he Household Sector
The major source of commercial energy used in the household sector is kerosene followed by
electricity and gas, which have a marginal share in household consumption3 Therefore, the ncrase in
kersene prices is directly relevant for policy purposes.3' he most important policy issue arising from a
1 evmmR effect of the pric chan am disced under impact of energ price cae.
12 Howve, as for mny othw developing countrie, it is t n-commnrcia somre of amw whih a*fy thmajor portio of homadhld demd for prmy energy. For Indoneds, nely 87 permpat of toal bouehold erco_nnuqiwatisfied -cmir enerly.
J Mm effed of chonge in dectricity pdices is of les impoance This is due to the low shae of dlcicity inhlssold eonsmunptia in he erly 19io and, at the moas, tee canges am eevait for tddle- and high-_comhunabohlu in Dban - avg aces to eliable sips of dlcricity.

49
kerosene price increase during 1982-8S is the welfare consequences for households.
Welfare effects of kerosene price changes are often considered more serious for low-income
households in urban areas with limited access to non-commercial fuel. Assuming a monthly household
expenditure of Rp IS000, with a budget share for kerosene equal to 6 percentTM and price elasticity equal
to -1.02, loss in consumer surplus due to the kerosene price increase during 1982-85 for The household was
equivalent to 0.65 to 2.23 percent of monthly household expenditure. The largest welfare loss occurred in
1982-43 when prices increased by nearly 50 percent and the lowest occurred in 1984-89 when th priea
increase was equal to 14 percent.
Another important policy issue related to an increase in kerosene prices is the subsidy effect Figure
3.3 shows the rlationship between domestic and border prices for kerosene for Indonesia during thel980s.
Despite large price changes, domestic prices for kerosene remained below border prices for most of the
1980s.
Macroeconomic Impacrs
What were ihe macroeconomic impacts of the domestic energy price changes during the period
1982-95? The crucial fctor determining the macroeconomic impact of an energy price hike is ihe effect
on the consumer price index (CPI) and subsequently the nominal wage response to an increase in CPI.
Except for 1985, the CPI was relatively stable during energy pnce reforms and thus the wage response is
less important in ftis context Table 3.4 summarizes selected macroeconomic indicators for the Indonesian
economy during the early 1980s.
As regards the impact on CP1, thre is the diect effect according to the weight of ihe energy pices.
However, there is also ihe indirect effect via the impact of energy prices on food prices, which does not
seem to have been important during the period of energy price increases.' An important factor in this
conext is the itenity of commercial energy use in the agriculture sector and the govenmnent policy wilh
respect to the pricing of agricultural inputs. In Indonesia, the main commercial energy itensive inputs in
the agicue sector are chemical fabriliz, wiich account for around 4.S percent of the production costs
for staple crops such as paddy and maize. However, ferilizr were highly subsidized and ihi prces were
' Aveaep k1roi expuuln dsa of a low icome uban household in 1984. See Wodk Bak (1990).
"In 1985 the inflatioP me vs lowes for the past decade. During April and May 198S thee ws a saig upwadpuaro wlm petrolem prines wer increased. Howor, as th rice crop cams on to the nmiket food pnie dcliedand so did do CPL

50
filng in rel terms mn 1986 such t cmpion increased by 12.3 percet per year during dhe period
198045. it is uiiey dhat aiey price increases led to any cost-push inflation in arcultre prices via an
nca in fertilizer pices. This is also reflected in the food price index where the annual cage have
been reatively small.
Rgwue 3.3: IndonesIa: Dlferences Between Domestic and BorderPricerfor KeroseneSubsidy (-). Tar (+)
Om
Mmc revew bnpact cfthe pnce rePomls was relatvely posillve. Hadt de energy pnce refia not
been implemanted, uig thie most liklyeb esimates of pnce elasdaity of demand for diesel and Icerosene
oqualto -1, tfe admated dwr36 in net esm hin 1985 woWd have been eqlivalent to Rtp bMiin 3567or 18.5 powofihe govmnt revenues in thie samne year. Givren thie fallng inamsad off oil and
tq ra,m ecomonu polide focussed on controllig govenwnent defiici s Isd ev ncw fem
domidesddwand bmstpnoeerefomuscontributed to acluev 1hebudgesytary>s In teof*1e
rev:t, eh ffie% isl ad keosn pnc gswr qmte ff ectve
*sn m 1.7 forda&n t csic" o vmeffc. Sao aodisdmof _ ye,noimpnoin Cbp-r 1.

51
Table 3.4: Indonesia: SelectedMacroeconomicindicators, 1980-85(Rp.bIllon)
1980 1981 1982 1983 1984 1985
GDP (1983 prices) 66,674 71,613 71,377 73,698 78,214 79,046
(Percent gowth) - 7.4 -0.4 3.25 6.1 1.06
Totl rvenmis 10,227 12,213 12,418 14,433 15,905 19.253
(Pau toth) - 19.4 1.7 16.2 10.2 21.0
Change in Price Index (p.a.)'WholcswlIcprice ucx - - - - 11.0 4.5CPI 16 7.1 9.7 11.5 8.8 4.3Food - 8.71 7.5 10.4 6.5 2.0Housing - 8.1 16.0 13.5 13.5 7.2Others - 6.1 12.1 17.1 11.3 5.4
The GDP gowth duinghis period was lower than the 1970s. Since 1982, falling intemational oil
prices and ot rev es for Indonesia created a need for macroeconomic policies focussed on demand
rstrintto maintain financial stability, a goal attaied at the cost of a fall in GDP growth rates during the
period. However, these short-term policies were complemented by structural policy reforms to improve
efficiency in economic activities. Domesfic energy prices contributed to both these short- and long-term
objectives. Although it is difficult to isolate the effects of energy price increase in a macroeconomic
environment ad a number of policy changes were being implemented at the same ime, the positive
revue effect and effient prncng of energy iputs contrbuted to the achievement of short-, medium- and
longtern objectives of policy makes.

52
Data Sources
IPA (1984): Energy Balances of Developing Countries, Intemraonal Energy Agency, Paris.
Lew G. and GowenM (1987): Household Energy Handbookl An interim Guide and Reference Manual,World Bank Technical PaperNo. 67, Washington,D.C.
World Bmk (1983): Indonesa Selected Issues of Energy Pricing, Report No. 4285-IND, ProgramsDepartment East Asia and Pacific Regional Office, v-1, Washington, D.C.
World Bank (1987): Indonesia: Strategy for Economic Recovety, Report No. 6694, Statistical Annex1,Washng D.C.
Wodd Bank (1990): Indonesia: Urban Household Energy Strategy, Report No. 107A/90, ESMAP,Wuhna, D.C.
Woodd Bnlk (1992): World Development Report, Washington, D.C.
53
4. GHANA: DIESEL AND KROSENE PIECE INUCREA 953
Introduetlon
Ghanais bordered byTogo, BuridnaFaso and Ivory Coast on the Aflatic coast in West Africa. It ex_ns
675 kms inland from the coasdine along the Gulf of Guinea and covers a total area of 238,538 squar
kiolmetet. It has a total populaion of 14.9 million and GNP per capita of USS 390, plaing it amongst dh
low-income countries.37
The Ecouonoy
At the time of its indepandence in 1957, Ghana was a niddle-income economy wihi th biest
per capita come n West Afica. It laters ed long peods of low growth rates, at 6 percent durng th
first four years after independence, 2.8 percet during 1960s, and 0.4 percent durig the 1970u Ie
economic decne, which continued into the eady 1980s, was a resut of exteal and domestic fictis
Extea factors included lucaons in i_Snt onal cocoaprcs and an increas in inematonal oil pie
during the 1970s and eary 1980s. Domestic factors were droug4 and poor maan t a dffectet
production of cocoa Smce cocoa is the main export coodiqt, tis iposed a severe cosaint an import
capacity. Factors that led to this outcome were fixed echange rate policies, which led to over-v:aluaion
of the cedi during the 1980sJ high level of taxes, and low cocoa producer prices Deterioration in dho
couns infat e, another intemal factor, was both a cause and an effect of the decine in tho cocoa
sector. The 1979-80 inerational oil price shock combined with the political instabfit brought th
economy into a total crisis.
The decade of the 1980s started with a mulitiy coup that was followed by tho eablihunet of aciviliaWmlitay governent in late 1981. A number of policy reforms foDlowed: imra in rd pries
to cocoa producers, and improvement in trwsport ne d genera health servics Hover,
given ihe severe import constrt and manal resuls from policy changes an extemly supported
adjustent program managed by the IMF and the World Bank was set in motion in May 1983. Refom
undertal inuded itig a flexible exhage rate policy, incasing cocoa producer prices md public
sector wage levels, decoroling prices, r iitatig i and prompt adjusnmet of
Dat for 1990.

54
admnistered prices in line with movements in border prices and exhage rates. Domestic oil price changes
in Ghana during 1983-88 were an outcome of the new pricing policy affecting the administered prices.
Tbe Energy Sector
Structure of EnerV Demand
Domestic end-use of energy in 1985 was estimated to be 3.4 million toe. The main sources of
aergy were wood and agricudture residues (64%) and charcoal (10%). Petroleum products and electricity
consumption was 844 thousand toe, of which petroleum products accounted for 80 percnt. Users of ths
egy included trnUsport (40%), mdustzy (24%) and agriclture and fishing (9%Y*), with diesel accounting
for about 32 percent of lhe energ consumpfion in These sectors. Household consumption is included in tie
residential and the commercial sector,3' which was around 26 percent For this sector, kerosene accouned
for over half, followed by electricity. Table 4.1 gives the structure of commrcial er deand.
Table 4.1: Ghana: Commercial Energy Demand, 1985(000 tons oil equivalent)
Residential and Agricultu Total endcommercial Industrial Trnsport /fishing use Percent
Petrolcum (total) 177 81 341 74 673 80
LPG 3 2 - - 5 .5
Gasoline 12 3 208 5 229 27
Kerosene and 121 3 18 1 143 17aviation uto fuel
Dicsel 41 48 114 68 271 32
Fud Oil - 25 1 - 26 3
Electricity 46 125 - - 171 20
Totd 223 206 341 74 844 100
Sowe GhaaMiqstay a(MidEncr,E yStatiDivision.
M ounmcial c sctor refern to a heterogenous mix of govemment institutions, schools, goverment offices, lar andsmall reti and wholesale establishments ad segyices.
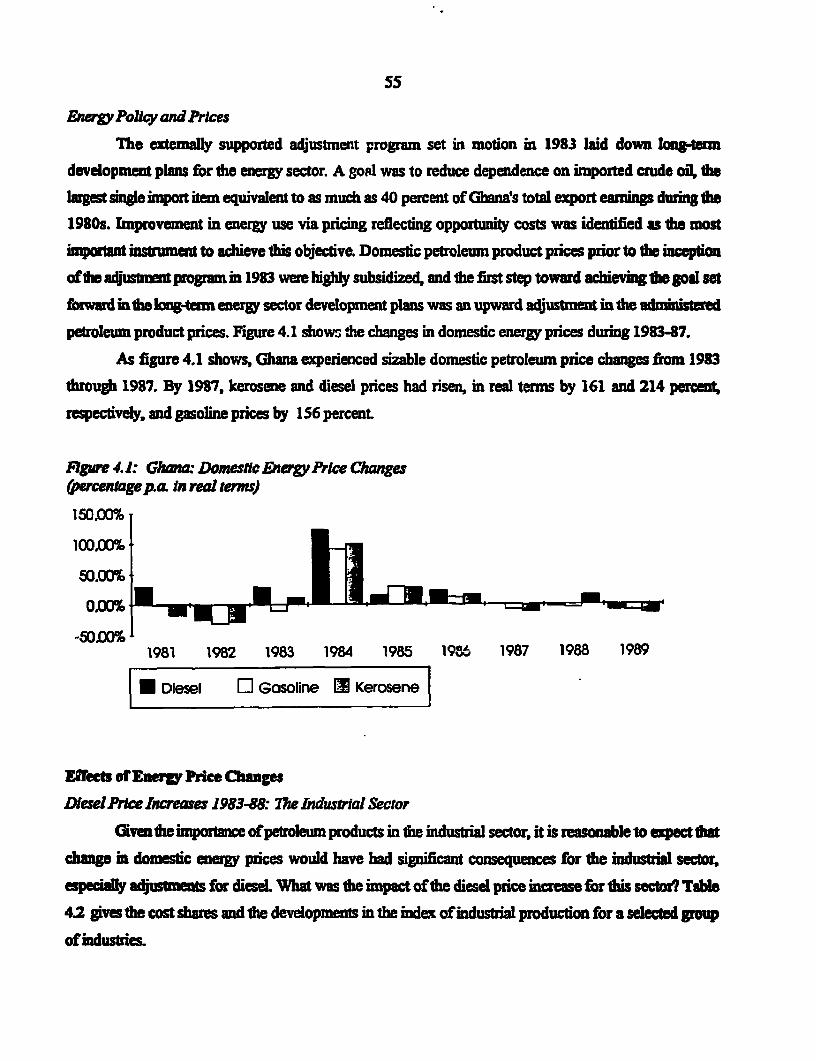
55
E&wrV Policy and Prices
The externally supported adjustment program set in motion in 1983 laid down long-tum
development plans for the energy sector. A goal was to reduce dependence on imported crude oil, t
largemt sige import item equivalent to as much as 40 percent of Ghana's total export earins during lh
1980s. Improvement in energy use via pricing reflecfing opporunity costs was identified as e most
ipoat insument to achieve tis objective. Domestic petroleum product pnices pnor to dh incept
ofthe adjusme program in 1983 were highly subsidized, and the first step toward achieving Ike goal set
forward inthe long-term energy sector development plans was an upward adjustm in the admmisted
petrolewn product prices. Figure 4.1 shows the changes in domestic energy prices during 1983-87.
As figure 4.1 shows, Ghana experienced sizable domestic petroleum price changes from 1983
through 1987. By 1987, kerosene and diesel prices had risen, in real terms by 161 and 214 perent,
respectively, and gasoline prices by 156 percent
Rgwe 4.1: Ghn= Domestic EnergyPrce Changestercentgep.a in real terms)
100.00%
50.00%
0.00%
-50.00%1981 1982 1983 1984 1985 1198 1987 1988 1989
Diesel Gasoline M Kerosene
Effets of Eer Price Chnage
Detel Price ncreases 1983-88: T7e Industral Sector
Given6the importmwe ofpetroleum products in tie industrl sector, it is reasonable to qwt dhat
cag m domestic energy prices would have had significant cosequences for the industi sector,
especily adjustnts for dieseL Wha was the unpact of the diesel pnce increase for this seor? Table
4.2 gives the cost shares and the developments in the index of industri production for a slected group
of industreL

56
Table 4.2: Ghana: Energy Cost Shares and Index ofinduslralProducrion
C!nd .harspA TrnAas nf imhimtri.l Xocutefinn (1010=1(In1
Fuels EMctricitY Ener*y 1981 1983 198S 1987 1989
Gold 1.39% 4.99% 6.38% 96 78 85 93 116Diamond 12.0S% 7.99% 20.04% 73 30 SS 38 33Baix 0.78% 0.61% 1.38% 81 31 75 87 103Mainganoso 4.97% 1.78% 6.75% 89 69 126 101 141
Ma duwingMilk 2.15% 0.86% 3.02% 119 75 109 175 174Whdat flour 0.47% 1.30% 1.78% 82 20 Si 80 92Cocoa buter 1.60% 0.9% 2.19% 90 80 70 74 65cocoa Lqur 1.60% 0.59% 2.19% 123 69 133 218 238Coco cale 1.60% 0.59% 2.19% 85 90 73 82 67Boe 0.73% 2.06% 2.78% 118 70 96 132 140SoftdrinDa n.a. n.a. 129 28 53 99 La.Cigae 0.27% 0.14% 0.41% 79 53 96 86 80Ckodh 4-51% 2.36% 6.87% 84 19 35 53 61Jutebap 1.02% 2.42% 3.44% 96 53 75 48 46Margarine 2.88% 0.96% 3.84% 136 29 101 256 295caue 0.80% 2.79% 3.59% 135 94 121 100 152harozods 4.17% 1.21% 5.38% 95 29 62 58 27Sop 3.13% 0.48% 3.61% 121 41 145 374 419
Sowee.: 'Ghana Prspaoa on adjusunent,t Rcpost No. 947S-Gh, AfUica Region, World BuiL
The energ and individual fuel cost shares in Ghana, except for the diamond miing sector, lies
betwee 0.4 and nearly 7 percent Compared to Malaysia and Indonesia, these cost shares are high, which
coud be iprtet as lower eiciny i energy use in the industrial sector, but whi may also have oer
causes. Howv, most industries had their lowest output around 1983, before the energ price increases,
with an expansion in output from 1983 to 1989, a result that must reflect other simultaneous changes.
Among de ener tsive mdusties, diamonds and iron rods are the exceptions (not recoverng). Others
xanded from 1983 onwards through 1989, under and after the energy price increases. One explanation
is the presence of the stuctural constraints in the economy at the time of energy price changes.
Admnsrative cortrols and constaint on import capacity during the 1970s and 1980s resulted in rationing
of importnt us for most finns in the industrial sector, resulting in underutilization of indusria capacty

57
(utilization around 10-18%)." Prices for commodides woud ihen be deternined by their scarcity and there
were thus high levels of quota rents. An important part of the adjustment program was moblization of
foreign resoures from bilaterl and muliateral aid programs, and changes in the incentive sucture in te
cocoa sector.
Such changes result in relaation of the import constuaint, thereby improving the availabil of
essential inputs to the industrial sector. Liberalzation of the economy via aboliton of most price controls
may thus have been a key fictor affecting industial outpu The increases in domestic oil pnces may have
bee absorbed via reduction in profit margins while output icaed. Figure 4.2 prvides a illusion
of such a sitution. The dotted, upward-sloping marginal cost curve represents the curve shie upward
by input price iase while the simultaneous outward shift in a bindig constaint (on imported inputs,
say) explains why out expands.
lRgure 4.2: Effecas ofan nare in Both Energy Prices and the Supply of RatonedProducton Factors(from scenario 0 to scenario 1)
Pft MC: Me.
A
mheAmucmpi uA. MC
Ps ................... ....si.. C.E
Chp nmgcsaazuwe -- A.CD
SmWord B=k (MI9)p. 9, Tab4.

58
Wha wa the impact on demand for diesel during this period? In line with the increase in output;
diesl consnption inceased nmst years during the period, reflecting tat other infuences were stronger
hn ft costi es
Anohr imporat policy issue related to the increase in diesel prices is dh subsidy effect Figure
43 shows to relationship betwen domestic and border prices for diesel duing the 1980sL
Furwe 4.3: Gh: Dierences between Domestc and Border Pricesfor DieselSubsuidy -). Tax (+)
500.0050.00
0.00
-100.00C4J 1% OhO _ ~~co co a o co co
0% 0%~~h O Oh Oh O
Kerosene Price Clunges 1987-88: The Household Sector
The main sources of commcia energy in the household sector are kerosene and dectiity.
During the period 1984-88, there was a significant increase in kerosene prices. What were the welfare
impc of thee pce chne?
To calcle th welfre ne oss in consumer surplus) of an increase in kerosene prices
for diffria households we need to disaggregate infonnmon concerng the budget shres and prce
dsticity of demd for kerosene for the relevant households. Table 4.3 gives the budget shares of energy
epIeditures for different income groups.
As table 4.3 shows, an imprtant acteristic of kerosene conumption expenditures is dat
q4mdiu altare decing in total expenditures, reflecting that kerosene is a major fuel for the poor.
M, for avkeonprice ease, poorer households would be more affected in terms of percent
o(dir budget It is importa to obtai irtion about the price elicity of demand for krsene to
quzifyr te welfae effct Hower, given he absence of a reliable analysis of demand for kerosene in
Ghb, such eimates are not available. Table 4.4 estimates loss in consumer surplus for altenative
m_ades ofpc elasicity for households dis egatet on the basis of total household expendius.
Welfue loss for the avrage real increase. from 1983 to 1987 is expressed as a percenage of total
xpenditus for the relevant group of households.

59
Table 4.3: Ghana Households: Energy Budget Shares
Eectricity Kerosene Enera total
Quinft 1 0.16% 2.6% 6.45%Quintile 2 0.11% 3.57% 2.17%Quintile 3 0.18% 1.46% 1.95%QuinMe4 0.22% 1.24% 1.68%Quintile 5 0.21% 0.77% 0.21%
Note: Shares baed an the first year (Septembcr-Augut 1987) results of the Ghana Living Stadards Survey.
Table 4.4: Ghana: Estimated Welfare Effects of 39 Percent Kerosene Price Change(averagefor 1983-87 In real terms)
Loss in cosue surplus* percatExpdture Compto Expendishregroup (tesya)(%/) Iq0 i~.S tm
Quintilc 1 158.74 2.61 1.02 0.9 0.78
Quintile2 388.82 3.57 1.4 1.23 1.06
Quinte 3 223.68 1.46 0.57 0.5 0.43
Quintile4 270.38 1.24 0.49 0.43 0.37
Quintile 5 318.3 0.77 0.3 0.27 0.23
'Loss in eimmr suqplus exaasssld u a percet of totl housdold cxpenditures at alterivc prie d.bsticiticuii .Noir. The avae eal irmawe for the yearn 198347,39 percent, is used as a basis in these calwclato.
Consumption and expendituse sar bad on thfint year (Scptmber-August 1987) results of the GhanaLiving Stand Survy.
Ihe abve esimates show ta welfire effects vawy according to the household group. In gea
households fill in mte second quinble lose the most in share of total exp when keosene i
irsea TiEs is due to the bigh she of kerosene itotal expditures ofthis group. Te wdfioe los is
also depenet on pice elascity. Whe household consumpon is more fleible, the higher pce dstbcity
mea lowerd effes on household welfr Loss of welfare for the poorest households is in 1he ange of
ane to 0.8 percent ofteir budget (or around 1800 1987 Cedis), and, for the wealtiier, in he range of 0.3
to 0.2 percent (or aromund 3600 Cedis).

60
The subsidy effect of the increase in kerosene prices was quite substantial. Figure 4.4 gives the
relationship between domestic and border prices for kerosene. In general, from 1986 onward domestic.
kerosene prices were above border prices.
Figure 4.4: Ghana: Dfferences between Domestic and Border Prices for KeroseneSubsidy (-), Tax (+)
60.0040,0020.00 0.001
-20.00-4000 _-60.001-80DO0
-100,00C) - CSJ .u 0 r-. D
co co co co co co co co co~~ co-- 0. CPD 0 0- 0- .- 0D 0 a
Aacroeconomic Impacts
As shown in table 4.5, there was steady growth in GDP during the time of energy price reforms
Most of the increases in domestic petroleum prices were a result of the govemment s policy to adjust
domestic ainiseed pnces in line with the exchange rate changes made under the wider adjusument
program intiated in 1983. Thus, the inflationmy impact of petroleum price changes would be part of tie
t otal or impact of mhage rte adj_tents. During ihe early 1980s, prices for most comnmdities
were determined by their scarcity, which was widespread at the tme, tiereby resulting m large rent for
produers and trders. t such an environent, the impact of changes in petroleum prices would depend
cn dh etant to wvich traders are able to pass on the pric increases to the consumers in order to main
their profit margis. Since petroleum price changes took place during the time of widespre*a policy
refonns-implemented to reduce the general shortage of goods via inprovements in import capacity-it
is most likely th petroleum price increases resulted in adjustments in rents and profit margins of the
des, reting in a mntigated effect on consumer prices. This is substantated by the relatively low levels
of infltion ev though the exchange rate had rapidly appreciated under the stabilization program The
surge in food prices during 1987 was most likely due to a fall in agriculture production caused by
unfavorable weather conditions rather than changes in exchange rates and petroleum prices. Table 4.5
es selected acoeconomic indicators for Ghana.

61
Table 4.5: Ghana: SelectedMacroeconomiclndica 'rs. 1984-89(Cedis million)
1982 1983 1984 1985 1986 1987 1988 1989
GDP (1975 prices) 4974 4747 5158 5420 5702 5976 6312 6633
Percent growth -6.9 -4.6 8.6 5.1 5.2 4.8 5.6 5.1
Current Revenues * 20813 37071 65889 98972 130939 171827
Percent growth - 78 78 50 32 31
Change In Price bnx fpa)CI - 10.38 24.56 39.82 31.36 25.23Food - -11.14 20.28 38.49 34.10 25.08ChGrsrant,f d & powcr - 7.32 42.53 40.22 35.52 25.04Transpot & ommunition - 53.87 34.23 34.37 30.53 30.35
ToaI auvm (I= fomign gant).
As regards ihe revenue effects of petroleum price changes, a sinple calculation can be made
assuniing zero price elasticities. If prices for kerosene and diesel had been kept constant in real terms,
rather than increasing by 161 and 214 percent, respectively, ihe amnual shortfall would have been 21729
million Cedis, or 17 percat of govenment revenues in 1988. Al more elastic demands the implied shortfll
would be even larger given that subsidized goods would be sold in larger quantities.

62
Data Sources
Ghn, Ministy of Mines and Energy, Energy Stadstics Division. Various years.
Green, R., (1987): "Countly Study 1: Ghana, "Stabilization and Adjustment Policies and Programs,WIDER, Helsini.
World Bank, (1985): GhaL: Towards Structural Adjustment", Report No. 5854-GH, Vol. 1&2, WestAfrica Region, The World Bank, Washington, D.C.
World Bank, (1986): "Ghana: Issues and Options in the Energy Sector", Report No. 6234GH, ESMAP,The World Bank, Washington, D.C.
World Bank, (1989): "Ghana: Structural Adjustment for Growthl, Report No. 7515-GI, West AfricaRegion, The World Banl, Washington, D.C.
World Ban (1991): 'Ghana: Progress on Adjustment", Report No. 9475-GH, West Africa Region, TheWorld Bank Washington, D.C.
World Banlk (1992): "Industa Energy Efficiency Acdvity Phase r, VoL 1, Report No. 148A/92,ESMAP, The Wodd Bank, Washington, D.C.
Wodd Bank, (1992): "Industial Energy Efficiency Activity Phase r, Vol. II, Report No. 148B/92,ESMAP, The World Bank, Washington, D.C.
World Bank, (1992): World Development Report, Washington, D.C.

63
5. ZIMBABWE: ELECTRICITY PRICE INCREASES 1983384
Introduction
Zimbabwe is a landlocked country sitated in the center of southem Africa covering a total area of 391 ,000
square kilometers. It has a total population of 9.8 rnillion and GNP per capita of US$ 640, placing it
amongst the low middle-income countries in Africa.4'
The Economy
Zimbabwe is a relatively industrialized African country with an annual GDP growth rate of 2.9
percent during the 1980s. At te time of independence in 1980, it inherited a well-diversified economy with
yearly average growth rates of over5 perct durng 196540, although toward the end of this period, from
1975 onward, the economy had declined by 3 percent, mainly as a result of the civil war and unusu2I
droughts. The country started with a developed modem sector with industry (25% of GDP in 1979) and
commercial agcultue (1 I%). The country also inherited an extremely skewed distribution of income in
favor of white households.
The 1980s started with implementation of the Growth with Equity programL Elements of the
program included liberalization of foreign exchange, increase in agriculture producer prices and increased
investment in transport infrastructure. These elements were based on the govemment's expectations of
expansion in exports and increase in concessional assistane The equity part of the program involved rapid
expansion in education and health services, increase in minimum wages and agricultural resettlement
schemes. These policies, combined with favorable weather conditions and growth an foreign assistance,
resulted in a sharp economic recovery in the country with GDP growth of nearly 10 percent in 1981.
However, the boom in 1980-81 was short lived. Growth in exports was much lower than expected,
as traditional mining and agriculture exports did not expand. Manufactred exports also did not respond
as expected. Shortfall in exports was a resut of a number of factors, among them an increase in donestic
demand, loss in intenaional competitiveness due to domestic wage increases and appreciation of
excages rates and the general world recession. In addition, concessional foreign assistance was delayed,
resulfing in the governmenrts increased dependence on high-cost short-tenn commercial borrowing. As a
result the current account deficit increased from Z$ 158 mil. in ,'80 to Z$ 703 mil. in 1981. By 1982 a
41 Data for 1990.

64
major change in policy was initiated. The govemment increased controlled prices on food, utility and rail
tariffs and increased electricity prices 95 percent over a period of two years, 1983-84.
The Energy Sector
Structure of Energy Demad
Net nery consunption in Zimbabwe at the time of the first domestic electricity price increase in
1982 was estimated to be 5056 thousand toe. Non-conmnercial fuels accounted for more than half (55%)
of net energy consumption. Total commercial energy (coal, petroleum and electricity) consumption was
2303 toe, of which coal accounted for nearly half (47%), the rest being provided by petroleum (26%) and
electricity (27%). Users of commercial energy were industiy (54%), transport (24%) and households
(22%), which includes the commercial sector. The main fuels for industry were coal (53%) and electricity
(34%), which together accounted for nearly 87 percent of commercial energy consumption in this sector,
the rest being provided by petroleum products. The transport sector was highly dependent on oil. For the
household sector, which also includes the consumption of the commercial sector,42 the main commercial
fuels were coal (54%) and electricity (40%).
Zimbabwe has large domesfic reserves of coal. There is also ample access to electricity both from
domestic hydro and thermal sources and via imports from Zambia There are no reserves of oil and the
landocked location of the country imposes high traportaion costs for imported oil. All these factors were
reflected in domestic consumption where domestic resource and imports of electricity from Zambia
provided most of commercial energy. Table 5.1 gives the sttre of commercial energy demand in 1982.
Table 5.1: Zimbabwe: Primary Energy Consumption by Major Sectors, 1982(000' toe)
Solid fuels Oil Electricity Non-commercial fuels Total
Total 1095 596 612 2790 5056Industry 648 161 414 450 1673Transportadon 144 403 - - 547Other sectors 267 32 198 2340 2836Other non-specified - - - -
Source: lEA (I954).
a Coninmial sector refers to a heterogenous mix of govermnnt institutions, school, govenument offices, large andsmall retail and wholesale establishments and services.

65
Energy Policy and Prices
Among the measures in the goverunent policy package set in motion in A982 were depreciation
of the Zimbabwean Dollar by 25 percent between December 1982 and January 1983 and a major increase
in taxes and utility tariffs, including electricity. Given that nearly 38 percent of domestic electricity
consumption was imported from Zambia at the time, increases in domestic utility prices were a important
measure of the effect of devaluation in consumer prices. A general increase in low domestic electricity
prices was also undertaken to mobilize revenues from the mosty state-owned electricity sector.
Consequently, a sizable increase in domestic electricity prices was implemented between 1983-84. when
prices were increased by nearly 95 percent Figure S.1 shows the changes in domestic energy prices in
Zimbabwe during 1982-84.
Figure 5.1: Energy Price Changes in Zimbabwepercentagep.a)
50%
40%
30%
20%-
D 10% -
0%
-10%
-20%1982 1983 1984
U Diesel a Electricity O Gasoline U Kerosene
Effeet of Enery Price Changes
Flectricity Price Increases 1983-84: The Industrial Sector
Given fte donunance of electricity consumption by the industrial sector it is reasonable to expect
an increase in electricity prices to have had significant consequences for ihe industrial sector. What was the
impact of 1983-84 electricity price increase for tis sector? To assess the impacts it is important to examine

66
the composition of electricity demand in the industry at the time of these price increases. Table 5.2 gives
the composition of electricity demand for broad consumer groups.
Table 5.2: Zimbabwe: Elecirical Energy used by Broad Consumer Groups(millions of kWh)
__________________________ 1981 1982 1983 1984
Industy totu 5417 5562 5215 5328Commercial agriculture 541.3 673.1 650.0 592.1Mining 1360.3 1331.1 1271.9 1272.3Manufacturing* 3516.1 3558.0 3293.9 3463.6Domestic consumers" 990.8 987.9 926.6 925.9Others 728.9 764.9 827.8 958.6Total 7137.4 7316.9 6970.2 7212.5
E13lactriciycnsumption in the nu iwgectrsws doinated by clectzicity intensive industry whefe the four major consumes,Sabd Chmicus (MUimzrs), Rodeu Ltd. mnd Rhomet (Farchomc) and Zisco (stol) togclhor in 1981 accounted for over 83 percnt ofthe consumption in this swctor.
3 Domestic electricity consumption was limited to urban consumers as the degrce of rual clectrification was clativcly low.
As table 5.2 shows, over two-thirds of the electricity in the industrial sector was consumed by
manufacturing, followed by mining, which accounted for a quarter and the rest was consumed by
commercial agriculture and forestry. Within the manufacturing sector, electricity consumption was
dominated by electricity-intensive industries, mainly metals (ferochrome and steel) and fertilizers.
Electricity intensive industries such as fertilizers and metals are quite inflexible with respect to interfuel
substion and the share of el ectricity in the unit cost of production is high. Also, the metal industries are
price takers in the highly competitive international metal market Table 5.3 gives the index of industrial
production for a selected group of industries in Zimbabwe at the time of an electricity price increase.

67
Table 5.3: Zimbabwe: Index of Industrial Production (1980 - I00)
Sector Weight 1981 1982 1983 1984
MineralsChrome ore 45 96.9 78.0 78.0 86.1Nickel 136 86.4 88.3 67.3 68.0Iron Ore 36 67.5 51.6 57.0 57.0Cobalt 7 81.9 86.0 63.4 67.0Aggregate 1000 95.9 96.4 92.8 97.0
ManufacuingFood 135 108.4 123.7 126.9 119.4Soft drinks and tobacco 104 89.4 91.7 90.1 86.8Textiles 101 111.6 118.8 108.8 124.1Clothing & footwear 72 128.4 118.6 109.2 99.9Wood & urnitue 44 103.4 85.8 82.3 81.6Paper & prindng 61 112.4 112.3 106.2 95.0Chemical & petro. 125 116.6 118.2 121.4 112.2Non metallic minerals 37 118.0 109.7 105.4 99.0Metals 288 104.8 96.4 94.8 89.4Transport equipment 21 155.0 178.4 145.6 114.7Other manufacturing 12 95.6 80.0 76.6 50.9Aggregate 1000 100.4 108.7 105.8 100.7
Source: Government of Zimbabwe (1989).
Table 5.3 shows tha minerl output declined during 1982-83 as did manufacturing output during
1983-84. The decline in the metals subsector, which accounts for over 80 percent of the electricity
consumption ofthe indusial sector, was significant This occurred despite the fact that the metal industry
enjoys lower tariffs and lower th average increases in electiciy prices. The decline in output is expected,
both due to limited interfuel substitution and the large electricity cost share in these industries. The
competitive nature of the intemational metal markets and the general fall in demand due to the recession
in the OECD were also the factors that furter limited the possibilities for passing through increases in costs
to inal consumers. This fail in output also affected the raw material mining sector. Fail in output of food
and agro-based manufacturs was most likely caused by severe drought during this period.
What was the impact of electricity price increase on demand for electricity in the mining and
manufacturing subsectors during tiis period? In line with output losses, there was a decline in electricity
demnd in tese sector Table 5.4 shows the effect on electricity demand during the period 1982 to 1984.

68
Table 5.4: Zimbabwe: Change in Demandfor Electricity, 1 982-84 and Implied Arc Elasticities
Change in demand (mil. kWh) Price clasLicitics*
Agriculturc -81 (12.03%) 0.13Mining -58.8 (4.42%) 0.05Manufacturing -94.4 (2.65%) 0.03Domcstic consumers -62 (6.28%) 0.07
Arc clnasticitics are calculaled an the basis ofthe price changes dunng 1983-4.
The low arc elasticities implied by these price increases indicate the inflexible nature of electricity
demand in Zimbabwe. For thc industrial sector, the fall in demand was mainly due to the output effect of
the price increase as interfuel substitution in the industiy is limited. The inelastic nature of electricity
demand also indicates the revenue-raising potential of the electricity sector. However, to what extent this
potential is actually realized depends on the govemment's ability to extract the increase in revenues from
the state-owned electricity sector.
Electricity Price Increases 1983-84: The Household Sector
The structure of power supply at the time of the revisions in electricity prices during 1983-84
catered mostly to urban households and rural electrification was low. Given the disparities in income
distribution in Zimbabwe, an important policy issue was the impact of electricity price changes on the
welfare of the poor. Table 5.5 gives an estinate of the welfare impact of electricity price changes for a low-
income urban household.
Table 5.5: Zimbabwe: Urban Low-Income *Household Electricity Consumnpion, Expenditure Shares,Elasticities and Estimated Welfare Effects
1982-83 1983-84
Expenditure share 0.04 0.05Price elasticity 0.08 0.08Consumption(kWh) 177.78 177.73Welfare effect* -1.42% -2.2%
* Houscholds with incomc equal to ZS 100, i.c., thc median incomc of quintlc I and 2.L- Ls in consumer surplus cpressed as a prctagc of total income.

69
Welfare impacts, defined as the loss in conswner surplus, were equivalent to -1.4 and -2.2 percent
of the household income of Z$ 100.
Macroeconomic Impacts
From 1981 to 1984 ihe increase in consumer prices was high compared to the usual inflation rate
of around 6 percent during 1973-79. Inflation peaked at 18.4 percent during 1981-82. Howvever, major
factors causing inflation were already in effect before the 1983-84 increase in electricity prices was
implemented. A number of changes in ihe economy during tis period were responsible for high inflation
rate, including the increase in wages and liberal govemment emp!oyment policies (implemented to correct
the pre-independence racially-based salaTy and employment structure), increase in govenunent
expenditures to expand social programs and rehabilitate the country's infrstructure, increase in domestic
credit, and severe drought conditions in 1982 and 1983, which reduced agriculture output by nearly 12
percent and real value-added by over 5 percent between 1981 and 1983. Table 5.6 summarizes ihe selected
macroeconomic indicators.
Table 5.6: Zimbabwe: Selected Macroeconomic Indicators, 1980-85CZ$ Million)
1980 1981 1982 1983 1984 1985
GDP (1980 prices) 3224 3537 3588 3459 3540 3808
(Percent growth) 10.7 9.7 1.4 -4.6 2.3 7.6
Govermnent revenues 950.9 13645 1789.2 2000.5 2212.8 2618.8
(Percentgrowth) - 43.5 31.1 11.8 10.6 18.4
Change in Price Index (op.a.)
CPI 9.2 14.6 18.4 16.4 12.5 9.9(5.4) (13.1) (10.7) (23.1) (20.2) (8.5)
Food, weight =20.5 (54.9) - 13.4 11.4 20.4 20.9 9.1(12) (10.5) (28.5) (25) (6.8)
Rcnt& rates, weight =19.8 (18.4) - 10.1 26.1 5 4 5.4(7.2) (9.5) (14.7) (12.7) (10.3)
Fuel & lights, weight = 2.9 - 15.9 8.8 4B.5 31 3.1
Note: Figures in brackcs are for low-income ups. Fgurs for raft and raes for low-nome groups mclude fuel and ghts.

70
The drastic fall in GDP during 1982-84 was parTly caused by severe drought conditions, which
resulted in a fall in agriculture output The direct impact of electricity price increases was felt in the output
of electricity-intensive industry in the manufacturing sector, which accounts for over 80 percent of the
electricity consumption in this sector. The fall in minerals and metal outpat was a result of both a fall in
intemational demand and a loss of industrys international competitiveness due to both the wage increases
and an inaease in power and transportadon tariff. In this respect the fming of the increase in power tariffs
was perhaps unfortunate.
Increases in electricity prices were implemented as a part of a stabilization program to reduce
government deficits via reduction in subsidies. As for the fiscal effects of electricity price changes,
assuning price elasticity of demand for electricity equal to zero, had the price reforms during 1983-84 not
been implemented the estimated shortfall in revenues in 1984 would have been equal to Z$ 157 mil. or 6
percent of the government revenues in the same year.43
The stabilization program, which was started in 1982-83, also involved a wage freeze and most
likely an increase in consumer prices, of which food and utility tariffs were the most important This led
to a fail in real wages, thereby mitigating the wage gains resulting from liberal wage policies implemented
immediately after independence.
43 See anex 1.7 for derails relted to calculation of revenue effects. See also discuion of macroeconomic impactsin Chap. 1.

71
Data Sources
Govemment of Zimbabwe, (1986): 'Socio-Economic Review, 1980-1985, Zimbabwe," Ministry ofFinance, Economic Development and Plannin& Harare.
Govemnment ofZimbabwe, (1989): "Sttistical Yearbook ofZimbabwe," Central Statistical Office, Harare.
Leach G. and Gowen, M. (1987): "Household Energy Handbook: An Interim Guide and ReferenceManual," World Bank Technical Paper No. 67, Washington, D.C.
World Bank, (1981) :"Zimbabwe: Couty Economic Memorandum," Report No. 3234b-ZIM,- Eastem Africa Regional Office, Washington, D.C.
World Bank, (1982): "Zimbabwe: Issues and Options in the Energy Sector," Report No. 3765-ZIM,Washington, D.C.
World Bank, (1985): "Zimbabwe: Country Economic Memorandum. Performance, Policies andProspects," Report No. 5458-ZIM, Eastem and Southern Africa Regional Office, Washington,D.C.
World Bank, (1992): "Zimbabwe," ESMAP White Cover Memorandum, Washigton, D.C.
World Bank, (1992): World Development Report, Washington, D.C.

72
6. COLOMBIA: ELECTRICrTY PRICE INCREASES 1955-88
IntroduCedon
Colombia, situated in Latin America, covers an area of 1,139 thousand square kIlometers and has a total
popuaon of 323 million A GNP per capita of USS 1260 places it amongst the low middle-income group
of countries in the regioni.
The Economy
Colombia is a traditionally well-diversified economy with an anmual GDP growth rate of around
5 percent until the first half of the 1980s, when the average growth fell to 2.1 percent Econoidc
performance during the 1970s was satisfactory with average yearly growth in GDP equal to 5.7 percent,
a result of high levels of investment averging 18.7 percent. These levels were mainained trough
domestic savings of about 19.7 percent of GDP during ihe coffee boom of 1975-S0, although foreign
savns of around 2.9 percent also corntrbuted to growth in investnent An aspect of the coffee boom was
the expansion in aggte demand, which resuted in higher inflation. When coffee prices fell in the ealy
1980s, ihe govrmet responded by maintaining aggregate demand through high public expnditars,
domestic credit creation and foreign borrowing which resulted in futher inflation pealing at 25 percent
durmg 1981-83, and real exchag rate appreciation. The resulting loss of competitiveness and fail in the
share of trdables in GDP combined with the general world recession and lightening ofthe interaional
capital makets led to a sharp fall in reserves. At the same time growth in GDP dropped to 1.3 percent per
year. The iumnediate policy problem was to restore extemal balance via reduction in aggregate
expendit&rs, especially tse items affecting ihe balance of payments. An adjustment program was set in
moton during 1984486, with the important objective of improving the public deficit and adjusfting public
sector tariff policies.
In the ene sector, electricity is of particular significance in this context This chapter examines
the impact of electricity price changes during 1985-88. From 1979 to 1985, the energy sector absorbed
neary half of all public invesent resources and two-thirds of this was for electricity. A large portion of
this investment was financed via foreign borrowing, a trend that continued throughout the 1980s.4 The
Dam for 1990.
sa =S = 1.
73
debt service of the power sector by 1989-90 was estimated to be about US$ 1.1 billion per year, or about
2.7 percent of GDP, which put an enormous burden on the economy. Moreover, internal savings of the
sector have been negative. Net revenues from sales covered less hn 40 percent of the principal due on
existing debt, creating high deficits and contribuing greatly to public sector deficits during the 1980s. A
need to improve the internal savings rate of this sector has bee one focus of economic policy during the
198 Os. Increases in electricity prices during 1985-88 were implemented to increase internl savings and
improve utilization of scarce resources. This issue will continue to be important given new investments
planned for this sector during the 1990s.
The Energy Sector
Structure of Energy Demand
Net comnmrcial energy consunpfion in Colombia was 13931 thousand toe in 1988. Oil accounted
for 64 percent of conmmercial energy consumption followed by electricity and coal, each accounting for 15
percent The rest was provided by gas. Users of commercial energy were industry (33%), transport (40%/6)
and residential sectors (14%), with agriculture, commece and public services accounting for the rest (9%).
Fuels used by industry in order of conswnption were coal (40%Ai), oil (26%), gas (17%) and electricity
(17%). For the household sector, commercial fuels consumed were electricity (48%) and oil (39%), the
rest being provided by coal and gas Table 6.1 gives the structure of commercial energy demand for 1985
and 1988.
Electricity Policy and Prices
The electicity pricing policy as sated in the 1968 decree that created ihe tariff regulatory authority
Junta Nacional de Tarifas (JN1) reads as follows:
Tariffs should be based on the real cost of service and generate a sufficient retur, so asto provide adequate financing of the investment progrms of the utilities and should beadjusted promptly to reflect the evolution of costs. Tariffs should also take into accountthe ability to pay of low-income customers.

74
Table 6.: Colombia: PrimaryEnergy Consumption byMajor Sectorfor 1988 and 1985(OOO'toe)
Coal Oil Gas lectricity Tota
Total 2030.9 8880.9 933.6 2085.5 13930.8(1915.4) (7949.5) (815.1) (1706.8) (12336.9)
Idusby 1848.9 1213.4 844.4 723.6 4630.2(1730.2) (900.8) (782.7) (529.8) (3943.5)
Tranqotaion 2.6 5561.7 0.3 5564.5(2.6) (4981.2) - (0.3) (4934.1)
Residnial 179.4 774.8 85.3 958.5 1998(1827) (693.5) (31.7) (801.6) (1709.5)
Ohr sectors - 1063.2 3.9 403.1 1470.2- (1207) (0.7) (375.1) (1582.7)
Not. :HFp=nm badot arn for 1935.S.mW.AEr"Bdwm
Despite the emphasis on cost recovery, in prctice electricity prices have been low with large price
differentias between different consumer groups, i.e., industrid and commercial consumer pric being
much hir dhan prices for residendal consumers. Electricity price increases during 1985-88 attenpted
to rectif his siaion. Figure 6.1 shows iihe dcanges in energy prices in Colombia during 1984-1988. As
the figure shows, electricity pTices were increased gradually during 1985-86 with a major adjustment in
1988.
The figwe also shows that changes mi decticity prices were not uniform across conswmer sectors.
Table 6.2 gives electricity prices for different sectors during the 1980s.
Effects of Eneru Prce Cans %Elctrcty Price Ina== 1985488: The Inusrial Sector
Indusal md cmmercial users were most affected by these price changes. What was ihe inpact
of 1985-88 electricity price increases on the output in the industrial sector? To assess tis we need to
examine both the importance of electricity in this sector in terms of cost shares and ihe composition of
electricity demand in ihe industry at the time of price increases. Table 6.3 gives the cost shres and
electricity c for the industrial sector.

75
Figure 6. 1: Colombia: Energ Prices, 1984-85(percentage pa. in real terms)
40%
30%
20%
.10%
0%
-10%
-20%1984 1985 1986 1987 1988
* Dieel C]Electricity C] Gasoline * Kerneme
Table 6.2: Colombia: Average Rates by Sector - Total System and M, 1988(Col. Pesos/Wh)
Sector 19S4 1985 1986 1987 19f_
Residnial 7.13 7.38 7.79 7.83 7.74Comarcial 18.63 19.81 21.23 22.86 22.52Jbdustrid 12.74 14.75 16.00 16.49 16.70Official IOA2 11.92 13.24 14.02 14.33Total syskcm 10.35 11.38 12.20 12.65 12.56ISA bulk tariff 5.38 5.96 6.09 6.74 6.77
* IdmvoeIDcfi=EJcbimSA

76
Table 6.3: Colombia: Energy Cost Shares and Electricity Consumption
Cost shro ConsMmJtion (000' too)
1985 1958 1955 1951
lion and steel 6.91 5.47 91.8 142.4Chemicals 4.16 3.67 114.0 183.9Nonmetllic mineias - - 74.6 103.1Transport eqipment 1.17 1.36 31.9 25.9Food 1.26 1.11 97.0 115.3Ppe and pulp 4.67 4.81 48.0 58.1Wood 2.68 2.14 4.6 6.5Tectile 2.23 2.79 64.9 77.1Total industry - - 529.5 723.6
Ener expditurca mu peret of gro output for 1985.
The industries listed in table 6.3 account for over 99 percent of electricity consunption in Xt
industia sector. It shows an ice in total dmand for elecircity in the in? .sta sector despite the price
increase in 1985-86 and 1988. It also shows a fai in share of energy cost during this period, indicaftg
some energy conservation in this sector. Given ftat major price changes during 1955 and 1988 covered
both electicity and petroleum products, interfuel substitution woud have been less important The factor
tha would best explain the increase in demand for electricity is an increase in output in Colombia as a
result of the wider stabilization program in 1986.46
The two most important elements of the stabilization program were devaluaton of the real
exchange rates to promote competitiveness and trade reforms such as removal of export restictions and
expanion of the duty exemption scheme, which were designed to enhance profitability in the export sector
as well as efficiency of domestic import-competing sectors. It is reasonable to expect that some of ffie
increase in cost due to adjustments in electricity prices would have been offset by the efficiency gains due
to policy chages However, the most important factor that would explain the increase in output would be
the increase in demand for Colombian exports from the manufacuig sector. Figue 6.2 Mustes the
likly* response during this time period.
4 Sec also the discuimacroeconomic impacts.

OR ~ ~ ~ ~ o'
C X ~~~~~~~~ ~ ~~~~~~~~~~.......... l t t.,,, X 1o * ; * | t g~~~~~~~~~~~~ go .UU.l
.4 t -' U t i | |.i...iORP~
v qo i

78
Electricity Price Increases 1985-88: The Household Sector
eLec ricity prices for the residential sector have traditionally been much lower than prices for the
indutri and comnmercial sectors. These differcnces, which have been justified mainly on socioeconomic
grounds, have varied across different electricity utilities. For the first time, in 1986, formal guidelines were
established for electricity tariffs for the residential sector. According to these guidelines ihe residential tariff
consisted of two elements: a monthly fixed charge determined by the socioeconomic stratum of the
consumer, and five blocks of energy consumption with increasing prices. Six socioecononmc strata were
identified and fixed charges for each stratum were unified across the country. The block energy prices,
however, were allowed to vary within an interval defined as a percentage of long-run average incremental
costs. Table 6.4 tracks the development of these tarffs for the residential sector for different utilities.
Table 6.4: Colombia: Average Residential Rates by Sector andMajor Utility, 1988(Col. Pesos/ J)
Utility ~~1984 1985 1986 1987 1983
EBEB 7.86 7.51 7.16 6.89 6.50EEPPM 5.13 5.99 6.49 6.82 6.95cvC 1.12 8.29 9.63 8.86 8.90ICEL 6.40 6.61 6.98 7.41 7.40CORELCA 8.9 9.17 9.94 10.22 10.16
As shown in table 6.4, the trend in electricity prices for the residenfial sector was not uniform
across utilities. Except for EEEB, the utility serving the capital city of Bogota, there was an increase in
electricity prices for most of the utlities. What were the impacts of ihese price increases on the welfare of
the poo? Table 6.5 ilustates the welfare effects of the price changes for a household with an income of
CoL Pesos 2400 Wmonth and consumption level equal to the average residential consumer of the second
mnor ulity, EPM, serving Medellin
The wefare impact, defined as 'he loss in consumer surplus, was between -2.76 and -3.35 percent
of thehldumonthly income The reively hih-wefare impact is due to high household budget-share
for electicity consunption (9%) as electricity is also used for cooking.

79
Table 6.5: Colombia: Welfare Effects ofElectriciy Price Changes, 1983-88
Price 1984 (Pcsos/kWh) 5.13
Price 1988 (Pesos/kWh) 6.95
Consumption 1984 (kWh/month) 442
Consumption 1988 (kVWhmonth) 392
me (Peos/oth) 24000
Wdefare effect asuing edticiLy of zeo (percent) -3.35
Welfare effict assuming dtsticity of-.32 (percent) -3.16
Welfwar effect assuming price lasticity of one (percent) -2.76
Noti. Price and eonupionf brEPM onuemome.Lou in amaum mus exed as aprentae of tol incOML
As for tfie subsidy effect of price increases during 1985-88, prices in h residential sector wer still
subsidized, altough the level of subsidies varied across dffrent uftlies. Table 6.6 gives te distribution
of subsidies to the residential sector for different utilities.
Table 6.6: Colombia: Electricity Subsidies to the Residential Sector, 1988
Sase 1988 Shareof Aveagerate LRAIC SubsidUtility (GWh) Sales (l) 1988; (JSO/Wh) (USOAkWh) USS Millio.
EEEB 2,639 23.8 2.19 7.34 135EEPPM 2,050 18.5 2.32 7.34 103CVC-CALI 1,477 13.3 2.97 7.34 65ICEL (group) 3,362 30.3 2.47 7.34 164CORELCA 1,569 14.1 3.40 7.34 60Total 11,097 100 2.59 7.34 527
&wmc World Bak (1989).
Ma conomic Impacts
Frm 1986 to 1988, increases in consuer prices were relatively high and inflation peaed at 30
percent in ihe middlc of 1988, although it declined to 28.1 pecent by the end of the samo yea. Stuies
ayz inglation in C4bmbia show tht the maor fctor responsible for nlation mt put bave bem

80
excessive monetauy growth, high capacity utilization, wage-push and devaluation. Two of these factors,
namely, excessive monetay growth and wage-push are relevant in the present context. To ihe extent the
fiscal deficits of the publicly-owned electricity sector are monetized, low electricity prices wold lead to
high fiscal deficits and thus increased money creation. The effect of an increase in electricity prices would
in such a case have a dampening effect on inflation. From 1986 to 1988 deficits of the electricity sector
declined firom Colombian Pesos 81.5 to 55.7 billion. The revenue effect of electricity price changes was
relatively positive. Assuming the price elasficity of demand for electricity equal to zero, had ihe price
refomi not been implemented, se es imated shortfall in government revenues would have been equal to
Col. Pesos 184.5 bill. or 4.36 percent of govenmment revenues in the same year.' Table 6.7 summaizes
selected econonmc indicators.
Table 6.7: Colombia: SelekcedMacroeconomc Indicators, 1984-88
1984 1985 1986 1987 1988
GDP ( Peraet change p.a.) 3.4 3.1 5.8 5.3 5.7
Currentrevec (C. Pcsosbill.) 1261 1651 2394 3229 4233
(Percentchangep.a.) 23 31 41 35 31
Change in Price Index (l4 p.a.)Gracl price level 22.2 24.9 29.2 22.8 27.0CPI 16.1 24.0 18.9 23.3 28.1WPI 18.3 24.9 22.0 25.2 28.3
Another impact of electricity prices on inflation is the extent to which such an increase triggered
wage nfton via the labor unions' attempt to matain real wages. A crucial assunption here is a
downward rgidity of real wage. However, there is little evidence to support this hypothesis. On the
contray, 1he coraction in real wages observed across 91a sectors in 1985 indicates wage flexibility in ihe
Colombian labor zraket Although in 1987 wages had recovered to their 1984 levels, there is little
evidence to support the hypothesis of an wage-push led by electricity price increases dwing the period
1986.88. The main reason for inflation in Colombia during 1986.88 was growing fiscal deficits in 1987,
47Seem=oc 1.7 frdctbaisrdetWcaca of rew See also, discussion of *cimpacin apter 1.

81
which wem partfly monetized. In this respect, an increase in electricity prices would have only dampened
the situation. However, there were other factors involved such as the slow-down of trade liberaization,
increasing demad for new cital from the private sector, a drought in early 1988, and restictive
agriculural trade policy that resulted in an increase in food prices.
Growth in output was relatively stable between 5 and 6 percent during 1986-88. This was an
improvement over annual rates of around 3 percent during 1984-86. The scenario during this period
depicts growth wih inflation. However, in the long-term this is not sustainable. Past studies for Colombia
show an inverse relationship between inflation and growth and control of inflation becomes the most
important policy issue. Further control of fiscal deficits will remain a first priority and reduction of the
power sector deficits via improved revenue raising through increased prices will be an important issue for
the 1990s.
Annex .1: Colombia: Evolulon of the Foreign Debt of the Power Sector
DEBT SHARE IN PUBUC
M:.USS INCREASE SECTOR DEBT
(Year end) (Percent) (Percent)
1980 860.5 22.8% 20.6%
1981 1,056.9 44.3% 18.7%
1982 1,524.8 44.3% 22.40%
1983 1,933.7 26.8% 24.6%
1984 2,457.4 27.1% 27.8%
1985 2,972.1 20.9% 26.2%
1986 3,572.0 20.2% 29.3%
1987 3,973.8 11.2% 32.0%
1988 4,214.3 6.1% 28.5%

82
Data Sources
Aon, DL and Tybou, J.R (1994): WTh. Scope of Fuel Substtution i Manufcuring Industais: A CmaStudy of Chile and Colombia,' Wod Bank Econtic Review 8(1): 49-74.
o, L.A. an" Lora, E. (1987): "Country Study 6: Colombia,' Stabilization and Adjusment Policiesand Progaanuns WDER, Helsinid.
World Bank, (1986) :"A Basis for the Formulation of a Colombian Energy Policy," ESMAP ReportNo.9278, Washington, D.C.
Word Ban, (1987) :"Colombia: Countiy Economic Memorandum," Report No. 6626-CO, LatinAmerican and Caribbean Regional Office, Washington, D.C.
Wold Bank, (1989): "Colombia: Country Economic Memoranduwm Productvity Gromwth ad SustainedEconomic DevelopniW Report No. 7629-CO, Latin Ameican and Caribbean Reginal Office,Washington, D.C.
World Ban, (1989): 'Colombia: Energy Pricing Study," VoL I & II, Report No. 8321-CO, CountryD-epnnt HL Wahington, D.C.
Woodd Bank, (1992): World Development Report, Washingbt D.C.

83
7. TURKEY: OIL AND ELECTRICITY PRICE INCREASES 1986-83
Introduction
Turkey is among the few developing countries that are members of the OECD. It has a population of 56.1
million and GNP per capita of USS 1630, placing it amongst the lower middle-income coutries.'
The Economy
Turkey has traditionally been one of the fastest growing semi-industrialized developing economies
of the post war era Dming the period 1947-77, growth rates of GDP averaged over 6 percent despite the
fact that the country was a net-oil importer and had not received substanial development aid. Economic
growth duringftis period was qyclical; each of three similar cycles started with a period of rapid industri
growth and ended with a major foreign-exchange crisis and devaluation.' Economic policy in Turkey
durmg th tm was mostl inward-looking import-substituting ind izaon with the state as an active
regutor and producer via ste-wned enterprises. Turkey was particularly affected by a chronic extema
imbalance and the oil price shocks and global recession during the 1970s. The situation was furte
worsened by expamsiony economic policies during 1974-77. High growth rates of over 6 percent in real
tem were achieved at the cost of a surge in short-term foreign debt, which ended in a debt-cisis by te
end of 1977. A partially successfil attempt was then made by the ruing Republican Peoples Party
govenmuent to alleviate the siuaion via debt rescheduling and increased concessional and commercial
exterial financing.
The 1980s began with a stabilization program established by the then ruling Justice Party, which
led to a fure-year agreement with the IMF. The scope of ihe program was further widened, first by the
military govenmment after the coup in September 1980 and late on by the Motherland Party after
Decenber 1983. Inception of fti pmrgrn marked a shift in Turkish econonic policy. The inward-looking
import substitionwas replaced by an export orientaton. The earlier regulaory fiamework was replaced
byamore market-oriented econonic environment Policy reforms involved maci devaluafion of Tuibsh
Lire, abolition of price controls, liberliation of the financial system and austerity in govemment
Z Da%t for 1990.
J DaNU, I . aL (1982), Gmem Eulbrium MolU for Doveou Policy, CMdridgo Uuiverqly Pr,ToL

84
eapenditurs An importmt objectve was to improve the chronic balance of payments situaton and control
iatn. It was clear ftat sustned growlh in the medium- and long-run would require greater reliance on
domestic resource mobilization and efficiency in use of scarce resources.
in iis conted, im es in tg manent of the energy sector were crucial to address both
the high depqdnce on imported petolewn and the large partiipation of the state-owned entrprise in this
sector. Sectoral policy focussed on reducing dependence on imported petroleum by fist emphadizi
development of indigenous energy resources, maiy lignite md electricity. andten dachieeng ger
efficiency in ihe use of energy resources. Pricing policies wec identified as an important instrument to
ncourage greaer effliciency in use of aistng energy resources. However, the county didn't implement
widespread increases in ener prices untdl 1987.
The Energy Setor
Stncure of Eery Demand
Net commercial energy consumpfion in Turkey' in 1985 was estimated to be 23.94 million toe.
The most important source was petroleum (62.6%) followed by coal (27%) and electricity (10%). Users
of commerial energy were industry (38%), transport (28%) and residential sectors (23%A), the rest being
consumption by agricuture and commercia services sectors. Nearly half of the demmd in the industi
scto was met by petroleum products and the rest by coal (37%) and electricity (17%). Consumption in
the trnport sector was amo exclusively petroleum products. In lhiv reidential sector half of the
cons-niption was satisfied by coal foDowed by petroleum products (40%A) and electricity (8%). Table 7.1
gives dte stucture of condal energy demand for 1985 prior to the energy price chmges, and for 1989
when price reforms had been implemented
Energy Polcy and Prices
Turkish energy policy during the 1980s emphasized reduced dependence on imported oil and
expansion in domestic lignite and electicity output Durng the decade between 1980 and 1990, for
example, te govemment planned an eig-fold increase m lign ite production and tripling of hydro-power
capacity. Duing the fire half of the decade, emphasis was placed on the supply side. Neary 40 percent
of public invesen equivalnt to 3 pecent of GDP, was arcted to the energy sector in 1984. However,
- urn -mu eified catOgy 'Otwr uoE fiueli ant iluded in d folowig di,aiaL

85
these plans were too anbitious and diversified. Problems of delay in project implementation and
frequenttechnical failures resuting in shortages started in the early 1980s. The govenmment dtn
reconfirmed its plans under the Fifih Five Year Plan (1984-89) to emphasize the role of demand-side
measures and pricing policies inparicular. Ihe domestic energy price changes during 1987-89 were apart
of this sectoral policy under the revised plans. Figure 7.1 shows ihe dhanges in domestic energy prices
during 1986-89.
Tabk 7.1: Turkey: Commercial Energ Consumption by ajor Sectors 1985 and 1989(million toe)
Coal Petroklm Gas Electicity Total
Total final conmpto 6.33 15.05 0.06 2.45 23.94(7.91) (19.29) (0.44) (3.55) (31.19)
indusrysector 3.46 4.12 0.03 1.58 9.18(4.68) (5.15) (0.41) (2.21) (12.45)
Trsport sector 0.13 6.47 - 0.02 6.62(0.03) (8.74) - (0.03) (8.80)
Othr sectors 2.80 3.68 0.03 0.85 7.36(3.20) (4.56) (0.03) (1.30) (9.09)
Residential 2.80 2.20 0.03 0.43 5.45(3.20) (2.83) (0.03) (0.71) (6.77)
Non-energy use - 0.78 - - 0.78- (0.85) - - (0.85)
Nore: Ygrc in badketar for 1989.SO.w lEA (1991)
Effetc of Euiey Pce CugesDiesel and Electricity Price Changes 1986-88: Ihe Industrial Sector
As figure 7.1 shows, Turkey expenenced real domestic energy price changes from 1986 to 1989.
Both electricity and oil product prices were increased during tis period. What was the impact of these
energy price ices on the output in the industial sector? The output impact of an energy price i ase

86
would depend, in the first instce, on the share of energy costs in the total cost of production in the various
subsectors of the industrial sector. In particular, one would expect greater output effects for the energy-
inive subsectors, Table 7.2 gives ihe changes in output of selected industries during the period 1986-90.
Rgure 7.1: Energy Price Changes in Turkey(percentage p.a. in real terms)
2D0%-
150%
100%
. 50% _ IA0%
-50%
-100%1986 1987 1988 1989
* Diesel O Electricity [l Gasolie U Kerosene
A marked downtun in growth is seen for the years of adjusament, 1988-89, as can be expected
Also, industia t generaly are less energy-intensive, such as food and texfiles, fare better than sectors
such as macinery and transport, basic metals, paper and printing and forestrI products, all of -which
experience declines at least one of the two years. Importantly, output rebounded in 1990, and markedly
more so for the sectors wth the lower growth rates in 1988-89.
What was theinpact on energy memand in he industial sector dunng fts peiod? Of puticular
importan is the effect on demand for pteuin the indusia sector. Petroleum consumption as a
e oftotd ameW conspion by the indusa sector feR from nearly 45 percent in 1985 to 41 percent
by 1989 and natal gas consption aed. Share of all the other fuels remained relatvely stable
ding this period, so t change in petroleun product pnces was successful in terms of the overall Turish
energ policy objectve to reduce dependence on impo.ted oiL

87
Another imporint policy issue related to th increase in petroleum product price li1he
relaonsp bewem domKtc and border prices. Figue 7.2 shows ihe relationship betwom the domesic
and border prices for diesel during the 1980s.
Table 7.2: 7hrkey: Changes in the Production ofSelected Industrial Commodities(percen)
1986 1987 1933 1989 1990
Total m g 10.9 10.7 0.9 2.1 9.5
Food, bevrages, tobacco -0.6 3.5 4.5 6.7 6.1
Textilelotn,la 11.9 8.9 1.8 3.2 2.3
Frsyproducb 10.1 4.4 -2.2 2.0 17.4
Paperandpriutiag 6.7 14.1 -7.3 2.6 15.3
Czicals,peroleum 12.4 15.1 2.6 0.4 3.3
Soilpructs 16.3 12.9 6.1 4.7 3.8
Basic metals 18.5 12.1 -0.2 1.2 16.8
Machiny ad anspot equpment 10.9 8.5 -6.7 -1.2 31.8
Other mauIcurnLna 11.4 -17.4 72.9 34.3
u OECDD 5coio a Syb nTui,. 1991.9
As figure 7.2 shows, domesic diesel prices during 1981-85 were a bit over te border pnices. Th
price anges duig Ihe second halfofthe 1980s resulted in domestic prices dth were substanially higir
an te border pnrces, thereby mobiliing much-needed rvenue for the govemment
Electrlcly Price Change 1988: lhe Household Sector
Ihe mot mportant smr of comercil energ for Turkih households are coal ad decrily,
fowed by LPG and keIsn 1be1 h of co-cial en expendibia for Mhe sn imeg rgms
is bighr for wban households as compared to rural households As exected. the share of enery
:xpenditures fals income increases, both for rura and urban areas.

88
Figure 72: Zlurkey: Differences between Domestic andBorder PricesforDieselSubsidy (-), Tax (+
300.00
250.00
2X00 f l
a' 150.00 .
0- 0- 0- O .-
Givi ie relnive importance of vanious energy sources for Turkish households, the changes mdelcicity pnri during 1982 are significant Figure 7.3 gives the electricity expenditure shares for various
roups of households.
figure 7.3: 7brkey: Household Income and EIectricity Expenditure Shares. 1987
(CaWatsdan twheboi t htaauhd ncwco endcm ejmKUwmjWr*Uft 1917. Stat df3flM.at AftA .3509 -T T*wy. hin4Tui tTUrl)
250%
II.
2K1XJ 7s0m0 12500 175000 2200 275000 3250W 375000 425O 475=
I* AN G uban Rur

89
Table 7.3 shows estimated loss in consumer surplus for households disaggregated on the basis of
total household expenditures. The estimates are made using a "worst case price elasticity of 0, giving an
upper boundL Welfire loss is calculated for the electricity price change from 1987 to 1982 and is expressed
as a percentage of total expenditures for the relevant group of households.
Table 73: lItrke Household Monthly Income and Estfmated Welfare Loss due to Domestfic ElectfldtyPrice Changes, 198748(fncome thousand ll;
Incomegroup Urban (%/l) Ruraln%) Alle/()
0- 49.9 2.4 1.8 1.950- 99.9 1.5 1.0 1.2
100- 149.9 1.2 0.8 1.0150 -199.9 1.1 0.7 0.9200 -249.9 1.0 0.6 0.7250 -299.9 0.9 0.5 0.7300 - 349.9 0.8 OA 0.7350 - 399.9 0.7 0.5 0.6400 -449.9 0.7 0.4 0.6450 -499.9 0 0 0.6
Now. Los in consunm surplus exp d as a peceta of median houshold iucomt The iucome groups Wren aoount for nerly82p d 89 pece offte ua dn housedhlds respectively. The figues are based on an asumpton thatpc elaticity ofdman is equal to zeo and thus represent a "wost case sa.
As the estimates above show, welfare effects vaiy according to the household group. In genora,
low-income households suffer a greater welfare loss as compared to the higher-income households. This
is due to the relaively igher share of electricity in total expenditures of the low-icme groups. Also,
utan houeholds loss of welfare is slightly above that of the rural households as heir w endie sares
for electricity are generally higher.
In tms ofelecr subsidies, the average price of electricity during 1986-88 ws m n at
around 6 US cents per kilowatt hour. Ths was relatively close to dte long-nm iementa cost of power
system expansion in Turkey. In this respect Turkey was one of the few developing coumtries with no
subsidy for domestic electricity price during the period under study."'
s5 To other dveloping cubis in his group weo Ediopia, Gambia, Ivkey Coat, ea, M adagacr, Mal,Mozabre Fji Kr., Malaysif , Pip Now Guinea, P pne, Cyprus, Jordan, Morocco, Yeoe AR and YmPD. Seo Wodd Bank (1990), Reviow of Electicit Tariffs in Doveping Couties During th 1980s, Ee SeriPapr No. 32, E aul Industy Deput_et Vorld.g Pwper, Wasington, DC.

90
Acroeonounlcmpacu
Durig 198648 GDP growth was relatively high, around 7 percent. Growth mintined through
fia policies during ts period resulted in growing deficits and inflation. Prior to elections
in September 1987, rismg prices were kept in check by delaying the adjustment of admistered pnces and
relying more heavily on domestic borrowing instead of monetzg ihe deficits. However, after the
Setember parametay elections several increases in taxes and admiseed prices were implemened
to improve govemment finnces Durg this peniod the energ pance index increased by over 41 percnt,
whas dh genera the consumer price index increased by over 75 percent Table 7.4 summaz the
chage in selected macroeconomic indicators.
However, oer fctors contnbuted to rsing ination. During 1980-87 real wages m Turkey
dodIn by 30 percent By 1985 real wages in the manuftuing sector had retuned to their 1965 level.
As ar=% wage payments as a share of non-agricultuld income had declined from nearly 52 percen in
1977 to 22 pect by 1985. liM fall n r 1 wages was an outcome of political measures (restrictions on
tade union activities during this peiod) and fiscal constraint an the public sector tha were an integral part
a(dt stbization and adjument progrn implnd in Turky during ihe early 1980s. By 1987 and
erly 1938, le gradud erosion of real wages began to surface in the form of limited strikes and boycotts.
Table 7.4 Turkey: SelectedAMacroeconomic ndicators, 1986-89(ercentchangesp.a.)
1986 1987 198B 1989 1990
GDP (growth) 7.4 6.4 4.6 0.6 8.2
Governmcntreenuese 18.6 19.1 18.5 20.1 22
clang. in Mice Index 6p.a)Wholesale price (MIning) 13.6 35.7 69.9 84.1 48.7Wolsale pice (Agr;i) 27.1 29.7 50.9 81.4 70.6Wholeal price 37.7 20.5 41.1 63.8 56.5Wbolslepric n 32.6 33.6 77.7 64.7 46.9QPI 34.6 38.9 75.4 69.6 60.3Food 30.4 39.8 71.2 66.4 64.3H _uin - - 58.7 70.2 Ia.
StOa(W.

91
Subsequent lifdng of some of h restrictions on trade union activity in early 1988 allowed even more labor
discontent to surface. The two-year public sector wage agreement between the govemment and Turk-Is
(the major trade union) in early 1988 was based on the undertanding tha further erosion of real wage
would be avoided. It also opened up some real wage increases. A 38 percent incrmase in wages in Janumy
1988 was followed by a fiurher 29 percent increase in the same year. An increase of 20 percent and 16
percent was stipulated for Januay and July 1989, respectively, and in case inflation tumed out to be higher
hn expected provisions were made for supplementaiy wage increases to protect real wages. The legd
minimum wage was also increased by S0 percent in July 1988. Private sector wage increases were geerally
above those in the public sector and in some cases reached 100 percent
As regards the revenue effects of price refonns, assuming unit elastic demand for diesel and
kerosne, had ihe price reforms not been implemented during 1936-88, the estimnated shortfail in revenues
in 1988 woud have been equal to TL 4805 billion or close to a quartr of central govenment revenues
i he sme year.'2 However, domestic diesel prices were already above the border prices before the price
increases. As phnned, th increase in prices increased govenmerit revenues at ihe cost of higher-level
distortions in ihese prices.
Data Sources
Boratav, K., (1987): County Study 5: Turkey, Stabilization and Adjustment Policies and Programs,WIDER, Helsinki.
OECD (1989-1991): Main Economic Indicators, Department of Economics and Statistics, OECD, Pais.
IEA (1991): Energy Balances of OECD Countries 1980-1989, OECD), Paris.
World Bank, (1983): Turkey: Issues and Options in the Energy Sector, Report No. 3877-TU, ESMAP,Washington, D.C.
World Bank, (1987): Turkey. Countxy Economic Memorandu. Sustabiing *.e Adjustment Progrm,Report No. 6516-TU, EM2DA, Vol. 1,Washington, D.C.
World Bank, (1988): Turkey: Country Economic Memorandum. Towards Sustinable Growth,Report No. 7378-TU, EMENA Region, Washigton, D.C.
World Bank, (1992): World Development Report, Washington, D.C.
8 See aumex 1.7 for deik rebted to calclatio of mroo effecti. See aTso discumion of mc isuactmChop. 1.

Policy Research Working Paper Series
ContactTitle Author Date for paper
WPS1425 On the Intersectoral Migration of Donald Larson February 1995 J. JacobsonAgricultural Labor Yalr Mundlak 33710
WPS1426 Russian Unemployment: Its Simon Commander February 1995 V. ReidMagnitude, Characteristics, and Ruslan Yemtsov 35195Regional Dimensions
WPS1427 Corporate Govemance and Equity Stiln Claessens February 1995 F. HatabPrioes: Evidence from the Czech 35835and Slovak Republics
WPS1428 Short-Term Supply Response to a Bnrno Boccara February 1995 M. PlelffenbergerDevaluation: A Model's Implications Fabien Nsenglyumva 34963for Primary Commodity-ExportingDeveloping Countries
WPS1429 The WorldTrade Organizaton's Bernard M. Hoekman March 1995 F. HatabAgreement on Govemment Petros C. Mavroidis 38535Procurement Expanding Disciplines,Declining Membership?
WPS1430 Intergovemrnmental Fiscal Relations Richard M. Bird March 1995 G. Cowardand Poverty Alleviaton In Viet Nam Jennie I. Litvack 80494
M. Govinda Rao
WPS1431 The Industrial Pollution Projection Hemamala Hetlige March 1995 A. WilliamsSystem Paul Martin 37176
Manjula SinghDavid Wheeler
WPS1432 Using Financial Futures in Trading Ignacio Mas March 1995 K. Binkdeyand Risk Management Jes(is Saa-Requejo 81143
WPS1433 Enterprise Restructuring in Eastem Bemard Hoekman March 1995 F. HatabEurope: How Much? How Fast? Gerhard Pohl 35B35Where? Preliminary Evidence fromTrade Data
WPS1 434 Government Credit Policy and Charles W. Calomiris March 1995 P. InfanteIndustrial Performance (Japanese Charles P. HimmelbeTg 37642Machine Tool Producers, 1963-91)
WPS1435 The Political E;onomy of Formal Arup Banerji March 1995 D. EvansSector Pay and Employment in J. Edgardo Carnpos 37496Developing Countries Richard H. Sabot
WPS1 436 An Empirical Model of Sunk Costs Mark J. Roberts March 1995 J. Ngaineand the Decision to Export James R. Tybout 37959

Policy Research Working Paper Series
ContactTitle Author Daa for paper
WPS1437 Travel Mode Substiuton In Sao Jolfre Swalt March 1995 C. JonesPaulo: Estimates and Implications Gunnar S. Eskeland 37699for Air Pollution Control
WPS1438 Trade Reform, Efficiency, and Growth Elaz Ghani March 1995 A. NokhostinCar Jayaraiah 34150
WPS1439 Nontariff Barriers Africa Faces: What Azita AmjadI March 1995 S. UpscombDid the Uruguay Round Accornplish, Alexander Yeats 33718and What Remains to Be Done?
WPS1440 Poverty and Social Transfers in Christiaan Grootaert March 1995 N. SachdevaPoland 82717
WPS1441 The Significance of Credits and Douglas Galbi March 1995 N. CastlloSubsidies in Russian Agricultural 33490Reform
WPS1442 Energy Price Increases In Einar Hope March 1995 C. JonesDeveloping Countries: Case Studies Balbir Singh 37699of Colombia, Ghana, Indonesia,Malaysia, Turkey, and Zimbabwe