policy reform toward gender equality in ethiopia -...
TRANSCRIPT

ESSP WORKING PAPER 45
Policy Reform toward Gender Equality in Ethiopia Little by Little the Egg Begins to Walk
Neha Kumar * and Agnes R. Quisumbing**
* Research Fellow, Poverty, Health, and Nutrition Division, International Food Policy Research Institute
** Senior Research Fellow, Poverty, Health, and Nutrition Division, International Food Policy Research Institute
This paper is also published as IFPRI Discussion Paper 01226; Poverty, Health and Nutrition Division
November 2012

TABLE OF CONTENTS Abstract .................................................................................................................................................................................................... 1 1. Introduction ......................................................................................................................................................................................... 1 2. Data and Sample Descriptives ............................................................................................................................................................ 2 3. The land registration process .............................................................................................................................................................. 5 4. Family law ......................................................................................................................................................................................... 11 5. Summary and policy implications ...................................................................................................................................................... 16 References ............................................................................................................................................................................................. 16
LIST OF TABLES Table 2.1—Descriptive statistics, by gender of household head, ERHS 2009 ......................................................................................... 4 Table 3.1—Characteristics of land owned and cropped ........................................................................................................................... 6 Table 3.2—Land registration process: Knowledge and participation ........................................................................................................ 7 Table 3.3—Regression results for knowledge and participation in land registration process with village fixed effects ........................... 10 Table 4.1—Summary statistics: Changes in perceptions regarding allocation of land and livestock upon divorce, 1997–2009............. 13 Table 4.2—Regression results for changes in perceptions regarding allocation of land and livestock upon divorce ............................. 14 Table 4.3—Regression results for changes in perceptions regarding allocation of land and livestock upon divorce with village
fixed effects ......................................................................................................................................................................... 15
LIST OF FIGURES Figure 2.1—Location of the Ethiopian Rural Household Survey (ERHS) villages .................................................................................... 3 Figure 2.2—Proportion of female-headed households ............................................................................................................................. 3 Figure 2.3—Assets and consumption over time ....................................................................................................................................... 5 Figure 3.1—Proportion of households aware of the registration process ................................................................................................. 9 Figure 3.2—Proportion of households that attended any meeting held during the land registration process ........................................... 9 Figure 3.3—Index of participation in land registration process ................................................................................................................. 9 Figure 4.1—Perceptions of allocation of assets: Divided half-half in case of a no-fault divorce ............................................................. 11 Figure 4.2—Perceptions of allocation of assets: Given to the wife in case of a no-fault divorce ............................................................ 12 Figure 4.3—Perceptions of allocation of assets: Divided half-half in case of divorce when wife is at fault ............................................. 12 Figure 4.4—Perceptions of allocation of assets: Given to the husband in case of divorce when wife is at fault ..................................... 12 Figure 4.5—Perceptions of allocation of assets: Divided half-half in case of divorce when husband is at fault ...................................... 13 Figure 4.6—Perceptions of allocation of assets: Given to the wife in case of divorce when husband is at fault ..................................... 13
1
ESSP II WORKING PAPER XX
ABSTRACT There is growing interest in the role of policy reforms to promote gender equality and empower women, two key objec-tives of development policy. From a policy perspective, it would be ideal for reforms undertaken in different policy areas to be consistent, so that they reinforce each other in improving gender equity. We use data from the Ethiopian Rural Household Survey (ERHS) to show how two seemingly unrelated reforms—community-based land registration, under-taken since 2003, and changes in the Family Code implemented in 2000—may have created conditions for mutually reinforcing gender-sensitive reforms. Our analysis confirms previous studies’ findings of gender gaps in awareness and information about the land registration process. Male-headed households are, on average, more likely to have heard about the process, to have attended meetings (and a greater number of meetings), and to have received some written material with information about the process. Having female members in the Land Administration Committee (LAC) has a positive impact on attendance at meetings relating to land registration. In our analysis of the changes in the family law, we find that awareness about the land registration process is positively correlated with the shift in perceptions toward equal division of land and livestock upon divorce. The presence of female members in the LAC also has a positive effect on the shift in perceptions toward a more equal division of assets upon divorce. Taken together, these findings suggest that the land registration process and the reform of the Family Code may have mutually reinforcing effects on women’s rights and welfare. While this example is obviously rooted in the Ethiopian context, it raises the possibility that similar reform efforts may be complementary in other countries as well.
Keywords: gender, reforms, Family Code, land registration, Ethiopia
1. INTRODUCTION Kes be kes enqullal be-egrwa tihedalech.
Little by little, the egg begins to walk.
(Ethiopian saying)
Attention to gender equality remains an important development goal. The importance of gender equality is highlighted in its prominence in the United Nations Millennium Development Goals (MDGs), which have been commonly accepted as a framework for measuring development progress. Of the eight goals, four are directly related to gender: achieving universal primary education, promoting gender equality and the empowerment of women, reducing infant and child mortality, and improving maternal health. Closing gender gaps—which tend to favor males—has also been seen to contribute to women’s empowerment. However, the term empowerment refers to a broad concept that is used differently by various writers, depending on the context or circumstance (see Kabeer [2001] and Ibrahim and Alkire [2007] for discussions and a review of concepts).
Another argument for reducing the gender gap revolves around improving productivity and increasing efficiency, a strong message of the Food and Agriculture Organization’s State of Food and Agriculture 2010–2011: Women in Agriculture—Closing the Gender Gap for Development (FAO 2011), as well as the significant effects on the efficiency and welfare outcomes of project or policy interventions. In a volume of papers prepared for the above-mentioned report, Quisumbing et al. (2012) argue that the motivations for closing the gender gap are not mutually exclusive; rather, they reinforce each other. Closing the gender gap in assets—allowing women to own and control productive assets—both increases wom-en’s productivity and increases their self-esteem. A woman who is empowered to make decisions regarding what to plant and what (and how many) inputs to apply on her plot will be more productive in agriculture. An empowered woman will also be better able to ensure her children’s health and nutrition because she is able to take care of her own physical and mental well-being (see Smith et al. [2003] and studies reviewed therein). Various studies have shown that reducing gender gaps is key to achieving many different development objectives.
If closing the gender gap is itself such an important development objective, are there complementarities with other development goals that could be exploited? Is it possible that different policy reforms could have reinforcing impacts on gender equality? This paper explores the complementarity of two different reform processes in Ethiopia that began in the 2000s: the community-based land registration efforts, which started in 2003, and the promulgation of the revised Family Code in 2000.
Ethiopia, the third most populous country in Africa, is characterized by substantial ethnic and religious diversity, with more than 85 ethnic groups and most major world religions represented, as well as animist belief systems (Webb, von Braun, and Yohannes 1992). This diversity extends beyond the people and culture of Ethiopia to their environment, as the agroecological zones and, consequently, farming systems vary dramatically around the country. There is also
2
considerable diversity in gender norms related to property ownership, inheritance, and the division of assets after divorce, with men favored in the majority of cases (Fafchamps and Quisumbing 2005). Such gender disparities have important welfare consequences, as evidenced by empirical work on Ethiopia. Dercon and Krishnan (2000) find that poor women in the southern part of Ethiopia, where customary laws governing settlement at divorce are biased against women, fare worst when illness shocks occur. Fafchamps, Kebede, and Quisumbing (2009) find that the relative nutrition of spouses is associated with correlates of bargaining power, such as cognitive ability, independent sources of income, and devolution of assets upon divorce, and that several dimensions of female empowerment benefit the nutrition and education level of children.
However, research on the impacts of policy reform in other countries suggests that changes in legislation may improve well-being outcomes for women. For example, in Canada, Hoddinott and Adam (1997) show that suicide rates of married women are lower in states with divorce laws that are more beneficial to women. While progress toward gender equality has been slow in Ethiopia, recent developments are promising. Prior to 2000, legal reform had a limited impact on local traditions regarding patrimonial issues. For example, although the 1960 Civil Code gave women more rights than their contemporaries in the United States or United Kingdom, it also maintained the tradition of dispute settlement by personal arbitrators, normally older men within the family or community selected by the disputants. The arbitrators, unfamiliar with or unsympathetic to the new laws, continued to apply old customary laws. The de jure system had nothing to do with the de facto reality that existed for the next 30 years (Gopal 2001). The major exception was the distribution and control of land, an area in which the Ethiopian state has played a dominant role throughout the centuries.
In 2000, however, the revised Family Code was passed, giving equal rights to spouses during the conclusion, duration, and dissolution of marriage. It also required equal division of all assets between the husband and wife upon divorce (Federal Negarit Gazetta Extra Ordinary Issue 2000). Between 2000 and 2005, Amhara, Oromiya, and Tigray imple-mented the code (out of nine regions in Ethiopia), but as of 2011, all regions now apply the revised Family Code (Hall-ward-Driemeier and Gajigo 2011). In 2003, the Ethiopian government also embarked on a process of community-based land registration, which led to joint certification of husbands and wives, giving stronger land rights to women. Are these efforts to strengthen women’s land rights complementary to the changes instituted by the Family Code, which gave equal rights to women and men in terms of marriage, inheritance, and property?
In this paper we use data from the Ethiopian Rural Household Survey (ERHS) to show how two seemingly unrelated reforms—community-based land registration, undertaken since 2003, and changes in the Family Code implemented in 2000—may have created conditions for gender-sensitive reforms to reinforce each other. Although these are only a subset of the issues in which gender-related reforms may be complementary, they are relevant to current policy discus-sions and may help inform future directions of policy reform. We use data from the 1997, 2004, and 2009 rounds of the ERHS, which covered approximately 1,300 households in 15 villages all across Ethiopia.
The rest of the paper is organized as follows. We begin by describing our data source and our sample in Section 2. We then provide background on the two interventions and analyze their impact on knowledge and participation in land registration and changes in perceptions of the distribution of property upon divorce in Sections 3 and 4. Section 5 concludes.
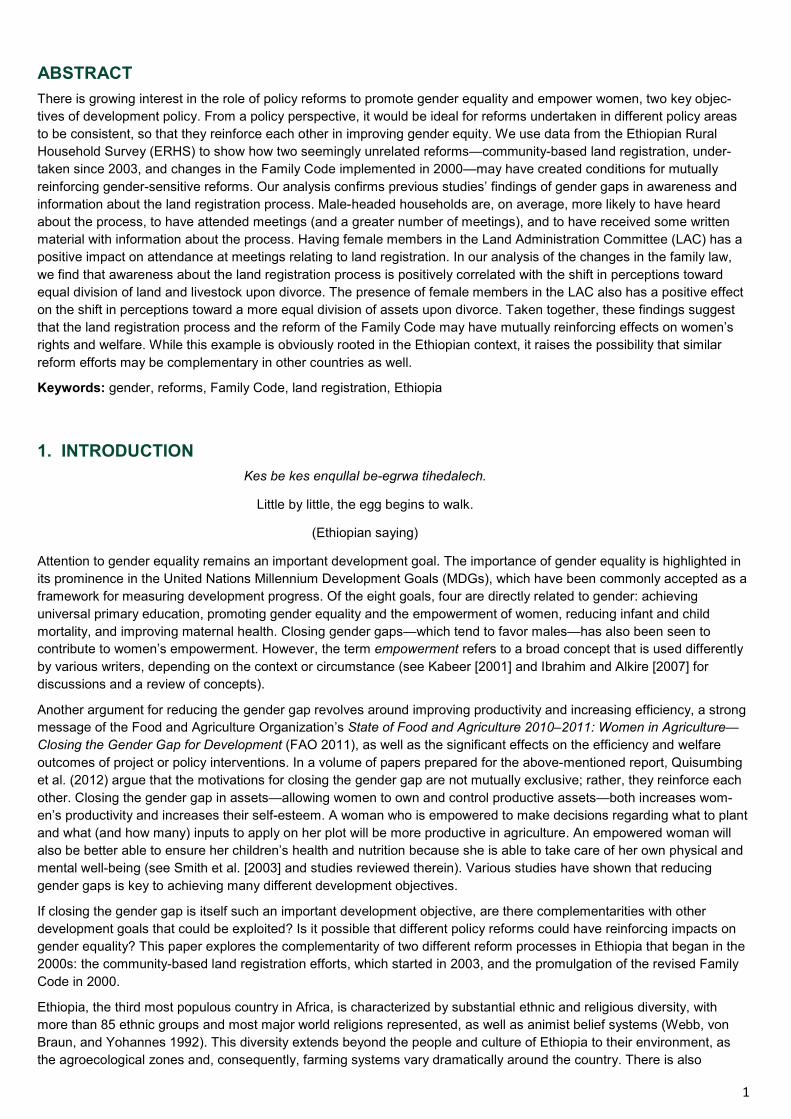
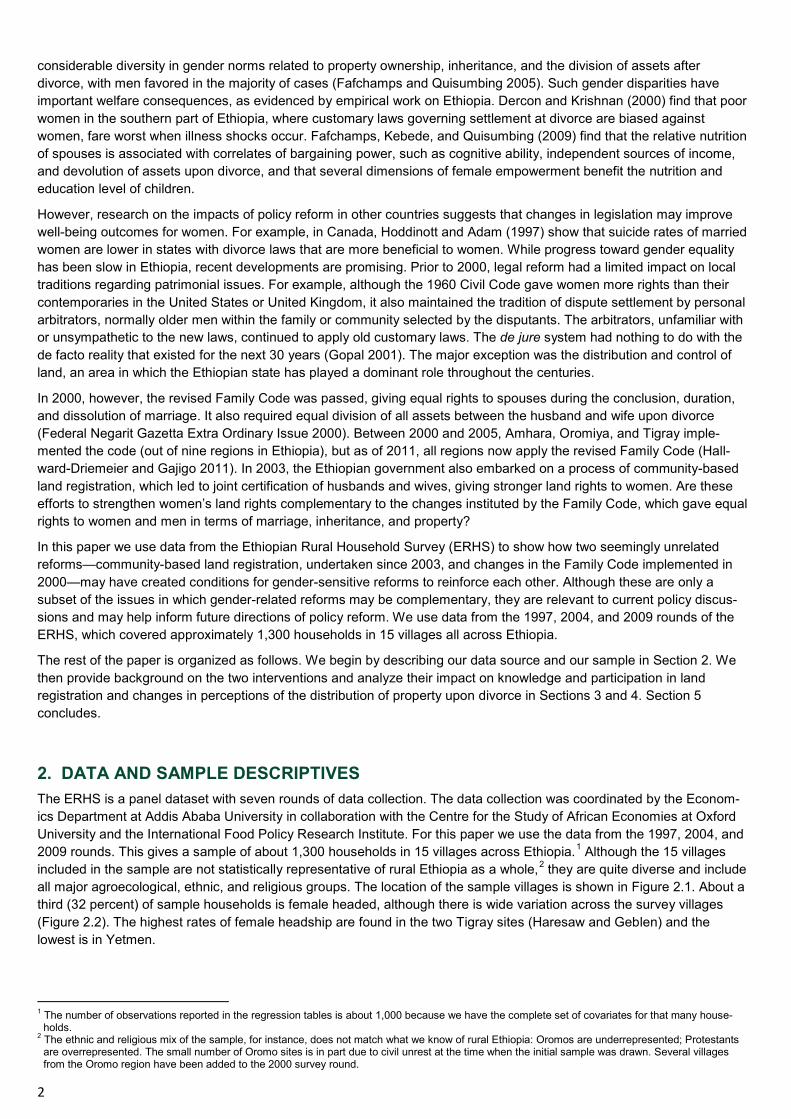
2. DATA AND SAMPLE DESCRIPTIVES The ERHS is a panel dataset with seven rounds of data collection. The data collection was coordinated by the Econom-ics Department at Addis Ababa University in collaboration with the Centre for the Study of African Economies at Oxford University and the International Food Policy Research Institute. For this paper we use the data from the 1997, 2004, and 2009 rounds. This gives a sample of about 1,300 households in 15 villages across Ethiopia.1 Although the 15 villages included in the sample are not statistically representative of rural Ethiopia as a whole,2 they are quite diverse and include all major agroecological, ethnic, and religious groups. The location of the sample villages is shown in Figure 2.1. About a third (32 percent) of sample households is female headed, although there is wide variation across the survey villages (Figure 2.2). The highest rates of female headship are found in the two Tigray sites (Haresaw and Geblen) and the lowest is in Yetmen.
1 The number of observations reported in the regression tables is about 1,000 because we have the complete set of covariates for that many house-
holds. 2 The ethnic and religious mix of the sample, for instance, does not match what we know of rural Ethiopia: Oromos are underrepresented; Protestants
are overrepresented. The small number of Oromo sites is in part due to civil unrest at the time when the initial sample was drawn. Several villages from the Oromo region have been added to the 2000 survey round.
3
ESSP II WORKING PAPER XX
Figure 2.1—Location of the Ethiopian Rural Household Survey (ERHS) villages
Source: ERHS
Figure 2.2—Proportion of female-headed households
Source: ERHS 2009.
The surveys collected information on household demographic characteristics, occupation, cropping patterns, perceptions of poverty and well-being, experience with shocks, access to credit, and so on. We present, in Table 2.1, some of the summary statistics for our sample, disaggregated by the gender of the household head. Female-headed households differ significantly from their male-headed counterparts across a number of dimensions. Female heads are, on average, older and less educated than male heads; female heads, on average, have no education, whereas their male counter-parts have at least two years of schooling. The gender disparity in schooling is not limited to the education of the head but is also true for the household at large: the average highest education level within female-headed households is 4.76 years, which is about a year and half less than that in male-headed households. Female-headed households also tend to be smaller, with a larger fraction of female members. Because household size is proportional to the amount of labor resources the household controls in a rural area, and because many farm operations (especially plowing) are intensive in male labor, female-headed households are at a disadvantage with respect to labor endowments.
0.00
0.10
0.20
0.30
0.40
0.50
0.60
0.70
Who
le S
ampl
e
Hare
saw
Geb
len
Dink
i
Yetm
en
Shum
sha
Sirb
ana
Gode
ti
Adel
e Ke
ke
Koro
dega
ga
Triru
fe…
Imdi
bir
Aze
Debo
a
Adad
o
Gar
a G
odo
Dom
a
Debr
e Be
rhan
Oda
Daw
ata
Bako
Tib
e
Sodo
mo
Prop
ortio
n o
f fem
lae
head
ed h
ouse
hold
s

4
Female-headed households are also worse off compared to their male counterparts in terms of land and asset owner-ship. Male-headed households own 2.2 hectares of land, on average, compared to 1.7 hectares for female-headed households. Male-headed households also have an average of 9.4 tropical livestock units (TLUs), which is significantly different from female-headed households’ holdings of 8.8 TLUs. Sixty percent of male-headed households have at least some oxen, compared to 37 percent of female-headed households.
Table 2.1—Descriptive statistics, by gender of household head, ERHS 2009
Female-headed household
Male-headed household p-value
Age of head 54.28 52.53 ** Education of head 0.33 2.22 *** Highest grade obtained 4.76 6.28 *** Fraction of female members in household 0.62 0.47 *** Fraction of dependent members in household 0.51 0.52 Household size 4.39 6.38 *** Total land owned, hectares 1.73 2.198301 *** Total livestock owned, tropical livestock units 8.82 9.394687 *** Fraction of households that own any oxen 0.37 0.6147388 *** Real per capita consumption in 2004 (ETB, 1994 prices) 94 91 Real per capita consumption in 2009 (ETB, 1994 prices) 59 60 Proportion of years in which consumption fell below average 0.39 0.4097105 Fraction of households that are members of an iddir 0.76 0.8930582 *** Network size 8.61 11.41048 *** Fraction of households that have a bank account 0.05 0.0628638 Number of sources from which a household can borrow 1.32 1.574347 ***
Source: ERHS and authors’ computations. Notes: *, **, and *** represent statistical significance at 1, 5, and 10 percent, respectively. ETB = Ethiopian birr.
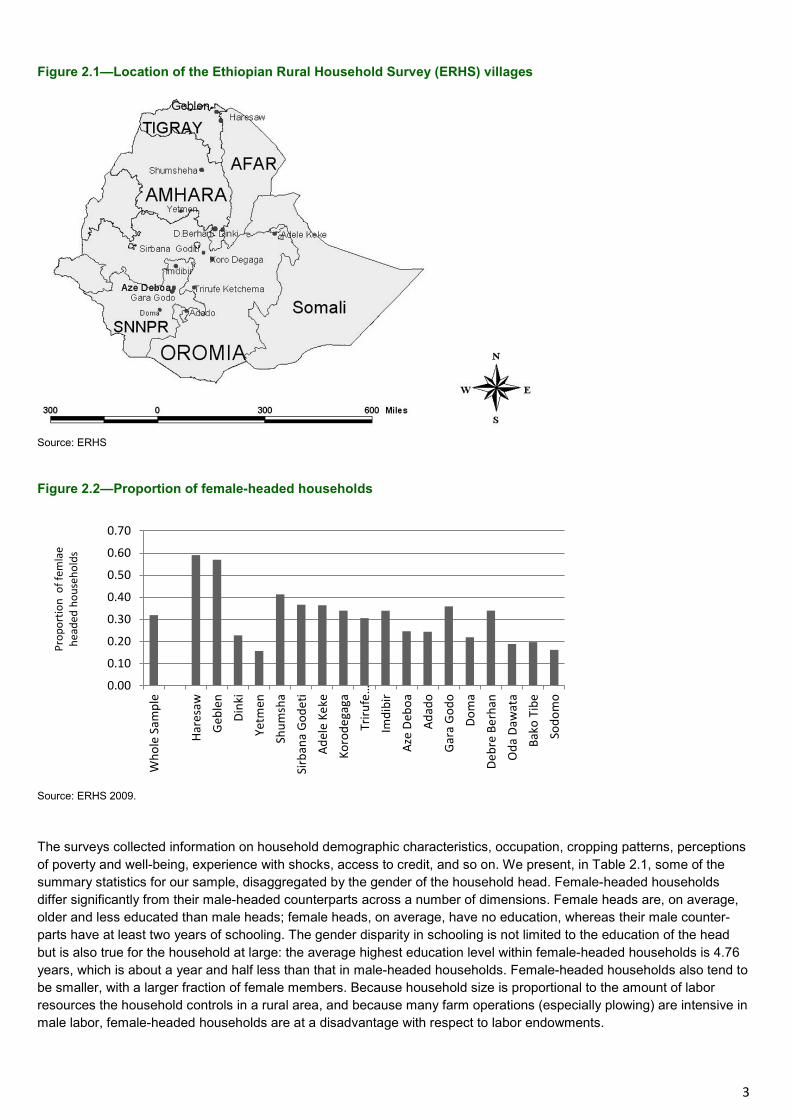
In terms of real per capita consumption, however, there is no significant difference between male- and female-headed households (Table 2.1). Real per capita consumption of male-headed households in 2004 was 91 Ethiopian birr (ETB), and that of female-headed households, ETB 94, but the difference is not statistically significant. The real per capita consumption among households fell to ETB 59 and ETB 60, respectively, in 2009. We construct a measure that indicates the proportion of years the consumption of the household fell below average. Table 2.1 shows that female- and male-headed households alike experience shortfalls in consumption about 40 percent of the time. Upon closer analysis, it appears that the slight advantage of female-headed households in consumption may have come at the cost of slower asset accumulation. Figure 2.3 presents data on asset holdings, real per capita consumption, and whether or not a household was classified as poor in the previous six rounds of the ERHS, disaggregated by the gender of the household head. Figure 2.3 shows that although female-headed households’ real per capita consumption was about the same and even surpassed that of male-headed households in the last two rounds, their asset levels were always below those of their male counterparts. Maintaining consumption levels may have come at the cost of asset accumulation; if female-headed households dispose of assets in order to guarantee consumption, they may be at risk of falling into an asset poverty trap, which may make it more difficult to move out of poverty in the long run.
5
ESSP II WORKING PAPER XX
Figure 2.3—Assets and consumption over time
Source: ERHS.
Next we move on to measures of social capital, namely, network size and membership in an iddir (burial society or funeral association). In the survey, we ask the respondents to count the number of people that they can rely on in times of need. This is what we call network size. Table 2.1 shows that male-headed households, on average, have larger networks, and that male-headed households are more likely to be members of an iddir. In terms of access to financial institutions and credit, the proportion of households holding a bank account is quite small (about 5 percent) and is not substantially different for the two groups. However, male-headed households have access to a greater number of sources from which they can borrow.
3. THE LAND REGISTRATION PROCESS A large body of literature (for example, Banerjee, Gertler, and Ghatak 2002; Bardhan and Mookherjee 2009; Feder et al. 1988; and Feder and Nishio 1997) shows that providing tenure security among users of land (owners or sharecroppers) increases its productivity. Such security improves the incentives to invest in land and increases the users’ ability to obtain credit. The positive effects of land tenure security on land productivity have been used to justify land titling, or full individualization of property rights. However, there may be cases in which land registration is not feasible (either because the cost–benefit ratio is too high or the institutional machinery is not well established) or is not required (because land rights are already well defined). Land legislation may not always lead to efficient outcomes if, for example, it stimulates land grabbing by the powerful in the wake of land reforms (Jansen and Roquas 1998). Moreover, the benefits of land legislation are context specific (Feder and Nishio 1997). Deininger et al. (2007) argue that there may be a case for reforms in land tenure security even in situations in which land titling has little relevance to begin with. Citing examples from some African countries, they argue that as rural areas become more integrated into the market economy, land transactions increase, and in the absence of formal land titles, people resort to informal means of transferring land rights.
Additional benefits may be gained from improving land tenure security for women. Many studies have documented productivity differentials between male and female farmers, particularly in Africa south of the Sahara. In some cases, these productivity differentials stem from women’s insecure rights to land, which exacerbate the inefficiencies created by imperfect land markets. In Ghana, Goldstein and Udry (2008) attribute the productivity differential among male and female farmers to women’s higher level of tenure insecurity, which renders them less likely to leave their land fallow, since they risk losing the land if they are not actively farming it. Imperfections in land rental markets create productivity differentials that are not gender neutral: not only is productivity lower on female-headed households’ land, but female household heads also tend to rent out their land to tenants with much lower productivity (Holden and Bezabih 2009). Indeed, Holden and Bezabih (2009) find significantly higher levels of inefficiency linked to contracts of female landlords with in-law tenants, owing to the difficulty of evicting one’s relatives and the high transactions costs of screening and selecting better tenants. An important policy implication of this analysis is that strengthening women’s land rights may improve both equity and the efficiency of land use.
00.5
11.5
22.5
33.5
4
FemaleHeaded
MaleHeaded
FemaleHeaded
MaleHeaded
FemaleHeaded
MaleHeaded
FemaleHeaded
MaleHeaded
FemaleHeaded
MaleHeaded
FemaleHeaded
MaleHeaded
Land (Ha) Livestock Value(1000 ETB)
Livestock (inTropical
Livestock Units)
Proportionhouseholdsowning any
oxen
Real per capitaconsumption
(100 ETB)
Proportionhouseholds
poor
Round 1
Round 2
Round 3
Round 4
Round 5
Round 6

6
Ethiopia is one of the few African countries to successfully implement a cost-effective and transparent land registration process (Deininger et al. 2007). Deininger et al. (2007) point out that the decentralized nature of the land registration process and consistent adherence to procedures accelerated its implementation, and the beneficiaries viewed the process as valuable. Following the implementation of the land registration process, female heads of households in Tigray were more likely to rent out land, because tenure security increased their confidence in doing so (Holden, Deininger, and Ghebru 2007). The Ethiopian land certification scheme is noteworthy because land administration committees at the kebele level (the smallest administrative unit in Ethiopia) were required to have at least one female member and land certificates were issued after public registration for transparency (Deininger et al. 2007). The land certificates included maps and, in some regions, photos of the husband and wife.3 Holden, Deininger, and Ghebru (2007) argue that land certification had a greater impact on women’s participation in the land market because land certificates may be more valuable to women, whose tenure rights were previously less secure than those of men. Nevertheless, gaps remained in awareness and information about the process. A related study (Holden and Tefera 2008) found that, on average, women’s knowledge and participation in the land registration process was lower than that of men in Oromiya and SNNPR (Southern Nations, Nationalities, and People’s Region).
We now examine whether male- and female-headed households differ in terms of land owned and cultivated, and in awareness of and participation in the land registration process. Table 3.1 indicates that male-headed households hold more land (have larger plot sizes), of which a larger proportion is cultivable, compared with female-headed households. The larger areas and proportions of land cultivated may be partly because of better land quality and the fact that larger plot sizes are more viable for cultivation. Women in male-headed households are very rarely in charge of operating land, but the converse cannot be said for female-headed households, where about one-fifth of the time men are operating the land.4 This may occur due to cultural norms that prohibit women from plowing land because it is perceived to be too strenuous (Frank 1999). Male-headed households are also more likely to have a larger fraction of their land registered.
Table 3.1—Characteristics of land owned and cropped
Female-headed
household
Male-headed
household p-value
Total plot area, hectares 1.60 2.00 **
Total cropped area, hectares 1.19 1.69 ***
Fraction of total land that is cropped 0.71 0.85 ***
Fraction of cropped land that is good or medium quality 0.83 0.89 ***
Fraction of total land that is good or medium quality 0.83 0.88 ***
Fraction of cropped area operated by women 0.82 0.01 ***
Fraction of plot area operated by women 0.84 0.01 ***
Fraction of cropped area registered 0.95 0.97 **
Fraction of total land area registered 0.96 0.97 *
Source: ERHS and authors’ computations. Notes: *, **, and *** represent statistical significance at 1, 5, and 10 percent, respectively.
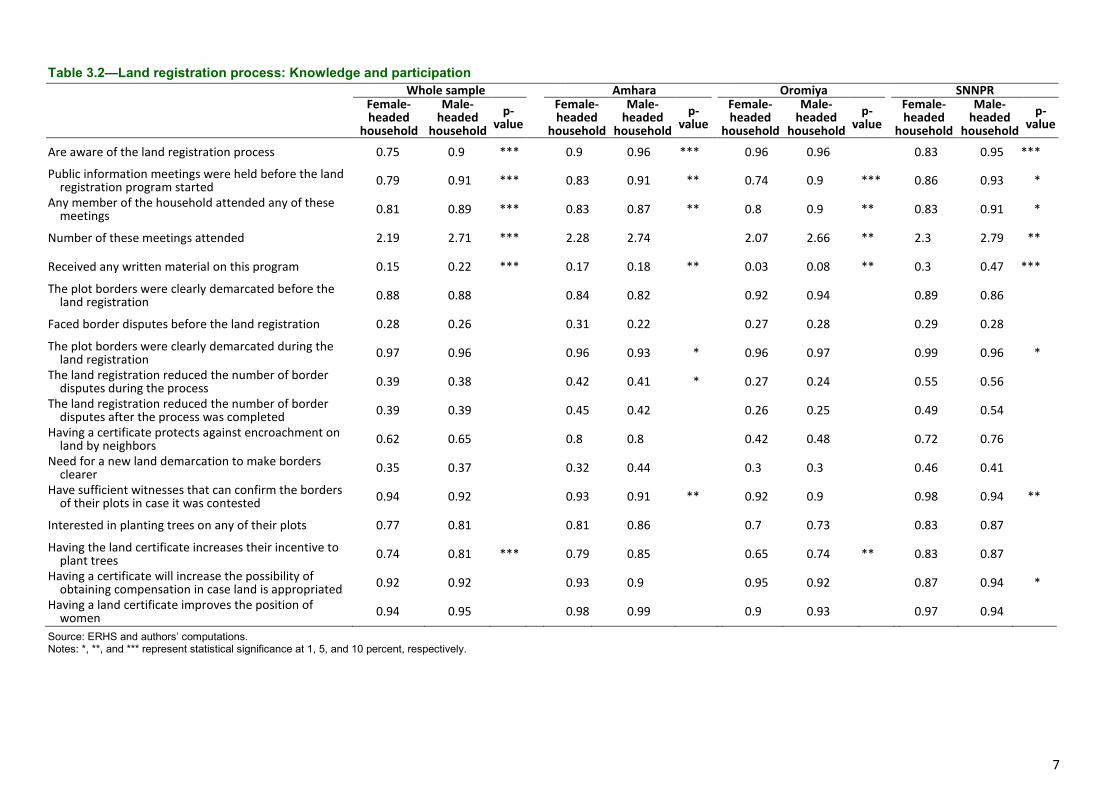
Next, we explore the differences in awareness, participation, and perception of the land registration process between the two types of households, for the entire sample and separately by region (Table 3.2). In Tigray, only about 3 percent of the households in our sample reported any awareness about the land registration process; therefore, we do not have useful estimates of participation by these households.5
3 Having photos instead of signatures may make it more difficult for husbands to sell or rent out land without their wives’ consent; photos are also more
meaningful in a society with very low literacy rates. 4 Some of this may be driven by respondent bias, since the agriculture module of our survey was administered to the household head. 5 While these low numbers may raise doubts about survey implementation, these results are not surprising to those familiar with the land registration
process. The land registration process in Tigray was very rushed and took place without photos, public awareness campaigns, or area measurement. This implies that land records were often out of date and that most of the farmers viewed the land certificate issued by this process as one of many certificates that they might have received in the past. That is, they may not have associated the land certificate they had in their possession with the community land registration effort (Klaus Deininger, personal communication, February 13, 2010).
7
ESSP II WORKING PAPER XX
Table 3.2—Land registration process: Knowledge and participation
Whole sample Amhara Oromiya SNNPR
Female-headed
household
Male-headed
household p-
value Female-headed
household
Male-headed
household p-
value Female-headed
household
Male-headed
household p-
value Female-headed
household
Male- headed
household p-
value
Are aware of the land registration process 0.75 0.9 *** 0.9 0.96 *** 0.96 0.96 0.83 0.95 ***
Public information meetings were held before the land registration program started 0.79 0.91 *** 0.83 0.91 ** 0.74 0.9 *** 0.86 0.93 *
Any member of the household attended any of these meetings 0.81 0.89 *** 0.83 0.87 ** 0.8 0.9 ** 0.83 0.91 *
Number of these meetings attended 2.19 2.71 *** 2.28 2.74 2.07 2.66 ** 2.3 2.79 **
Received any written material on this program 0.15 0.22 *** 0.17 0.18 ** 0.03 0.08 ** 0.3 0.47 ***
The plot borders were clearly demarcated before the land registration 0.88 0.88 0.84 0.82 0.92 0.94 0.89 0.86
Faced border disputes before the land registration 0.28 0.26 0.31 0.22 0.27 0.28 0.29 0.28 The plot borders were clearly demarcated during the
land registration 0.97 0.96 0.96 0.93 * 0.96 0.97 0.99 0.96 *
The land registration reduced the number of border disputes during the process 0.39 0.38 0.42 0.41 * 0.27 0.24 0.55 0.56
The land registration reduced the number of border disputes after the process was completed 0.39 0.39 0.45 0.42 0.26 0.25 0.49 0.54
Having a certificate protects against encroachment on land by neighbors 0.62 0.65 0.8 0.8 0.42 0.48 0.72 0.76
Need for a new land demarcation to make borders clearer 0.35 0.37 0.32 0.44 0.3 0.3 0.46 0.41
Have sufficient witnesses that can confirm the borders of their plots in case it was contested 0.94 0.92 0.93 0.91 ** 0.92 0.9 0.98 0.94 **
Interested in planting trees on any of their plots 0.77 0.81 0.81 0.86 0.7 0.73 0.83 0.87 Having the land certificate increases their incentive to
plant trees 0.74 0.81 *** 0.79 0.85 0.65 0.74 ** 0.83 0.87 Having a certificate will increase the possibility of
obtaining compensation in case land is appropriated 0.92 0.92 0.93 0.9 0.95 0.92 0.87 0.94 *
Having a land certificate improves the position of women 0.94 0.95 0.98 0.99 0.9 0.93 0.97 0.94
Source: ERHS and authors’ computations. Notes: *, **, and *** represent statistical significance at 1, 5, and 10 percent, respectively.
8
Male-headed households were much more likely to have heard of the land registration process. Almost all male-headed households (90 percent) had heard of the process, compared to about three-quarters of female-headed households. There is, however, some regional variation. In Oromiya, female-headed households were just as likely as the male-headed households to have heard about the process. We find that, throughout our survey villages, male-headed house-holds were more aware of public information meetings held before the land registration process, were more likely to have attended such meetings (as well as a greater number of meetings), and were more likely to have received some written material about the program.
Most households acknowledged that their plot boundaries were well demarcated before the land registration process started, and about a quarter to a third of the households reported facing land disputes before the registration process. They perceive the land title as a protection against encroachment and agree that the number of land disputes decreased after the land registration process was complete. In Oromiya, households do not value the title so much as a means of protection against encroachment (42–48 percent, compared to the sample average of 62–65 percent), probably because their plot boundaries were clearly demarcated even before the process was implemented. All households, regardless of the gender of the household head, believe that the title increases their incentive for planting trees (more so for male-headed households) and increases the probability of receiving compensation in case of appropriation. Both male and female household heads also believe that having a land certificate improves the position of women. All in all, the data in Table 3.2 suggest that most households perceive the land registration process as valuable.
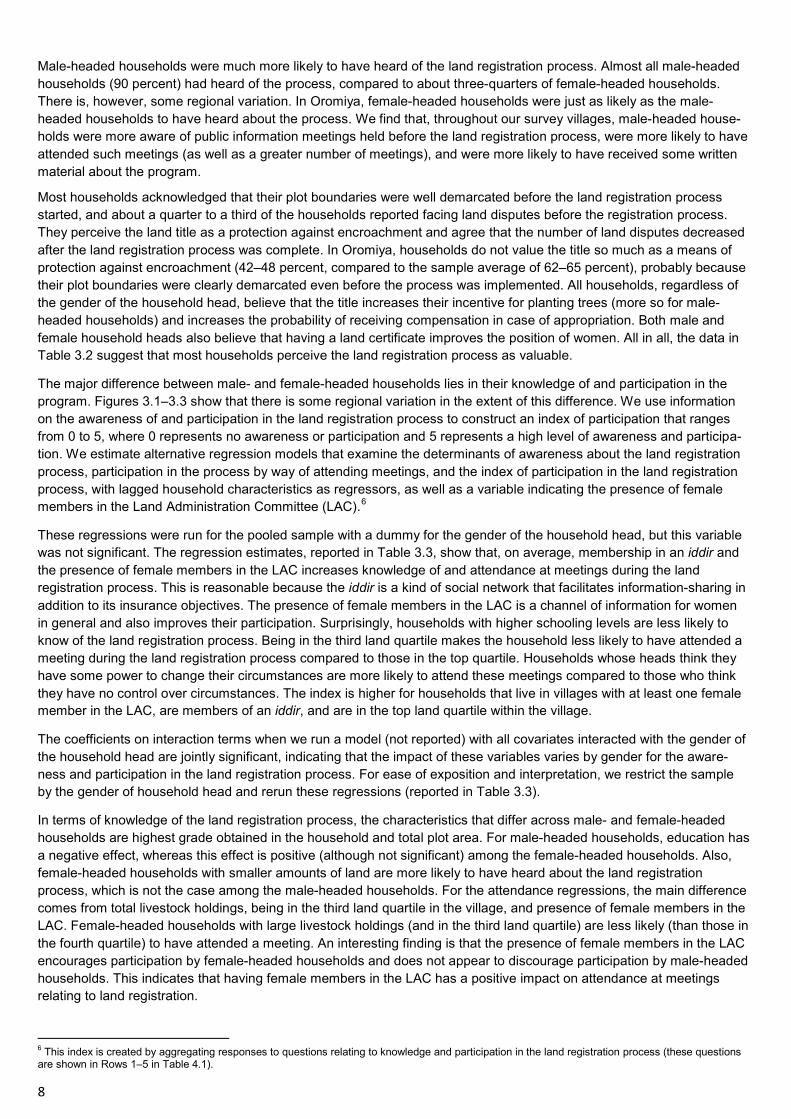
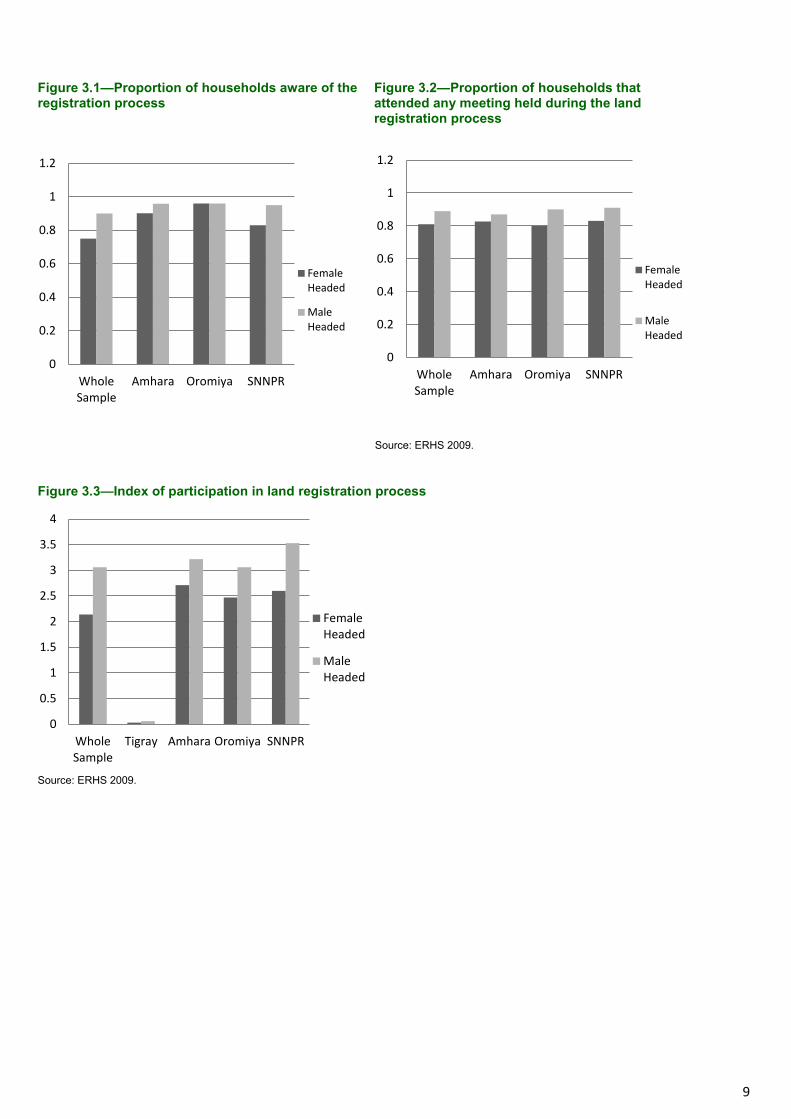
The major difference between male- and female-headed households lies in their knowledge of and participation in the program. Figures 3.1–3.3 show that there is some regional variation in the extent of this difference. We use information on the awareness of and participation in the land registration process to construct an index of participation that ranges from 0 to 5, where 0 represents no awareness or participation and 5 represents a high level of awareness and participa-tion. We estimate alternative regression models that examine the determinants of awareness about the land registration process, participation in the process by way of attending meetings, and the index of participation in the land registration process, with lagged household characteristics as regressors, as well as a variable indicating the presence of female members in the Land Administration Committee (LAC).6
These regressions were run for the pooled sample with a dummy for the gender of the household head, but this variable was not significant. The regression estimates, reported in Table 3.3, show that, on average, membership in an iddir and the presence of female members in the LAC increases knowledge of and attendance at meetings during the land registration process. This is reasonable because the iddir is a kind of social network that facilitates information-sharing in addition to its insurance objectives. The presence of female members in the LAC is a channel of information for women in general and also improves their participation. Surprisingly, households with higher schooling levels are less likely to know of the land registration process. Being in the third land quartile makes the household less likely to have attended a meeting during the land registration process compared to those in the top quartile. Households whose heads think they have some power to change their circumstances are more likely to attend these meetings compared to those who think they have no control over circumstances. The index is higher for households that live in villages with at least one female member in the LAC, are members of an iddir, and are in the top land quartile within the village.
The coefficients on interaction terms when we run a model (not reported) with all covariates interacted with the gender of the household head are jointly significant, indicating that the impact of these variables varies by gender for the aware-ness and participation in the land registration process. For ease of exposition and interpretation, we restrict the sample by the gender of household head and rerun these regressions (reported in Table 3.3).
In terms of knowledge of the land registration process, the characteristics that differ across male- and female-headed households are highest grade obtained in the household and total plot area. For male-headed households, education has a negative effect, whereas this effect is positive (although not significant) among the female-headed households. Also, female-headed households with smaller amounts of land are more likely to have heard about the land registration process, which is not the case among the male-headed households. For the attendance regressions, the main difference comes from total livestock holdings, being in the third land quartile in the village, and presence of female members in the LAC. Female-headed households with large livestock holdings (and in the third land quartile) are less likely (than those in the fourth quartile) to have attended a meeting. An interesting finding is that the presence of female members in the LAC encourages participation by female-headed households and does not appear to discourage participation by male-headed households. This indicates that having female members in the LAC has a positive impact on attendance at meetings relating to land registration.
6 This index is created by aggregating responses to questions relating to knowledge and participation in the land registration process (these questions are shown in Rows 1–5 in Table 4.1).
9
ESSP II WORKING PAPER XX
Figure 3.1—Proportion of households aware of the registration process
Figure 3.2—Proportion of households that attended any meeting held during the land registration process
Source: ERHS 2009.
Figure 3.3—Index of participation in land registration process
Source: ERHS 2009.
0
0.2
0.4
0.6
0.8
1
1.2
WholeSample
Amhara Oromiya SNNPR
FemaleHeaded
MaleHeaded
0
0.5
1
1.5
2
2.5
3
3.5
4
WholeSample
Tigray Amhara Oromiya SNNPR
FemaleHeaded
MaleHeaded
0
0.2
0.4
0.6
0.8
1
1.2
WholeSample
Amhara Oromiya SNNPR
FemaleHeaded
MaleHeaded
10
Table 3.3—Regression results for knowledge and participation in land registration process with village fixed effects
All Male-headed
household Female-headed
household Variables Knowledge Attendance Index Knowledge Attendance Knowledge Attendance (1) (2) (3) (4) (5) (6) (7) Age of household head 0.001 -0.001 -0.006 0.000 -0.001 0.001 -0.000 (0.001) (0.001) (0.007) (0.001) (0.002) (0.001) (0.003) Gender of household head (1 = male, 0 = female) 0.034 0.012 0.236 (0.021) (0.041) (0.197) Number of years of schooling of the head 0.002 0.002 0.005 0.003 0.007 -0.009 -0.018 (0.003) (0.005) (0.032) (0.003) (0.006) (0.014) (0.016) Highest grade obtained in household -0.002 0.011** 0.035 -0.005** 0.008* 0.004 0.018 (0.002) (0.004) (0.025) (0.002) (0.005) (0.005) (0.012) Total plot area in hectares, 2004 survey -0.012** -0.002 -0.075* 0.001 -0.005 -0.013*** 0.037 (0.006) (0.011) (0.045) (0.003) (0.011) (0.004) (0.044) Fraction of total land that is good or medium quality 0.048 0.032 0.008 0.037 0.044 0.082* -0.081 (0.030) (0.058) (0.320) (0.036) (0.065) (0.044) (0.135) Fraction of total land area registered 0.013 0.078 -0.119 -0.035 0.058 0.061 0.104 (0.050) (0.112) (0.612) (0.025) (0.113) (0.117) (0.304) Total livestock holdings, 2004 survey (tropical livestock units) -0.002 -0.004 -0.021 -0.004* 0.001 -0.005 -0.025* (0.002) (0.005) (0.022) (0.002) (0.005) (0.004) (0.013) Dummy for land quartile 1, 2004 survey -0.007 -0.060 -0.730*** 0.011 -0.041 -0.063 -0.134 (0.018) (0.038) (0.200) (0.018) (0.045) (0.055) (0.085) Dummy for land quartile 2, 2004 survey 0.001 -0.035 -0.223 0.010 -0.044 -0.046 -0.096 (0.018) (0.034) (0.196) (0.016) (0.039) (0.055) (0.080) Dummy for land quartile 3, 2004 survey 0.017 -0.057* -0.334* 0.014 -0.026 -0.004 -0.268*** (0.017) (0.032) (0.183) (0.017) (0.035) (0.054) (0.088) Presence of female members in the LAC 0.846*** 0.386 6.871*** 0.893*** 0.154 0.974*** 1.072*** (0.051) (0.273) (0.703) (0.062) (0.386) (0.077) (0.187) Household head perceives to have some power to change the course of his/her life 0.001 0.122** 0.306 0.015 0.110* -0.029 0.171** (0.021) (0.053) (0.225) (0.022) (0.067) (0.038) (0.086) Household head perceives to have a lot of power to change the course of his/her life 0.005 0.072 0.225 0.015 0.056 0.003 0.145* (0.019) (0.054) (0.226) (0.021) (0.067) (0.035) (0.086) Member of an iddir, 2004 survey 0.086** 0.101 0.824*** 0.062 0.072 0.066 0.211 (0.039) (0.074) (0.279) (0.045) (0.086) (0.056) (0.163) Network size, 2004 survey -0.000 -0.001 -0.003 -0.000 -0.000 0.002 0.002 (0.000) (0.001) (0.004) (0.000) (0.001) (0.002) (0.006) Household member has a bank account 0.013 -0.000 0.455 0.024 -0.044 0.012 -0.018 (0.023) (0.056) (0.328) (0.027) (0.069) (0.035) (0.135) Observations 1,017 773 1,018 708 588 309 185 R-squared 0.751 0.127 0.741 0.114 0.799 0.353 Source: ERHS 2009 and authors’ computation. Notes: *, **, and *** represent statistical significance at 1, 5, and 10 percent, respectively. Number of observations in columns 1-3 represent the sample for which we have all set of covariates and outcome variables. Column 2 has fewer observations than columns 1 and 3 because the outcome variable—attendance—is defined conditional on knowledge. Number of observations in columns 4(6) and 5(7) represent the male- (female-) headed households in the sample.
11
ESSP II WORKING PAPER XX
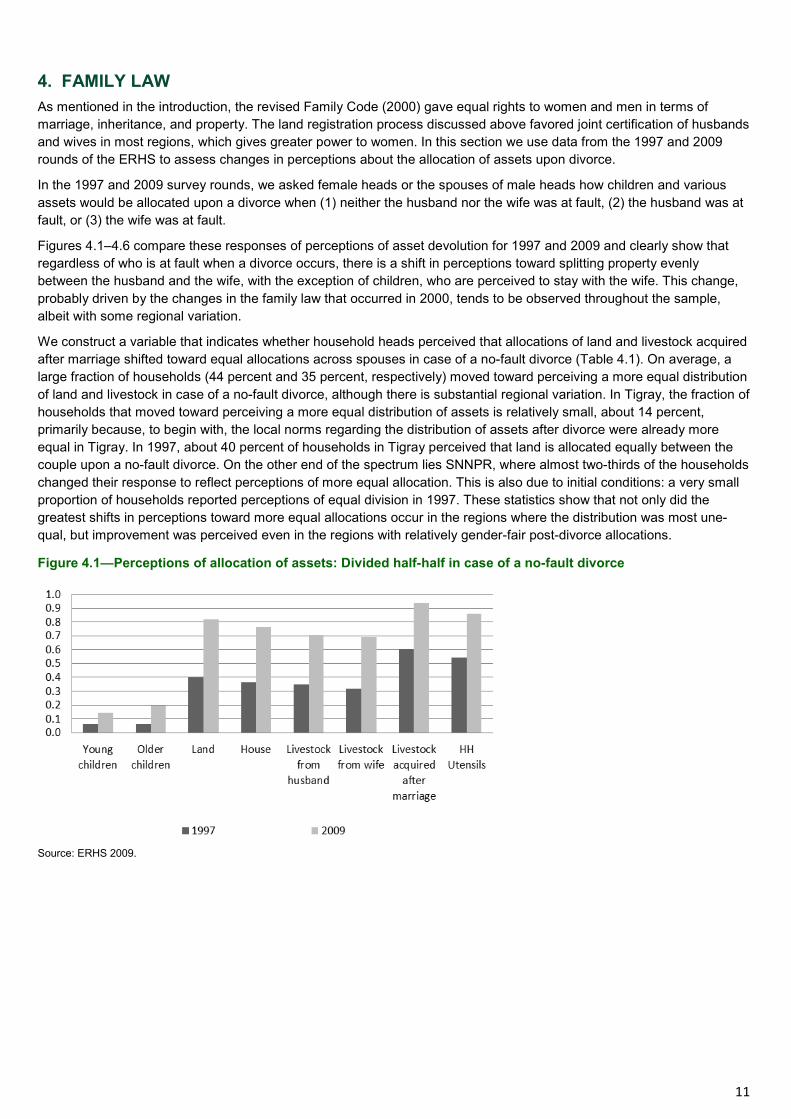
4. FAMILY LAW As mentioned in the introduction, the revised Family Code (2000) gave equal rights to women and men in terms of marriage, inheritance, and property. The land registration process discussed above favored joint certification of husbands and wives in most regions, which gives greater power to women. In this section we use data from the 1997 and 2009 rounds of the ERHS to assess changes in perceptions about the allocation of assets upon divorce.
In the 1997 and 2009 survey rounds, we asked female heads or the spouses of male heads how children and various assets would be allocated upon a divorce when (1) neither the husband nor the wife was at fault, (2) the husband was at fault, or (3) the wife was at fault.
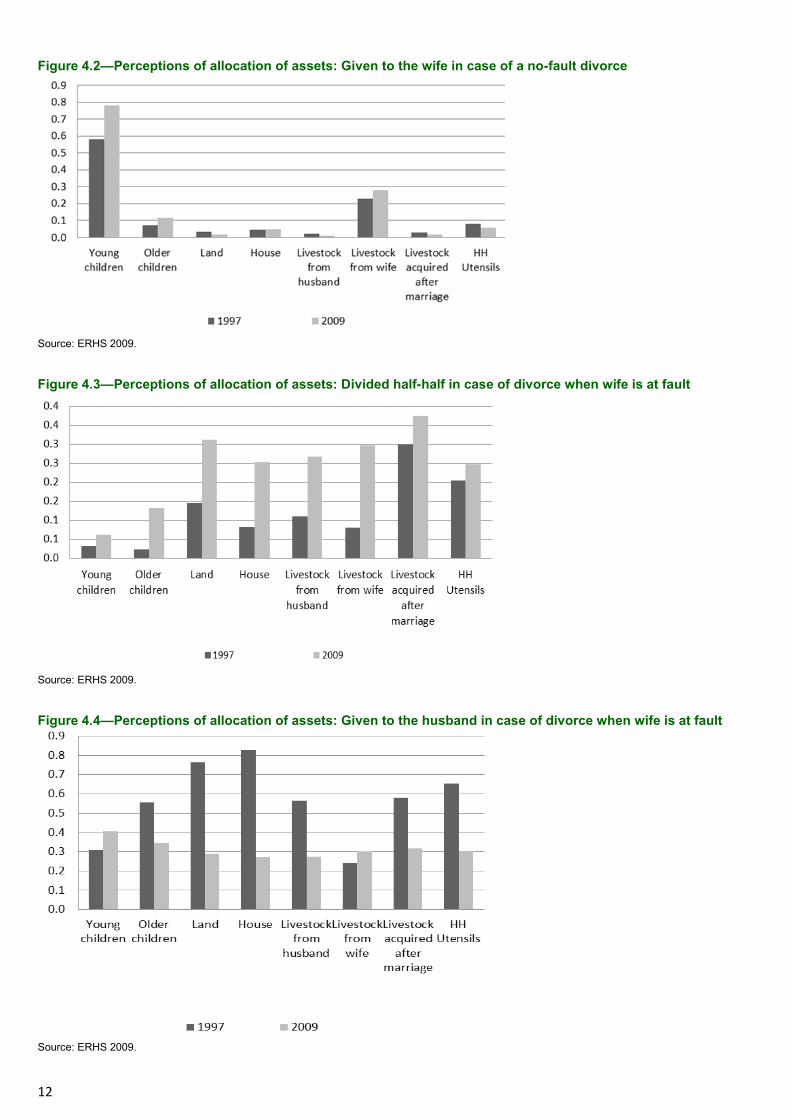
Figures 4.1–4.6 compare these responses of perceptions of asset devolution for 1997 and 2009 and clearly show that regardless of who is at fault when a divorce occurs, there is a shift in perceptions toward splitting property evenly between the husband and the wife, with the exception of children, who are perceived to stay with the wife. This change, probably driven by the changes in the family law that occurred in 2000, tends to be observed throughout the sample, albeit with some regional variation.
We construct a variable that indicates whether household heads perceived that allocations of land and livestock acquired after marriage shifted toward equal allocations across spouses in case of a no-fault divorce (Table 4.1). On average, a large fraction of households (44 percent and 35 percent, respectively) moved toward perceiving a more equal distribution of land and livestock in case of a no-fault divorce, although there is substantial regional variation. In Tigray, the fraction of households that moved toward perceiving a more equal distribution of assets is relatively small, about 14 percent, primarily because, to begin with, the local norms regarding the distribution of assets after divorce were already more equal in Tigray. In 1997, about 40 percent of households in Tigray perceived that land is allocated equally between the couple upon a no-fault divorce. On the other end of the spectrum lies SNNPR, where almost two-thirds of the households changed their response to reflect perceptions of more equal allocation. This is also due to initial conditions: a very small proportion of households reported perceptions of equal division in 1997. These statistics show that not only did the greatest shifts in perceptions toward more equal allocations occur in the regions where the distribution was most une-qual, but improvement was perceived even in the regions with relatively gender-fair post-divorce allocations.
Figure 4.1—Perceptions of allocation of assets: Divided half-half in case of a no-fault divorce
Source: ERHS 2009.
12
Figure 4.2—Perceptions of allocation of assets: Given to the wife in case of a no-fault divorce
Source: ERHS 2009.
Figure 4.3—Perceptions of allocation of assets: Divided half-half in case of divorce when wife is at fault
Source: ERHS 2009.
Figure 4.4—Perceptions of allocation of assets: Given to the husband in case of divorce when wife is at fault
Source: ERHS 2009.

13
ESSP II WORKING PAPER XX
Figure 4.5—Perceptions of allocation of assets: Divided half-half in case of divorce when husband is at fault
Source: ERHS 2009.
Figure 4.6—Perceptions of allocation of assets: Given to the wife in case of divorce when husband is at fault
Source: ERHS 2009.
Table 4.1—Summary statistics: Changes in perceptions regarding allocation of land and livestock upon divorce, 1997–2009
Percentage of households whose perceptions shifted toward All Female-headed
household
Male-headed
household Equal allocation of land upon a no-fault divorce 44 40 46 Equal allocation of livestock acquired after marriage upon a no-
fault divorce 35 34 36 Tigray Equal allocation of land upon a no-fault divorce 13 17 7 Equal allocation of livestock acquired after marriage upon a no-
fault divorce 14 18 9 Amhara Equal allocation of land upon a no-fault divorce 30 33 28 Moved toward equal allocation of livestock acquired after
marriage upon a no-fault divorce 21 24 20 Oromiya Equal allocation of land upon a no-fault divorce 52 48 54 Equal allocation of livestock acquired after marriage upon a no-
fault divorce 35 33 36 SNNPR Equal allocation of land upon a no-fault divorce 62 54 66 Equal allocation of livestock acquired after marriage upon a no-
fault divorce 58 61 57
Source: ERHS and authors’ computation.
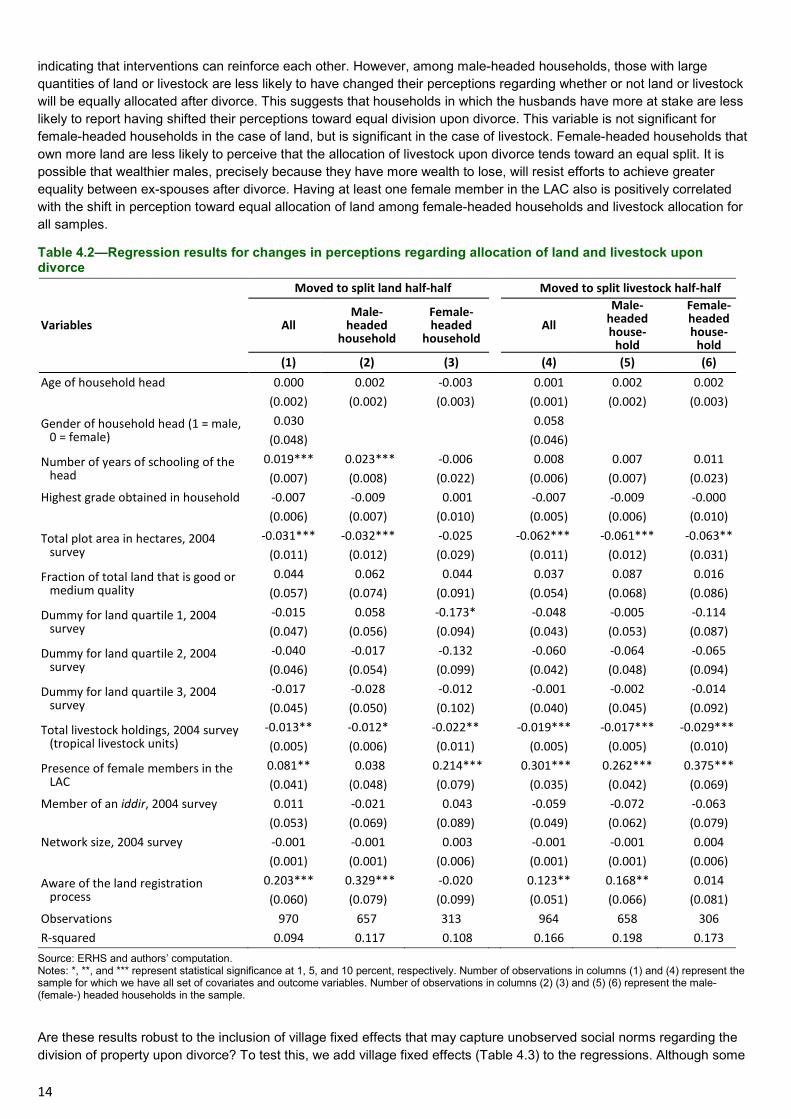
Regression results (Table 4.2) show that awareness about the land registration process is positively correlated with the shift in perceptions toward equal division of land and livestock upon divorce, especially for male-headed households,
14
indicating that interventions can reinforce each other. However, among male-headed households, those with large quantities of land or livestock are less likely to have changed their perceptions regarding whether or not land or livestock will be equally allocated after divorce. This suggests that households in which the husbands have more at stake are less likely to report having shifted their perceptions toward equal division upon divorce. This variable is not significant for female-headed households in the case of land, but is significant in the case of livestock. Female-headed households that own more land are less likely to perceive that the allocation of livestock upon divorce tends toward an equal split. It is possible that wealthier males, precisely because they have more wealth to lose, will resist efforts to achieve greater equality between ex-spouses after divorce. Having at least one female member in the LAC also is positively correlated with the shift in perception toward equal allocation of land among female-headed households and livestock allocation for all samples.
Table 4.2—Regression results for changes in perceptions regarding allocation of land and livestock upon divorce Moved to split land half-half Moved to split livestock half-half
Variables All Male-
headed household
Female-headed
household All
Male-headed house-
hold
Female-headed house-
hold (1) (2) (3) (4) (5) (6) Age of household head 0.000 0.002 -0.003 0.001 0.002 0.002 (0.002) (0.002) (0.003) (0.001) (0.002) (0.003)
Gender of household head (1 = male, 0 = female)
0.030 0.058 (0.048) (0.046)
Number of years of schooling of the head
0.019*** 0.023*** -0.006 0.008 0.007 0.011 (0.007) (0.008) (0.022) (0.006) (0.007) (0.023)
Highest grade obtained in household -0.007 -0.009 0.001 -0.007 -0.009 -0.000 (0.006) (0.007) (0.010) (0.005) (0.006) (0.010)
Total plot area in hectares, 2004 survey
-0.031*** -0.032*** -0.025 -0.062*** -0.061*** -0.063** (0.011) (0.012) (0.029) (0.011) (0.012) (0.031)
Fraction of total land that is good or medium quality
0.044 0.062 0.044 0.037 0.087 0.016 (0.057) (0.074) (0.091) (0.054) (0.068) (0.086)
Dummy for land quartile 1, 2004 survey
-0.015 0.058 -0.173* -0.048 -0.005 -0.114 (0.047) (0.056) (0.094) (0.043) (0.053) (0.087)
Dummy for land quartile 2, 2004 survey
-0.040 -0.017 -0.132 -0.060 -0.064 -0.065 (0.046) (0.054) (0.099) (0.042) (0.048) (0.094)
Dummy for land quartile 3, 2004 survey
-0.017 -0.028 -0.012 -0.001 -0.002 -0.014 (0.045) (0.050) (0.102) (0.040) (0.045) (0.092)
Total livestock holdings, 2004 survey (tropical livestock units)
-0.013** -0.012* -0.022** -0.019*** -0.017*** -0.029*** (0.005) (0.006) (0.011) (0.005) (0.005) (0.010)
Presence of female members in the LAC
0.081** 0.038 0.214*** 0.301*** 0.262*** 0.375*** (0.041) (0.048) (0.079) (0.035) (0.042) (0.069)
Member of an iddir, 2004 survey 0.011 -0.021 0.043 -0.059 -0.072 -0.063 (0.053) (0.069) (0.089) (0.049) (0.062) (0.079) Network size, 2004 survey -0.001 -0.001 0.003 -0.001 -0.001 0.004 (0.001) (0.001) (0.006) (0.001) (0.001) (0.006)
Aware of the land registration process
0.203*** 0.329*** -0.020 0.123** 0.168** 0.014 (0.060) (0.079) (0.099) (0.051) (0.066) (0.081)
Observations 970 657 313 964 658 306 R-squared 0.094 0.117 0.108 0.166 0.198 0.173
Source: ERHS and authors’ computation. Notes: *, **, and *** represent statistical significance at 1, 5, and 10 percent, respectively. Number of observations in columns (1) and (4) represent the sample for which we have all set of covariates and outcome variables. Number of observations in columns (2) (3) and (5) (6) represent the male- (female-) headed households in the sample.
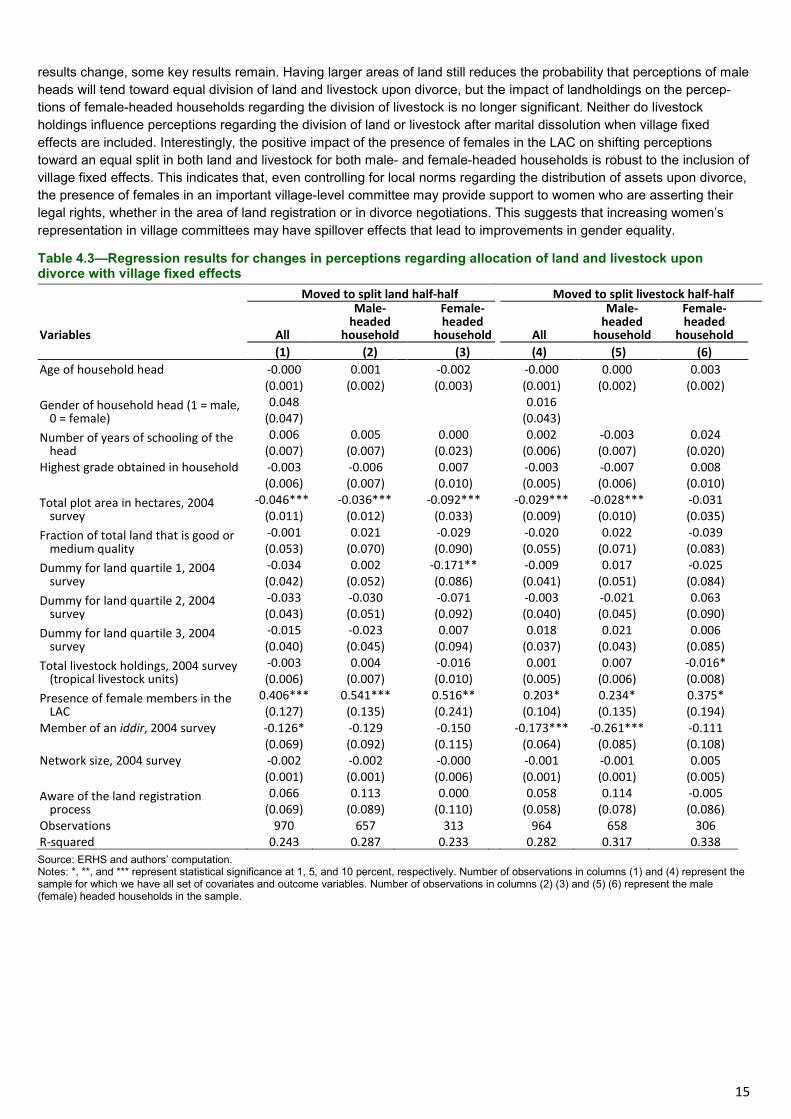
Are these results robust to the inclusion of village fixed effects that may capture unobserved social norms regarding the division of property upon divorce? To test this, we add village fixed effects (Table 4.3) to the regressions. Although some
15
ESSP II WORKING PAPER XX
results change, some key results remain. Having larger areas of land still reduces the probability that perceptions of male heads will tend toward equal division of land and livestock upon divorce, but the impact of landholdings on the percep-tions of female-headed households regarding the division of livestock is no longer significant. Neither do livestock holdings influence perceptions regarding the division of land or livestock after marital dissolution when village fixed effects are included. Interestingly, the positive impact of the presence of females in the LAC on shifting perceptions toward an equal split in both land and livestock for both male- and female-headed households is robust to the inclusion of village fixed effects. This indicates that, even controlling for local norms regarding the distribution of assets upon divorce, the presence of females in an important village-level committee may provide support to women who are asserting their legal rights, whether in the area of land registration or in divorce negotiations. This suggests that increasing women’s representation in village committees may have spillover effects that lead to improvements in gender equality.
Table 4.3—Regression results for changes in perceptions regarding allocation of land and livestock upon divorce with village fixed effects Moved to split land half-half Moved to split livestock half-half
Variables All
Male-headed
household
Female-headed
household
All
Male-headed
household
Female-headed
household (1) (2) (3) (4) (5) (6) Age of household head -0.000 0.001 -0.002 -0.000 0.000 0.003 (0.001) (0.002) (0.003) (0.001) (0.002) (0.002) Gender of household head (1 = male,
0 = female) 0.048 0.016
(0.047) (0.043) Number of years of schooling of the
head 0.006 0.005 0.000 0.002 -0.003 0.024
(0.007) (0.007) (0.023) (0.006) (0.007) (0.020) Highest grade obtained in household -0.003 -0.006 0.007 -0.003 -0.007 0.008 (0.006) (0.007) (0.010) (0.005) (0.006) (0.010) Total plot area in hectares, 2004
survey -0.046*** -0.036*** -0.092*** -0.029*** -0.028*** -0.031
(0.011) (0.012) (0.033) (0.009) (0.010) (0.035) Fraction of total land that is good or
medium quality -0.001 0.021 -0.029 -0.020 0.022 -0.039 (0.053) (0.070) (0.090) (0.055) (0.071) (0.083)
Dummy for land quartile 1, 2004 survey
-0.034 0.002 -0.171** -0.009 0.017 -0.025 (0.042) (0.052) (0.086) (0.041) (0.051) (0.084)
Dummy for land quartile 2, 2004 survey
-0.033 -0.030 -0.071 -0.003 -0.021 0.063 (0.043) (0.051) (0.092) (0.040) (0.045) (0.090)
Dummy for land quartile 3, 2004 survey
-0.015 -0.023 0.007 0.018 0.021 0.006 (0.040) (0.045) (0.094) (0.037) (0.043) (0.085)
Total livestock holdings, 2004 survey (tropical livestock units)
-0.003 0.004 -0.016 0.001 0.007 -0.016* (0.006) (0.007) (0.010) (0.005) (0.006) (0.008)
Presence of female members in the LAC
0.406*** 0.541*** 0.516** 0.203* 0.234* 0.375* (0.127) (0.135) (0.241) (0.104) (0.135) (0.194)
Member of an iddir, 2004 survey -0.126* -0.129 -0.150 -0.173*** -0.261*** -0.111 (0.069) (0.092) (0.115) (0.064) (0.085) (0.108) Network size, 2004 survey -0.002 -0.002 -0.000 -0.001 -0.001 0.005 (0.001) (0.001) (0.006) (0.001) (0.001) (0.005) Aware of the land registration
process 0.066 0.113 0.000 0.058 0.114 -0.005
(0.069) (0.089) (0.110) (0.058) (0.078) (0.086) Observations 970 657 313 964 658 306 R-squared 0.243 0.287 0.233 0.282 0.317 0.338 Source: ERHS and authors’ computation. Notes: *, **, and *** represent statistical significance at 1, 5, and 10 percent, respectively. Number of observations in columns (1) and (4) represent the sample for which we have all set of covariates and outcome variables. Number of observations in columns (2) (3) and (5) (6) represent the male (female) headed households in the sample.

16
5. SUMMARY AND POLICY IMPLICATIONS Ethiopia has recently implemented a land registration process that has increased tenure security among women and, if implemented properly, can have even greater impacts. Our analysis confirms previous studies’ findings of gender gaps in awareness and information about the process. In particular, we find that male-headed households are, on average, more likely to have heard about the land registration process, to have attended meetings (and a greater number of meetings), and to have received some written material with information about the process. An interesting finding is that the presence of female members in the LAC encourages participation by female-headed households and does not discourage partici-pation by male-headed households. This indicates that having female members in the LAC has a positive impact on attendance at meetings relating to land registration.
In our analysis of the changes in the family law, we find that awareness about the land registration process is positively correlated with the shift in perceptions toward equal division of land and livestock upon divorce. This is especially true for male-headed households, indicating that interventions to improve gender equality can reinforce each other. The pres-ence of female members in the LAC has a positive effect on the shift in perceptions toward a more equal distribution of assets upon divorce. This effect is robust to inclusion of village fixed effects, which implies that even after controlling for local norms regarding the distribution of assets upon divorce, the presence of females in an important village-level committee may provide support to women and also may be a source of information regarding the new Family Code.
Taken together, these findings suggest that the land registration process and the reform of the Family Code may have mutually reinforcing effects on women’s rights and welfare. While this example is obviously rooted in the Ethiopian context, it raises the possibility that similar reform efforts may be complementary in other countries as well. Given the potential gains derived from eliminating the gender gap in access to assets and resources (FAO 2011; World Bank 2011, exploiting complementarities in the reform process may be an untapped opportunity to accelerate progress in closing the gender gap worldwide.
REFERENCES Banerjee, A., P. Gertler, and M. Ghatak. 2002. “Empowerment and Efficiency: Tenancy Reform in West Bengal.” Journal
of Political Economy 110 (2): 239–280.
Bardhan, P., and D. Mookherjee. 2009. “Productivity Effects of Land Reform: A Study of Disaggregated Farm Data in West Bengal, India.” Mimeo, Boston University, Boston.
Deininger, K., D. A. Ali, S. Holden, and J. Zevenbergen. 2007. Rural Land Certification in Ethiopia: Process, Initial Impact, and Implications for Other African Countries. World Bank Policy Research Working Paper 4218. Washing-ton, DC: World Bank.
Dercon, S., and P. Krishnan. 2000. “In Sickness and in Health: Risk Sharing within Households in Rural Ethiopia.” Journal of Political Economy 108 (4): 688–727.
Fafchamps, M., and A. Quisumbing. 2005. “Assets at Marriage in Rural Ethiopia.” Journal of Development Economics 77 (1): 1–25.
Fafchamps, M., B. Kebede, and A. Quisumbing. 2009. “Intrahousehold Welfare in Rural Ethiopia.” Oxford Bulletin of Economics and Statistics 71 (4): 567–599.
FAO (Food and Agriculture Organization of the United Nations). 2011. State of Food and Agriculture 2010–2011: Women in Agriculture—Closing the Gender Gap for Development. Rome: FAO.
Feder, G., and A. Nishio. 1997. The Benefits of Land Registration and Titling: Economic and Social Perspectives. Washington, DC: World Bank.
Feder, G., T. Onchan, Y. Chamlamwong, and C. Hongladarom. 1988. Land Policies and Farm Productivity in Thailand. Baltimore: Johns Hopkins University Press.
Federal Negarit Gazetta. 2000. No. 1/2000. Extra Ordinary Issue. The Revised Family Code Proclamation No. 213/2000.
Frank, E. 1999. Gender, Agricultural Development and Food Security in Amhara, Ethiopia: The Contested Identity of Women Farmers in Ethiopia. Addis Ababa: United States Agency for International Development.
Goldstein, M., and C. Udry. 2008. “The Profits of Power: Land Rights and Agricultural Investment in Ghana.” Journal of Political Economy 116 (6): 981–1022.
17
ESSP II WORKING PAPER XX
Gopal, G. 2001. “Law and Legal Reform.” In Empowering Women to Achieve Food Security, edited by A. R. Quisumbing and R. S. Meinzen-Dick. 2020 FOCUS. Washington, DC: International Food Policy Research Institute.
Hallward-Driemeier, M., and O. Gajigo. 2011. “Strengthening Economic Rights and Women’s Occupational Choice: The Impact of Reforming Ethiopia’s Family Law.” Paper presented at the Centre for Study of African Economies 25th Anniversary Conference 2011: Economic Development in Africa, Oxford, UK.
Hoddinott, J., and C. Adam. 1997. Testing Nash Bargaining Household Models with Time Series Data: Divorce Law Reform and Female Suicide in Canada. Economic Series Working Paper 99191. Oxford, UK: University of Oxford.
Holden, S., and M. Bezabih. 2009 “Gender and Land Productivity on Rented Land in Ethiopia.” In The Emergence of Land Markets in Africa: Impacts on Poverty and Efficiency, edited by S. Holden, K. Otsuka, and F. Place. Washing-ton, DC: Resources for the Future.
Holden, S., and T. Tefera. 2008. “From Being Property of Men to Becoming Equal Owners? Early Impacts of Land Registration and Certification on Women in Southern Ethiopia.” Research report prepared for UN-Habitat, Shelter Branch, Land Tenure and Property Administration Section. UN-Habitat, Nairobi, Kenya.
Holden, S., K. Deininger, and H. Ghebru. 2007. “Impact of Land Certification on Land Rental Market Participation in Tigray Region, Northern Ethiopia.” Paper presented at the Nordic Development Economics Conference, Copenha-gen, Denmark, June 18–19. Also Munich Personal RePEc Archive Paper 5211, Munich University Library.
Ibrahim, S., and S. Alkire. 2007. “Agency and Empowerment: A Proposal for Internationally Comparable Indicators.” Oxford Development Studies 35 (4): 379–403.
Jansen, K., and E. Roquas. 1998. “Modernizing Insecurity: The Land Titling Project in Honduras.” Development and Change 29 (1): 81–106.
Kabeer, N. 2001. “Reflections on the Measurement of Women’s Empowerment: Theory and Practice.” In Discussing Women’s Empowerment: Theory and Practice, edited by A. Sisask, 17–54. Stockholm, Norway: Novum Grafiska AB.
Quisumbing, A., R. Meinzen-Dick, T. Raney, A. Croppenstedt, J. A. Behrman, and A. Peterman, editors. 2012. Gender in Agriculture and Food Security: Closing the Knowledge Gap. Rome: Springer and Food and Agriculture Organization of the United Nations, forthcoming.
Smith, L. C., U. Ramakrishnan, A. Ndiaye, L. Haddad, and R. Martorell. 2003. The Importance of Women’s Status for Child Nutrition in Developing Countries. Research Report 131. Washington, DC: International Food Policy Research Institute.
Webb, P., J. von Braun, and Y. Yohannes. 1992. Famine in Ethiopia: Policy Implications of Coping Failure at National and Household Levels. Research Report 92. Washington, DC: International Food Policy Research Institute.
World Bank. 2011. World Development Report 2012: Gender Equality and Development. Washington DC.
18
INTERNATIONAL FOOD POLICY RESEARCH INSTITUTE 2033 K Street, NW | Washington, DC 20006-1002 USA | T: +1.202.862.5600 | F: +1.202.457.4439 | Skype: ifprihomeoffice | [email protected] | www.ifpri.org
IFPRI–ESSP II ADDIS ABABA P.O. Box 5689, Addis Ababa, Ethiopia | T: +251.11.617.2000 | F: +251.11.646.2318 | [email protected] | http://essp.ifpri.info
ETHIOPIAN DEVELOPMENT RESEARCH INSTITUTE P.O. Box 2479, Addis Ababa, Ethiopia | T: +251.11.550.6066 ; +251.11.553.8633 | F: +251.11.550.5588 | [email protected] | www.edri-eth.org
This Working Paper has been prepared as an ESSP II output, and has not been peer reviewed. Any opinions stated herein are those of the author(s) and do not necessarily reflect the policies or opinions of IFPRI.
Copyright © 2012, International Food Policy Research Institute. All rights reserved. To obtain permission to republish, contact [email protected].
Acknowledgements This research was supported by the Swiss Development Corporation and the International Food Policy Research Institute Strategic Initiative on Gender and Assets. We thank Klaus Deininger, John Hoddinott, and Stein Holden for helpful discussions on the design of survey modules related to land registration and family law. We also thank participants at the Ethiopian Rural Household Survey Workshop at Lalibela, with special thanks to Paul Dorosh, Alemayehu Seyoum Taffesse, Stefan Dercon, Valerie Mueller, and Tassew Woldehanna. All errors and omissions are our own.
About ESSP II The Ethiopia Strategy Support Program II is an initiative to strengthen evidence-based policymaking in Ethiopia in the areas of rural and agricultural development. Facilitated by the International Food Policy Research Institute (IFPRI), ESSP II works closely with the government of Ethiopia, the Ethiopian Development Research Institute (EDRI), and other development partners to provide information relevant for the design and implementation of Ethiopia’s agricultural and rural development strategies. For more information, see http://www.ifpri.org/book-757/ourwork/program/ethiopia-strategy-support-program or http://essp.ifpri.info/ or http://www.edri.org.et/.
About these working papers The ESSP Working Papers contain preliminary material and research results from IFPRI and/or its partners in Ethiopia. The papers are not subject to a formal peer review. They are circulated in order to stimulate discussion and critical comment. The opinions are those of the authors and do not necessarily reflect those of their home institutions or supporting organizations.