policy recommendations for childhood obesity (final)
TRANSCRIPT

9/2/2010
1
Childhood obesity is now considered a national epidemic. There are numerous contributing
2
There are numerous contributing factors. Schools are one avenue to address childhood obesity. They play a critical role in promoting healthy environments to support healthy choices and lifestyles.

9/2/2010
2
3
4

9/2/2010
3
National Survey of Children’s Health: 30.9% of Virginia youth (10 – 17) overweight or obese
Virginia Foundation for Healthy Youth - 22% of Virginian children overweight or obese
5
6

9/2/2010
4
High
er
DiabetesHigh blood pressureOsteo-arthritisAdult overweightSleep disordersAbsenteeism at schoolFeelings of isolation
Self-esteemPerceived quality of life
Low
er
7
Estimated medical expenses attributed to obesity (for adults): $1.47 billion per year.
Overweight/obese children more likely to participate in more primary care sick visits and mental health-related visits over 1-yearCost: approx. $72 more per year than a healthy weight child
(Finkelstein, 2009; Estabrooks, 2007)
8

9/2/2010
5
9
Community, demographic, and societal characteristics
Parenting styles and family characteristics
Contributors to Childhood Obesity
Peer and sibling interactions
Child feeding ti
Socioeconomic status
EthnicitySchool environment &
policies – foods, drinks, nutrition
d tiChild characteristics and child risk factors
CHILD WEIGHT STATUS
interactions
Family TV viewing
Parent monitoring of
child TV viewing
Parent preference for activityParent dietary
intake
Nutritional knowledge
Types of foods available in the
home
practices
Age
SEDENTARY BEHAVIOR
PHYSICAL ACTIVITYFamilial
susceptibility to
DIETARY INTAKE
Gender
School physical
education
Crime rates and
neighborhood safety
education, physical
education
Work hours
Knowledge & Attitudes
Adapted from: Davison & Birch. 2001
Parent activity patterns
Parent encouragement of
child activityParent weight
status
Parent food preferences
p yweight gain
Accessibility of convenience foods and restaurants
Family leisure time activity
Leisure time
Accessibility of recreational
facilities
10

9/2/2010
6
Daily calories from sugar sweetened beverages increased:increased:› 55 kcal in 1965› 204 kcal in 1999-2004
Strong link between sweetened beverages (soda, soft drink, fruit drink, etc.), especially sugar-sweetened, and:g› Dental caries› Increase in overall calories› Weight status
11
The CDC has identified 6 evidence-based t t i f ti
12
strategies for preventing and reducing overweight and obesity.
“Decreasing the consumption of sugar-sweetened beverages.”
One of the only consistent behaviors linked to weight
9/2/2010
7
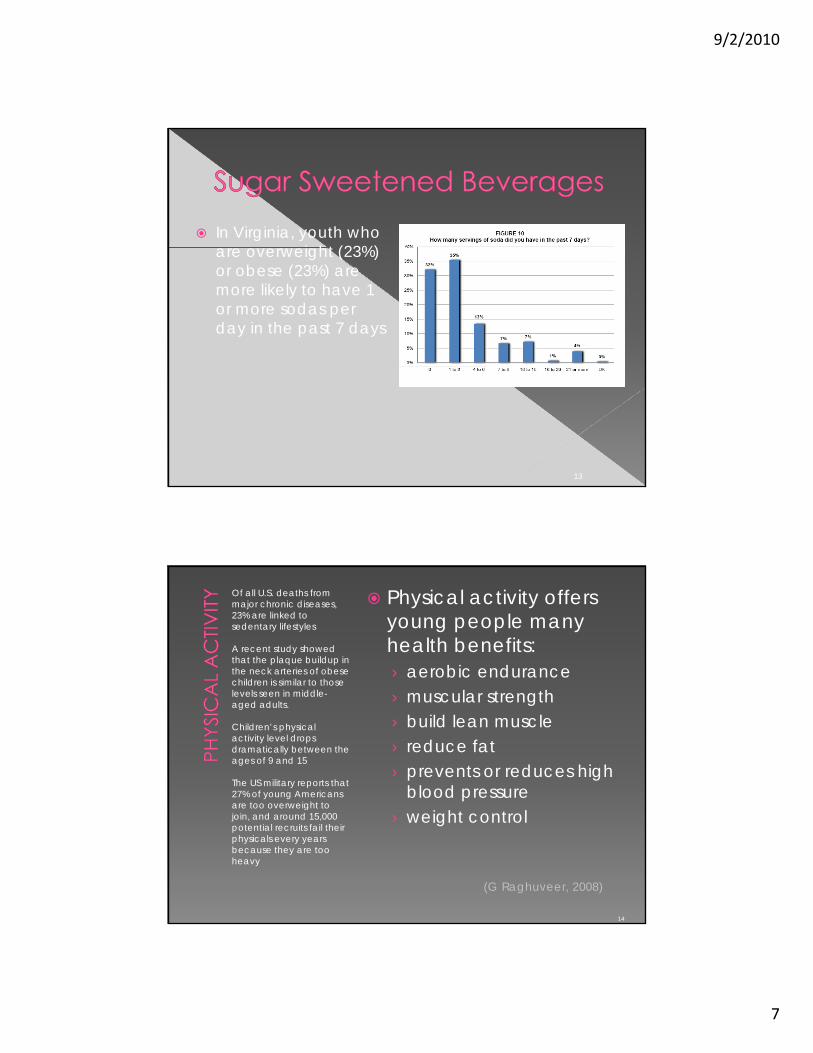
In Virginia, youth who i ht (23%) are overweight (23%)
or obese (23%) are more likely to have 1 or more sodas per day in the past 7 days
13
Of all U.S. deaths from major chronic diseases, 23% are linked to sedentary lifestyles
A recent study showed that the plaque buildup in the neck arteries of obese children is similar to those
Physical activity offers young people many health benefits:› aerobic endurance
children is similar to those levels seen in middle-aged adults.
Children’s physical activity level drops dramatically between the ages of 9 and 15
The US military reports that 27% of young Americans are too overweight to
› muscular strength› build lean muscle› reduce fat› prevents or reduces high
blood pressureare too overweight to join, and around 15,000 potential recruits fail their physicals every years because they are too heavy
› weight control
(G Raghuveer, 2008)
14

9/2/2010
8
ighe
r Rat
es
Academic achievementCognitive ability
Hte
s
AbsenteeismInsomniaDepression
Low
er R
at DepressionAnxiety
(Active Living Research, 2009; Shore, et al., 2008; Geier & coll., 2007)
15
Daily physical education only offered by:› 3 8% of elementary schools› 3.8% of elementary schools› 7.9% of middle schools› 2.1% of high schools › 22% do not require students to take ANY P.E. Regular participation in physical ed cation classes helps red ce obesit education classes helps reduce obesity in low-income teenagers
(CDC, 2006; Madsen KA. et al., 2009)
16

9/2/2010
9
It is recommended that children engage in at least 60 i t f d t t
17
60 minutes of moderate to vigorous physical activity each day.
30 minutes at school is reasonable .
The national The national recommendation for PE is 150 minutes per week for elementary and 225 minutes for middle and high schools.
(Geier, 2007)
34% not active most d f th kdays of the weekBoys and young men (37%) more likely to have been active compared to girls and young women (26%)women (26%)
18

9/2/2010
10
19
20

9/2/2010
11
Significant power to influence health decisionsKids’ “work” and social worldOpportunity to guide and shape healthy eating and shape healthy eating and physical activity habits for a lifetime
21
Required that each local school division participating
22
in the USDA school breakfast and lunch program adopt a local (school) wellness policy to address five areas:
1. School foods2. Physical educationy3. Physical activity4. Nutrition education5. School wellness

9/2/2010
12
Proposed Policy (2006)/Actual Policy
(2007)
Planned2006n=81(%)
Recommendation(%)
SpecificRecommendation
(%)
Requirement(%)
SpecificRequirement
(%)
Total # of School Divisions with Req.
or Rec. (%)
Classroom Teaching 74 (91.3) 4 (5.4) 0 53 (71.6) 3 (4.1) 60 (81.1)Teacher Training 48 (59.2) 2 (4.1) 0 28 (58.3) 0 30 (62.5)
Education & Marketing 68 (83.9) 3 (4.4) 0 38 (55.8) 3 (4.4) 44 (64.7)Nutritional Guidelines for
Foods and Beverages68 (84.0) 2 (2.9) 0 39 (48.1) 13 (19.1) 54 (79.4)
Portion Size 42 (51.9) 0 1 (2.4) 5 (11.9) 4 (9.5) 10 (23.8)Portion Size 42 (51.9) 0 1 (2.4) 5 (11.9) 4 (9.5) 10 (23.8)A-la-carte and Vending 60 (74.0) 11 (18.3) 3 (5.0) 8 (13.3) 18 (30.0) 40 (66.7)
After School Parties 25 (30.9) 6 (24.0) 4 (16.0) 0 2 (8.0) 12 (48.0)Celebrations 42 (51.9) 13 (31.0) 8 (19.0) 0 4 (9.5) 25 (59.5)
Food As Rewards 43 (53.1) 6 (14.0) 4 (9.3) 8 (18.6) 6 (14.0) 24 (55.8)Fundraising 39 (48.1) 13 (33.3) 5 (12.8) 1 (2.6) 7 (17.9) 26 (66.7)
Food or Beverage Contracts3
45 (55.5) 0 0 0 1 (2.2) 1 (2.2)
VAFHK2 Guidelines3 29 (35.8) 0 0 4 (13.8) 0 4 (13.8)Sustainable Foods Practice 15 (18.5) 2 (13.3) 0 1 (6.7) 0 3 (20.0)
Requirement 30 (37 0) 0 0 6 (20 0) 1 (3 3) 7 (23 3)Requirement 30 (37.0) 0 0 6 (20.0) 1 (3.3) 7 (23.3)PE Teacher-Student Ratio 9 (11.1) 0 0 0 0 0
PE Standards 47 (58.0) 1 (2.1) 0 15 (31.9) 0 16 (34.0)FIT Standards 39 (48.1) 2 (5.1) 0 16 (41.0) 2 (5.1) 20 (51.2)
PE Certification/Training 29 (35.8) 0 0 15 (51.7) 0 15 (51.7)PA Outside of PE 46 (56.8) 13 (28.3) 2 (4.3) 16 (34.7) 1 (2.2) 32 (69.6)
Recess Requirements 48 (59.3) 2 (4.2) 0 30 (62.5) 3 (6.3) 35 (72.9)Walking/Biking to School 8 (9.9) 9 (112.5)2 0 8 1 18 (225.0)
23
Students consume up to 50% of their daily calories at schooldaily calories at schoolThe sale of low-nutrition foods in schools outside of school meals is associated with higher weight status› 1/5 of average increase in BMI between
1994 and 2000 is due to increased availability of ‘junk foods’ in schools
(Kubik, Lytle, Story, 2005)
24

9/2/2010
13
Between 1991 and 2005, the percentage of schools with vending machines of schools with vending machines increased from:› 42% to 82% in middle schools› 76% to 97% in high schoolsThe most common items sold at schools ( t id f h l l ) i l d d (outside of school meals) include candy, sugar-sweetened beverages, chips, cookies, and snack cakes
(USDA, 2007)
25
Requires nutrition standards for snacks and competitive
26
foods sold in schools, based on guidelines set by the Alliance for a Healthier Generation or the Institute of Medicine
Beverages not included in legislation

9/2/2010
14
Childhood obesity prevalence rates are growing…and will likely continue to growgrowing…and will likely continue to growThere are several contributing factors, including sugar-sweetened beverages and physical educationSchools can play a critical role in
ti h lth ti d ti promoting healthy eating and active living for a lifetime
27
1. Require nutrition standards for b ld i h l b d beverages sold in schools, based on guidelines set by the Alliance for a Healthier Generation or the Institute of Medicine
28

9/2/2010
15
2. Require every student in grades K-8 to participate in daily physical education participate in daily physical education for the entire school year, including students with disabling conditions and those in alternative education programs.
Students in the elementary schools shall participate in physical education for at least 150 p p p yminutes during each school weekStudents in middle schools shall participate for at least 225 minutes per week
29
3. Require local (school) wellness policies (that were mandated as part of the (that were mandated as part of the Child Nutrition & WIC Reauthorization Act of 2004) to contain language that ‘requires’ policies in the following areas:
School foodsPhysical educationyPhysical activityNutrition educationSchool wellness
30