policy paper 14, 2013 understanding
TRANSCRIPT

Evidence for ICT Policy ActionPolicy Paper 14, 2013
Understandinginternet going mobile
Christoph Stork, Enrico Calandroand Alison Gillwald
Internet accessand use in elevenAfrican countries

Research ICT Africa
Research ICT Africa (RIA) is an information and communication technology (ICT) policy and regulation research network based in Cape Town, South Africa, under the directorship of Dr. Alison Gillwald. As a public interest think tank, RIA fills a strategic gap in the development of a sustainable information society and knowledge economy. The network builds the ICT policy and regulatory research capacity needed to inform effective ICT governance in Africa. RIA was launched a decade ago and has extended its activities through national, regional and continental partnerships. The network emanates from the growing demand for data and analysis necessary for appropriate but visionary policy required to catapult the continent into the information age. Through development of its research network, RIA seeks to build an African knowledge base in support of sound ICT policy and regulatory design, transparent implementation processes, and monitoring and review of policy and regulatory developments on the continent. The research, arising from a public interest agenda, is made available in the public domain, and individuals and entities from the public sector, private sector and civil society are encouraged to use it for purposes of teaching and further research or to enable them to participate more effectively in national, regional and global ICT policymaking and governance.
Series Editor: Alison Gillwald
Editorial assistance: Broc Rademan
Copy-editing: Chris Armstrong

Evidence for ICT Policy Action
Design and layout: Grant Logan, Creative Storm | Cover image: Amy DeVoogd, Photodisc
Acknowledgements
Research ICT Africa (RIA) is an information and communication technology (ICT) policy and regulation research network based in Cape Town, South Africa, under the directorship of Dr. Alison Gillwald. As a public interest think tank, RIA fills a strategic gap in the development of a sustainable information society and knowledge economy. The network builds the ICT policy and regulatory research capacity needed to inform effective ICT governance in Africa. RIA was launched a decade ago and has extended its activities through national, regional and continental partnerships. The network emanates from the growing demand for data and analysis necessary for appropriate but visionary policy required to catapult the continent into the information age. Through development of its research network, RIA seeks to build an African knowledge base in support of sound ICT policy and regulatory design, transparent implementation processes, and monitoring and review of policy and regulatory developments on the continent. The research, arising from a public interest agenda, is made available in the public domain, and individuals and entities from the public sector, private sector and civil society are encouraged to use it for purposes of teaching and further research or to enable them to participate more effectively in national, regional and global ICT policymaking and governance.
This research is made possible by significant funding received from the International Development Research Centre (IDRC), Ottawa, Canada, and RIA network members express their gratitude to the IDRC for its support. The network consists of members in 18 African countries, and RIA researchers in 12 countries were able to participate in the 2012 supply- and demand-side reviews of their national ICT sectors (as detailed in this and other country reports). The 2012 national studies were led by the following RIA network members: Dr. Patricia Makepe (Botswana); Prof. Olivier Nana Nzépa (Cameroon); Dr. Lishan Adam (Ethiopia); Dr. Godfred Frempong (Ghana); Prof. Tim Waema (Kenya); Francisco Mabila (Mozambique); Dr. Christoph Stork (Namibia); Fola Odufuwa (Nigeria); Louise Karamage (Rwanda); Dr. Alison Gillwald (South Africa); Mary Materu-Behitsa (Tanzania); and Ali Ndiwalana (Uganda).
RIA’s 2012 Household and Individual ICT Access and Use Surveys and Informal Sector ICT Access and Use Surveys were led by Dr. Christoph Stork who, together with Mariama Deen-Swarray, was responsible for the preparation of the statistical data and data analysis for the 12 sets of national findings and the comparative analyses across the 12 countries. The 2012 Telecom Regulatory Environment (TRE) assessments, the compilation of supply-side indicators, and the collection and presentation of the pricing data, were coordinated across the 12 study countries by Enrico Calandro and Mpho Moyo. Additional peer-reviewing to that done amongst partners was undertaken by Steve Esselaar and Enrico Calandro.

Understanding Internet Going Mobile
Authors
Christoph Stork (PhD) is Senior Researcher at the Research ICT Africa. He holds a PhD in financial economics from London Guildhall University, UK, a Diplom Kaufmann (MA) from the University of Paderborn, Germany, and a BA Economics from the Nottingham Trent University, UK. He has more than 10 years research experience in Africa and has led continent-wide household and small business surveys, providing the only multi-country demand-side data and analysis of ICT access and use on the continent, for use by regulators, policymakers and multilateral agencies such as the OECD and the ITU. His research has informed policies, laws and regulations in the ICT field, specifically in Namibia where he has provided technical advice to the Namibian Communications Commission and Namibian Government on ICT policy and regulation, including a ground-breaking benchmark study on interconnection termination rates.
Enrico Calandro is a research fellow at Research ICT Africa. Prior to joining Research ICTAfrica, he worked as a technical advisor for the ICT programme of the SADCParliamentary Forum in Namibia, within the UN technical cooperation framework. He worked for the European Commission, Information Society and Media DG as a trainee after completing his Laurea Magistrale (Master degree) in Communications Sciences from the University of Perugia, Italy. He is a recipient of the Amy Mahan Scholarship awarded for the advancement of ICT policy in Africa, of the UNDESA fellowship for international cooperation, and of the Information Control Fellowship Programme by the Open Technology Fund. His academic research focuses on ICT access and use, broadband policy, and internet governance in Africa.
Alison Gillwald (PhD) is Executive Director of Research ICT Africa, an ICT policy and regulatory think-tank based in Cape Town, South Africa, which hosts an African-wide research network. She also holds an adjunct professorship at the Management of Infrastructure Reform and Regulation Programme at the University of Cape Town Graduate School of Business where she convenes an ICT policy and regulatory executive training programme for regulators, policy-makers and parliamentarians, and supervises doctoral students in this area. She served on the founding Council of the South African Telecommunications Regulatory Authority (SATRA) and the first Independent Broadcasting Authority prior to that. She is widely published in the areas of telecommunications and broadcasting policy and regulation, global governance, gender and politics more broadly. She has advised regional bodies, governments, regulators and competitions commissions on the continent, and has been commissioned by multilateral agencies including the African Union, infoDev, the Commonwealth Telecommunication Organisation and the International Telecommunications Union.

Evidence for ICT Policy Action
Executive summary
While the 2007/08 African ICT access and use survey demonstrated alarmingly little access to the Internet on the continent, together with a large-scale absence of computers and smart phones, compounded by the high cost of connectivity (Gillwald and Stork, 2008), the mobile phone is now the key entry point for Internet use.1 Internet access has grown significantly, increasing Internet penetration to 15.5 per cent across the ten African countries surveyed on household and individual ICT access and use by Research ICT Africa in 2011/12.2
Mobile Internet requires fewer ICT skills and financial resources, and does not rely on electricity at home, compared to computer or laptop and fixed-Internet access, in general. Other findings highlight the unevenness of Internet take-up across and within countries. So, while the majority of the countries under investigation demonstrate increased mobile Internet take-up, in Rwanda, Tanzania and Ethiopia, Internet use remains negligible. South Africa had the highest Internet penetration rate, with nearly 34 per cent of the population who are 15 years or older using the Internet.
From a policy perspective, what is significant about these rare demand-side studies is their national representativeness, which allows for the disaggregation of data by sex, income and education, which is simply not available with supply-side data. For example, the survey was able to identify that in Namibia and Tanzania Internet access is balanced between the genders, while in Uganda, Ethiopia and Rwanda mobile Internet access seems to be the domain of men, with only between 10 and 30 per cent of mobile Internet users being female.
The representativeness also enables the modelling of the data to understand the real causes of inequality, and facilitates identification of the actual points of policy intervention. For example, the modelling of the descriptive gender data has shown no significant gender effect for mobile phone ownership when controlling the data for income and education. This means that women with similar income, education and employment status are as likely as men to own a mobile phone. However, as women generally have less access to employment (income) and education, this decreases the likelihood of mobile ownership and mobile Internet use.
Unlike some of the micro-studies of Internet use in Africa, the study surveys also those marginalised from services and the reasons for this. In Namibia, Tanzania, South Africa and Botswana, not having a computer/Internet connection is the main reason for not using the Internet. In Namibia, this is followed by a lack of skills (“I don’t know how to use it”) and by the cost of the Internet, considered by 78.4 per cent of non-users to be too expensive. While in the majority of the countries lack of skills was identified as a major barrier to Internet adoption, cost was considered the second biggest barrier in Uganda and Rwanda. In Ethiopia, where the prices of the monopoly services are politically determined, though still high, the factor of cost was lowest, at 5 per cent.
1 The surveys were made possible with a grant by the International Development Research Centre (IDRC) Ottawa, Canada. In Na-mibia, the survey was conducted in co-operation with the Namibian regulator, Communications Regulatory Authority of Namibia (CRAN) and the Namibian Broadcasting Corporation (NBC). In South African, the survey was done in collaboration with the Wits Journalism Media Observatory, responsible for the South African Network Society Survey.2 Nationally representative household and individual surveys were conducted across 17 countries in 2007/08, and 12 countries in 2011/12. These results include only Botswana, Cameroon, Ethiopia, Ghana, Kenya, Namibia, Rwanda, South Africa, Tanzania and Uganda. The survey results are preliminary and will be adjusted as soon as the latest census results are released in a number of countries. South Africa and Namibia conducted a census in 2011. For other countries (e.g. Ghana), the 2009 and 2010 statistics have not yet been released. World Bank projections for 2010 are used for all countries.
5
Understanding Internet Going Mobile
In those countries where mobile Internet is boosting connectivity, this is being driven by social networking applications. Understanding prepaid mobile Internet further provides a pro-poor dimension to public policies seeking to improve Internet access, which historically was available and affordable only to the elite. The rest of society had to rely on public access points, whether private Internet cafés or schools and libraries. This policy paper concludes by raising significant policy questions on how the Internet is used and accessed. It highlights the importance of demand stimulation, such as reducing the price of services and devices, developing e-literacy and skills and relevant content, as much as supply-side measures, which traditionally have focused on infrastructure expansion only.

Table of Contents
Introduction 1
ICTs and social and economic development 1
Methodology 4
Household divide 7
Mobile 10
Individual computer or laptop use 12
Individual Internet access and use 14
Policy implications 20
References 22
Evidence for ICT Policy Action
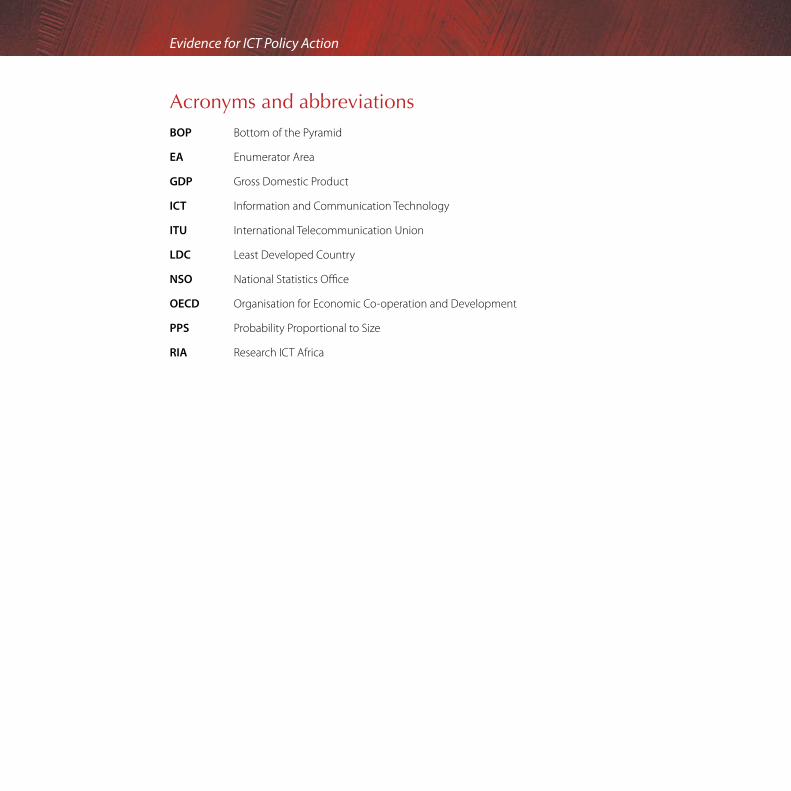
Acronyms and abbreviations
BOP Bottom of the Pyramid
EA Enumerator Area
GDP Gross Domestic Product
ICT Information and Communication Technology
ITU International Telecommunication Union
LDC Least Developed Country
NSO National Statistics Office
OECD Organisation for Economic Co-operation and Development
PPS Probability Proportional to Size
RIA Research ICT Africa

1
Understanding Internet Going Mobile
Introduction
Affordable access to ICTs is a policy objective common to all African countries.1 This is not only as a result of the increasing evidence linking investment in ICT to economic growth, but also because of some of the less tangible and quantifiable benefits of access to information for an active citizenry, including greater social and political participation. Indeed, there is considerable evidence that ICTs can make markets function more efficiently and contribute to economic growth.2 They have increasingly been heralded as a key component for the reduction of poverty, and enhanced economic and social inclusion, in developing nations.3
ICTs and social and economic development
At a macro-level, mobile telephony adoption has been found to have a positive impact on economic welfare and GDP. It generates employment opportunities in the sector and improves the productivity of other sectors, as it contributes to business expansion, to entrepreneurship, to banking the unbanked and to reduced transaction costs. Investment in telecommunication infrastructure has a direct and indirect positive effect on economic growth. For instance, Cronin et al. (1993a, 1993b) identify a positive correlation between telecommunications infrastructure investment and national productivity growth in the US. However, studies showing such correlations have been unable to demonstrate causality. Canning (1999) shows that investment in the telecommunication sector is substantially more productive than investment on average, due to direct and indirect effects. Further, ICT investment generates direct and indirect taxation revenue for governments (Bhavnani et al., 2008).
The study by Röller and Waverman (2001) provides an important qualification to studies that demonstrate such correlations, and which had previously been conducted only in mature Organisation for Economic Co-operation and Development (OECD) economies. They demonstrated that a critical mass threshold of 40 per cent of the population connected to voice services needed to be reached before the positive network effects that drive economic growth and development are realised. In the large majority of African countries, fixed-line services have seldom reached more than a few per cent, and most are in decline. It is also only now that mobile penetration in many countries is reaching the critical mass of 40 per cent identified as the threshold at which network effects kick in (Roller and Waverman, 2001) that positive multipliers and innovations, such as mobile money in the case of East Africa, become evident.
1 In September 2012, the ITU Broadband Commission for Digital Development recommended that entry-level broadband be affordable by 2015 through adequate regulation and market forces, and set a 5 per cent of average monthly income threshold for broadband expenditure (ITU, 2012).2 Jipp (1963) was among the first to identify the positive association between telecommunications infrastructure and economic growth. He was followed by Hardy in 1980. Cronin et al. (1993b) build on the linkages between infrastructure and economic development, and Cronin et al. (1993a) demonstrate the contribution of telecommunication infrastructure investment to aggregate and sectoral productivity. Subsequently, Röller and Waverman (2001), Koutroumpis (2009) and Kim et al. (2010) link ITU teledensity figures for fixed, mobile or broadband users to macro-economic variables such as GDP or total factor productivity.3 ICT for poverty alleviation is a controversial academic topic. There is a wide literature on the correlation between ICT and poverty alleviation. For instance, Flor (2001) identifies an “indisputable link” between a higher human poverty index and a lower penetration rate of ISPs, telephone lines, PCs and TV sets in Southeast Asia. In contrast, a higher value of ICT indicators was found in countries with a lower poverty index. The World Bank in 2002 addressed the issue of ICT as a tool for empowerment and income generation in less development countries (LDCs) in a study investigating the cost effectiveness of radio, telephony and the Internet in an LDC case (Kenny, 2002). A study by Obayelu and Ogunlade (2006) describes how ICT could be used for gender empowerment and pov-erty alleviation in Nigeria, concluding that poverty alleviation is unlikely to be achieved without an appropriate use of ICT. Another study based on the linkages between ICT access and poverty conducted in Uganda in 2007 reveals that access to traditional ICTs is associated with lower incidence of poverty; however, ICT access alone is not enough as a tool for poverty alleviation and needs to be complemented by other measures (Ssewanyana, 2007).
ICTs can make markets function more efficiently and contribute to economic growth

2
Evidence for ICT Policy Action
Koutroumpis (2009) demonstrates the existence of several levels of return from broadband infrastructure, based on the level of penetration. He asserts that there is evidence of a critical mass phenomenon in broadband infrastructure investments, and the penetration level that he identifies is 20 per cent of the population connected to the network. According to Koutroumpis (2009), this percentage creates a vision for countries to capitalise on the beneficial effects that the network can provide; it also implies a 0.89 per cent aggregate growth rate due to broadband externalities.
The World Bank asserts that in low- and middle-income countries, every ten percentage point increase in broadband penetration accelerates economic growth by 1.38 percentage points (Kim, et al. 2010). The economic growth associated with the increase in broadband penetration is even higher than that resulting from penetration of other telecommunications services, such as fixed or mobile phones (Kim, et al. 2010).
At the social or microeconomic level, Bhavnani et al. (2008) point out that mobile telephony adoption enhances entrepreneurship and job search, since it reduces the costs of starting a business; further, it reduces information asymmetries and market inefficiencies and, in some instances, it might substitute transportation. Oyewumi (2006) asserts that despite challenges related to low levels or absence of functional literacy and numeracy, the availability of market information in the rural agriculture context allows farmers to incorporate market situation analysis and price consideration in their production, financial, investment and strategic decisions. De Silva (2005, in Oyewumi, 2006) argues that equal access to market information would reduce marketing channel costs and transportation costs, and may ensure fair transactions.
A study on the impact of mobile telephony on the development of micro-enterprises in Nigeria conducted by Jagun et al. (2008) concludes that mobile phones reduce some information failures that constrain investment and business activities in developing countries. The study demonstrates that in the cloth-weaving sector in Nigeria, mobile telephony helped that market to act more efficiently and effectively. In particular, findings reveal that mobile telephony had an economising effect on supply chain processes. However, they could not find indicators showing a significant restructuring effect on the organisation of supply chains.
Using Amartya Sen’s (1992) capability approach, a study conducted by Ndung’u and Waema (2011) concludes that the integration of ICT into many aspects of the economy has created a digitally enabled economy, and that money transfer services, initially intended for the unbanked segment of the “bottom of the pyramid” (BOP), have been embraced by other sectors of the economy, improving business productivity.
Other studies investigate the relationship between access to and use of information. It is widely recognised that the advantages of accessing timely information and market knowledge have mostly benefited those with resources and skills, leaving out the majority of the rural population (Bhavnani et al., 2008). For instance, in the case of the farming sector, the high costs associated with accessing relevant and value-added information through ICT and, in particular, fast-speed Internet represents a disincentive for farmers (Rheingold, 2005), unless the benefits of accessing it outweigh the costs. However, studies argue that benefits associated with mobile phone adoption in rural areas are higher than in urban areas (Bhavnani et al., 2008). For instance, in the case of mobile banking, mobile phones can reduce transport costs, thereby reducing expenses incurred in running a business.
Although many barriers to mobile telephony adoption, most significantly high use prices, persist in rural and poor communities, the mobile phone has become the most easily accessible and ubiquitous communications device in rural areas (Bhavnani et al., 2008), due to the affordability of the handset and the prepaid mechanism. It also reduces entry barriers to telecommunications services in general, since it can be used for text, voice and also the Internet, TV and radio.
Mobile phone use reduces some information failures that constrain investment and business activities in developing countries
Many barriers to mobile telephony adoption persist in rural and poor communities

3
Understanding Internet Going Mobile
More than just access: social media applications
More recent studies on the digital divide also consider social dimensions of improved ICT access, use and content. In particular, Hatem Ali (2011) acknowledges that the digital divide encompasses more than just physical access to ICTs and, therefore, investigates also how and for what reason ICTs are being used. He argues that as a legacy of measuring connectivity and access to telephony that had only a single use, indicators measure the digital divide only in terms of physical access to infrastructure (for instance, ownership of a phone and number of telephone lines). However, he asserts that the Internet has different possible uses, such as communication, education, commerce and social and professional networking. In the context of the Internet, therefore, studies investigating the relationship between ICT and poverty alleviation should take into account, and make a distinction between, physical access to the infrastructure and actual use of the Internet. In particular, making a distinction between access and use of the Internet clarifies the goal of policies aimed at closing the digital divide.
Due to their specific characteristics, social media applications, such as Facebook, provide a simple channel of communication that is not dependent on any content published by a proprietary entity or reliant on a particular technology. Social media applications allow people to publish their own content and to share with their community what is relevant for them. Mobile social media applications lower the ICT skills requirements, needing less technical training than is the case with computers. Moreover, they have the capacity to foster participation and democratisation by shifting the role of users from passive receivers of information via traditional media to active participants in public debates.
Livingston et al. (2011) conducted a face-to-face survey of 25 000 Internet users aged 9–16 years and their parents in 25 countries, and found that social networking is the most popular activity among European children, with 38 per cent of 9–12 year olds and 77 per cent of 13–16 year olds having a social networking profile (Facebook, for example). Although still nascent in developing countries, a similar trend is expected.
In an attempt to move beyond simply quantifying access to ICTs as the sole measure of the digital divide, this paper investigates how the Internet and social media applications are accessed and used in selected African countries. Since the usage patterns can be seen as the responses of citizens to the availability and cost of communications, and, thus, as policy outcomes, their exploration enables the identification of points of policy intervention in order to better meet objectives of accessibility and affordability of the full range of services required for equitable participation in an information society and economy.

4
Evidence for ICT Policy Action
Methodology
The RIA e-Access & Usage Survey delivers nationally representative results for households and individuals. It uses enumerator areas (EAs) of the national census sample frames as primary sampling units and samples households from created listings for each EA. The random sampling was performed in four steps for households and five steps for individuals:
Step 1 – The national census sample frames were split into urban and rural EAs.
Step 2 – EAs were sampled for each stratum using probability proportional to size (PPS).
Step 3 – For each EA, a listing was compiled, serving as sample frame for the simple random selections.
Step 4 – Twenty-four households were sampled using simple random samples for each selected EA.
Step 5 – From all household members 15 years or older, or visitor staying the night at the house, one was randomly selected based on simple random sampling.
The desired level of accuracy for the survey was set to a confidence level of 95 per cent and an absolute precision (relative margin of error) of 5 per cent. The population proportion P was set conservatively at 0.5, which yields the largest sample size (Lwanga and Lemeshow, 1991). The minimum sample size was determined by the following equation (Rea and Parker, 1997):
Inserting the parameters for the survey yields the minimum sample size for simple random sampling. Due to the sampling method chosen for the survey, the minimum sample size has to be multiplied by the design effect variable (Lwanga and Lemeshow, 1991). In the absence of empirical data from previous surveys that would have suggested a different value, the default value of 2 was chosen for the design effect (UNSD, 2005). This yields then a minimum sample size of 768 for households and individuals. The actual sample size is slightly larger than the minimum requirement to compensate for clustering effects and to have a wide enough spread of EAs throughout a country.

5
Understanding Internet Going Mobile
Table 1: Survey summary
Target population All households and all individuals 15 years or older.
Domains 1 = national level
Tabulation groups Urban, Rural
Oversampling Urban 60%, Rural 40%
Clustering Enumerator areas (EAs) national census
None response Random substitution
Sample frame Census sample from NSO
Confidence level 95%
Design factor 2
Absolute precision 5%
Population proportion 0.5 for maximum sample size
Minimum sample size 768
Household Constitutes a person or group of persons, irrespective of whether related or not, who normally live together in the same housing unit or group of housing units and have common cooking arrangements.
Head of household A head of a household is a person who economically supports or manages the household or, for reasons of age or respect, is considered as head by members of the household, or declares himself as head of a household. The head of a household could be male or female.
Member of a household All persons who lived and ate with the household for at least six months, including those who were not within the household at the time of the survey and were expected to be absent from the household for less than six months.
All guests and visitors who ate and stayed with the household for six months and more
Housemaids, guards, baby-sitters, etc. who lived and ate with the household, even for less than six months
Source: RIA ICT Survey data 2011-12

6
Evidence for ICT Policy Action
Weights were constructed for households and individuals. The weights are based on the inverse selection probabilities and gross up the data to national level when applied.4
Household weight:
Individual weight:
Household selection probability:
EA selection probability:
Individual selection probability:
= design weight compensation for over-sampling of major urban and other urban EAs and under-sampling of rural EAs
= number of households in selected EA based on information of last census or updated listing by field team
= number of households in strata (major urban, other urban, rural)
= number of household members or visitors 15 years or older
m = target number of EAs for each strata, (major urban, other urban, rural)
n = target number of households in EA
4 See UNSD (2005, p. 199) for a detailed discussion on sampling weights.
7
Understanding Internet Going Mobile
Household divide
The digital divide in Africa maps the gap between those who have access to electricity in the first instance and those who do not. In most of the countries analysed, more than half of the households have access to electricity. In Ghana and South Africa, more than two-thirds of households are connected to the grid. Tanzania, Uganda, Rwanda and Ethiopia have not reached 20 per cent of households connected to the electricity grid.
Radio is confirmed as the medium most widely used at household level. It is present in more than 60 per cent of households in Botswana, Ghana, Kenya, Namibia, Rwanda, South Africa, Tanzania, Uganda and Nigeria, and in only 41 per cent of households in Ethiopia and 33.9 per cent in Cameroon. Ethiopia is the poorest of the countries analysed.5
In Cameroon, Ghana and South Africa, radio ownership at a household level declined between 2007 and 2011, indicating a substitution of radio by TV, while for Tanzania, Uganda and Rwanda, which have a far lower television penetration, radio access was still on the increase. The share of households with a working TV increased in all countries except Ethiopia, where the share stagnated.
5 Ethiopia has a GDP per capita of US$1 100.00 (2011 estimate) (CIA, The World Factbook, https://www.cia.gov/library/publications/the-world-factbook/rankorder/2004rank.html).
8
Evidence for ICT Policy Action
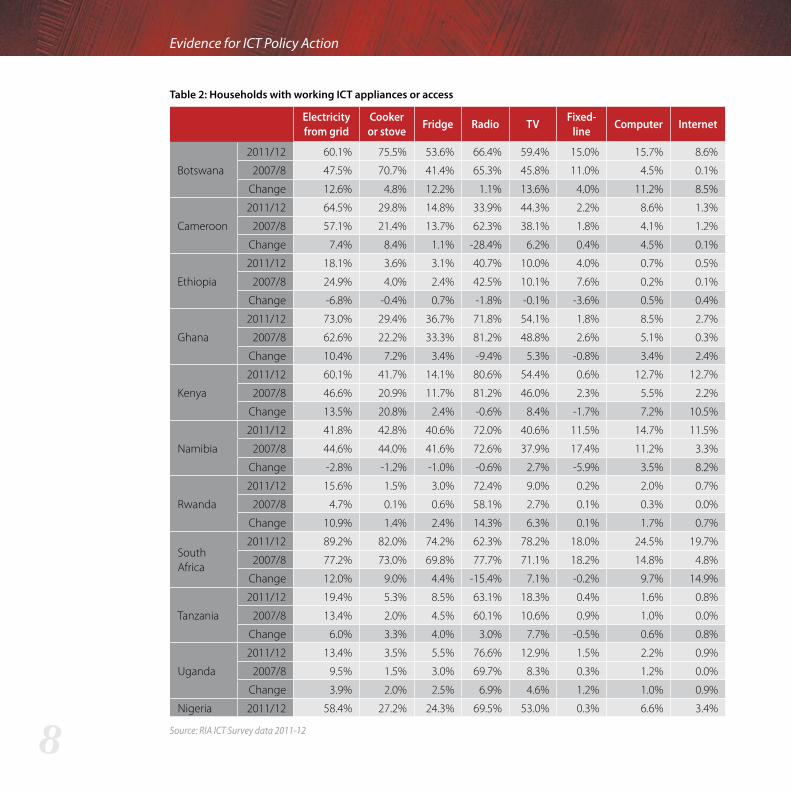
Table 2: Households with working ICT appliances or access
Electricity from grid
Cooker or stove Fridge Radio TV Fixed-
line Computer Internet
Botswana
2011/12 60.1% 75.5% 53.6% 66.4% 59.4% 15.0% 15.7% 8.6%
2007/8 47.5% 70.7% 41.4% 65.3% 45.8% 11.0% 4.5% 0.1%
Change 12.6% 4.8% 12.2% 1.1% 13.6% 4.0% 11.2% 8.5%
Cameroon
2011/12 64.5% 29.8% 14.8% 33.9% 44.3% 2.2% 8.6% 1.3%
2007/8 57.1% 21.4% 13.7% 62.3% 38.1% 1.8% 4.1% 1.2%
Change 7.4% 8.4% 1.1% -28.4% 6.2% 0.4% 4.5% 0.1%
Ethiopia
2011/12 18.1% 3.6% 3.1% 40.7% 10.0% 4.0% 0.7% 0.5%
2007/8 24.9% 4.0% 2.4% 42.5% 10.1% 7.6% 0.2% 0.1%
Change -6.8% -0.4% 0.7% -1.8% -0.1% -3.6% 0.5% 0.4%
Ghana
2011/12 73.0% 29.4% 36.7% 71.8% 54.1% 1.8% 8.5% 2.7%
2007/8 62.6% 22.2% 33.3% 81.2% 48.8% 2.6% 5.1% 0.3%
Change 10.4% 7.2% 3.4% -9.4% 5.3% -0.8% 3.4% 2.4%
Kenya
2011/12 60.1% 41.7% 14.1% 80.6% 54.4% 0.6% 12.7% 12.7%
2007/8 46.6% 20.9% 11.7% 81.2% 46.0% 2.3% 5.5% 2.2%
Change 13.5% 20.8% 2.4% -0.6% 8.4% -1.7% 7.2% 10.5%
Namibia
2011/12 41.8% 42.8% 40.6% 72.0% 40.6% 11.5% 14.7% 11.5%
2007/8 44.6% 44.0% 41.6% 72.6% 37.9% 17.4% 11.2% 3.3%
Change -2.8% -1.2% -1.0% -0.6% 2.7% -5.9% 3.5% 8.2%
Rwanda
2011/12 15.6% 1.5% 3.0% 72.4% 9.0% 0.2% 2.0% 0.7%
2007/8 4.7% 0.1% 0.6% 58.1% 2.7% 0.1% 0.3% 0.0%
Change 10.9% 1.4% 2.4% 14.3% 6.3% 0.1% 1.7% 0.7%
South Africa
2011/12 89.2% 82.0% 74.2% 62.3% 78.2% 18.0% 24.5% 19.7%
2007/8 77.2% 73.0% 69.8% 77.7% 71.1% 18.2% 14.8% 4.8%
Change 12.0% 9.0% 4.4% -15.4% 7.1% -0.2% 9.7% 14.9%
Tanzania
2011/12 19.4% 5.3% 8.5% 63.1% 18.3% 0.4% 1.6% 0.8%
2007/8 13.4% 2.0% 4.5% 60.1% 10.6% 0.9% 1.0% 0.0%
Change 6.0% 3.3% 4.0% 3.0% 7.7% -0.5% 0.6% 0.8%
Uganda
2011/12 13.4% 3.5% 5.5% 76.6% 12.9% 1.5% 2.2% 0.9%
2007/8 9.5% 1.5% 3.0% 69.7% 8.3% 0.3% 1.2% 0.0%
Change 3.9% 2.0% 2.5% 6.9% 4.6% 1.2% 1.0% 0.9%
Nigeria 2011/12 58.4% 27.2% 24.3% 69.5% 53.0% 0.3% 6.6% 3.4%
Source: RIA ICT Survey data 2011-12

9
Understanding Internet Going Mobile
In line with global trends, most of the countries analysed, such as Ethiopia, Ghana, Kenya, Namibia, South African and Tanzania, saw a decline in residential fixed-line phones. While Cameroon, Uganda and Rwanda saw a modest increase, Botswana had an increase of 36.4 per cent compared to 2007/08, reaching a fixed-line penetration of 15 per cent. Ethiopia also had a relatively high fixed-line penetration, with 4 per cent of households having a fixed-line phone following the roll-out out of a national VSAT network across the country.
Only Kenya, Namibia, and South Africa had a significant share of households with Internet access. While off a relatively low base, Namibia saw the share of households with Internet access nearly quadruple with an increase from 3.3 per cent to 11.5 per cent, mostly due to individual mobile Internet access used by households. The same effect has been experienced in Kenya, where the number of Internet connections at home increased from 2.2 per cent in 2007/8 to 12.7 per cent in 2011.

10
Evidence for ICT Policy Action
Mobile
Figure 1 shows that individual mobile phone ownership in all of the countries except Ethiopia and Rwanda is higher than the 40 per cent threshold critical mass in voice networks that is believed to trigger the network effects associated with economic growth discussed above (see Röller and Waverman, 2001).6 Prepaid remains the preferred mode of paying for mobile use in all of the countries, with more than 98 per cent of individuals reporting use of prepaid SIM cards, except in Botswana, Ghana, Namibia, Rwanda and South Africa, where use of post-paid contracts is growing. This might be due to an increasing number of individuals with a regular income, proof of residence and ID, necessary conditions to apply for a mobile phone contract in countries such as Namibia and South Africa.
Figure 1: Share of 15+ year olds who owned a mobile phone or active SIM card Source: RIA ICT Survey data 2007-08, 2011-12Note: The 2007/08 figures are for 16+ year olds
In Tanzania, Uganda and Ghana, the number of users that have mobile phones capable of browsing the Internet is two to three times larger than those who actually use them for Internet browsing. Yet, together with the increasing diffusion of smart phones among the population, the mobile phone is becoming the favourite ICT device to access and browse the Internet. For instance, in Namibia, where nearly 31 per cent of mobile phone owners have a handset capable of browsing the Internet, 24 per cent of mobile phone owners use their phone for browsing the Internet, while over 12 per cent read and write emails and 17 per cent access social networking applications, which is boosting Internet adoption in the country. In countries with lower levels of mobile phone ownership, such as Tanzania, only 5.2 per cent of mobile phone owners use the mobile for browsing the Internet and to read and write emails, and slightly less use their phones to access social networking applications. In most of the countries analysed, such as Botswana, Cameroon, Ghana, Kenya, Namibia, Nigeria, Rwanda, South Africa and Uganda, the use of mobile phones for accessing social networking applications (such as Facebook) is higher than for reading and writing emails, indicating a substitution effect of the email function with social networking platforms.
6 Only Rwanda and Ethiopia did not reach the 40 per cent threshold. However, mobile phone ownership grew by 288 per cent in Rwanda and by 493.75 per cent in Ethiopia between 2008 and 2011.
South Africa
Kenya
Ghana
Nigeria
Namibia
Uganda
Cameroon
Tanzania
Rwanda
Ethiopia
49.3%
59.9%
52%
62.1%
19%
38.5%
41.7%
Botswana
50.6%
53.6%
66.5%
69.4%
70.5%
83.5%
86.7%
87%
2011/20122007/2008
3.2%
9.9%
21.5%
36.5%
20.7%
59.8%
Prepaid remains the preferred mode of paying for mobile use
The mobile phone is becoming the favourite ICT device to access and browse the internet

11
Understanding Internet Going Mobile
Table 3: Mobile phone access and use
15+ year olds that
own a mobile phone
15+ year olds owning a mobile phone 15+ year olds not owning a mobile phone
Prepaid
Mobile is capable of browsing
the Internet
Use social networking (Facebook,
etc.)
Browse the
Internet on
mobile
Reading and
writing emails on
mobile
Used a mobile in the past
three months
Own active SIM card
South Africa
84.2% 87.5% 51.0% 25.4% 27.6% 16.7% 53.2% 2.8%
Botswana 80.0% 97.4% 29.5% 18.4% 22.8% 16.5% 56.9% 3.6%
Kenya 74.0% 99.8% 32.3% 24.5% 25.3% 19.7% 93.6% 12.7%
Nigeria 66.4% 99.0% 22.7% 15.8% 16.0% 14.6% 27.0% 3.1%
Ghana 59.5% 97.4% 28.5% 11.3% 13.4% 9.5% 53.9% 10.9%
Namibia 56.1% 91.8% 30.7% 17.3% 23.8% 12.4% 41.6% 10.5%
Uganda 46.7% 98.0% 14.9% 6.7% 7.7% 6.0% 45.3% 7.0%
Cameroon 44.5% 99.0% 14.9% 7.7% 8.1% 4.3% 36.2% 6.1%
Tanzania 35.8% 99.5% 19.2% 4.7% 5.2% 5.2% 53.1% 5.9%
Rwanda 24.4% 90.1% 19.1% 13.6% 14.9% 13.3% 36.2% 14.1%
Ethiopia 18.3% 98.4% 6.5% 2.1% 5.1% 9.7% 31.2% 0.6%
Source: RIA ICT Survey data 2011-12

12
Evidence for ICT Policy Action
Individual computer or laptop use
The level of computer use is still very low in all the countries analysed, except for South Africa and Kenya. Table 4 shows that in Uganda and Rwanda less than 5 per cent of the population use a computer, and in Ethiopia and Tanzania this drops to 2 per cent or less. In countries such as South Africa, Namibia, Ghana and Nigeria, which have a higher number of households linked to the electricity grid, home was the preferred place to use a computer. In countries such as Tanzania, which has a very low level of electrification, and in countries where GDP per capita remains relatively low, such as Kenya and Cameroon, the main access location was Internet cafés.
Table 4: Individual computer or laptop access
15+ year olds that
use a computer
Location where the computer is used (multiple response)
Work School, university Library At home Internet
café
At a friend’s
place
South Africa 29.1% 40.2% 22.8% 6.1% 61.1% 29.0% 20.7%
Kenya 21.2% 36.8% 40.2% 16.9% 56.0% 68.8% 45.9%
Cameroon 15.1% 20.7% 33.4% 7.7% 38.0% 63.5% 35.9%
Namibia 13.0% 60.6% 36.7% 28.5% 73.1% 28.4% 45.5%
Ghana 10.0% 42.9% 44.5% 6.2% 72.6% 54.4% 24.9%
Nigeria 7.5% 45.9% 36.1% 4.5% 73.1% 61.8% 58.3%
Uganda 4.8% 45.5% 51.4% 25.0% 35.7% 57.0% 60.9%
Rwanda 3.5% 54.5% 35.3% 18.9% 59.4% 45.2% 25.1%
Ethiopia 2.0% 34.1% 48.4% 9.2% 23.9% 28.5% 5.3%
Tanzania 1.9% 41.0% 23.6% 8.5% 47.7% 65.8% 27.8%
Source: RIA ICT Survey data 2011-12
By comparison, in Ethiopia, half of computer users access PCs primarily at school or university. This may be the result of the 2006 Education Sector Development Programme and the ICT in Education Implementation Strategy and Action Plan (Hare, 2007), which improved computer use at an educational level.
The level of computer use is still very low in all the countries analysed
13
Understanding Internet Going Mobile
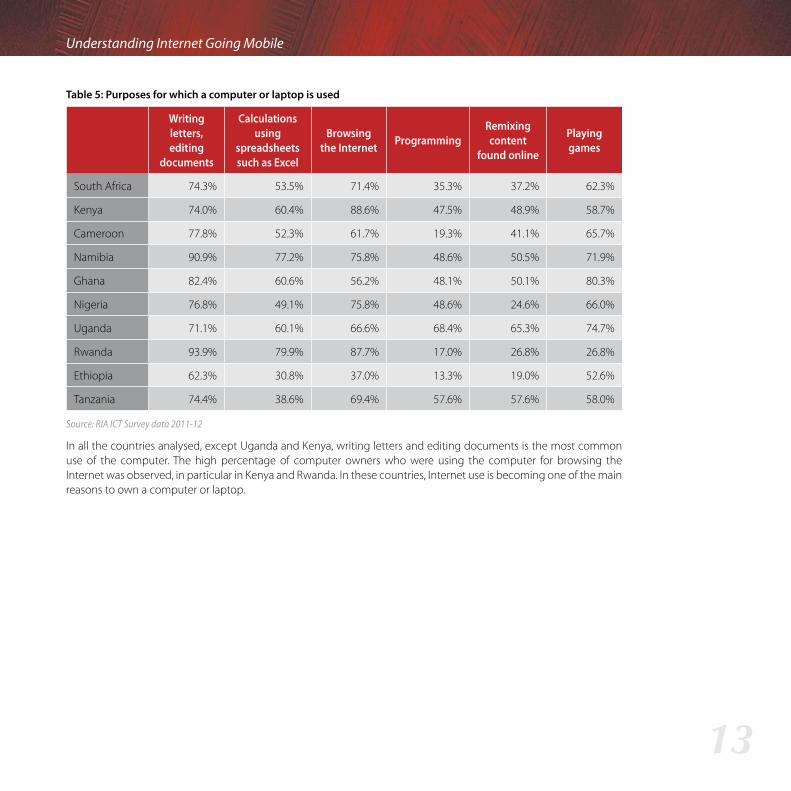
Table 5: Purposes for which a computer or laptop is used
Writing letters, editing
documents
Calculations using
spreadsheets such as Excel
Browsing the Internet Programming
Remixing content
found online
Playing games
South Africa 74.3% 53.5% 71.4% 35.3% 37.2% 62.3%
Kenya 74.0% 60.4% 88.6% 47.5% 48.9% 58.7%
Cameroon 77.8% 52.3% 61.7% 19.3% 41.1% 65.7%
Namibia 90.9% 77.2% 75.8% 48.6% 50.5% 71.9%
Ghana 82.4% 60.6% 56.2% 48.1% 50.1% 80.3%
Nigeria 76.8% 49.1% 75.8% 48.6% 24.6% 66.0%
Uganda 71.1% 60.1% 66.6% 68.4% 65.3% 74.7%
Rwanda 93.9% 79.9% 87.7% 17.0% 26.8% 26.8%
Ethiopia 62.3% 30.8% 37.0% 13.3% 19.0% 52.6%
Tanzania 74.4% 38.6% 69.4% 57.6% 57.6% 58.0%
Source: RIA ICT Survey data 2011-12
In all the countries analysed, except Uganda and Kenya, writing letters and editing documents is the most common use of the computer. The high percentage of computer owners who were using the computer for browsing the Internet was observed, in particular in Kenya and Rwanda. In these countries, Internet use is becoming one of the main reasons to own a computer or laptop.
14
Evidence for ICT Policy Action
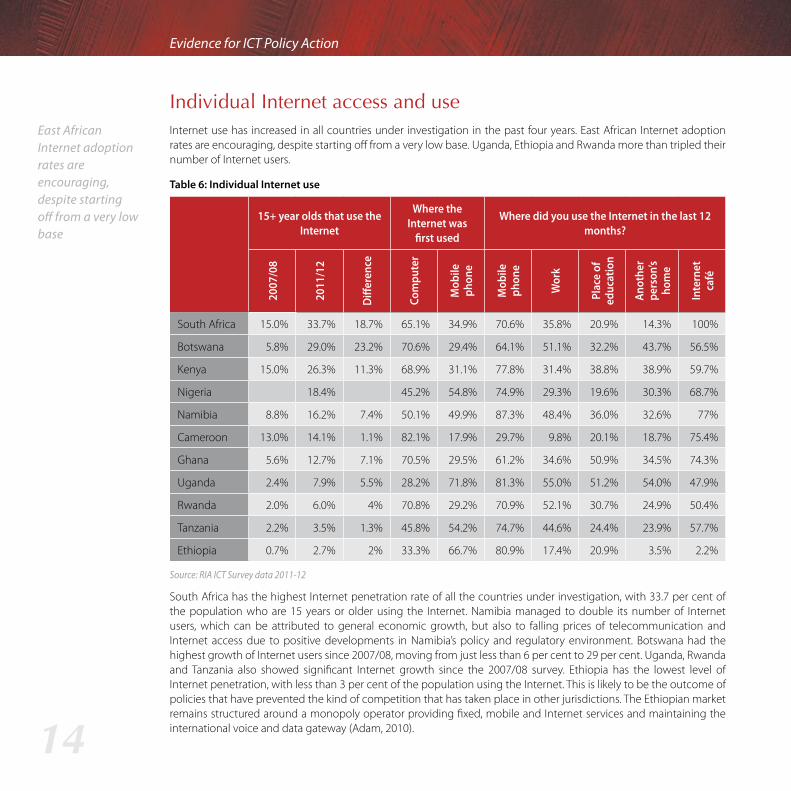
Individual Internet access and use
Internet use has increased in all countries under investigation in the past four years. East African Internet adoption rates are encouraging, despite starting off from a very low base. Uganda, Ethiopia and Rwanda more than tripled their number of Internet users.
Table 6: Individual Internet use
15+ year olds that use the Internet
Where the Internet was
first used
Where did you use the Internet in the last 12 months?
2007
/08
2011
/12
Diffe
renc
e
Com
pute
r
Mob
ile
phon
e
Mob
ile
phon
e
Wor
k
Plac
e of
ed
ucat
ion
Anot
her
pers
on’s
hom
e
Inte
rnet
ca
fé
South Africa 15.0% 33.7% 18.7% 65.1% 34.9% 70.6% 35.8% 20.9% 14.3% 100%
Botswana 5.8% 29.0% 23.2% 70.6% 29.4% 64.1% 51.1% 32.2% 43.7% 56.5%
Kenya 15.0% 26.3% 11.3% 68.9% 31.1% 77.8% 31.4% 38.8% 38.9% 59.7%
Nigeria 18.4% 45.2% 54.8% 74.9% 29.3% 19.6% 30.3% 68.7%
Namibia 8.8% 16.2% 7.4% 50.1% 49.9% 87.3% 48.4% 36.0% 32.6% 77%
Cameroon 13.0% 14.1% 1.1% 82.1% 17.9% 29.7% 9.8% 20.1% 18.7% 75.4%
Ghana 5.6% 12.7% 7.1% 70.5% 29.5% 61.2% 34.6% 50.9% 34.5% 74.3%
Uganda 2.4% 7.9% 5.5% 28.2% 71.8% 81.3% 55.0% 51.2% 54.0% 47.9%
Rwanda 2.0% 6.0% 4% 70.8% 29.2% 70.9% 52.1% 30.7% 24.9% 50.4%
Tanzania 2.2% 3.5% 1.3% 45.8% 54.2% 74.7% 44.6% 24.4% 23.9% 57.7%
Ethiopia 0.7% 2.7% 2% 33.3% 66.7% 80.9% 17.4% 20.9% 3.5% 2.2%
Source: RIA ICT Survey data 2011-12
South Africa has the highest Internet penetration rate of all the countries under investigation, with 33.7 per cent of the population who are 15 years or older using the Internet. Namibia managed to double its number of Internet users, which can be attributed to general economic growth, but also to falling prices of telecommunication and Internet access due to positive developments in Namibia’s policy and regulatory environment. Botswana had the highest growth of Internet users since 2007/08, moving from just less than 6 per cent to 29 per cent. Uganda, Rwanda and Tanzania also showed significant Internet growth since the 2007/08 survey. Ethiopia has the lowest level of Internet penetration, with less than 3 per cent of the population using the Internet. This is likely to be the outcome of policies that have prevented the kind of competition that has taken place in other jurisdictions. The Ethiopian market remains structured around a monopoly operator providing fixed, mobile and Internet services and maintaining the international voice and data gateway (Adam, 2010).
East African Internet adoption rates are encouraging, despite starting off from a very low base

15
Understanding Internet Going Mobile
While the first wave of Internet adoption rode on the back of desktop computers at the workplace, schools and universities, or public access facilities such as Internet cafés, the second wave is sweeping across Africa through the use of mobile phones. Although Internet penetration in most countries is still very low, more than 70 per cent of Ugandans and 67 per cent of Ethiopian Internet users first used the Internet on a mobile phone. In Tanzania, Namibia and Nigeria, about half of the population used the Internet first on a mobile phone.
The growing importance of the mobile phone in accessing the Internet is stressed by the responses to the question, “Where did you use the Internet in the last 12 months?” Either complementarily to computer access or exclusively, above 80 per cent of Internet users in Namibia, Uganda and Ethiopia accessed the Internet via a mobile phone. For South Africa, Kenya, Nigeria, Tanzania and Rwanda, the Internet was accessed through a mobile phone by 70 per cent of Internet users. In all of the countries except Cameroon and Ghana, the mobile phone has overtaken the Internet café, historically the most common way to access the Internet.
The increase in usage intensity is also positive (see Figure 2). Daily use rose over the four-year period at the expense of once-a-week and once-a-month usage in all countries examined. A significant increase was observed in Rwanda and Ethiopia.
Figure 2: Frequency of daily use of the InternetSource: RIA ICT Survey data 2007-08, 2011-12
Linked to the more frequent use of the Internet is the magnitude of the new wave of Internet users, displayed in Figure 3. In Ethiopia, almost half of Internet users started browsing the web during the previous year. On the contrary, the share of early Internet adopters (those who had been using the Internet for four years or more) is larger in Botswana, Rwanda, South Africa and Ghana.
While Namibia reflects early adopters already forming a wider base compared to many other countries, Rwanda’s continued low number of mobile Internet adopters suggests that the country is largely stuck with the first wave of Internet adopters. This is probably the result of a number of factors relating to a lack of 3G or better mobile data access, and ineffectual regulation of uncompetitive markets, resulting in higher mobile data pricing.
South Africa
Namibia
Botswana
Kenya
Tanzania
Ethiopia
Ghana
Nigeria
Uganda
Cameroon
19%
11%
35%
56%
19%
28%
34%
Rwanda
43%
47%
52%
53%
55%
57%
59%
64%
2011/20122007/2008
11%
15%
13%
32%
15%
31%
41%
A second wave of internet adoption is sweeping across Africa through the use of mobile phones

16
Evidence for ICT Policy Action
Figure 3: Share of Internet users by years since they first used the InternetSource: RIA ICT Survey data 2011-12
Namibia and South Africa, countries with a significant number of early adopters of the Internet and, as a result, high levels of Internet access compared to the other countries examined, are the only two countries where social networking has overtaken emailing as a communication tool. Email is still being used more than social networking by Internet users in all the other countries. In particular, in Tanzania, while 86 per cent of Internet users have an email address, only 63 per cent are signed up for social media, although this is of a very small total number of users. This trend is similar across all countries given the only recent rise of social networking applications such as mobile-adapted Facebook Zero, which allows for free communication, and the Opera browser. In contrast, email users are charged per megabyte. Taking into account that social media enhances the communication experience through ICT, because of lower language barriers, ICT skills requirements and technical training, the trend is clearly towards social networking applications overtaking email as the communication tool of choice.
Ethiopia
Tanzania
Uganda
Kenya
Cameroon
Ghana
Nigeria
South Africa
Namibia
Rwanda
1 Year or less 2 Years 3 Years 5 Years or more4 Years
Botswana
16%
8% 20% 19% 16% 37%
9% 7% 44%24% 16%
12% 18% 17%26% 27%
14% 17% 13% 10% 46%
16% 26% 19% 8% 31%
19% 12%16% 9% 45%
19% 11%15% 16% 38%
21% 31% 16% 7% 25%
28% 21% 7% 13%31%
29% 3%3% 27% 39%
48% 7%14% 17% 13%

17
Understanding Internet Going Mobile
Figure 4: Share of Internet users with an email address and signed up for an online social networking application such as Facebook.Source: RIA ICT Survey data 2011-12
If social networking contributes to the accelerated Internet adoption primarily through mobile platforms, then one would expect mobile Internet users to be younger. One may also expect mobile Internet users to have less income than desktop or laptop users since mobile phones are cheaper in terms of initial expenditure and require fewer skills to use.
Figure 5: Share of female Internet users distinguished by whether they first used the Internet on a computer or on a mobile phoneSource: RIA ICT Survey data 2011-12
Ethiopia
South Africa
Botswana
Namibia
Uganda
Nigeria
Tanzania
Kenya
Ghana
Cameroon
Rwanda
41%59%
75%66%
73%78%
81%79%
59%80%
50%81%
81%88%
81%90%
61%94%
88%97%
Social network (eg. Facebook)Email address
86% 63%
Nigeria
Uganda
Ethiopia
Ghana
South Africa
Rwanda
Namibia
Kenya
Cameroon
Tanzania
Botswana
43%24%
11%32%
10%36%
31%39%
56%40%
30%48%
25%52%
55%54%
56%55%
46%57%
50% 51%
First used the internet on a mobile phoneFirst used the internet on a computer

18
Evidence for ICT Policy Action
In Namibia and Tanzania, for example, Internet access is balanced between the genders, while in Uganda, Ethiopia and Rwanda mobile Internet access seems to be the domain of men, with only between 10–30 per cent of mobile Internet users being female. Milek et al. (2010) found that there was no significant gender effect for mobile phone ownership when controlling the data for income and education. This means that women with similar income, education and employment status are as likely as men to own a mobile phone. However, as women generally have less access to employment (income) and education, this decreases the likelihood of mobile ownership and mobile Internet use.
Figure 6: Average age of users distinguished by whether they first used the Internet on a computer or on a mobile phoneSource: RIA ICT Survey data 2011-12
From figure 6, which depicts the average age of users distinguished by whether they first used the Internet on a computer or on a mobile phone, it seems that mobile Internet is not primarily a young-generation phenomenon in all African countries. In Tanzania, Uganda, Ghana and Ethiopia, the people who used the Internet first on a mobile phone are generally older than those who used the Internet first on a PC.
Ethiopia
Ghana
Uganda
Kenya
Cameroon
Tanzania
Nigeria
Botswana
South Africa
Rwanda
Namibia
30.8%25.5%
31.7%27.5%
35.6%27.1%
25.9%27.9%
26.3%29.5%
33.4%29.7%
29.6%30.5%
26.6%31.5%
29.9%31.6%
30.5%33%
30.1% 25.9%
First used the internet on a mobile phoneFirst used the internet on a computer
There is no significant gender effect for mobile phone ownership when controlling the data for income and education
19
Understanding Internet Going Mobile
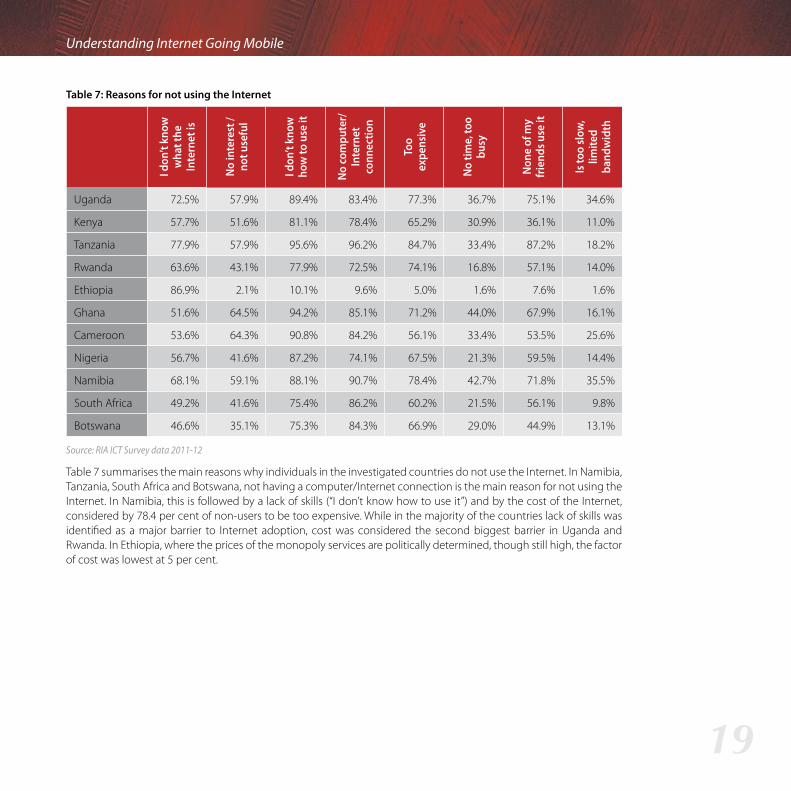
Table 7: Reasons for not using the Internet
I don
’t kn
ow
wha
t the
In
tern
et is
No in
tere
st /
not u
sefu
l
I don
’t kn
ow
how
to u
se it
No co
mpu
ter/
In
tern
et
conn
ectio
n
Too
ex
pens
ive
No ti
me,
too
busy
None
of m
y fri
ends
use
it
Is to
o slo
w,
limite
d ba
ndw
idth
Uganda 72.5% 57.9% 89.4% 83.4% 77.3% 36.7% 75.1% 34.6%
Kenya 57.7% 51.6% 81.1% 78.4% 65.2% 30.9% 36.1% 11.0%
Tanzania 77.9% 57.9% 95.6% 96.2% 84.7% 33.4% 87.2% 18.2%
Rwanda 63.6% 43.1% 77.9% 72.5% 74.1% 16.8% 57.1% 14.0%
Ethiopia 86.9% 2.1% 10.1% 9.6% 5.0% 1.6% 7.6% 1.6%
Ghana 51.6% 64.5% 94.2% 85.1% 71.2% 44.0% 67.9% 16.1%
Cameroon 53.6% 64.3% 90.8% 84.2% 56.1% 33.4% 53.5% 25.6%
Nigeria 56.7% 41.6% 87.2% 74.1% 67.5% 21.3% 59.5% 14.4%
Namibia 68.1% 59.1% 88.1% 90.7% 78.4% 42.7% 71.8% 35.5%
South Africa 49.2% 41.6% 75.4% 86.2% 60.2% 21.5% 56.1% 9.8%
Botswana 46.6% 35.1% 75.3% 84.3% 66.9% 29.0% 44.9% 13.1%
Source: RIA ICT Survey data 2011-12
Table 7 summarises the main reasons why individuals in the investigated countries do not use the Internet. In Namibia, Tanzania, South Africa and Botswana, not having a computer/Internet connection is the main reason for not using the Internet. In Namibia, this is followed by a lack of skills (“I don’t know how to use it”) and by the cost of the Internet, considered by 78.4 per cent of non-users to be too expensive. While in the majority of the countries lack of skills was identified as a major barrier to Internet adoption, cost was considered the second biggest barrier in Uganda and Rwanda. In Ethiopia, where the prices of the monopoly services are politically determined, though still high, the factor of cost was lowest at 5 per cent.

20
Evidence for ICT Policy Action
Policy implications
Since the 2007/08 Research ICT Africa household and individual usage survey, Internet penetration has increased significantly across all the countries surveyed. In the previous ICT survey, Internet access and use was negligible other than in Namibia, Kenya and South Africa. The first wave of Internet access was through personal computers and laptops, and through fixed-line connections (dial-up modems) – for those few Africans with access to the Internet, it was predominantly at aggregated access points such as Internet cafés. This remained the access route for early adopters, and the high costs of such services and devices saw the high-end customer segment of the Internet market rapidly become saturated.
With the emergence of Internet-enabled mobile phones and the lower bandwidth adaptations of applications, particularly social media, the mobile phone is increasingly becoming the key entry point for Internet adoption on the continent. This is most evident in Nigeria, Uganda and Ethiopia. but is also an emerging trend in Namibia and Tanzania. However, in terms of Internet users, Ethiopia is being held back by absence of competition, and Uganda by a competitive market with low tariffs set by operators but made unaffordable by significant taxes and duties on telecommunications services.
The policy implications of the shift, in appreciable numbers, from limited Internet access at public access points serviced primarily by fixed access lines to mobile Internet access are significant. Just as earlier reform strategies of increasing competition in the mobile market increased access to voice services more successfully than traditional fixed-line universal service strategies, mobile telephony again appears to be addressing the Internet gap.
Competition in mobile markets appears to more effectively and rapidly address the efficiency gap in the market, resulting in an increase in the choice of services and a reduction in prices. Strategies that seek to aggregate broadband users at public access points, funded by complex levies and subsides, again seem to have been overtaken by the increasing availability of mobile Internet access, as feature phones and smart phones become more available to individual users.
Until such devices are more affordable and pervasive, equitable access to the Internet will remain an issue. In most countries, price is still identified as the main barrier for those who do have access to the Internet. However, access and use have increased dramatically with the reduction in prices of the past few years, both as a result of the declining cost of Internet-enabled handsets and the reduced cost of international bandwidth. This has presented a new policy and business challenge. Just five years ago, the international bandwidth made up over 70 per cent of the cost of bandwidth for domestic Internet service providers. With the landing of multiple competing networks ending the SAT 3 monopoly that existed across much of the continent, the cost of international bandwidth has plummeted. The cost of local bandwidth is now the major cost for local service providers, with the limited supply of domestic high-capacity bandwidth in most African countries. With revenues still coming primarily from voice services, mobile backhaul networks, dimensioned primarily for voice services, are simply not able to cope with the bandwidth demand being placed on them as customers move increasingly to data-based services, driven mainly by social networking. Interestingly, while the price of data remains high in all jurisdictions, social networks and the “free” message services attached to them, or as part of smart-phone offerings, appear to be substitutes for the mobile voice and SMS services, which remain relatively expensive.
The return to the fundamental infrastructure issues of funding the construction of (now broadband) networks is again a challenge for countries across the globe. While the conditions can be created to encourage private sector investment
The mobile phone is increasingly becoming the key entry point for internet adoption on the continent
21
Understanding Internet Going Mobile
in metropolitan areas and sometimes on intercity routes, challenges remain in getting services to uneconomic areas. While state intervention to address this may be necessary, strategies should be careful not to squeeze out willing private sector investment, especially with unsustainable state interventions. However, a case may be made in certain countries that are unable to attract competitors in the infrastructure market beyond the main metropolitan markets either to separate out the national backbone from other services being offered by an incumbent or to combine a number of smaller competing backbones that are not able to successfully cover the country into a single open access network on which competitors can offer services.
Capitalising such networks can be achieved through public-private partnerships or the directing of private capital through incentives to support such initiatives. It is not required that such a network be state-owned or operated. In fact, global evidence indicates that privately operated entities tend to be more efficient, but for the benefits to be passed on to consumers in uncompetitive markets, regulation is usually required. Avoiding unnecessary duplication of infrastructure can also be extended to the local access networks, where infrastructure-sharing can be encouraged or required, in the case of both fixed and mobile services.
It is also becoming increasingly clear that issues of Internet access can no longer simply be dealt with at the level of infrastructure and services. If Internet access is a priority, far more attention will need to be paid to the development of relevant content and applications, together with the systems of trust, privacy and security associated with their development.
Other demand-stimulation strategies, such as reduction of taxes on devices or removal of VAT, could also drive take-up of Internet-enabled devices. Mobile phones with more affordable prepaid rates allow less-affluent people to gain access to the Internet. This increases the potential for effective citizen participation and economic inclusion. People can recharge airtime to use the Internet whenever they have money available and can use a device with which they are already familiar for Internet access. Mobile phones require less capital to purchase and considerably fewer skills to operate than do computers. Consequently, greater emphasis should be placed on m-government services than on traditional e-government services, which assume computer access to the Internet.
While some of the issues affecting successful uptake of the Internet can be addressed through sector policy and regulation, other challenges are far more fundamentally issues of human development. Evidence of a lack of skills being a significant deterrent for Internet use demonstrates that fair competition and effective regulation needs to be complemented by intergenerational educational strategies, and literacy and e-literacy campaigns, to enable equitable access to enhanced communication services. Likewise, addressing gender equity in access to the Internet more sustainably will be achieved only through more equitable access to education for girls and, therefore, employment opportunities and income, not narrowly based interventions within the sector such as targeting women with gender-specific devices or exceptionally priced services.
There is still substantial progress to be made in reducing barriers to prepaid mobile broadband, ranging from lowering the cost of devices and services to reducing taxation and improving access to underserved areas. Policy in support of greater Internet access will need to balance this new opportunity to affordably access the Internet with the demand for consistent high speed on bandwidth required to optimise Internet use under particular high-usage residential, educational and business circumstances that can determine a country’s global competitiveness.
Internet access can no longer simply be dealt with at the level of infrastructure
If internet access is a priority, far more attention will need to be paid to the associated systems of trust, privacy and security

22
Evidence for ICT Policy Action
Adam, L. (2010), “Ethiopia ICT sector performance review 2009/2010: Towards evidence-based ICT policy and regulation”, Volume 2, Policy Paper 9, Research ICT Africa, available at: http://www.researchictafrica.net/publications/ (accessed March 2012).
Bhavnani, A., Won-Wai Chiu, R., Janakiram, S. and Silarszky, P. (2008), “The role of mobile phones in sustainable rural poverty reduction”, ICT Policy Division, Global Information and Communications Department, World Bank.
Canning, D. (1999), “Infrastructure’s contribution to aggregate output”, World Bank Policy Research Working Paper 2246, available at: http://elibrary.worldbank.org/content/workingpaper/10.1596/1813-9450-2246.
Cronin, F. J., Colleran, E. K., Herbert, P. L. and Lewitzky, S. (1993a), “Telecommunications and growth: The contribution of telecommunications infrastructure investment to aggregate and sectoral productivity”, Telecommunications Policy, Vol. 17 No. 9), pp. 677–690.
Cronin, F. J., Colleran, E. K., Parker, E. B. and Gold, M. A. (1993b), “Telecommunications infrastructure investment and economic development”, Telecommunications Policy, Vol. 17 No. 6, pp. 415–430.
De Silva, H. (2005), “An innovative fruit and vegetable market information and price gathering system in Sri Lanka: The Govi Gnana (Farmer Knowledge) Service”, paper presented at the USAID and World Bank-sponsored workshop, Inaugurating New Partnerships in the Global Food Chain, at the 15th Annual World Food and Agribusiness Forum, Symposium and Case Conference, Chicago, USA.
Flor, A. G. (2001), “ICT and poverty: The indisputable link”, paper presented at the Third Asia Development Forum on Regional Economic Cooperation in Asia and the Pacific, Asian Development Bank, June, Bangkok.
Gillwald, A. and Stork, C. (2008), “Towards evidence-based ICT policy and regulation: ICT access and usage in Africa”, Volume 1, Policy Paper 2, ISSN 2073-0845.
Hardy, A. (1980), “The role of telephone in economic development”, Telecommunications Policy, Vol. 4 No. 4, pp. 278–86.
Hare, H. (2007), “ICT in education in Ethiopia”, infoDev, available at: http://www.infodev.org/en/Publication.402.html.
Hatem Ali, A. H. (2011), “The power of social media in developing nations: New tools for closing the global digital divide and beyond”, Harvard Human Rights Journal, Vol. 24, pp. 186–219.
ITU (International Telecommunication Union) (2012), “The state of broadband 2012: Achieving digital inclusion for all”, a report by the Broadband Commission, September, available at: http://www.broadbandcommission.org/Documents/bb-annualreport2012.pdf (accessed February 2013).
Jagun, A., Heeks, R. and Whalley, J. (2008), “The impact of mobile telephony on developing country micro-enterprise: A Nigerian case study”, Information Technologies and International Development Journal, Vol. 4 No. 4, pp. 47–65.
Jipp, A. (1963), Wealth of nations and telephone density”, Telecommunication Journal, July, pp. 199–201.
Kenny, C. (2002), “Information and communication technologies for direct poverty alleviation: Costs and benefits”, Development Policy Review, Vol. 20 No. 2, pp. 141–157.
Kim, Y., Kelly, T., and Raja, S. (2010), “Building broadband: Strategies and policies for the developing world”, Global Information and Communication Technologies (GICT) Department, World Bank, January.
Koutroumpis P. (2009), “The economic impact of broadband on growth: A simultaneous approach”, Telecommunications Policy, Vol. 33 No. 9, pp. 471–485.
Livingstone, S., K Ólafsson, K. and Staksrud, E. (2011), “Social networking, age and privacy”, available at: http://www2.lse.ac.uk/media@lse/research/EUKidsOnline/ShortSNS.pdf/ (accessed February 2013).
Lwanga, S. and Lemeshow, S. (1991), Sample Size Determination in Health Studies – A Practical Manual, World Health Organisation, Geneva.
Milek A., Stork, C. and Gillwald, A. (2010), “A gender assessment of ICT access and usage in Africa: Towards evidence based policy”, Vol. 1, Policy Paper 5, Research ICT Africa, available at: www.researchICTafrica.net.
Obayelu, A. and Ogunlade, I. (2006), “Analysis of the uses of information communication technology (ICT) for gender empowerment and sustainable poverty alleviation in Nigeria”, International Journal of Education and Development using ICT, Vol. 2 No. 3, available at: http://ijedict.dec.uwi.edu/viewarticle.php?id=172.
Oyewumi, O. A. (2006), “Agricultural market development through information and communication technology (ICT): A developing country experience”, International Food and Agribusiness Management Review, Vol. 9 No. 2.
References

23
Understanding Internet Going Mobile
Ndung’u, M. N. and Waema, T. M. (2011), “Development outcomes of Internet and mobile phones use in Kenya: The households’ perspectives”, Info, Vol. 13 No. 3, pp. 110–124.
Rea, L. and Parker, R. (1997), Designing and Conducting Survey Research: A Comprehensive Guide, Jossey-Bass Publishers, San Francisco.
Rheingold, H. (2005), “Farmers, phones and markets: Mobile technology in rural development”, The Feature, available at: http://www.thefeaturearchives.com/topic/Technology/Farmers__Phones_and_Markets__Mobile_Technology_In_Rural_Development.html.
Röller, L.-H. and Waverman, L. (2001), “Telecommunications infrastructure and economic development: A simultaneous approach”, American Economic Review, Vol. 91 No. 4, pp. 909–923.
Sen, A. (1992), Inequality Re-examined, Oxford University Press, Oxford.
Ssewanyana, J. K. (2007), “ICT access and poverty in Uganda”, International Journal of Computing and ICT Research, Vol. 1 No. 2, pp. 10–19, available at: http://www.ijcir.org/volume1-number2/article2.pdf.
UNSD (United Nations Statistics Division) (2005), Designing Household Surveys Samples: Practical Guidelines, United Nations, New York.

ISSN: 2310-1156