policy as myth and ceremony: overviewpolicy as myth and...
TRANSCRIPT

Policy as Myth and Ceremony?The Global Spread of Stock Exchanges, 1980 - 2005
Policy as Myth and Ceremony?The Global Spread of Stock Exchanges, 1980 - 2005
Klaus Weber, Northwestern UJerry Davis, U MichiganJerry Davis, U Michigan
Mike Lounsbury, U Alberta
The Networks WorkshopThe University of Michigan
J 12 2010January 12, 2010
Policy as Myth and Ceremony: OverviewPolicy as Myth and Ceremony: Overview
1. Motivation and Executive Summary
2. Context: Financial Markets and Economic Development
3. Theory: Decoupling in Global Institutional Processes
4. Hypotheses and Methods
5. Findings: Formal Adoption and Vibrancy of Markets
6 Implications and Conclusions6. Implications and Conclusions
2
Why Care About This Study?Why Care About This Study?
Institutional Theory• World Society perspective (Meyer et al 1997)• World Society perspective (Meyer et al., 1997)
– Countries are like organizations, create formal policies and structures to gain legitimacy, e.g., environmental protection, privatization, democracy
– Mechanisms: peer nation influence, transnational professionals and agenciesI tit ti l d li ?• Institutional decoupling?
– Implicit assumption that these actions are often ceremonial, i.e. form trumps functioning; due to motives of local actors and misfit with local context
-> But: Almost no empirical work on the consequences of ‘institutional’ p qadoption of structures and practices
Economic Development • Financial market model of economic development (e g IMF WB)Financial market model of economic development (e.g., IMF, WB)
– Private investments and financial markets solve problems of capital, transparency and governance in development finance, neoliberal logic of development
– Significant expansion of market-based systems since 1980s (“Washington C ”)
3
Consensus”)-> But: Do these markets actually work (in a technical sense)?
Research Question & AnswerResearch Question & Answer
Do global institutional processes in the adoption of policies and practices undermine the effectiveness of these practices?practices undermine the effectiveness of these practices?
• Are global institutional processes associated with ceremonial adoption?• Does ‘institutional’ practice diffusion make for bad (economic) policy?
The master proposition:• It depends on the mechanism of global diffusion
St d d iStudy design:• Data: new national stock markets since 1980 (113 countries, 58 new exchanges)• Hypotheses: Do predictors of exchange creation also predict vibrancy?• Survival analysis of exchange creation, panel and spatial econometric analysis of
exchange vibrancy (companies listed, market capitalization)
Findings:
4
• Coercive channels (IMF aid) were associated with more ceremonial adoption• Competitive, learning and status-based channels led to greater vibrancy
OverviewOverview
1. Motivation and Executive Summary
2. Context: Financial Markets and Economic Development
3. Theory: Decoupling in Global Institutional Processes
4. Hypotheses and Methods
5. Findings: Formal Adoption and Vibrancy of Markets
6 Implications and Conclusions6. Implications and Conclusions
5
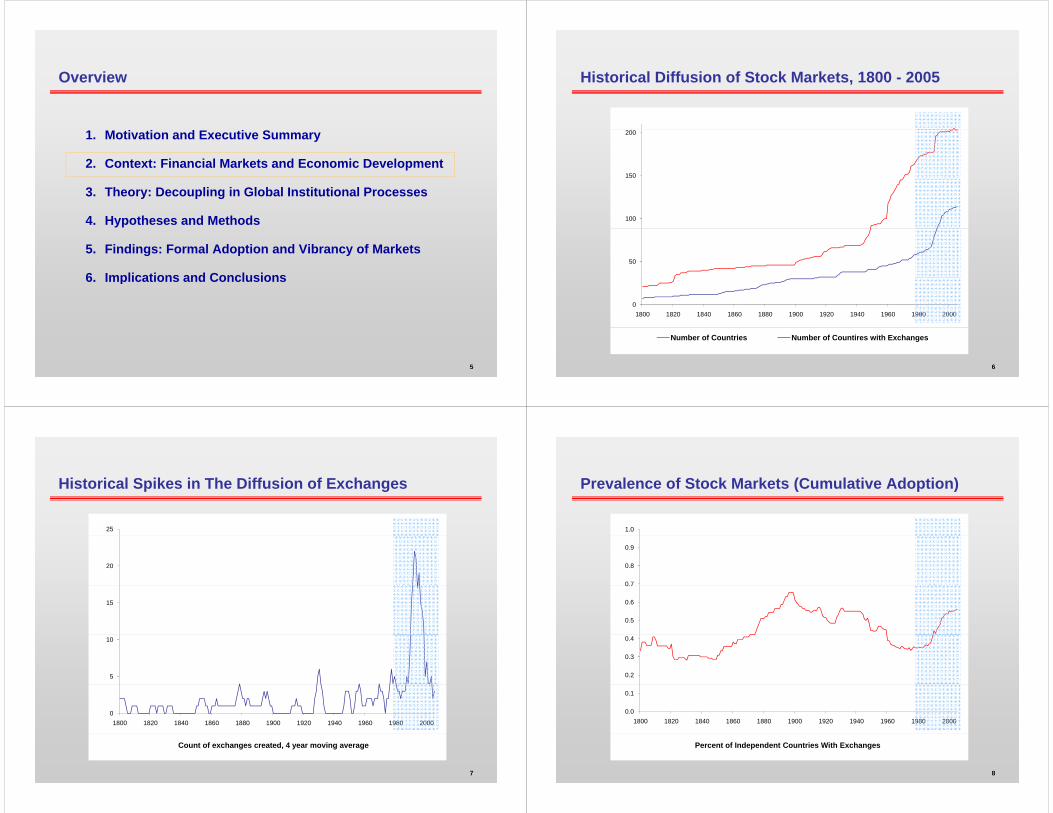
Historical Diffusion of Stock Markets 1800 - 2005Historical Diffusion of Stock Markets, 1800 2005
150
200
100
50
01800 1820 1840 1860 1880 1900 1920 1940 1960 1980 2000
6
Number of Countries Number of Countires with Exchanges
Historical Spikes in The Diffusion of Exchanges
25
Historical Spikes in The Diffusion of Exchanges
20
15
5
10
01800 1820 1840 1860 1880 1900 1920 1940 1960 1980 2000
7
Count of exchanges created, 4 year moving average
Prevalence of Stock Markets (Cumulative Adoption)
1.0
Prevalence of Stock Markets (Cumulative Adoption)
0 7
0.8
0.9
0.5
0.6
0.7
0.2
0.3
0.4
0.0
0.1
1800 1820 1840 1860 1880 1900 1920 1940 1960 1980 2000
8
Percent of Independent Countries With Exchanges
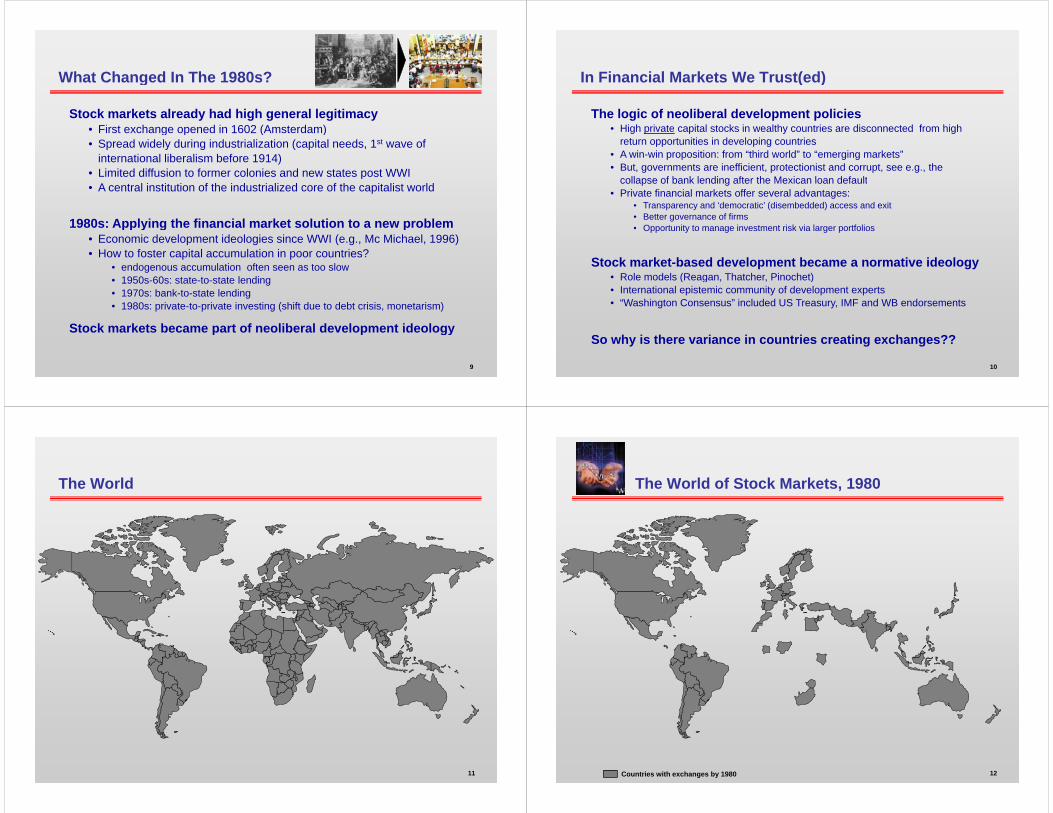
What Changed In The 1980s?What Changed In The 1980s?
Stock markets already had high general legitimacy• First exchange opened in 1602 (Amsterdam)• First exchange opened in 1602 (Amsterdam)• Spread widely during industrialization (capital needs, 1st wave of
international liberalism before 1914)• Limited diffusion to former colonies and new states post WWIp• A central institution of the industrialized core of the capitalist world
1980s: Applying the financial market solution to a new problempp y g p• Economic development ideologies since WWI (e.g., Mc Michael, 1996)• How to foster capital accumulation in poor countries?
• endogenous accumulation often seen as too slow1950 60 t t t t t l di• 1950s-60s: state-to-state lending
• 1970s: bank-to-state lending• 1980s: private-to-private investing (shift due to debt crisis, monetarism)
Stock markets became part of neoliberal development ideology
9
Stock markets became part of neoliberal development ideology
In Financial Markets We Trust(ed)In Financial Markets We Trust(ed)
The logic of neoliberal development policies• High private capital stocks in wealthy countries are disconnected from high• High private capital stocks in wealthy countries are disconnected from high
return opportunities in developing countries• A win-win proposition: from “third world” to “emerging markets”• But, governments are inefficient, protectionist and corrupt, see e.g., the
collapse of bank lending after the Mexican loan defaultcollapse of bank lending after the Mexican loan default• Private financial markets offer several advantages:
• Transparency and ‘democratic’ (disembedded) access and exit• Better governance of firms• Opportunity to manage investment risk via larger portfolios• Opportunity to manage investment risk via larger portfolios
Stock market-based development became a normative ideology• Role models (Reagan Thatcher Pinochet)• Role models (Reagan, Thatcher, Pinochet)• International epistemic community of development experts• “Washington Consensus” included US Treasury, IMF and WB endorsements
10
So why is there variance in countries creating exchanges??
The WorldThe World
11
The World of Stock Markets 1980The World of Stock Markets, 1980
12Countries with exchanges by 1980
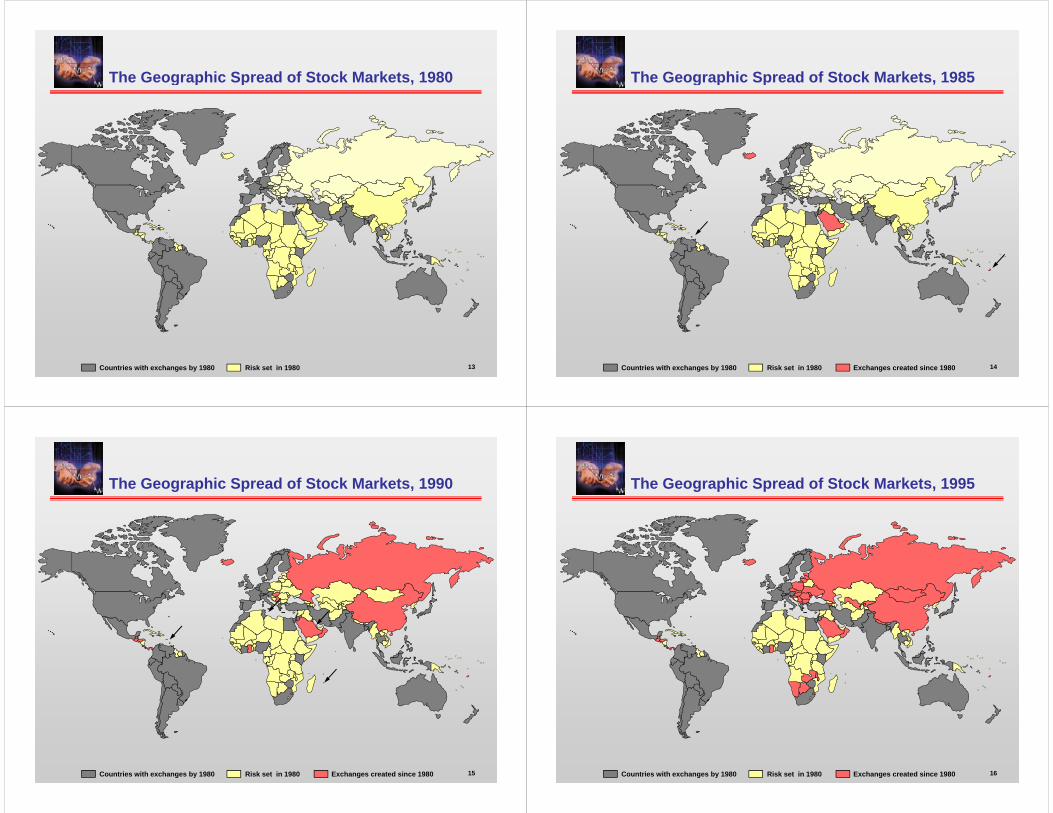
The Geographic Spread of Stock Markets 1980The Geographic Spread of Stock Markets, 1980
13Countries with exchanges by 1980 Risk set in 1980
The Geographic Spread of Stock Markets 1985The Geographic Spread of Stock Markets, 1985
14Countries with exchanges by 1980 Risk set in 1980 Exchanges created since 1980
The Geographic Spread of Stock Markets 1990The Geographic Spread of Stock Markets, 1990
15Countries with exchanges by 1980 Risk set in 1980 Exchanges created since 1980
The Geographic Spread of Stock Markets 1995The Geographic Spread of Stock Markets, 1995
16Countries with exchanges by 1980 Risk set in 1980 Exchanges created since 1980
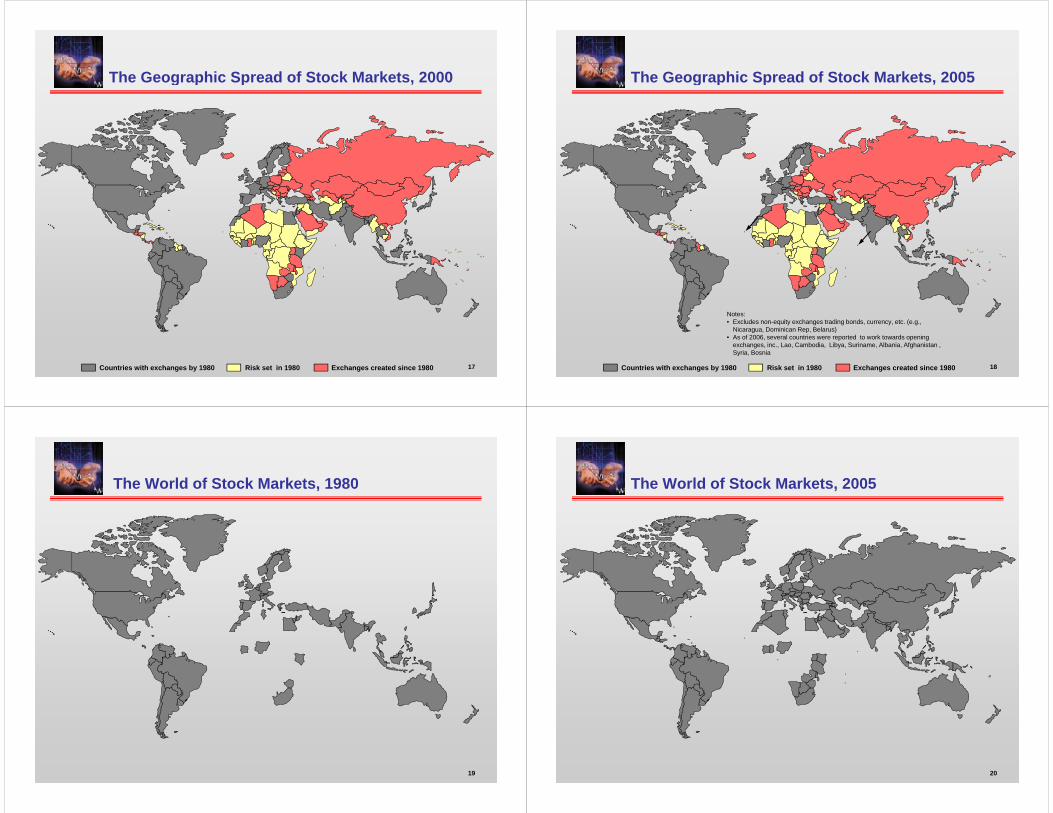
The Geographic Spread of Stock Markets 2000The Geographic Spread of Stock Markets, 2000
17Countries with exchanges by 1980 Risk set in 1980 Exchanges created since 1980
The Geographic Spread of Stock Markets 2005The Geographic Spread of Stock Markets, 2005
Notes:• Excludes non-equity exchanges trading bonds, currency, etc. (e.g.,
Ni D i i R B l )
18Countries with exchanges by 1980 Risk set in 1980 Exchanges created since 1980
Nicaragua, Dominican Rep, Belarus)• As of 2006, several countries were reported to work towards opening
exchanges, inc., Lao, Cambodia, Libya, Suriname, Albania, Afghanistan , Syria, Bosnia
The World of Stock Markets 1980The World of Stock Markets, 1980
19
The World of Stock Markets 2005The World of Stock Markets, 2005
20
OverviewOverview
1. Motivation and Executive Summary
2. Context: Financial Markets and Economic Development
3. Theory: Decoupling in Global Institutional Processes
4. Hypotheses and Methods
5. Findings: Formal Adoption and Vibrancy of Markets
6 Implications and Conclusions6. Implications and Conclusions
21
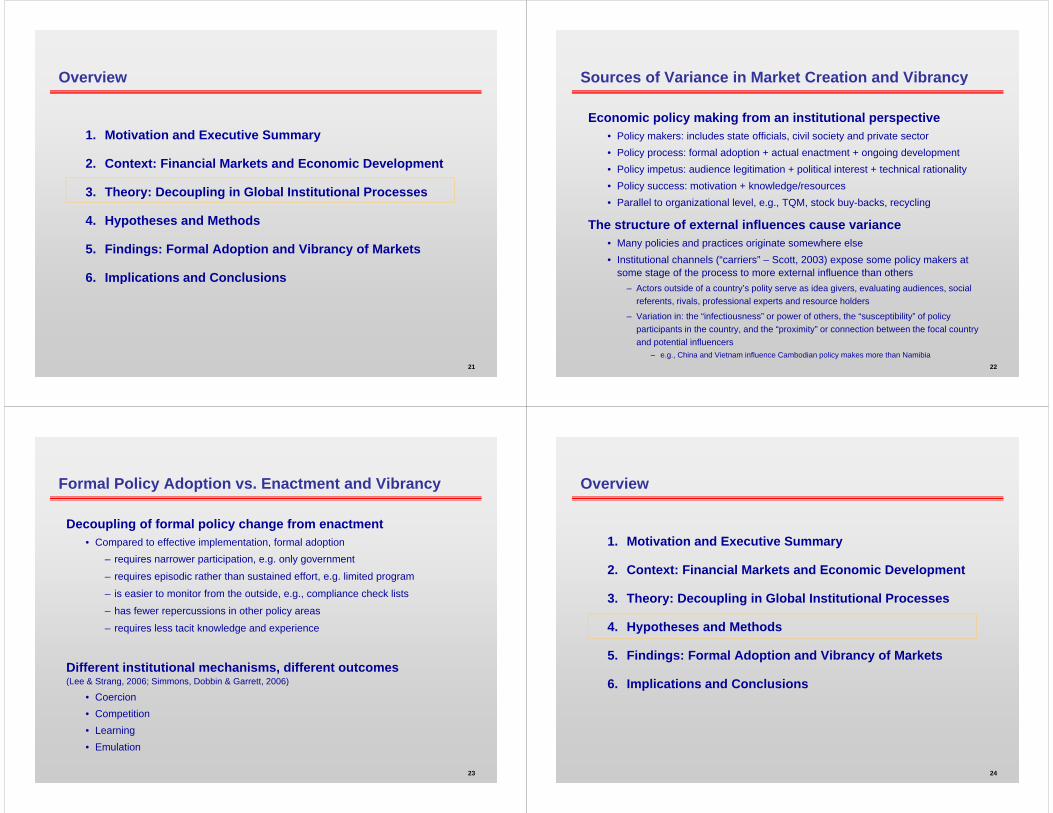
Sources of Variance in Market Creation and VibrancySources of Variance in Market Creation and Vibrancy
Economic policy making from an institutional perspective• Policy makers: includes state officials, civil society and private sector• Policy process: formal adoption + actual enactment + ongoing development• Policy impetus: audience legitimation + political interest + technical rationality• Policy success: motivation + knowledge/resources• Parallel to organizational level, e.g., TQM, stock buy-backs, recycling
The structure of external influences cause varianceThe structure of external influences cause variance• Many policies and practices originate somewhere else• Institutional channels (“carriers” – Scott, 2003) expose some policy makers at
some stage of the process to more external influence than othersg p– Actors outside of a country’s polity serve as idea givers, evaluating audiences, social
referents, rivals, professional experts and resource holders
– Variation in: the “infectiousness” or power of others, the “susceptibility” of policy participants in the co ntr and the “pro imit ” or connection bet een the focal co ntr
22
participants in the country, and the “proximity” or connection between the focal country and potential influencers
– e.g., China and Vietnam influence Cambodian policy makes more than Namibia
Formal Policy Adoption vs Enactment and VibrancyFormal Policy Adoption vs. Enactment and Vibrancy
Decoupling of formal policy change from enactment• Compared to effective implementation, formal adoption
– requires narrower participation, e.g. only government
– requires episodic rather than sustained effort, e.g. limited program
– is easier to monitor from the outside, e.g., compliance check lists
– has fewer repercussions in other policy areas
– requires less tacit knowledge and experience
Different institutional mechanisms, different outcomes (Lee & Strang, 2006; Simmons, Dobbin & Garrett, 2006)(Lee & Strang, 2006; Simmons, Dobbin & Garrett, 2006)
• Coercion• Competition• Learning
23
Learning• Emulation
OverviewOverview
1. Motivation and Executive Summary
2. Context: Financial Markets and Economic Development
3. Theory: Decoupling in Global Institutional Processes
4. Hypotheses and Methods
5. Findings: Formal Adoption and Vibrancy of Markets
6 Implications and Conclusions6. Implications and Conclusions
24
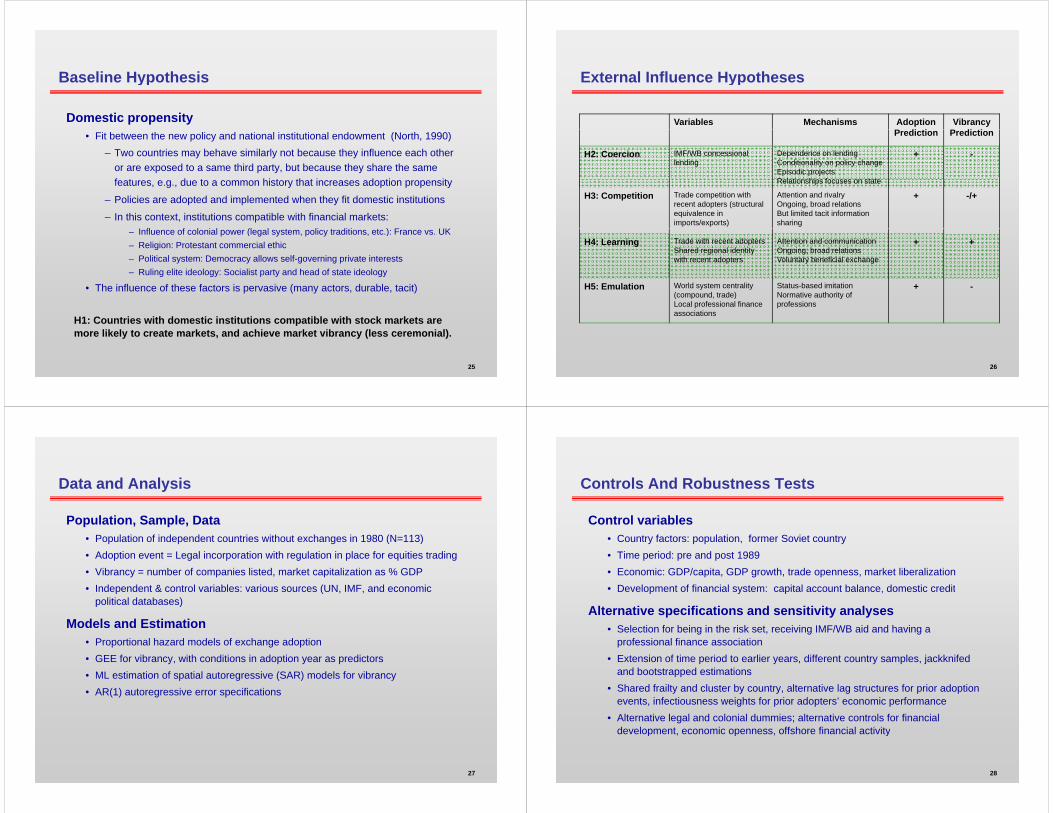
Baseline HypothesisBaseline Hypothesis
Domestic propensity• Fit between the new policy and national institutional endowment (North, 1990)
– Two countries may behave similarly not because they influence each other or are exposed to a same third party, but because they share the same f t d t hi t th t i d ti itfeatures, e.g., due to a common history that increases adoption propensity
– Policies are adopted and implemented when they fit domestic institutions
– In this context, institutions compatible with financial markets:I fl f l i l (l l t li t diti t ) F UK– Influence of colonial power (legal system, policy traditions, etc.): France vs. UK
– Religion: Protestant commercial ethic– Political system: Democracy allows self-governing private interests– Ruling elite ideology: Socialist party and head of state ideology
• The influence of these factors is pervasive (many actors, durable, tacit)
H1: Countries with domestic institutions compatible with stock markets are
25
more likely to create markets, and achieve market vibrancy (less ceremonial).
External Influence HypothesesExternal Influence Hypotheses
Variables Mechanisms AdoptionP di i
Vibrancy P di iPrediction Prediction
H2: Coercion IMF/WB concessional lending
Dependence on lendingConditionality on policy changeEpisodic projectsR l ti hi f t t
+ -
Relationships focuses on state
H3: Competition Trade competition with recent adopters (structural equivalence in imports/exports)
Attention and rivalryOngoing, broad relationsBut limited tacit information sharing
+ -/+
H4: Learning Trade with recent adoptersShared regional identity with recent adopters
Attention and communicationOngoing, broad relationsVoluntary beneficial exchange
+ +
H5: Emulation World system centrality(compound, trade)Local professional finance associations
Status-based imitationNormative authority of professions
+ -
26
Data and AnalysisData and Analysis
Population, Sample, DataP l ti f i d d t t i ith t h i 1980 (N 113)• Population of independent countries without exchanges in 1980 (N=113)
• Adoption event = Legal incorporation with regulation in place for equities trading• Vibrancy = number of companies listed, market capitalization as % GDP
I d d t & t l i bl i (UN IMF d i• Independent & control variables: various sources (UN, IMF, and economic political databases)
Models and Estimation• Proportional hazard models of exchange adoption • GEE for vibrancy, with conditions in adoption year as predictors• ML estimation of spatial autoregressive (SAR) models for vibrancy• AR(1) autoregressive error specifications
27
Controls And Robustness TestsControls And Robustness Tests
Control variablesC t f t l ti f S i t t• Country factors: population, former Soviet country
• Time period: pre and post 1989• Economic: GDP/capita, GDP growth, trade openness, market liberalization
D l t f fi i l t it l t b l d ti dit• Development of financial system: capital account balance, domestic credit
Alternative specifications and sensitivity analyses• Selection for being in the risk set, receiving IMF/WB aid and having a
professional finance association• Extension of time period to earlier years, different country samples, jackknifed
and bootstrapped estimationsSh d f il d l b l i l f i d i• Shared frailty and cluster by country, alternative lag structures for prior adoption events, infectiousness weights for prior adopters’ economic performance
• Alternative legal and colonial dummies; alternative controls for financial development, economic openness, offshore financial activity
28
development, economic openness, offshore financial activity
OverviewOverview
1. Motivation and Executive Summary
2. Context: Financial Markets and Economic Development
3. Theory: Decoupling in Global Institutional Processes
4. Hypotheses and Methods
5. Findings: Formal Adoption and Vibrancy of Markets
6 Implications and Conclusions6. Implications and Conclusions
29
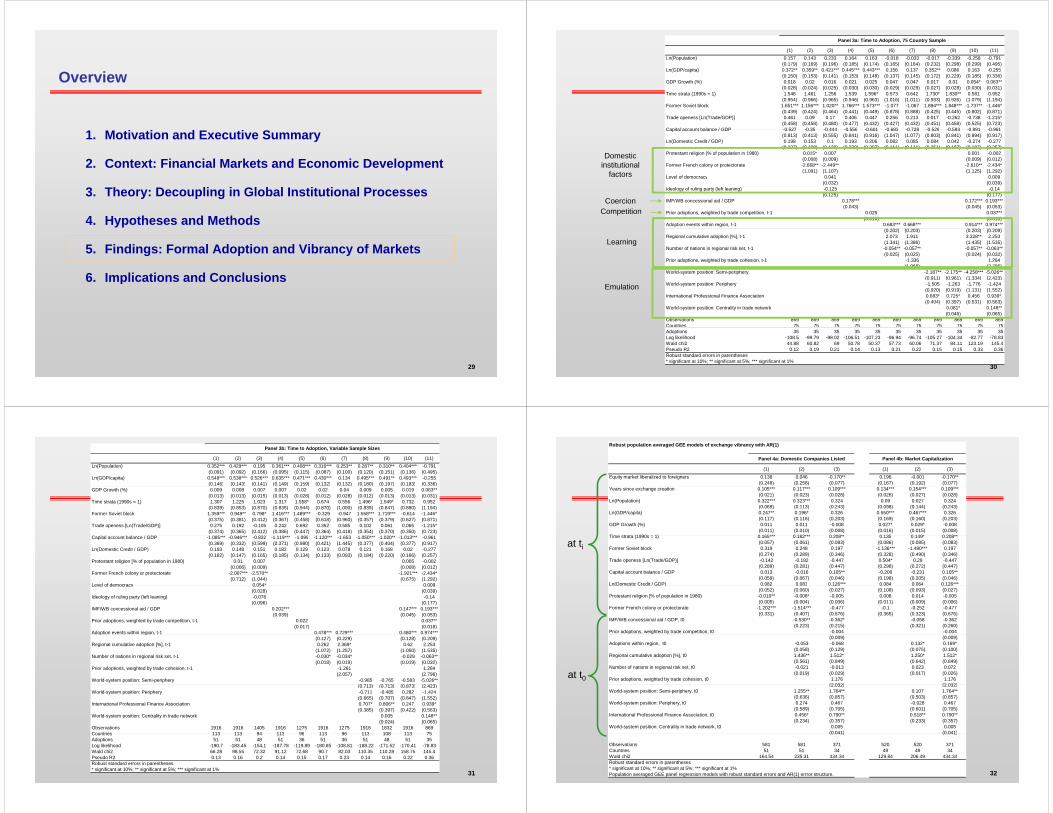
(1) (2) (3) (4) (5) (6) (7) (8) (9) (10) (11)Ln(Population) 0.157 0.143 0.233 0.164 0.163 -0.018 -0.033 -0.017 -0.339 -0.258 -0.791
(0.179) (0.169) (0.196) (0.185) (0.174) (0.165) (0.164) (0.232) (0.298) (0.299) (0.495)Ln(GDP/capita) 0.372** 0.359** 0.421*** 0.445*** 0.443*** 0.156 0.137 0.352** 0.086 0.163 -0.255
(0.150) (0.153) (0.141) (0.153) (0.148) (0.137) (0.145) (0.172) (0.229) (0.185) (0.336)
Panel 3a: Time to Adoption, 75 Country Sample
GDP Growth (%) 0.018 0.02 0.016 0.021 0.025 0.047 0.047 0.017 0.01 0.054* 0.063**(0.028) (0.024) (0.025) (0.030) (0.030) (0.029) (0.029) (0.027) (0.028) (0.030) (0.031)
Time strata (1990s = 1) 1.546 1.461 1.256 1.539 1.596* 0.573 0.642 1.730* 1.830** 0.581 0.952(0.954) (0.966) (0.965) (0.946) (0.963) (1.016) (1.011) (0.933) (0.926) (1.079) (1.194)
Former Soviet block 1.651*** 1.156*** 1.020** 1.766*** 1.573*** -1.077 -1.067 1.894*** 1.848*** -1.737** -1.446*(0.439) (0.424) (0.464) (0.441) (0.449) (0.878) (0.888) (0.425) (0.445) (0.802) (0.871)
Trade openess [Ln(Trade/GDP)] 0.461 0.09 0.17 0.406 0.447 0.256 0.213 0.017 -0.262 -0.738 -1.215*(0.458) (0.458) (0.480) (0.477) (0.432) (0.427) (0.432) (0.451) (0.458) (0.525) (0.723)
Capital account balance / GDP 0 527 0 35 0 444 0 556 0 601 0 683 0 728 0 529 0 593 0 891 0 961Capital account balance / GDP -0.527 -0.35 -0.444 -0.556 -0.601 -0.683 -0.728 -0.529 -0.593 -0.891 -0.961(0.813) (0.413) (0.555) (0.841) (0.916) (1.047) (1.077) (0.803) (0.841) (0.894) (0.917)
Ln(Domestic Credit / GDP) 0.198 0.153 0.1 0.193 0.206 0.082 0.085 0.084 0.042 -0.274 -0.277(0.237) (0.198) (0.129) (0.239) (0.207) (0.111) (0.111) (0.251) (0.187) (0.187) (0.257)
Protestant religion [% of population in 1980) 0.015* 0.007 0.001 -0.002(0.008) (0.009) (0.009) (0.012)
Former French colony or protectorate -2.668** -2.449** -2.610** -2.434*(1.091) (1.107) (1.125) (1.292)
Level of democracy 0.041 0.009
Domestic institutional
factors y(0.032) (0.039)
Ideology of ruling party (left leaning) -0.125 -0.14(0.125) (0.177)
IMF/WB concessional aid / GDP 0.178*** 0.172*** 0.193***(0.043) (0.045) (0.053)
Prior adoptions, weighted by trade competition, t-1 0.025 0.037**(0.016) (0.018)
Adoption events within region, t-1 0.683*** 0.668*** 0.914*** 0.974***
CoercionCompetition
(0.202) (0.203) (0.203) (0.209)Regional cumulative adoption [%], t-1 2.073 1.911 3.328** 2.253
(1.341) (1.386) (1.435) (1.535)Number of nations in regional risk set, t-1 -0.054** -0.057** -0.057** -0.063**
(0.025) (0.025) (0.024) (0.032)Prior adoptions, weighted by trade cohesion, t-1 -1.336 1.284
(1.968) (2.796)World-system position: Semi-periphery -2.187** -2.175** -4.258*** -5.026**
(0 911) (0 961) (1 334) (2 423)
Learning
(0.911) (0.961) (1.334) (2.423)World-system position: Periphery -1.505 -1.263 -1.776 -1.424
(0.920) (0.919) (1.131) (1.552)International Professional Finance Association 0.683* 0.725* 0.456 0.939*
(0.404) (0.397) (0.531) (0.563)World-system position: Centrality in trade network 0.081* 0.148**
(0.046) (0.065)Observations 869 869 869 869 869 869 869 869 869 869 869Countries 75 75 75 75 75 75 75 75 75 75 75
Emulation
30
Adoptions 35 35 35 35 35 35 35 35 35 35 35Log likelihood -108.5 -99.79 -98.02 -106.51 -107.23 -96.94 -96.74 -105.27 -104.34 -82.77 -78.83Wald chi2 44.88 60.82 69 50.78 50.37 57.73 60.06 71.37 84.11 123.19 145.4Pseudo R2 0.12 0.19 0.21 0.14 0.13 0.21 0.22 0.15 0.15 0.33 0.36Robust standard errors in parentheses* significant at 10%; ** significant at 5%; *** significant at 1%
(1) (2) (3) (4) (5) (6) (7) (8) (9) (10) (11)Ln(Population) 0.352*** 0.429*** 0.195 0.361*** 0.408*** 0.316*** 0.253** 0.287** 0.310** 0.404*** -0.791
(0.091) (0.092) (0.166) (0.095) (0.115) (0.087) (0.100) (0.120) (0.151) (0.136) (0.495)Ln(GDP/capita) 0.548*** 0.538*** 0.526*** 0.635*** 0.471*** 0.430*** 0.134 0.495*** 0.491** 0.493*** -0.255
(0.146) (0.143) (0.141) (0.149) (0.159) (0.132) (0.132) (0.180) (0.197) (0.183) (0.336)
Panel 3b: Time to Adoption, Variable Sample Sizes
( ) ( ) ( ) ( ) ( ) ( ) ( ) ( ) ( ) ( ) ( )GDP Growth (%) 0.009 0.008 0.007 0.007 0.02 0.02 0.04 0.009 0.005 0.019 0.063**
(0.013) (0.013) (0.015) (0.013) (0.028) (0.012) (0.028) (0.012) (0.013) (0.013) (0.031)Time strata (1990s = 1) 1.307 1.225 1.023 1.317 1.558* 0.674 0.556 1.496* 1.549* 0.732 0.952
(0.839) (0.853) (0.870) (0.835) (0.944) (0.870) (1.000) (0.839) (0.847) (0.880) (1.194)Former Soviet block 1.359*** 0.949** 0.798* 1.416*** 1.489*** -0.329 -0.947 1.558*** 1.719*** -0.614 -1.446*
(0.375) (0.381) (0.412) (0.367) (0.458) (0.618) (0.960) (0.357) (0.379) (0.627) (0.871)Trade openess [Ln(Trade/GDP)] 0.275 0.192 -0.105 0.242 0.692 0.352 0.585 0.102 0.061 0.065 -1.215*
(0.374) (0.365) (0.412) (0.386) (0.447) (0.364) (0.418) (0.354) (0.370) (0.350) (0.723)C it l t b l / GDP 1 085*** 0 946*** 0 832 1 119*** 1 099 1 120*** 1 653 1 050*** 1 020** 1 013*** 0 961Capital account balance / GDP -1.085*** -0.946*** -0.832 -1.119*** -1.099 -1.120*** -1.653 -1.050*** -1.020** -1.013*** -0.961
(0.369) (0.332) (0.599) (0.371) (0.980) (0.421) (1.445) (0.377) (0.404) (0.377) (0.917)Ln(Domestic Credit / GDP) 0.193 0.148 0.151 0.182 0.129 0.123 0.078 0.121 0.168 0.02 -0.277
(0.182) (0.147) (0.165) (0.185) (0.134) (0.133) (0.093) (0.184) (0.220) (0.166) (0.257)Protestant religion [% of population in 1980) 0.01 0.007 0.005 -0.002
(0.006) (0.009) (0.008) (0.012)Former French colony or protectorate -2.007*** -2.570** -1.921*** -2.434*
(0.712) (1.044) (0.675) (1.292)Level of democracy 0 054* 0 009Level of democracy 0.054 0.009
(0.028) (0.039)Ideology of ruling party (left leaning) -0.076 -0.14
(0.096) (0.177)IMF/WB concessional aid / GDP 0.202*** 0.147*** 0.193***
(0.039) (0.045) (0.053)Prior adoptions, weighted by trade competition, t-1 0.022 0.037**
(0.017) (0.018)Adoption events within region, t-1 0.478*** 0.729*** 0.480*** 0.974***p g ,
(0.127) (0.229) (0.128) (0.209)Regional cumulative adoption [%], t-1 0.262 2.369* 0.62 2.253
(1.072) (1.257) (1.050) (1.535)Number of nations in regional risk set, t-1 -0.030* -0.034* -0.029 -0.063**
(0.018) (0.019) (0.019) (0.032)Prior adoptions, weighted by trade cohesion, t-1 -1.261 1.284
(2.057) (2.796)World-system position: Semi-periphery -0.985 -0.765 -0.583 -5.026**
(0 13) (0 13) (0 8 3) (2 423)(0.713) (0.713) (0.873) (2.423)World-system position: Periphery -0.711 -0.485 0.282 -1.424
(0.665) (0.707) (0.847) (1.552)International Professional Finance Association 0.707* 0.806** 0.247 0.939*
(0.385) (0.397) (0.422) (0.563)World-system position: Centrality in trade network 0.005 0.148**
(0.024) (0.065)Observations 1916 1916 1405 1916 1275 1916 1275 1916 1832 1916 869Countries 113 113 94 113 96 113 96 113 108 113 75
31
Countries 113 113 94 113 96 113 96 113 108 113 75Adoptions 51 51 48 51 36 51 36 51 48 51 35Log likelihood -190.7 -183.45 -154.1 -187.78 -119.89 -180.85 -108.81 -188.22 -171.52 -170.41 -78.83Wald chi2 66.28 98.55 72.32 91.12 72.68 90.7 82.03 110.35 110.28 158.75 145.4Pseudo R2 0.13 0.16 0.2 0.14 0.15 0.17 0.23 0.14 0.16 0.22 0.36Robust standard errors in parentheses* significant at 10%; ** significant at 5%; *** significant at 1%
Robust population averaged GEE models of exchange vibrancy with AR(1)
(1) (2) (3) (1) (2) (3)Equity market liberalized to foreigners 0.138 0.046 -0.170** 0.196 -0.001 -0.170**
(0.248) (0.258) (0.077) (0.167) (0.192) (0.077)
Panel 4a: Domestic Companies Listed Panel 4b: Market Capitalization
Years since exchange creation 0.105*** 0.117*** 0.109*** 0.134*** 0.154*** 0.109***(0.021) (0.023) (0.028) (0.026) (0.027) (0.028)
Ln(Population) 0.322*** 0.323*** 0.324 0.09 0.027 0.324(0.069) (0.113) (0.243) (0.098) (0.144) (0.243)
Ln(GDP/capita) 0.247** 0.196* 0.326 0.550*** 0.467*** 0.326(0.117) (0.116) (0.203) (0.169) (0.160) (0.203)
GDP Growth (%) 0.011 0.011 -0.008 0.027* 0.029* -0.008(0.011) (0.010) (0.008) (0.016) (0.015) (0.008)
Time strata (1990s = 1) 0 165*** 0 182*** 0 208** 0 135 0 149* 0 208**Time strata (1990s = 1) 0.165*** 0.182*** 0.208** 0.135 0.149* 0.208**(0.057) (0.061) (0.083) (0.086) (0.085) (0.083)
Former Soviet block 0.319 0.248 0.197 -1.136*** -1.480*** 0.197(0.274) (0.289) (0.346) (0.328) (0.490) (0.346)
Trade openess [Ln(Trade/GDP)] -0.142 -0.182 -0.447 0.504* 0.29 -0.447(0.289) (0.281) (0.447) (0.298) (0.272) (0.447)
Capital account balance / GDP 0.013 -0.016 0.105** -0.206 -0.231 0.105**(0.059) (0.067) (0.046) (0.198) (0.205) (0.046)
Ln(Domestic Credit / GDP) 0.082 0.083 0.126*** 0.084 0.064 0.126***
at ti
Ln(Domestic Credit / GDP) 0.082 0.083 0.126 0.084 0.064 0.126(0.052) (0.060) (0.027) (0.108) (0.093) (0.027)
Protestant religion [% of population in 1980) -0.010** -0.008* -0.005 0.008 0.014 -0.005(0.005) (0.004) (0.006) (0.011) (0.009) (0.006)
Former French colony or protectorate -1.202*** -1.514*** -0.477 -0.1 -0.252 -0.477(0.331) (0.407) (0.676) (0.365) (0.323) (0.676)
IMF/WB concessional aid / GDP, t0 -0.530** -0.362* -0.058 -0.362(0.223) (0.215) (0.321) (0.260)
Prior adoptions, weighted by trade competition, t0 -0.004 -0.004(0.009) (0.009)
Adoptions within region, t0 -0.053 -0.068 0.132* 0.169*(0.058) (0.129) (0.075) (0.100)
Regional cumulative adoption [%], t0 1.436** 1.512* 1.250* 1.512*(0.561) (0.849) (0.642) (0.849)
Number of nations in regional risk set, t0 -0.021 -0.013 0.023 0.072(0.019) (0.029) (0.017) (0.026)
Prior adoptions, weighted by trade cohesion, t0 1.176 1.176(2 032) (2 032)
at t0(2.032) (2.032)
World-system position: Semi-periphery, t0 1.255** 1.764** 0.107 1.764**(0.636) (0.857) (0.503) (0.857)
World-system position: Periphery, t0 0.274 0.467 -0.028 0.467(0.589) (0.705) (0.601) (0.705)
International Professional Finance Association, t0 0.456* 0.790** 0.518** 0.790**(0.234) (0.357) (0.233) (0.357)
World-system position: Centrality in trade network, t0 0.005 0.005(0.041) (0.041)
32
(0.041) (0.041)
Observations 581 581 371 520 520 371Countries 51 51 34 49 49 34Wald chi2 164.54 235.31 434.34 129.84 206.49 434.34Robust standard errors in parentheses* significant at 10%; ** significant at 5%; *** significant at 1%Population averaged GEE panel regression models with robust standard errors and AR(1) errror structure.
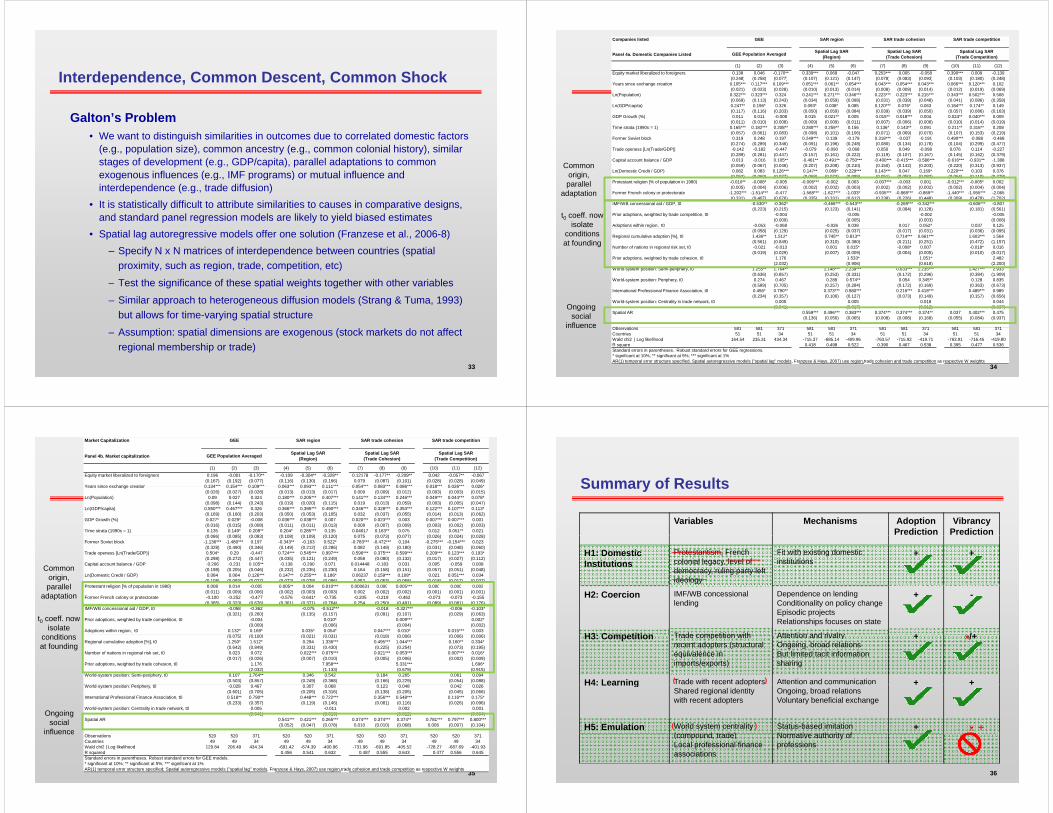
Interdependence Common Descent Common ShockInterdependence, Common Descent, Common Shock
Galton’s Problem • We want to distinguish similarities in outcomes due to correlated domestic factors
(e.g., population size), common ancestry (e.g., common colonial history), similar stages of development (e.g., GDP/capita), parallel adaptations to common exogenous influences (e.g., IMF programs) or mutual influence and g ( g , p g )interdependence (e.g., trade diffusion)
• It is statistically difficult to attribute similarities to causes in comparative designs, and standard panel regression models are likely to yield biased estimates
• Spatial lag autoregressive models offer one solution (Franzese et al., 2006-8)– Specify N x N matrices of interdependence between countries (spatial
proximity, such as region, trade, competition, etc)
– Test the significance of these spatial weights together with other variables
– Similar approach to heterogeneous diffusion models (Strang & Tuma, 1993) but allows for time-varying spatial structure
33
– Assumption: spatial dimensions are exogenous (stock markets do not affect regional membership or trade)
Companies listed GEE SAR region SAR trade cohesion SAR trade competition
Panel 4a. Domestic Companies Listed
(1) (2) (3) (4) (5) (6) (7) (8) (9) (10) (11) (12)Equity market liberalized to foreigners 0.138 0.046 -0.170** 0.339*** 0.068 -0.047 0.253*** 0.005 -0.058 0.390*** 0.009 -0.139
(0.248) (0.258) (0.077) (0.107) (0.121) (0.147) (0.078) (0.083) (0.093) (0.103) (0.180) (0.248)
Spatial Lag SAR (Trade Competition)GEE Population Averaged Spatial Lag SAR
(Region)Spatial Lag SAR
(Trade Cohesion)
(0 8) (0 58) (0 0 ) (0 0 ) (0 ) (0 ) (0 0 8) (0 083) (0 093) (0 03) (0 80) (0 8)Years since exchange creation 0.105*** 0.117*** 0.109*** 0.051*** 0.061** 0.054*** 0.043*** 0.054*** 0.043*** 0.066*** 0.120*** 0.102
(0.021) (0.023) (0.028) (0.010) (0.013) (0.014) (0.008) (0.009) (0.014) (0.012) (0.019) (0.069)Ln(Population) 0.322*** 0.323*** 0.324 0.241*** 0.271*** 0.346*** 0.223*** 0.223*** 0.215*** 0.343*** 0.502*** 0.508
(0.069) (0.113) (0.243) (0.034) (0.059) (0.098) (0.031) (0.039) (0.048) (0.041) (0.086) (0.358)Ln(GDP/capita) 0.247** 0.196* 0.326 0.093* 0.038* 0.085 0.120*** 0.076* 0.063 0.184*** 0.174** 0.149
(0.117) (0.116) (0.203) (0.050) (0.059) (0.084) (0.039) (0.039) (0.050) (0.057) (0.086) (0.163)GDP Growth (%) 0.011 0.011 -0.008 0.015 0.021** 0.005 0.015** 0.018*** 0.004 0.024** 0.040*** 0.009
(0.011) (0.010) (0.008) (0.009) (0.009) (0.011) (0.007) (0.006) (0.008) (0.010) (0.014) (0.019)Time strata (1990s = 1) 0.165*** 0.182*** 0.208** 0.280*** 0.259** 0.156 0.136* 0.143** 0.091 0.211** 0.316** 0.208( )
(0.057) (0.061) (0.083) (0.098) (0.101) (0.106) (0.071) (0.069) (0.070) (0.107) (0.153) (0.219)Former Soviet block 0.319 0.248 0.197 0.249*** 0.139 -0.179 0.318*** -0.037 -0.191 0.490*** -0.088 -0.468
(0.274) (0.289) (0.346) (0.091) (0.196) (0.248) (0.080) (0.134) (0.178) (0.104) (0.299) (0.477)Trade openess [Ln(Trade/GDP)] -0.142 -0.182 -0.447 -0.079 -0.090 -0.068 0.050 0.049 -0.098 0.076 0.114 -0.227
(0.289) (0.281) (0.447) (0.157) (0.161) (0.222) (0.119) (0.107) (0.167) (0.145) (0.162) (0.379)Capital account balance / GDP 0.013 -0.016 0.105** -0.461** -0.491** -0.750*** -0.400*** -0.415*** -0.586*** -0.616*** -0.931** -1.388
(0.059) (0.067) (0.046) (0.207) (0.208) (0.210) (0.150) (0.142) (0.203) (0.220) (0.313) (0.937)Ln(Domestic Credit / GDP) 0.082 0.083 0.126*** 0.147** 0.089* 0.229*** 0.143*** 0.047 0.159* 0.220*** 0.103 0.376
(0.052) (0.060) (0.027) (0.068) (0.073) (0.089) (0.051) (0.050) (0.082) (0.064) (0.110) (0.278)
Common origin,
Protestant religion [% of population in 1980) -0.010** -0.008* -0.005 -0.006*** -0.002 0.003 -0.007*** -0.003 0.001 -0.012*** -0.005* 0.002(0.005) (0.004) (0.006) (0.002) (0.002) (0.003) (0.002) (0.002) (0.002) (0.002) (0.004) (0.004)
Former French colony or protectorate -1.202*** -1.514*** -0.477 -1.568*** -1.627*** -1.033* -0.935*** -0.868*** -0.869** -1.440*** -1.955*** -2.065(0.331) (0.407) (0.676) (0.335) (0.331) (0.612) (0.238) (0.226) (0.448) (0.309) (0.478) (1.702)
IMF/WB concessional aid / GDP, t0 -0.530** -0.362* -0.466*** -0.543*** -0.269*** -0.342*** -0.606*** -0.807(0.223) (0.215) (0.123) (0.141) (0.084) (0.128) (0.181) (0.561)
Prior adoptions, weighted by trade competition, t0 -0.004 -0.005 -0.002 -0.005(0.009) (0.005) (0.003) (0.008)
Adoptions within region, t0 -0.053 -0.068 -0.026 0.038 0.017 0.052* 0.037 0.125
gparallel
adaptation
t0 coeff. now isolate
(0.058) (0.129) (0.025) (0.037) (0.017) (0.031) (0.036) (0.095)Regional cumulative adoption [%], t0 1.436** 1.512* 0.745** 0.813** 0.714*** 0.661*** 1.603*** 1.564
(0.561) (0.849) (0.310) (0.380) (0.211) (0.251) (0.472) (1.157)Number of nations in regional risk set, t0 -0.021 -0.013 0.001 0.015* -0.008* 0.007 -0.018* 0.016
(0.019) (0.029) (0.007) (0.009) (0.004) (0.005) (0.010) (0.017)Prior adoptions, weighted by trade cohesion, t0 1.176 1.533* 1.051* 2.482
(2.032) (0.906) (0.618) (2.200)World-system position: Semi-periphery, t0 1.255** 1.764** 1.148*** 2.239*** 0.633*** 1.235*** 1.427*** 2.933
(0.636) (0.857) (0.253) (0.331) (0.172) (0.296) (0.384) (1.909)
conditions at founding
World-system position: Periphery, t0 0.274 0.467 0.289 0.574** 0.054 0.345** 0.128 0.835(0.589) (0.705) (0.257) (0.284) (0.172) (0.169) (0.363) (0.673)
International Professional Finance Association, t0 0.456* 0.790** 0.373*** 0.580*** 0.216*** 0.418*** 0.489*** 0.989(0.234) (0.357) (0.106) (0.127) (0.073) (0.149) (0.157) (0.656)
World-system position: Centrality in trade network, t0 0.005 0.005 0.018 0.044(0.041) (0.017) (0.012) (0.037)
Spatial AR 0.559*** 0.496*** 0.383*** 0.374*** 0.374*** 0.374** 0.037 0.402*** 0.475(0.136) (0.056) (0.065) (0.008) (0.008) (0.168) (0.055) (0.084) (0.937)
Ob ti 581 581 371 581 581 371 581 581 371 581 581 371
Ongoing social
influence
34
Observations 581 581 371 581 581 371 581 581 371 581 581 371Countries 51 51 34 51 51 34 51 51 34 51 51 34Wald chi2 | Log likelihood 164.54 235.31 434.34 -715.37 -685.14 -409.96 -763.57 -715.92 -419.71 -763.91 -716.45 -419.80R square 0.418 0.498 0.522 0.390 0.467 0.538 0.395 0.477 0.536Standard errors in parentheses. Robust standard errors for GEE regressions.* significant at 10%; ** significant at 5%; *** significant at 1%AR(1) temporal error structure specified. Spatial autoregressive models ("spatial lag" models, Franzese & Hays, 2007) use region,trade cohesion and trade competition as respective W weights
influence
Market Capitalization GEE SAR region SAR trade cohesion SAR trade competition
Panel 4b. Market capitalization
(1) (2) (3) (4) (5) (6) (7) (8) (9) (10) (11) (12)Equity market liberalized to foreigners 0.196 -0.001 -0.170** -0.109 -0.304** -0.328** 0.12178 -0.177** -0.209** 0.042 -0.057** -0.067
(0.167) (0.192) (0.077) (0.116) (0.130) (0.166) 0.079 (0.087) (0.101) (0.028) (0.028) (0.049)Years since exchange creation 0 134*** 0 154*** 0 109*** 0 063*** 0 093*** 0 111*** 0 054*** 0 083*** 0 086*** 0 018*** 0 026*** 0 026*
Spatial Lag SAR (Trade Competition)GEE Population Averaged Spatial Lag SAR
(Trade Cohesion)Spatial Lag SAR
(Region)
Years since exchange creation 0.134 0.154 0.109 0.063 0.093 0.111 0.054 0.083 0.086 0.018 0.026 0.026(0.026) (0.027) (0.028) (0.013) (0.013) (0.017) 0.009 (0.009) (0.012) (0.003) (0.003) (0.015)
Ln(Population) 0.09 0.027 0.324 0.180*** 0.205*** 0.407*** 0.141*** 0.134*** 0.246*** 0.049*** 0.044*** 0.078*(0.098) (0.144) (0.243) (0.019) (0.020) (0.115) 0.019 (0.013) (0.059) (0.003) (0.005) (0.047)
Ln(GDP/capita) 0.550*** 0.467*** 0.326 0.366*** 0.395*** 0.490*** 0.346*** 0.328*** 0.353*** 0.122*** 0.107*** 0.113*(0.169) (0.160) (0.203) (0.050) (0.053) (0.105) 0.032 (0.037) (0.055) (0.014) (0.013) (0.062)
GDP Growth (%) 0.027* 0.029* -0.008 0.036*** 0.038*** 0.007 0.020*** 0.023*** 0.003 0.007*** 0.007*** 0.001(0.016) (0.015) (0.008) (0.011) (0.011) (0.013) 0.008 (0.007) (0.009) (0.003) (0.002) (0.003)
Time strata (1990s = 1) 0.135 0.149* 0.208** 0.204* 0.285*** 0.135 0.04017 0.163** 0.075 0.012 0.051** 0.021(0 086) (0 085) (0 083) (0 108) (0 109) (0 120) 0 075 (0 073) (0 077) (0 026) (0 024) (0 028)(0.086) (0.085) (0.083) (0.108) (0.109) (0.120) 0.075 (0.073) (0.077) (0.026) (0.024) (0.028)
Former Soviet block -1.136*** -1.480*** 0.197 -0.343** -0.163 0.522* -0.783*** -0.472*** 0.104 -0.275*** -0.154*** 0.023(0.328) (0.490) (0.346) (0.149) (0.212) (0.286) 0.082 (0.149) (0.180) (0.031) (0.048) (0.060)
Trade openess [Ln(Trade/GDP)] 0.504* 0.29 -0.447 0.724*** 0.545*** 0.997*** 0.596*** 0.375*** 0.599*** 0.209*** 0.123*** 0.193*(0.298) (0.272) (0.447) (0.035) (0.121) (0.249) 0.058 (0.080) (0.132) (0.017) (0.027) (0.112)
Capital account balance / GDP -0.206 -0.231 0.105** -0.138 -0.290 0.071 0.014448 -0.183 0.031 0.005 -0.059 0.008(0.198) (0.205) (0.046) (0.232) (0.235) (0.230) 0.164 (0.158) (0.151) (0.057) (0.051) (0.048)
Ln(Domestic Credit / GDP) 0.084 0.064 0.126*** 0.147** 0.255*** 0.186* 0.06237 0.159*** 0.108* 0.021 0.051*** 0.034(0.108) (0.093) (0.027) (0.072) (0.079) (0.096) 0.052 (0.053) (0.068) (0.018) (0.017) (0.027)
P t t t li i [% f l ti i 1980) 0 008 0 014 0 005 0 005** 0 004 0 010*** 0 000631 0 000 0 005*** 0 000 0 000 0 002
Common origin, parallel Protestant religion [% of population in 1980) 0.008 0.014 -0.005 0.005** 0.004 0.010*** 0.000631 0.000 0.005*** 0.000 0.000 0.002
(0.011) (0.009) (0.006) (0.002) (0.003) (0.003) 0.002 (0.002) (0.002) (0.001) (0.001) (0.001)Former French colony or protectorate -0.100 -0.252 -0.477 -0.576 -0.641* -0.735 -0.205 -0.219 -0.462 -0.073 -0.073 -0.155
(0.365) (0.323) (0.676) (0.361) (0.371) (0.764) 0.254 (0.250) (0.491) (0.089) (0.081) (0.176)IMF/WB concessional aid / GDP, t0 -0.058 -0.362 -0.075 -0.512*** -0.018 -0.327*** -0.006 -0.103*
(0.321) (0.260) (0.135) (0.157) (0.091) (0.107) (0.029) (0.063)Prior adoptions, weighted by trade competition, t0 -0.004 0.010* 0.009*** 0.002*
(0.009) (0.006) (0.004) (0.002)Adoptions within region, t0 0.132* 0.169* 0.035* 0.054* 0.047*** 0.010* 0.015*** 0.003
(0 075) (0 100) (0 021) (0 031) (0 018) (0 006) (0 006) (0 006)
parallel adaptation
t0 coeff. now isolate
diti (0.075) (0.100) (0.021) (0.031) (0.018) (0.006) (0.006) (0.006)Regional cumulative adoption [%], t0 1.250* 1.512* 0.294 1.336*** 0.495*** 1.044*** 0.160** 0.334*
(0.642) (0.849) (0.331) (0.430) (0.225) (0.254) (0.073) (0.195)Number of nations in regional risk set, t0 0.023 0.072 0.022*** 0.075*** 0.021*** 0.053*** 0.007*** 0.016*
(0.017) (0.026) (0.007) (0.010) (0.005) (0.006) (0.002) (0.009)Prior adoptions, weighted by trade cohesion, t0 1.176 7.958*** 5.331*** 1.696*
(2.032) (1.133) (0.679) (0.915)World-system position: Semi-periphery, t0 0.107 1.764** 0.346 0.542 0.184 0.265 0.061 0.094
(0.503) (0.857) (0.249) (0.368) (0.166) (0.229) (0.054) (0.088)
conditions at founding
World-system position: Periphery, t0 -0.028 0.467 0.307 0.068 0.123 0.048 0.042 0.026(0.601) (0.705) (0.205) (0.316) (0.138) (0.205) (0.045) (0.066)
International Professional Finance Association, t0 0.518** 0.790** 0.448*** 0.722*** 0.356*** 0.548*** 0.116*** 0.175*(0.233) (0.357) (0.119) (0.146) (0.081) (0.116) (0.026) (0.096)
World-system position: Centrality in trade network, t0 0.005 -0.011 0.002 0.001(0.041) (0.019) (0.012) (0.004)
Spatial AR 0.541*** 0.421*** 0.265*** 0.374*** 0.374*** 0.374** 0.781*** 0.797*** 0.800***(0.052) (0.047) (0.078) 0.010 (0.010) (0.068) 0.006 (0.007) (0.104)
Ongoing social
influence
35
Observations 520 520 371 520 520 371 520 520 371 520 520 371Countries 49 49 34 49 49 34 49 49 34 49 49 34Wald chi2 | Log likelihood 129.84 206.49 434.34 -691.42 -674.39 -400.96 -731.96 -691.85 -405.52 -728.27 -687.69 -401.93R squared 0.456 0.541 0.632 0.487 0.555 0.643 0.477 0.556 0.645Standard errors in parentheses. Robust standard errors for GEE models.* significant at 10%; ** significant at 5%; *** significant at 1%AR(1) temporal error structure specified; Spatial autoregressive models ("spatial lag" models, Franzese & Hays, 2007) use region,trade cohesion and trade competition as respective W weights
influence
Summary of ResultsSummary of Results
Variables Mechanisms AdoptionPrediction
Vibrancy Prediction
H1: Domestic Institutions
Protestantism, French colonial legacy, level of democracy, ruling party left ideology
Fit with existing domestic institutions
+ +
H2: Coercion IMF/WB concessional lending
Dependence on lendingConditionality on policy changeEpisodic projectsRelationships focuses on state
+ -
H3: Competition Trade competition with Attention and rivalry + /+H3: Competition Trade competition with recent adopters (structural equivalence in imports/exports)
Attention and rivalryOngoing, broad relationsBut limited tacit information sharing
+ -/+
H4: Learning Trade with recent adopters Attention and communication + +
x
( )H4: Learning ade ece adop e sShared regional identity with recent adopters
e o a d co u ca oOngoing, broad relationsVoluntary beneficial exchange
+ +
H5: Emulation World system centrality( d t d )
Status-based imitationN ti th it f
+ -
( )
X +( )
36
(compound, trade)Local professional finance associations
Normative authority of professions
OverviewOverview
1. Motivation and Executive Summary
2. Context: Financial Markets and Economic Development
3. Theory: Decoupling in Global Institutional Processes
4. Hypotheses and Methods
5. Findings: Formal Adoption and Vibrancy of Markets
6 Implications and Conclusions6. Implications and Conclusions
37
ConclusionsConclusions
Institutional Theory: • Not all “institutional” diffusion leads to ceremonial compliance
-> evidence only for coercive channels• Expanded model of policy making processp p y g p
-> distributed, multi-stage process of “adoption”
Economic Development Policies: • Global financial institutions face problems in deploying policy programs
-> IMF/WB projects effective for formal adoption, not vibrancy-> greater role for non-state actors in policy implementationg p y p
• Regional cooperation and international professional networks are the most effective carriers of “world society” type global integration-> similar to lessons from ‘nation building’ efforts in political institutions
38
> similar to lessons from nation building efforts in political institutions