policing cyber-neighbourhoods: tension monitoring …orca.cf.ac.uk/47027/1/policing...
TRANSCRIPT

Williams, M. et al. 2013. Policing cyber-neighbourhoods: Tension monitoring and social media networks. Policing and Society 23(4), pp. 461-481. (10.1080/10439463.2013.780225)
Policing cyber-neighbourhoods: tension monitoring and social media networks
Matthew L. Williamsa*, Adam Edwardsa, William Housleya, Peter Burnapb, Omer
Ranab, Nick Avisb, Jeffrey Morgana and Luke Sloana
aCardiff Centre for Crime, Law and Justice, School of Social Sciences, Cardiff University, Cardiff, UK; bSchool of Computer Science and Informatics, Cardiff University, Cardiff, UK
(Received 21 December 2012; final version received 11 February 2013)
We propose that late modern policing practices, that rely on neighbourhood intelligence, the monitoring of tensions, surveillance and policing by accommo-dation, need to be augmented in light of emerging ‘cyber-neighbourhoods’, namely social media networks. The 2011 riots in England were the first to evidence the widespread use of social media platforms to organise and respond to disorder. The police were ill-equipped to make use of the intelligence emerging from these non-terrestrial networks and were found to be at a disadvantage to the more tech-savvy rioters and the general public. In this paper, we outline the development of the ‘tension engine’ component of the Cardiff Online Social Media ObServatroy (COSMOS). This engine affords users with the ability to monitor social media data streams for signs of high tension which can be analysed in order to identify deviations from the ‘norm’ (levels of cohesion/low tension). This analysis can be overlaid onto a palimpsest of curated data, such as official statistics about neighbourhood crime, deprivation and demography, to provide a multidimensional picture of the ‘terrestrial’ and ‘cyber’ streets. As a consequence, this ‘neighbourhood informatics’ enables a means of questioning official constructions of civil unrest through reference to the user-generated accounts of social media and their relationship to other, curated, social and economic data.
Keywords: social media; tension monitoring; public order; riot; Cardiff Online Social Media ObServatory
Introduction The rapid and widespread uptake of social media platforms such as Twitter, Facebook and YouTube has created new ways for people to interact and to share information. This brings both benefits and risks for civil society and new challenges for agencies responsible for safeguarding the public. The most senior prosecutor in England and Wales recently stated that ‘Social media is raising difficult issues of principle, which have to be confronted not only by prosecutors, but also by others including the police, the courts and service providers’ (BBC 2012). Certain behaviours that manifest on social media networks have become of concern for policing. In 2011, several networks were implicated in playing a part in political demonstrations and riots (Morrell et al. 2011), and subsequent government reports have called for the expansion of the police diet to include the word on the ‘cyber *Corresponding author. Email: [email protected]

2 M.L. Williams et al. street’ in the anticipation of future public disorder (HMIC 2011a). Late modern policing practices, that rely on neighbourhood intelligence, surveillance, policing by accommodation and the monitoring of tensions are being augmented in light of these burgeoning ‘cyber-neighbourhoods’. In the face of the techno-mediated 2011 riots in English cities, the police made use of the intelligence emerging from social media networks with limited success. If advantage is to be taken of this growing source of rumour and intelligence, bespoke computational tools are required that are designed for and tested against police personnel and other key informants. In this paper, we outline the development of the ‘social media tension-monitoring engine’ component of the Cardiff Online Social Media ObServatory (COSMOS).1 This engine affords users with the ability to monitor social media data streams for signs of high tension which can be analysed in order to identify deviations from the ‘norm’ (levels of cohesion/low tension).
Social and computational researchers have already begun to mine and ‘repurpose’ naturally occurring or ‘user-generated’ socially relevant data from social media networks in their efforts to anticipate offline social phenomena. For example, Tumasjan et al. (2010) were able to measure Twitter sentiment in relation to candidates in the German election concluding that this source of data was as accurate at predicting voting patterns as traditional polls. Again, in mining data from Twitter, Asur and Huberman (2010) correlated the sentiment expressed about movies with revenue, claiming that this method of prediction was more accurate than the gold standard Hollywood Stock Market. Beyond social networks, Ginsberg et al. (2009) successfully correlated flu-based search terms entered into the Google engine with visits to the local doctor in order to epidemiologically trace the spread of the disease across USA. More recently, the wealth of social media communications about major incidents of civil unrest, such as the riots in English cities during August 2011 (Procter and Voss 2013), have illustrated the potential significance of these technologies for spreading rumours and generating intelligence (HMIC 2011a). Social media streams can therefore be considered as new sources of information on the perceptions, opinions, actions, feelings and tensions expressed by individuals and their neighbourhoods.
Not only might social media networks provide new opportunities to assess the mood of communities, they also offer the possibility to shift the influence from the few and the enfranchised to the many and the disenfranchised. Concepts of tension indication and community cohesion have been criticised as official constructions of civil unrest in Britain which obscure more profound political-economic conflicts and misdiagnose them, most controversially in terms of ‘self-segregating’ residential populations leading ‘parallel lives’ (Home Office 2001, Kundnani 2001). Our concern here is not to provide some retrospective arbitration of these arguments but to use them to illustrate the importance of accessing alternative accounts of social problems in order to question official constructions. Existing intelligence on community tensions is derived from police observations and through engagement with neighbourhood forums that are often frequented by ‘upstanding neighbourhood citizens’ and various community ‘representatives’. How representative these accounts are of ‘hard-to-hear’ voices remains the subject of contention. Our principal concern is to question the contribution that analyses of social media communications can make to these more conventional forms of intelligence. Furthermore, if such data can be used to augment ‘terrestrial’ methods of tension monitoring, might they facilitate

Policing & Society 3 a form of ‘synoptic’ power, in which the many can view the few and through which elite constructions of social problems can be challenged and revised (Mathieson 1997)? What, to continue the example, might the indication of social tensions ahead of the Burnley riot of 2001 have looked like had the residential population, the police and agitators involved in this civil unrest all had access to new social media communications? Retrospective accounts of this riot argued that the police misinterpreted tension arising from the mobilisation of the far right-wing political organisations on the streets of Burnley and other Northern English cities in the summer of 2001. Instead, the police interpreted the escalation of violence in terms of a turf war over the street trade in illegal drugs (King and Waddington 2004). This can be taken as an exemplar of how social problems are framed by authorities in terms of their particular predilections and occupational cultures. Had the welter of alternative accounts that are facilitated by social media been available in 2001, it is at least plausible to argue that tension arising out of extreme right-wing political agitation would have been reflected in social media communications thereby indicating other dynamics driving, indeed anticipating, the escalation of this civil unrest. Thinking forward to the present context, how might we analyse social media content to inform our understanding and anticipation of social conflicts? The rise of social media Boyd et al. (2007, p. 210) define social media networks as ‘web-based services that allow individuals to (1) construct a public or semi-public profile within a bounded system, (2) articulate a list of other users with whom they share a connection and (3) view and traverse their list of connections and those made by others within the system’. These sites allow users to interact with other known and unknown users and make visible users’ social networks. This openness (unlike with more traditional Internet communications media) allows users to make connections with others that might have not been made otherwise. Unlike the original online community (e.g. newsgroups) of the late twentieth century that were centred on interests (Rheingold 1993), social media networks shift the focus to the individual, creating egocentric networks.
Technologies which facilitated open social networks first emerged in 1997 but they remained largely unpopular compared to current usage (Boyd et al. 2007). The first decade of the twenty-first century saw the exponential rise of social media in social and business domains. MySpace was one of the first successful social networking sites that was not advertised as a dating resource. It made full use of Web2.0 by allowing users to personalise their pages. Facebook began in early 2004 as a niche social network for US elite college students. From 2005, the site began to expand its user base beyond the college network, eventually opening up membership to everyone. Twitter, a micro-blogging service, was launched in 2006 and quickly became a popular alternative or addition to the more established social media networks. The network facilitates non-reciprocal links between users, meaning that the followed are not required to follow their followers. A hashtag convention has emerged amongst Twitter users that allows tweets to be tagged with a topic which is searchable. The term ‘trending’ is used to describe hashtags that become popular within the tweet-stream, indicating a peak or pulse in discussion usually surrounding an event or person. Unofficial estimates put social media network membership at

4 M.L. Williams et al. approximately 2.5 billion non-unique users, with Facebook, Google" and Twitter accounting for over half of these (Smith 2012). However, recent analysis has revealed that the majority of users of these sites rarely contribute (post updates) instead using the services to keep up to date with social, professional and news-related developments.2 Social media and policing Research into social media and policing, in terms of communication with the public and monitoring user posts, is beginning to emerge. In the USA, Brainard and McNutt (2010) explored how the police interacted with citizens, how these interactions are structured and the extent to which interactions are informational, transactional or collaborative. They concluded that the majority of activity was informational and transactional, with very little being classified as collaborative. A recent study by LexisNexis Risk Solutions (2012) of US law enforcement use of social media shows that four out of every five officers in their sample used social media in investigations, with nearly half of these using it weekly. The most popular uses of social media by officers were identifying people and locations, discovering criminal activity and gathering evidence. Just over 80% of respondents who used social media anticipated using it even more in future police work, while just over 70% of those not currently using it intend to do so. In the UK, police use of social media has only recently emerged. The National Policing Improvement Agency (NPIA 2010) report Engage: Digital and Social Media for the Police Service outlines the ACPO strategy on the use of social media to engage with the public to better inform and support neighbourhood policing. Crump’s (2011) evaluation of the Engage strategy identified that as of October 2010, 30 police forces had a corporate twitter account, as did 140 neighbourhood and local policing teams. The main uses of accounts included patrol updates on ongoing or concluded cases, requests for information from the public and partnership management (with other emergency services, local authorities, educational establishments, etc.). Crump (2011, 23) concluded that since the first use of social media in 2008 by police in England and Wales, the primary practice has been to communicate and engage with the public; but two-way communication has been ‘limited’ with police failing to successfully elicit informa-tion from the public on a systematic basis. This reflects the findings of Brianard and McNutt in the USA and provides evidence that upto 2010 police use of social media has been largely non-transformational.
Since the August 2011 riots in England, reports of the police using social media for the gathering of intelligence began to emerge. The HMIC (2011a) report Rules of Engagement provided evidence that some police services were utilising freeware and shareware Twitter analytics platforms to monitor tensions, rumours and incitement to disorder during the riots. The report depicts instances where some police services were able to triangulate information on Twitter with independent information from officers on the streets and public reports. In a minority of cases, this intelligence was used to disrupt disorder from erupting in city centre areas via the redirection of resources. Despite these limited successes the report clearly states that police services in England did not have the technical or operational capacity to make best use of social media data for the monitoring of tensions and developing disorder.

Policing & Society 5 Terrestrial tension monitoring The ACPO Manual of Guidance on Keeping the Peace (2000) recommended the monitoring of signs of tension in anticipation of public disorder. This was a further development of reforms aimed at improving the capacity of the police to anticipate civil unrest, which research into the history of tension indication in British policing dates back to a series of Home Office circulars on the need for improved intelligence following Lord Scarman’s report into the riots in Brixton, London and other English cities in 1981 (King and Brearley 1996, pp. 87-92). Tension indicators could include social, economic, political and environmental signs, including rising crime rates. Two-way communication channels between the police and the media and local community groups were recommended in order to gather neighbourhood intelligence on these signs from the most alienated, vulnerable and disaffected (ACPO 2000). Once identified, the police could intervene to reduce the causes of tension before further escalation and potential public disturbance. However, the limitations of tension indication revealed by the misdiagnosis of the riots in Burnley and other Northern English cities in 2001 provoked a further round of reform and debate about the anticipation of civil unrest. Chainey (2008) notes how gathering intelligence on signs of tension proved difficult for local police services. Initially, signs of tension were assumed to be conspicuous and hence easily monitored. In practical terms, for the majority of neighbourhood officers, tension indicators did not readily ‘exist’ beyond that of the more native crime rates. Furthermore, police systems were not geared up to routinely collect and analyse indicators of tension outside of this ‘crime risk paradigm’. As noted above, this was borne out in King and Waddington’s (2004) analysis of the causes of the Burnley riot in 2001 in which they noted how the local police were ill-equipped to read ‘alternative’ signs of tension, specifically, ‘the full extent of white racist sentiment and corresponding fears and anxieties among its Asian communities in the build-up to the Burnley riot’ (King and Waddington 2004, p. 134). They conclude that Burnley police were preoccupied with conventional criminal indices of impending disorder, in particular drug and acquisitive crime, resulting in ‘crucial limitations in police procedures for anticipating and offsetting the outbreak of disorder’ (2004, p. 134). It is now well understood the Burnley riots came about due to a multiplicity of contributory factors including socio-economic marginalisation, disenfranchisement of young people and the presence of far-right groups fomenting inter-ethnic conflict between socially excluded communities resident in the same neighbourhoods and, specifically, cultivating antipathy towards South Asian residents whom they depicted as benefitting from public expenditure, social housing and urban regeneration grants at the expense of the equally deprived white residential population; a rumour that was subsequently disproved (Amin 2003, Bagguley and Hussain 2008). One response to the perceived weaknesses of tension indication revealed by these riots has been to use official statistics on neighbourhood crime (particularly household burglary and criminal damage), deprivation (house-hold income and employment) and demography (age and educational attainment) to constitute a ‘Vulnerable Localities Index’ (VLI). The presumption here is that, ‘an area that has low levels of educational attainment, a high relative concentration of young people, is deprived and experiences high levels of burglary and criminal damage to dwellings is likely to be a neighbourhood that requires some prioritised attention’ (Chainey, 2008, p. 202). Even here, however, such formulaic modelling of

6 M.L. Williams et al. vulnerability on a limited set of official constructs runs the risk of obscuring other context-specific and emergent indices of tension, such as the inter-ethnic conflict and racist street politics that preceded the riots in Burnley, Bradford and Oldham in 2001.
Since these riots, several central government reports have developed more nuanced guidance on how local authorities and police should monitor tensions in local neighbourhoods. A Department for Communities and Local Government (2008) report recommended local service providers set up multiagency tension-monitoring groups with members from the statutory and voluntary sectors. These are advised to consider an array of intelligence, including crime statistics, community reports from wardens, gang and turf conflicts, demands for housing, political extremism and the like. A report by the Institute of Community Cohesion (2010) recommended that these groups adopt the Experienced, Evidenced, Potential (EEP) system to record, collate and assess community tension, which has been adopted by the majority of police services in England and Wales. The system operates by ascertaining how communities feel (perceived risks to the community and indivi-duals, and the spread of rumour; the ‘word on the street’), gathering evidence on what is happening (via reports to the police or other local services) and anticipating what may happen based on planned future events and changes in police service activity. The first element of the EEP system is the most challenging. Sources of information on community experience are difficult to tap into. While formal groups such as tenant and resident associations and neighbourhood forums provide some information from citizens who are engaged with their local services, the views of those that are socially excluded and disenfranchised often go unheard. The inability to fully tap into these hard-to-hear voices has been implicated in the failure of the police service to pre-empt disorder including the more recent riots in English cities in the summer of 2011 (HMIC 2011a). In summary, the recent official guidance on monitoring social tension continues to advocate the use of an admixture of conventional qualitative and quantitative indices. Our proposition is that analysis of social media communications augments these indices and may reorient our understanding of tension and social cohesion through reference to the mass of user-generated accounts of social problems in particular contexts and in near, and possibly real, time. If social media can be adequately sampled and used to indicate ‘offline’ behaviour, the analysis of this kind of data could be a revelation in broadening public understanding of civil unrest and attenuating dependence on elite, retrospective, constructions of social problems. Tension monitoring and social media Over a decade on from the Burnley riots, public order policing in the UK has gradually shifted from a reactive incident-motivated paradigm to one that is intelligence-led (King 2006). This late modern form of policing consists of a series of processes, including the routine gathering of neighbourhood intelligence beyond that of simple levels of crime. The HMIC (2011b) report Policing Public Order highlighted how the disorders in 2011 had taken on a new dimension which involved the use of Internet communications on fixed and mobile platforms. In particular, social networking sites (such as Twitter and Facebook) were implicated in the UK Uncut and university tuition fees protests in London in late 2011. Greer and

Policing & Society 7 McLaughlin (2010) quoting Peat (2010) provide a vivid description of this new tech-savvy public: ‘Armed with cell phones, BlackBerries or iPhones, the average Joe is now a walking eye on the world, a citizen journalist, able to take a photo, add a caption or a short story and upload it to the Internet for all their friends, and usually everyone else, to see’. Criminals (both organised and opportunists) have also begun to make use of these technologies to command the crowd in processes known as ‘crime sourcing’3 and ‘flash mobbing/robbing’. Goodman (2011) describes ‘groups of individual criminals, who may or may not even know each other, are organising themselves online and suddenly descending into unsuspecting stores to steal all that they can in a flash. The unsuspecting merchant has little he can do when 40 unruly strangers suddenly run into his shop and run off with all his merchandise’. At the extreme end of the spectrum, social media use was also associated with the Tunisian and Egyptian Revolutions (Lotan et al. 2011, Choudhary et al. 2012).
With over 97% of the public owning mobile phones in 2009, and just under half of these using smartphone functions in 2011 (Dutton and Blank 2011), an opportunity has arisen for the many to view the few and so exercise ‘synoptic power’ to question and revise elite constructions of social problems, such as civil unrest (Mathieson 1997, Edwards et al. 2013). This power is not limited by a ‘digital divide’ and restricted to wealthy owners of communication technologies as the advent of smartphones on cheaper ‘pay-as-you-go’ contracts have increased the prevalence of social media communications. The Metropolitan Police Commissioner in 2011 stated that ‘the game had changed’ referring to the numbers involved, the spread of disorder, short-notice or no-notice events and swift changes in protest tactics all facilitated by social media networking (HMIC 2011b, p. 3). As a consequence, policing agencies are becoming more interested in the use of social media to gather intelligence (such as signs of tension) to assist in maintaining the peace. Social media also provide the police and other authorities with the capacity to ‘reassure’ the public and otherwise attempt to engineer social order. It can be anticipated that this will, in turn, generate competition between ‘citizen journalists’ and various state and corporate powers to constitute as well as represent competing visions of social order.
An analysis into the 2011 riots in England implicated several causes, including group processes and the rapid flow of information facilitated by social media networks such as Twitter (HMIC 2011a, Morrell et al. 2011). A close analysis of the news coverage at the time of the riots and shortly afterwards, revealed that social media networks were being used in various ways, and not simply to coordinate and incite riotous behaviour. On the contrary, the pioneering study Reading the Riots revealed that social media networks were primarily being used to coordinate the clean-up effort, as well as to start and dispel rumours (Guardian 2011). What coordination for rioting did occur via social media was most likely to have been done on closed networks, such as the Blackberry Messenger service, which is only accessible to those that have been authorised to view and contribute to conversations. Nonetheless, the HMIC (2011a, p. 6) report into the police service response to the riots remarked that:
Social media channels enabled individuals intent on criminal disorder to form communities, share their plans and organise on the streets: but police systems for tapping into this information source are not well developed compared to those used by

8 M.L. Williams et al.
parts of the commercial sector. In truth, police were at times overwhelmed with information. A key recommendation of the report was to establish a central information hub to assist in the anticipation of disorder drawing together data from the street and social media streams. This social media-monitoring system would harvest data to analyse trends in community tension. The report anticipates that while such a monitoring system could not substitute for ‘terrestrial’ community engagement and intelligence gathering (which the report claims failed at the time of the riots in Tottenham) it could assist the police in gaining ‘a better understanding of their operating environment’ (HMIC 2011a, p. 7). Such a system would have affordances beyond policing public order, assisting other emergency services in an array of situations (e.g. advance flood warnings). Based on this recommendation, a private sector system was procured and trialled for the Olympics by the Metropolitan Police Service. It is likely that this system will now be rolled out to the rest of England, Wales and Scotland (Adams 2012). The evidence of the effectiveness of such systems in predicting disorder is nascent, but initial reports are encouraging. During the August 2011 riots the Metropolitan Police Service made use of freely available Twitter analytics software to gather intelligence with some success:
Across London from Sunday 07 August onwards (and thereafter in other forces) there was open source information available about the potential spread of disorder. Police began monitoring this material as best they could in an effort to identify organisers or potential targets for attack by looters. So, for example, the Metropolitan Police successfully deployed officers to Oxford Circus as a result of monitoring and actioning information from social media. These officers arrived in time to confront 50 to 60 youths gathering in response to a message stating ‘Meet Oxford Circus shops going to get smashed up. Get free stuff. (HMIC 2011a, p. 31)
However, such successes were balanced with the problems of making sense of ‘big social data’ occurring in real time: ‘one Metropolitan Police officer recalled that tweets were appearing so fast that they fell off the bottom of the screen before anyone had a chance to read them’; and sorting the wheat from the chaff in the search for valid intelligence: ‘from an intelligence perspective, the information that was coming from social media sources was conflicting and often contained wrong or misleading items’ (HMIC 2011a, p. 31). Despite these problems, which may in part be mitigated by the new advanced system put in place for the Olympics, the police service are committed to incorporating social media interactions into their daily policing routine: ‘this fast-paced open source information space should be part of the street which they [officers] patrol . . . . the ability it offers to monitor mood and emotion and predict possible public order problems should not be overlooked’ (HMIC 2011a, p. 36). Statement of the Problem Those responsible for monitoring tension are likely to find information gleaned from social media sources as challenging to interpret. Firstly, this is due to the amount of data produced in very short periods of time. Depending on the scope of the harvesting (which can range from a single Twitter account to all accounts globally), the data produced will often need to be collected, stored and analysed by machine.

Policing & Society 9 Secondly, the quality of the data is impoverished due to the lack of ‘meta-data’ on posters’ identities (age, gender, race, etc.) and locations (of their home and from where the person is uploading their post). Finally, what citizen’s post on social media sites is often uncorroborated, meaning the data gleaned rarely progress from basic rumour to the status of intelligence.
In relation to the first problem, most social media sites offer Application Programming Interfaces (APIs) that facilitate the harvesting of user posts for subsequent analysis. The amount that can be harvested varies by provider. Twitter for example, has several services including the Spritzer (a randomly sampled 1% of all tweets), the Gardenhose (a randomly sampled 10%) and the Firehose (all public tweets). However, the provision of streams above 1% is rare. Most free and commercial software programs available that facilitate API access are subject to ‘rate limitations’ making missing data a potential problem. Once the data have been harvested analysts need to make sense of it. Most of the computer programs on the market make sense of social media data by analysing sentiment (positive and negative) and the popularity of words and hangtags (known as trending). This mode of analysis is widely used in the commercial sector to track brand popularity. The major challenge for policing is its use to monitor community tensions is untested, and it is questionable whether ‘sentiment tracking’ will yield results that are commensurate with ‘tension monitoring’.
The second challenge is a significant barrier to the policing of impending public disorder. Privacy restrictions put in place by most social media providers prohibit the collection or storage of location data. Demographic information is also limited, with most APIs providing only the account number of posters. If social media networks are to be utilised for the monitoring of tensions, rapid access to data on the locations and demographics of posters is key.
The final challenge is often experienced by police on the terrestrial street. Even when the information is a rumour that has been proved false, it remains important in gauging tensions. Yet, in tension monitoring, for information to become intelligence it must be triangulated with independent sources (iCoCo 2010). While existing commercial social media analysis platforms do provide access to RSS media feeds which may provide a valuable source for triangulation, none facilitate access to curated data-sets such as ONS neighbourhood statistics, Police.co.uk crime maps, or the Vulnerable Localities Index, much less to archives of qualitative research into the social contexts of civil unrest, for example the UK Economic and Social Data Service’s
qualitative data archive ‘Qualidata’.4
Methods This paper considers the first of these challenges: Is it possible to identify and monitor tension in social media in relation to a trigger event? In the following sections, we present the methodology and test results of the social media tension-monitoring engine, a component of the Cardiff Online Social Media Observatory (COSMOS). Currently, no software exists to measure tension in social media streams. The basis of our tension analysis draws in part on Beckett’s (1992) riot-curve (Normal policing 0 High tension stage 0 Pre-riot stage 0 Riot stage (as the apex) 0 Post-
riot stage 0 Return to normality).5 Adapting this terrestrial process to the realm of social media was achieved by examining posts on an ordinal scale

10 M.L. Williams et al. e.g. (irrelevant noise) no tension 0 some tension 0 high tension. This provided a more nuanced scale tailored to signs of tension, as compared to the simple positive/ negative binary distinction offered by sentiment analysis. A set of language-based rules were employed to identify words, phrases, actors and events. These language-based rules (described in the following section) can be adapted to alternative tension-monitoring domains, such as those identified in King and Brearley’s (1996, p. 36) fourfold public order policing typology: political, industrial, festival and urban. Of course there is no ‘fixture list’ for urban rioting and so, for the purposes of empirical investigation into the use of social media communications as indices of tension and cohesion, we have targeted a more predictable, scheduled event, in particular sporting fixtures and within these incidents surrounding professional football competitions in England and Wales. Given the cultural heterogeneity and plurality of pastimes and media to be found in ‘late modern’ societies such as the UK, professional sport provides one of the few remaining events involving mass participation and interest and, therefore, a litmus test of collective tension. On these grounds, we sampled social media communications around a renowned incident of racial abuse between Patrice Evra, a professional footballer playing for Manchester United, and Luis Suarez of Liverpool football club in the autumn of 2011. Membership categorisation approach: collaborative algorithm design To build the ‘tension engine’ we assembled a team of experts in the fields of criminology, the sociology of language and computer science. The task of this team was to design a social media tension-monitoring system that drew on sociological concepts that could be digitally codified to operate in an online environment. We term this process Collaborative Algorithm Design. As part of this collaborative process we drew upon the work of Harvey Sacks and principally his research on Conversation Analysis and Membership Categorisation Analysis (MCA). ‘Sacks’ (1992) work concerned close empirical analysis of everyday language in order to explicate the local organisational features of talk-in-interaction and textual forma-tions. Thus, his concern was with the plethora of description that everyday language exhibits. Furthermore, descriptions occur within a wide range of discursive contexts. For example, newspapers, business meetings and school lessons all provide for the generation of descriptions albeit within different contextual arrangements. We argue that naturally occurring social media updates e.g. ‘tweet formulations’ are no different in this respect.
For Sacks, one of the important features of conversation and description is the display of categories and the methodical process of categorisation. In Sacks’ famous example, ‘the baby cried the mommy picked it up’ these considerations are illuminated by an analytical consideration of how we make sense of the story – we understand the story in terms of the ‘mommy’ picking up her ‘baby’ in response to the baby crying. For Sacks, we understand the story in this way because we associate the categories of ‘baby’ and ‘mommy’ with the membership categorisation device ‘the family’. Of course, both ‘baby’ and ‘mommy’ may be categories of further collections such as the ‘stage of life device’ (Baker 1984). Furthermore, in order to understand the particular common-sense reading that one usually makes when considering this sentence, Sacks invokes two rules of application, namely the economy rule and the consistency rule. The economy rule, according to Sacks (1992) refers to the

Policing & Society 11 conversational process by which if a member uses a single category from any device then he/she can be recognised to be doing adequate reference to a person. The following consistency rule states that if a member of a given population has been categorised within a particular device then other members of that population can be categorised in terms of the same collection. Sacks (1992, p. 221) derives a corollary known as the hearer’s maxim that states ‘if two or more categories are used to categorise two or more members of some population and those categories can be heard as categories from the same collection then: hear them that way’.
Sacks used the story, along with the predescribed rules of application, to generate a further set of analytical concepts, namely membership categorisation devices, membership categories and category-bound activities. Personal categories such as ‘mother’, ‘father’, ‘son’ or ‘daughter’ are described by Sacks as membership categories (MCs). Furthermore, they are viewed as membership categories of the membership categorisation device (MCD) ‘family’. In addition to this framework, the category machinery was complemented by the notion of category-bound activities/attributions (CBAs). According to Sacks, they can be understood as an attempt to describe how certain activities are commonsensically tied to specific categories and devices (e.g. in the case of Sacks’ story the tying of the activity of crying to the category ‘baby’). Sacks’ initial ideas concerning categories or descriptions involved a conceptualisation of an array of ‘collections’ or a shared ‘stock of common-sense knowledge’ that membership categorisation devices were seen to encapsulate. For Sacks (1992), such categorisations and their devices formed part of the commonsensical framework of members’ methods and recognisable capacities of practical sense-making. Careful empirical analysis of naturally occurring data demonstrates that specific culturally stable membership categorisa-tion devices (with associated membership categories and category bound activities and attributions) can be seen to be in operation within a variety of contexts and routine speech acts.
Given the organisational characteristics of social media updates (e.g. the 140 character-length tweet) membership categorisation analysis provides an empirically tested approach to the understanding of natural language practice which relies on social explication and inter-subjective interaction as opposed to occluded internal processes. It is a model of human category and associated linguistic work based on the systematic observation of everyday human practice and empirical materials (Housley 2002, Housley and Fitzgerald 2002, 2009). As a consequence, it provides a means of developing some bespoke rules that can inform the analysis of large scale social media data (in this case Twitter data) that can identify relevant ‘topic events’ and provide a way of analysing content in terms of category configuration and different forms of attribution and activity (See Burnap et al. 2013 for a technical description).
With the classification task in mind, experiments were conducted to determine whether the principals of MCA were applicable to classifying tension in tweets that were specifically related to an event. Figure 1 below outlines the computational tension engine rules and the corresponding tension ordinal scale provided to human police coders. We assumed the MCD to be the event itself (i.e. the Suarez-Evra Incident) and that for a tweet to be relevant to the event it should contain at least one reference to a MC within that MCD (i.e. ‘Suarez’, ‘Evra’). All tweets contain ‘Suarez’ as that was one of the keywords used to select the data from the COSMOS Twitter

12 M.L. Williams et al.
Police Coder Ordinal Scale MCA Tension Engine Rules
Irrelevant 0. Not relevant/Noise
Some Tension
1. MC + Predicate
2. MCD + MC
3. MCD + Predicate
4. MCD + MC + Predicate
Tension
5. MCD + MC + Predicate (Inc. Extreme
Case Formulations)
High Tension 6. MCD + MC + Predicate (Inc. Extreme
Case Formulations and Degradation Terms)
Figure 1. Tension scale.
archive, but the presence of ‘Evra’ confirms the MCD presence through the notion of standardised relational pairs – the presence of this pair indicates an association of the tweet to an event, in the same way ‘mommy’ and ‘baby’ are associated in the MCD ‘the family’. Where only one MC was mentioned, we applied the MCA concept of Category Bound Attribution or Activity (CBA) to further examine the tweet. CBAs include predicates that are used in relation to a membership category. Based on the observations from the 10% sample of our coded data-set, it was evident that CBAs relate very well to the accusation terms used in tweets (e.g. ‘Suarez abused him’, ‘Suarez called Evra’, ‘Suarez discriminated against him’) or attributing claims that one of the MCs (Suarez) conducted such actions and therefore ‘Suarez is a racist’. CBAs within tweets were used to classify tension by weighting different predicates used in association with a MC, with different types of CBA being given a different weighting. For example, mentions of a MC and an activity or attribution predicate, such as ‘racism’, ‘racist’, ‘called’ (for full list of terms see Burnap et al. 2013) were weighted as being relevant to the event (i.e. not in the ‘irrelevant’ class). Tweets without these features as a minimum were classified as ‘irrelevant’. Tweets featuring a MC, a CBA and a mild expletive were classified as ‘High Tension’. A small number of ‘extreme’ expletives were also defined, the presence of which automatically led to the classification of a tweet as ‘High Tension’. Expletives used with a CBA and ‘extreme’ expletives were therefore weighted towards higher levels of tension.
An algorithm was defined for the codification of the MCA principles and assumptions based on observations from the test set (see Burnap et al. 2013). This algorithm effectively represents the method used to classify tension with a tension analysis engine. This implementation is specific to racism but the advantage of using the conceptual framework of MCA is that it allows for future developments to the tension analysis engine to include other types of tension (e.g. homophobic, economic, political) by changing the MC and CBA lists to include different actors and activities. Data collection and analysis Data were extracted from the Twitter streaming API one month before and after the event selected to test the social media tension-monitoring engine. The streaming API

Policing & Society 13 delivers all matching tweets upto a 1% limit.6 Search terms relevant to the event (Suarez, Evra and FA) were used to derive the sample of tweets. The data corpus consisted of 1022 tweets each with the standard maximum of 140 characters. The study corpus was manually coded four times by four police constables (equal representation by gender and job type: response and neighbourhood) using an ordinal scale from 0 to 3 where: 0 meant the tweet was irrelevant (i.e. was not related to the event); 1 meant the tweet contained ‘some tension’ related to the event; 2 meant the tweet contained ‘tension’ related to the event; and 3 meant the tweet contained ‘high tension’ related to the event (see Figure 1). The police coders were provided with the scale and a short description of the ordinal points. No details of how the researchers were using language analysis tools (i.e. MCA) were provided. The application of degrees of tension to individual tweets was then entirely subjective and relied upon ‘tacit’ policing knowledge and discretion. Following the police coding exercise, we measured the degree to which the individual coders agreed, that is, how often they all coded a single tweet with the same level of tension. To calculate the level of inter-coder agreement we used Krippendorf ’s Alpha coefficient – a well-known statistical measure of agreement between independent coders where a measure of 0 indicates no agreement and a measure of 1 indicates perfect agreement. Despite the flexibility of having three levels of tension to choose from, the inter-rater agreement calculated was 0.67, which is deemed an acceptable level of agreement for tentative conclusions (Krippendorff
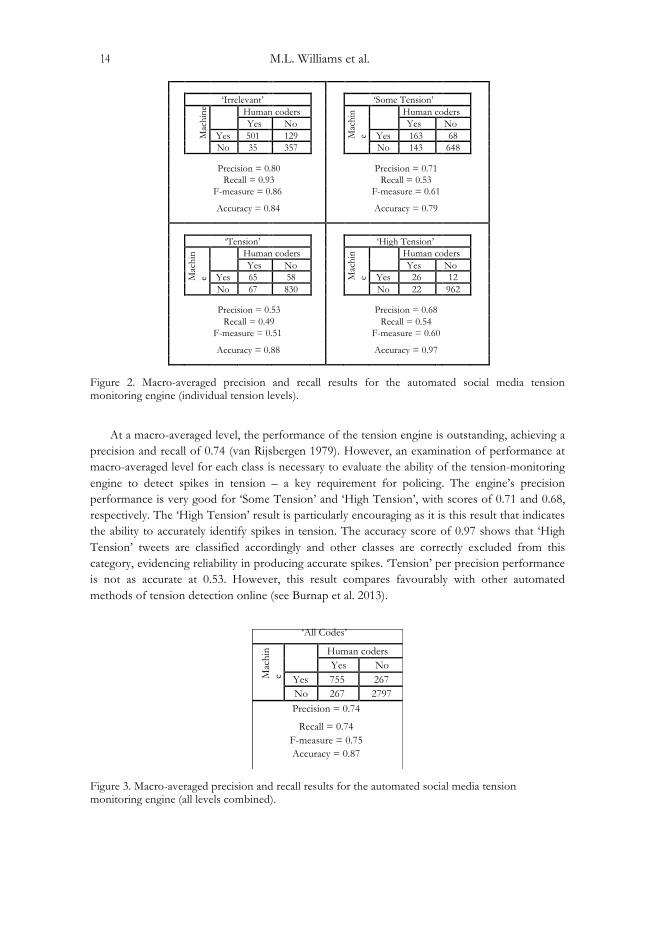
2004).7 The majority of tweets were identified by the police coders as not related to the event, with 536 (52%) of the 1022 coded tweets being coded as irrelevant by our coders. A further 306 (30%) were coded as having ‘some tension’, 132 (13%) as ‘tension’ and 48 (5%) as ‘high tension’. We therefore had a significant number of tweets in the ‘tension’ and ‘high tension’ classes that had the potential to be distinguished from lower levels, indicating clear spikes in tension. Findings In order to assess the efficacy of the computationally automated social media tension-monitoring engine we compared its results against the police-coded results (taken as the ‘gold standard’ in this experiment). This is the most commonly used design in the field of automated text classification (van Rijsbergen 1979). The results are provided using standard text classification measures of: precision (the fraction of retrieved tweets that are relevant to the search – i.e. for each class how many of the retrieved tweets were of that class); recall (fraction of tweets that are relevant to the search that are successfully retrieved – i.e. for each class how many tweets coded as that class were retrieved); F-Measure, a harmonised mean of precision and recall; and Accuracy, the total correctly classified tweets normalised by the total number of tweets. The results for each measure range between 0 (worst) and 1 (optimum). Due to the operational need in policing to detect spikes in tension there was a particular interest in the accurate identification of ‘tension’ and ‘high tension’ tweets (the two highest levels). Thus, macro-averaged results for each class and micro-averaged results for performance across all classes are presented in Figures 2 and 3, respectively. The formulae for calculating these results are as follows (where TP #true positives, FP #false positives, TN #true negative, FN #false negative, P #precision and R #Recall): Precision #TP/TP"FP; Recall #TP/TP"FN; F-Measure #2 $((P $R)/(P"R)); Accuracy #(TP"TN)/(TP"FP"FN"TN).
14 M.L. Williams et al.
‘Irrelevant’ ‘Some Tension’
Mac
hine
Human coders
Mac
hin
e
Human coders
Yes No Yes No
Yes 501 129 Yes 163 68
No 35 357 No 143 648
Precision = 0.80 Precision = 0.71
Recall = 0.93 Recall = 0.53
F-measure = 0.86 F-measure = 0.61
Accuracy = 0.84 Accuracy = 0.79
‘Tension’ ‘High Tension’
Mac
hin
e
Human coders
Mac
hin
e
Human coders
Yes No Yes No
Yes 65 58 Yes 26 12
No 67 830 No 22 962
Precision = 0.53 Precision = 0.68
Recall = 0.49 Recall = 0.54
F-measure = 0.51 F-measure = 0.60
Accuracy = 0.88 Accuracy = 0.97
Figure 2. Macro-averaged precision and recall results for the automated social media tension monitoring engine (individual tension levels).
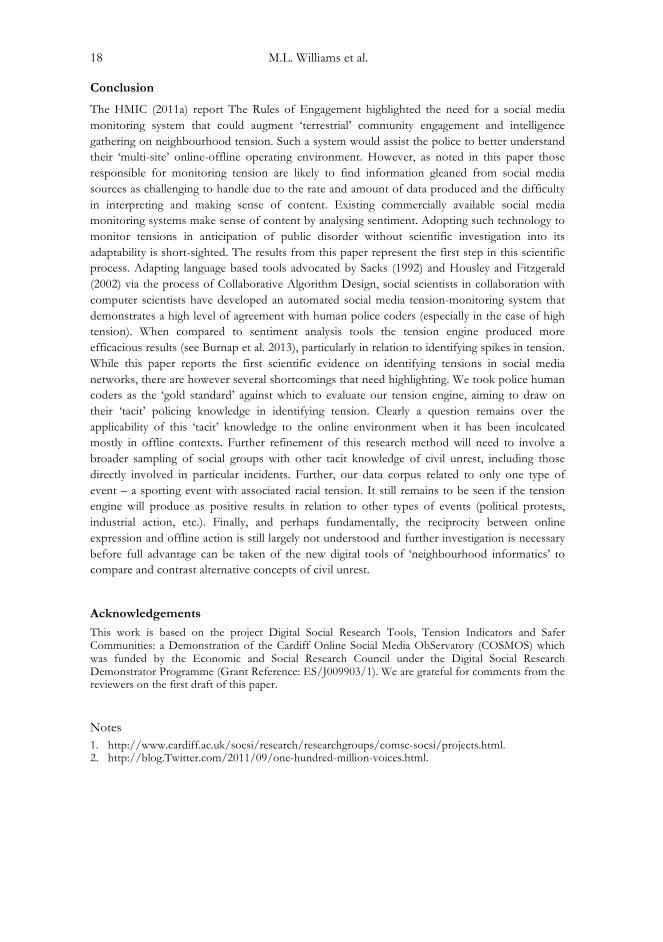
At a macro-averaged level, the performance of the tension engine is outstanding, achieving a precision and recall of 0.74 (van Rijsbergen 1979). However, an examination of performance at macro-averaged level for each class is necessary to evaluate the ability of the tension-monitoring engine to detect spikes in tension – a key requirement for policing. The engine’s precision performance is very good for ‘Some Tension’ and ‘High Tension’, with scores of 0.71 and 0.68, respectively. The ‘High Tension’ result is particularly encouraging as it is this result that indicates the ability to accurately identify spikes in tension. The accuracy score of 0.97 shows that ‘High Tension’ tweets are classified accordingly and other classes are correctly excluded from this category, evidencing reliability in producing accurate spikes. ‘Tension’ per precision performance is not as accurate at 0.53. However, this result compares favourably with other automated methods of tension detection online (see Burnap et al. 2013).
‘All Codes’
Mac
hin
e
Human coders
Yes No
Yes 755 267
No 267 2797
Precision = 0.74 Recall = 0.74
F-measure = 0.75 Accuracy = 0.87
Figure 3. Macro-averaged precision and recall results for the automated social media tension monitoring engine (all levels combined).

Policing & Society 15
Policing & Society 15
Figure 4. Daily police assigned tension levels.
Figure 5. Daily tension engine assigned tension levels.
Policing & Society 15
Dow
nloa
ded
by [C
ardi
ff U
nive
rsity
] at 0
6:48
14
May
201
3

16 M.L. Williams et al.
Next, we turned to examining the temporal dimension and visualised spikes and troughs in tension. Figure 4 represents the number of police coded tweets by level of tension over the duration of the event in question. Key moments during the unfolding of the event are indicated which correspond to increases in Twitter traffic and tension levels. This correlation resonates with other research on Twitter and event reaction (see Sakaki et al. 2010). Figure 5 illustrates the tension over time as classified by the tension engine. A rough mirroring between the two figures demonstrates the tension engine matched the police coded tension levels at key moments during the event. Most notably, spikes in tension in the police-coded tweets match the spikes produced by the tension engine (20 November, 20 and 21 December, 27 January). These temporal results, combined with the positive text classification findings indicate that the social media tension-monitoring engine and the MCA methodology function as a sound alternative to human police coders. Discussion Over a decade ago the ACPO Manual of Guidance on Keeping the Peace (2000) stressed the utility of tension monitoring in anticipating public disorder. At this time tension indicators were envisaged to include crime rates, social and political instability, economic deprivation and environmental degradation. Sources of intelligence on tension could include ‘sentinels’ offering direct police observations of local neighbourhoods and crime patterns, plus informants, resident and tenant associations and neighbourhood forums to get at ‘the word on the street’. The former relies on the tacit knowledge of policing most likely informed by the ‘crime risk paradigm’ – a preoccupation identified as a key factor in the failure to predict the escalation of public disorder in the Burnley riots (King and Waddington 2004). The latter source being more difficult to cultivate is a less common, but an infinitely richer and arguably more accurate barometer of tensions in local communities. However, even this source of intelligence is not without its flaws, including the promotion of partisan views at the exclusion of those from ‘hard-to-hear’ and excluded populations – ‘the boys in the hood’.
The now near ubiquitous access to cheap smartphone technology has seen the socio-economic digital divide close rapidly, being filled by excluded and disenfran-chised youth who revel in updating all who care to listen about their daily activities, happenings, opinions and gripes. Communicating in this fashion is now an extension of everyday life for many and can operate as a primary source of expression about feelings. Furthermore, social media communication is augmenting, and to some extent provides a surrogacy to, traditional terrestrial forms of communal commu-nication about issues in local neighbourhoods which can include a wider representa-tion of the population (Edwards et al. 2013). A simple count of local community forums on Twitter in the cities of Cardiff and Manchester show over 100 groups discussing topics that range from parking to burglary. A ‘social-listening’ of these and individual channels of communication can provide a rich source of data on rising and lowering community tensions adding an additional digital layer onto more conventional terrestrial intelligence creating a form of ‘neighbourhood informatics’.
The results reported above provide evidence that the automated collection and analysis of social media channels (in this case Twitter) for the identification and monitoring of tensions is possible. Adapting Sack’s Membership Categorisation

Policing & Society 17 Analysis to a computational algorithm via a process we term ‘Collaborative Algorithm Design’ (the digital codifying of sociological concepts via the close working partnership of social and computer scientists) yielded results that compared favourably with the human police coded data. The prototype social media tension-monitoring engine, a part of COSMOS, then ameliorates the first problem outlined earlier in the paper – that social media data presents a significant challenge to the police analyst in terms of the volume of data produced in short periods of time, and the difficultly of making sense of the content in a way that relates to police priorities.
On the question of whether sentiment analysis tools yields results that are commensurate with our tension-monitoring engine we have published a paper which demonstrates the superior efficacy of the latter (Burnap et al. 2013). The paper shows that while the harmonised mean of precision and recall – the F-measure – is similar for both tools for the ‘Some Tension’ class, the tension engine performs better at the higher end of the tension scale, which makes it more useful for detecting raised spikes in tension that are so important in predicting the likelihood of public disorder. We conclude in this paper that extremes in positive and negative sentiment are not directly related to tension and that tension detection requires more than sentiment analysis alone. Both sets of results provide evidence to suggest our social media tension-monitoring engine both outperforms human police coders (in terms of volume and speed of classification) and other machine supported classification engines (in terms of superior classification accuracy and precession compared to sentiment analysis).
While we have been able to empirically test which automatic tools best agree with human police coders on the topic of tension in tweets, there remain many questions yet to be answered. As we delineated earlier in the paper, questions over the lack of demographic metadata (gender, location, race, etc.) and the fidelity of information in social media networks seem to still elude us (however, see Morgan et al. 2013 for advances in these areas). For example, can rumour on social media networks be promoted to intelligence via triangulation with other data sources to create a form of ‘neighbourhood informatics’? Furthermore, the extent to which social media content represents the voices of the ‘hard-to-hear’ and how these channels may afford a ‘synoptic’ reordering of relations and offer alternatives to official constructions of crime and disorder problems in local communities remains largely unexplored. But perhaps the most challenging is establishing the reciprocal relationship between online expression and offline action, which remains largely untested. Only extended use of social media automated tension monitoring with a retrospective analysis post public disorder will reveal what levels of online expression are associated with a migration of tension from online to offline contexts. And this would only be possible if online tensions were being expressed via open platforms, and not closed networks such as Blackberry Messenger (Procter and Voss 2013). However, to rule out social media monitoring on this basis would be improvident. We still do not understand well enough how tensions expressed offline relate to the break-out of public disorder. Pinpointing the tipping point of high-tension to riot and extrapolating from that a predictive mechanism may well be a fool’s errand. But what is clear is that including social media in the policing diet enriches and enlarges the monitoring pool providing more data-points with which to triangulate and trace the ebb and the flow of tensions.
18 M.L. Williams et al. Conclusion The HMIC (2011a) report The Rules of Engagement highlighted the need for a social media monitoring system that could augment ‘terrestrial’ community engagement and intelligence gathering on neighbourhood tension. Such a system would assist the police to better understand their ‘multi-site’ online-offline operating environment. However, as noted in this paper those responsible for monitoring tension are likely to find information gleaned from social media sources as challenging to handle due to the rate and amount of data produced and the difficulty in interpreting and making sense of content. Existing commercially available social media monitoring systems make sense of content by analysing sentiment. Adopting such technology to monitor tensions in anticipation of public disorder without scientific investigation into its adaptability is short-sighted. The results from this paper represent the first step in this scientific process. Adapting language based tools advocated by Sacks (1992) and Housley and Fitzgerald (2002) via the process of Collaborative Algorithm Design, social scientists in collaboration with computer scientists have developed an automated social media tension-monitoring system that demonstrates a high level of agreement with human police coders (especially in the case of high tension). When compared to sentiment analysis tools the tension engine produced more efficacious results (see Burnap et al. 2013), particularly in relation to identifying spikes in tension. While this paper reports the first scientific evidence on identifying tensions in social media networks, there are however several shortcomings that need highlighting. We took police human coders as the ‘gold standard’ against which to evaluate our tension engine, aiming to draw on their ‘tacit’ policing knowledge in identifying tension. Clearly a question remains over the applicability of this ‘tacit’ knowledge to the online environment when it has been inculcated mostly in offline contexts. Further refinement of this research method will need to involve a broader sampling of social groups with other tacit knowledge of civil unrest, including those directly involved in particular incidents. Further, our data corpus related to only one type of event – a sporting event with associated racial tension. It still remains to be seen if the tension engine will produce as positive results in relation to other types of events (political protests, industrial action, etc.). Finally, and perhaps fundamentally, the reciprocity between online expression and offline action is still largely not understood and further investigation is necessary before full advantage can be taken of the new digital tools of ‘neighbourhood informatics’ to compare and contrast alternative concepts of civil unrest. Acknowledgements This work is based on the project Digital Social Research Tools, Tension Indicators and Safer Communities: a Demonstration of the Cardiff Online Social Media ObServatory (COSMOS) which was funded by the Economic and Social Research Council under the Digital Social Research Demonstrator Programme (Grant Reference: ES/J009903/1). We are grateful for comments from the reviewers on the first draft of this paper. Notes 1. http://www.cardiff.ac.uk/socsi/research/researchgroups/comsc-socsi/projects.html. 2. http://blog.Twitter.com/2011/09/one-hundred-million-voices.html.

Policing & Society 19 3. Derived from crowd-sourcing: the act of outsourcing a task to a large, undefined group of people
through an open call. 4. The Cardiff Online Social Media ObServatory (COSMOS) will be the first platform to integrate social
media analytics with secondary data from all these sources. COSMOS is currently a case study for the Office for National Statistics (ONS) Application Program-ming Interface (API) project, which aims to provide access to all ONS datasets.
5. Beckett’s model was adapted by ACPO in 1992: Sporadic disorder 0 Riot 0 Serious rioting 0 Lethal rioting (as the apex) 0 Immediate post-riot 0 Community unrest (ACPO 1992) and altered in 2000 to the ‘disorder model’ to reflect a more holistic approach to public order policing: Unrest 0 Serious disorder/Riot 0 Disorder 0 Tension. See King and Waddington (2004) for a discussion of the ‘riot curve’ and its development.
6. https://dev.twitter.com/docs/faq#6861. 7. ‘Where tentative conclusions are deemed acceptable, may an a]0.667 suffice’ (Krippendorff 2004,
p. 241). References Adams, L., 2012. Police develop technology to monitor social networks, Herald Scotland
[online]. Available from: http://www.heraldscotland.com/news/home-news/police-develop- technology-to-monitor-social-neworks.18357627 [Accessed 16 July 2012].
Amin, A., 2003. Unruly strangers? The 2001 urban riots in Britain. International Journal of Urban and Regional Research, 27 (2), 460-463.
Association of Chief Police Officers (ACPO). 1992. The new public order command level programmes. Bramshill: National Police Training Centre.
Association of Chief Police Officers (ACPO). 2000. Manual of guidance on keeping the peace. Bramshill: National Police Training Centre.
Asur, S. and Huberman, B.A., 2010. Predicting the future with social media, CoRR [online]. Available from: http://www.hpl.hp.com/research/scl/papers/socialmedia/socialmedia.pdf [Accessed 16 July 2012].
Bagguley, P. and Hussain, Y., 2008. Riotous citizens: ethnic conflict in multicultural Britain. Ashgate: London.
Baker, C.D., 1984. The search for adultness: membership work in adolescent-adult talk. Human Studies, 7, 301-323.
Beckett, I., 1992. Conflict management and the police: a policing strategy for public order. In: T. Marshall, ed. Community disorders and policing: conflict management in action. London: Whiting & Birch, 129-139.
Boyd, D.M. and Ellison, N.B., 2007. Social network sites: definition, history, and scholarship. Journal of computer mediated communication, 13 (1), 210-230.
Brainard, L.A. and McNutt, J.G., 2010. Virtual government and citizen relations. Administration & Society, 42 (7), 836-858.
British Broadcasting Corporation (BBC). 2012. Tom Daley ‘abuse’ tweet: legal rethink on online rules [online]. Available from: http://www.bbc.co.uk/news/uk-19660415 [Accessed 20 September 2012].
Burnap, P., et al.., 2013. Detecting tension in online communities with computational Twitter analysis. Technological Forecasting and Social Change.
Chainey, S., 2008. Identifying priority neighbourhoods using the vulnerable localities index. Policing, 2 (2), 196-209.
Choudhary, A., et al., 2012. Social media evolution of the Egyptian revolution. Communications of the ACM, 55 (5), 74-80.
Crump, J., 2011. What are the police doing on Twitter? Social media, the police and the public. Policy and Internet 3 (4), Article 7.
Department for Communities and Local Government. 2008. Guidance for local authorities on community cohesion contingency planning and tension monitoring. London: DCLC.
Dutton, W.H. and Blank, G., 2011. Next generation users: the internet in Britain. Oxford: Oxford Internet Institute, University of Oxford. Oxford Internet Survey.
Edwards, A., et al., 2013. Digital social research, social media and the sociological imagination: surrogacy, augmentation and re-orientation. In: W. Housley, ed., et al.

20 M.L. Williams et al.
Computational social science: research, design and methods [special issue]. International Journal of Social Research Methodology, 16 (3).
Ginsberg, J., et al., 2009. Detecting influenza epidemics using search engine query data. Nature 457 (7232), 1012-1014.
Goodman, M., 2011. From crowdsourcing to crime-sourcing: The rise of distributed criminality: How criminals are applying crowdsourcing techniques, O’Reilly Radar [online]. Available from: http://radar.oreilly.com/2011/09/crime-sourcing.html [Accessed 21 August 2012].
Greer, C. and McLaughlin, E., 2010. We predict a riot? Public order policing, new media environments and the rise of the citizen journalist. British Journal of Criminology, 50, 1041-1059.
Guardian. 2011. Reading the riots: investigating England’s summer of disorder. Available from: http://www.guardian.co.uk/uk/series/reading-the-riots [Accessed 16 July 2012].
HMIC. 2011a. The rules of engagement: a review of the August 2011 disorders. London: HMIC. HMIC. 2011b. Policing public order: an overview and review of progress against the recommendations of adapting to protest and nurturing the British model of policing. London: HMIC. Home Office. 2001. Community cohesion: a report of the independent review team chaired by ted
cantle. London: Home Office. Housley, W., 2002. The moral discrepancy device and fudging the issue in a political radio news
interview. Sociology, 34 (3), 5-21. Housley, W. and Fitzgerald, R., 2002. The reconsidered model of membership categorization analysis.
Qualitative Research, 2 (1), 59-83. Housley, W. and Fitzgerald, R., 2009. Membership categorization, culture and norms in action.
Discourse and Society, 20 (3), 345-362. Institute of Community Cohesion (iCoCo). 2010. Understanding and monitoring tension and conflict
in local communities. Coventry: iCoCo. King, M., 2006. From reactive policing to crowd management?: policing anti-globalisation protest in
Canada. Jurisprudencija, 79, 40-58. King, M. and Brearley, N., 1996. Public order policing: contemporary perspectives on strategy and
tactics. Leicester: Perpetuity Press. King, M. and Waddington, D., 2004. Coping with disorder? The changing relationship between police public
order strategy and practice - a critical analysis of the Burnley Riot. Policing and Society, 14 (2), 118-137. Krippendorff, K., 2004. Content analysis: an introduction to its methodology. 2nd ed. Thousand
Oaks, CA: Sage. Kundnani, A., 2001. From Oldham to Bradford: the violence of the violated. In: Institute of Race
Relations, ed., The three faces of British Racism. London: IRR, 105-131. LexisNexis Risk Solutions. 2012. Law enforcement personnel use of social media in investigations. Available
from: www.lexisnexis.com/investigations [Accessed 15 July 2012]. Lotan, G., et al., 2011. The revolutions were tweeted: information flows during the 2011 Tunisian and
Egyptian revolutions. International Journal of Communication, 5, 1375-1405. National Policing Improvement Agency (NPIA). 2010. Engage: digital and social media for the police
service. London: National Policing Improvement Agency. Mathieson, T., 1997. The viewer society: Foucault’s panopticon revisited. Theoretical Criminology, 1,
215-234. Morgan, J., et al., 2013. Knowing the Tweeters: techniques for deriving demographic data from
Twitter. Sociological Research Online. Morrell, G., et al., 2011. The August Riots in England: Understanding the involvement of young
people [online]. National Survey Research Centre. Available from: http://www.natcen.ac.uk/ study/the-august-riots-in-england- [Accessed 15 July 2012].
Peat, D., 2010. Cell phone cameras making everyone into a walking newsroom. Toronto Sun, 1 February.
Procter, R. and Voss, A., 2013. Reading the riots on Twitter: methodological innovation for the analysis of big data. In: W. Housley, A. Edwards, M.L. Williams, and M. Williams, eds. Computational social science: research, design and methods [Special Issue]. International Journal of Social Research Methods, 16 (3).

Policing & Society 21
Rheingold, H., 1993. The virtual community homesteading on the electronic frontier. New York: Harper Collins.
Sacks, H., 1992. Lectures on conversation, Vol. I and II. G. Jefferson with introduction (Ed.) by E.A. Schegloff. Oxford: Basil Blackwell.
Sakaki, T., Okazaki, M., and Matsuo, Y. 2010, Earthquake shakes Twitter users: real-time event detection by social sensors. In: Proceedings of the 19th international conference on world wide web. New York, NY: ACM Press, 1-10.
Smith, D., 2012. How many people use the top social media? Digital Market Ramblings [online]. Available from: http://expandedramblings.com/index.php/resource-how-many-people-use-the- top-social-media/ [Accessed 15 July 2012].
Tumasjan, A., et al., 2010. Predicting elections with Twitter: what 140 characters reveal about political sentiment. In Proceeding of 4th ICWSM, Munich, Germany: AAAI Press, 178-185.
van Rijsbergen, C.J., 1979. Information retrieval. 2nd ed. London: Butterworth.