polar cap field&aligned currents for southward
TRANSCRIPT
JOURNAL OF GEOPHYSICAL RESEARCH, VOL. 99, NO. A4, PAGES 6067-6078, APRIL 1, 1994
Polar cap field-aligned currents for southward interplanetary magnetic fields
Dingan Xu and Margaret G. Kivelson Institute of Geophysics and Planetary Physics and Department of Earth and Space Sciences, University of California, Los Angeles
Abstract. It has been common to suppose that polar region field-aligned currents for southward interplanetary magnetic fields (IM• consist of two parts: region 1 and region 2 currents. It is often suggested that both of these current systems flow on closed field lines. In this pilot study the limited data available from the ISIS 2 satellite are used to examine region 1 currents with the objective of establishing whether or not they can exist partially on open field lines (i.e., inside the polar caps) for southward IMF. Magnetic field perturbations were used to identify the field-aligned currents (FACs). Particle measurements from both the energetic particle detector and the soft particle detector on board the ISIS 2 satellite were used to distinguish between what we suggest are open and closed field lines. Although the identification is not unambiguous, •>keV electrons are found principally on closed field lines. The absence of •>keV electrons but the presence of •< 200 eV electrons in the polar cap or background polar rain is considered as the signature of open field lines. On some passes, region 1 sense FACs appear to be composed of two parts. The poleward part of the current signature is accompanied by electron fluxes at energies •< 200 eV or occasionally by fluxes at background levels while the equatorward part of the interval is accompanied by electron fluxes at energies both •< 200 eV and •>keV. On other passes, region 1 sense currents are accompanied by both •< 200 eV and •>keV electron fluxes during the entire pass. We propose that region 1 sense FACs flow on both closed and open field lines for the first situation and on closed field lines for the second situation. In seeking to understand why region 1 currents sometimes flow only on closed field lines and sometimes flow on open as well as closed field lines, we suggest a control by the IMF B•. The IMF B• may also shift the region 1 currents on open field lines to one side (dawn or dusk) of the polar cap like the con?ection cells. Such a shift provides a consistent model of the data taken on the dayside and we discuss why night side observations may be different. We suggest that in the presence of southward IMF, region 1 currents can be comtx;sed of two parts, one flowing on closed field lines and one flowing on open field lines. Because the portion of the region 1 currents inside the polar caps may be generated by different processes from the portion on closed field lines, we refer to the region 1 currents on open field lines as R10 currents. The region 1 currents on closed field lines may be called R1C currents.
Introduction
Field-aligned currents (FACs) play an important role in the coupling of the ionosphere and magnetosphere, but it is difficult to establish precise links between the regions where they are found at low altitudes and the magnetospheric plasmas through which they close. In this paper, we seek to understand some of the links between low altitude FACs
and the distant magnetospheric plasma. We pay special attention to the dependence of polar cap FACs on the solar wind conditions, especially on the signs of the GSM Y and Z components of the interplanetary magnetic field (IMF). Our objective is to improve our understanding of the global convection of the magnetosphere.
Copyright 1994 by the American Geophysical Union.
Paper number 93JA02697. 0148-0227/94/93JA-02697505.00
FACs in the ionosphere have been investigated for almost two decades. After lijima and Potemra [1976, 1978] reported on the polar region FACs (region 1 and region 2 FACs), much work was carded out on FACs and related problems such as convection cell patterns in the ionosphere [e.g., Russell, 1972; Crooker, 1979; Burch et al., 1985; Reiff and Burch, 1985; Heelis et al., 1983, 1986; Heelis, 1984; Potemra et al., 1984; Zanetti et al., 1984, 1990]. Region 1 currents flow into the auroral ionosphere on the dawnside and out of the ionosphere on the duskside. Region 2 currents are located adjacent to but at lower latitudes than region 1 currents and flow in opposite directions to region 1 currents. It is generally believed that region 1 FACs link velocity shears in the boundary layers (for instance, the low-latitude boundary layer (LLBL)) to the velocity shears in the ionosphere [Sonnerup, 1980; Bythrow et al., 1981; Siscoe et al., 1991]. This would suggest that region 1 FACs normally flow on closed field lines. However, this supposition has not been fully tested. In this paper, we
6067
6068 XU AND KIVELSON: POLAR CAP FIELD-ALIGNED CURRENTS
attempt to determine whether the field lines on which region 1 currents flow are closed or open by using spacecraft data although this identification is not unambiguous.
Many papers have reported on particle precipitation in the polar region. In particular, the precipitation in the ionosphere differs depending on whether it occurs in the polar rain region or the auroral region [Winningham and Heikkila, 1974; Winningham, et al. 1975; McDiarmid et al., 1976; Makita et al., 1983; Meng and Akasofu, 1983]. The precipitating electrons referred to as polar rain have spectra similar to magnetosheath particle spectra, with typical energy of tens of eV. Therefore the polar rain regions are thought to connect to the magnetosheath and to contain open field lines. Inside the auroral region where •>keV precipitating electrons are found, the field lines are thought to be closed.
In recent years, mantle particle precipitation has also been reported [Bythrow et al., 1988; Erlandson et al., 1988; Newell and Meng, 1988; Newell et al., 1991a, b]. Precipitating mantle particles have the energy characteristics of magnetosheath particles, but their number flux is greater than for the polar rain. Therefore, as the polar cap region is defined as the open field line region connecting to the magnetosheath, it actually includes both the polar rain region and the mantle precipitation region. For both regions, •>keV precipitating electrons are typically absent for southward IMF. In this paper, we consider that this change in the character of electron measurement serves to distinguish between open and closed field lines. After the closed and open field line regions have been identified, magnetic field perturbations can be used to find the FACs and to determine whether the FACs flow
on open or closed field lines. FACs can be generated by velocity shear, thermal pressure
gradients, inertial currents, potential drops from reconnection and pressure anisotropy [e.g., Hasegawa and Sato, 1979; Vasyliunas, 1984; Stern, 1984; Southwood and Kivelson, 1991]. Therefore FACs may arise wherever at least one of these generating factors is present: in the solar wind, on the magnetopause or in the magnetosphere both on closed and open field lines. For a northward IMF, FACs have been found in the polar regions in addition to the region 1 and region 2 currents. They flow poleward of region 1 currents in the direction opposite to the region 1 currents. They are referred to as N-BZ FACs [lijima et al., 1984; lijima and Shibaji, 1987; Zanetti et al., 1984, 1990]. In this paper, we suggest for southward IM that there exist FACs poleward of the traditional region 1 currents connected to the closed field lines.
Simultaneous measurements of magnetic field and plasma data from the ISIS 2 satellite were used to study the polar region FACs. To avoid the complexity of the cusp near noon and the Harang discontinuity near midnight, only dawn or dusk crossing orbits were chosen.
From the ISIS 2 data, we found that sometimes there are signatures of FACs inside the putative polar caps for southward IMF. These FACs flow near the boundary of the dayside polar cap within the open field line regions; they flow in the same direction as the region 1 currents: into the ionosphere on the dawnside and out of the ionosphere on the duskside. They are therefore difficult to distinguish from the part of the region 1 FACs that flow on closed field lines. This situation differs for
a northward IMF as N'BZ FACs flow in opposite directions from the region 1 currents and are sometimes spatially well separated from region 1 currents. On the basis of magnetic
signatures alone, the polar cap FACs for southward IMF are a part of the region 1 FACs, but if the currents are to be defined more physically in terms of the driving mechanism and location, the region 1 currents for southward IMF appear to be compound in nature.
In the following sections, we first discuss the data that we used, then present the examples of the region 1 currents on what we consider to be open field lines. In the summary we also describe plans for our future work on the problem.
Data
The ISIS 2 satellite was placed in a nearly circular polar orbit at an altitude of about 1400 km and at an inclination of 88.7 o. The satellite was spin stabilized and had an active auimde control system which could change the direction of the spin axis and the spin period; the nominal spin period was 18s [McDiarmid et al., 1978]. For this study, passes of northern and southern hemisphere which fell in the dawn or dusk regions were chosen.
The ISIS 2 energetic particle detector (EPD) was designed to provide directional flux measurements of electrons. It has an energy range from 0.15 to l0 keV in eight channels (for a more complete description, see Venkatarangan et al. [1975]). The soft particle spectrometer (SPS) consists of an electron spectrometer covering the energy range from 5 eV to 15 keV. Data from this instrument is displayed as energy versus time grey-shaded specmuns where the plotted grey-scale intensity is proportional to the log of the insmunent count rate at each energy level (for a more complete description, see Heikkila et al. [1970]). Both the EPD and SPS instruments look in directions perpendicular to the spin axis of the satellite. The spin axis was perpendicular to the orbital plane when the satellite moved in a dawn-dusk orbit. The satellite instrumentation also included five fluxgate magnetometers. One of them was mounted parallel to the spin axis of the satellite. For all cases selected in our study, the spin axis was approximately aligned with the east-west direction. The magnetic field perturbation along the east-west direx:tion was obtained by subtracting the measured field from the field component in the same direction calculated from GSFC 06/74 model field [Klumpar, 1979; McDiarmid et al., 1978; 1979]. In this paper, all the data that we used are plotted in four books entitled Coordinated Ionospheric and Magnetospheric Observations from the ISIS 2 Satellite by the ISIS 2 Experimenters which we obtained from NSSDC (National Space Science Data Center). The data from these books does not include a channel above 22 keV which was
used in earlier papers [e.g., McDiarmid et al., 1978]. The four energy channels 0.15 keV, 1.3 keV, 4.1 keV and 9.6 keV that we display from EPD measurements are the only available differential electron flux data in the reference data book.
The four energy channels from EPD measurements overlap energy channels of the SPS, but the EPD measurements show boundaries more clearly than the SPS measurements, so we use data from both instruments. We find consistency between the two •,:mamental measurements.
The magnetometers on board were not intended for scientific experiments; they were intended to provide space, raft altitude information for satellite operations. Therefore processing the data for magnetic field perturbations was a difficult task. Several technical and insmanental difficulties prevented the

XU AND KIVELSON: POLAR CAP FIELD-ALIGNED CURRENTS 6069
precise treatment of the data. Only a perturbation greater than 100 nT and at least of 1 min in duration could be measured (J. R. Burrows, personal communication; 1992). All the perturbation data still have some spin modulation. Only very limited magnetic field perturbation data were processed.
Although there were problems in using the magnetometer data for extensive quantitative analysis, we were able to use them qualitatively to identify the major flow direction of the FACs and their latitude range when the field perturbation was large enough.
As we wished also to relate the structure of the FACs to the orientation of the IMF, we required IMF data. In this study, hourly averaged solar wind IMF data from the IMF data book [King, 1977] were used.
Observations
We examined all the ISIS 2 data available from the data books. There were more than one hundred dawn or dusk
passes. Here we count each side of the polar cap as a separate pass. Our requirement that we have simultaneous measurements of particle precipitation (from both SPS and EPD) and magnetic field perturbations for dawn-dusk orbits excluded some passes. Adding the requirement that MF data be available, we were left with only five passes which we used to carry out a pilot study. The main reasons why we could not obtain more examples were that only limited magnetic field perturbation records and particle flux data were available from the data books, and there were extensive gaps in the IMF data. The data set available to us does not include all
the ISIS 2 data. For instance, we do not have measurements for some passes published in earlier papers (e.g., McDiarmid et al. [1978, Figure 2]).
For each of the five fully documented examples in this paper, the IMF was oriented southward for the previous and subsequent hours.
Figure 1 is an example from a dusk crossing of the northern hemisphere. It displays simultaneous measurements of magnetic field perturbations and the fluxes of precipitating electrons. The top panel shows the perturbation of the magnetic field in the east-west direction. The slope of the perturbation reveals the FAC sense and intensity and the perturbation interval reveals the latitudinal extent of FACs [Iijima and Potemra, 1976]. For a duskside crossing, such as this one, the generally positive slope identifies the region 1 FACs (flowing out of the ionosphere) and the generally negative slope identifies the region 2 FACs (flowing into the ionosphere) according to Iijima and Potemra [ 1976, 1978]. The two regions are shaded in the figure and are labeled as R I and R 2, separately. In this study, we do not discuss region 2 currents.
The middle panel of the Figure 1 contains the EPD observations. It contains data from four energy channels centered at 150 eV, 1.3 keV, 4.1 keV and 9.6 keV plotted as logarithmic flux intensity versus time. The bottom panel of the plot shows the SPS observations. Its upper portion consists of a grey-scale spectrum for electrons. The vertical scales are logarithmic in an energy range from 1 eV to over 10 keV. The lower panel of the figure illustrates the integral electron number flux measured from the observed spectrum from 5 eV to 15 keV.
On Figure 1, several vertical lines are used to distinguish different regions within the interval of currents and particle
measurement. From higher to lower latitudes, they are labeled as 1, 2, $ and 4. Lines 1 and 3 are selected from the perturbation plot of the magnetic field and bound the region 1 sense currents. Similarly, lines 3 and 4 bound the region 2 sense currents. Within the region 1 sense current region between lines 1 and 3, line 2 is placed where the measurements from all the four EPD channels drop to background. Electron fluxes in the SPS range above background are present poleward of line 2, predominantly at energies below ~ 200 eV. Therefore measurements from both SPS (5 eV to 15 keV) and four energy channels from EPD (150 eV and above) were consistent in demonstrating the absence of flux above ~ 200 eV.
The SPS measurements show small spiky structures modulated by spin. Comparing the SPS measurements with the pitch angle measurements which are not shown here, we found that the peaks of the small structures correspond to 0 ø pitch angle and the gaps between each pair of small structures correspond to 180 ø pitch angle. At the altitude of 1400 km where the measurements were made, the loss cone is about 46 ø. Therefore, within46 ø from the peaks of the small structures shown in the SPS measurements (that is, within 22.3 s of the peaks), we are looking at precipitating electrons. The spectrum does not change significantly if one examines both precipitating and trapped electrons so those are the electrons that we use to characterize the different regions.
Above the top plot are shown the magnetic local time (MLT) and invariant latitude (INV. LAT). Below each panel the tick marks label the universal time (LIT) in minutes. The universal year, day, and hour of observation are given in the lower left-hand corner.
For the interval of region 1 currents between lines 1 and 3, the measurements from the SPS and EPD separate rather clearly into an interval between lines 2 and 3 during which electrons are present at all energies from 1 eV to >• 1 keV and a second interval between lines 1 and 2 which contains
only <• 200 eV electrons. The latter interval lies poleward of the region between lines 2 and 3. So the magnetic field perturbation between lines 1 and 3 encompasses two different precipitation regimes. On the plot, these two regions are labelled as R1C and R10 to represent the region 1 currents on closed and open field lines separately (more reasons will be given in next section).
These two different particle flux regimes also differ in the slopes of the magnetic field p _,e•rturbations. The current density calculated from/( 0• = X7 x B is about 0.6/(A/m 2 between lines 2 and 3 and about 0.3/zA/m 2 between lines 1 and 2.
The hourly averaged IMF data were available from the IMP 5 and 6 measurements for all five examples [King, 1977]. Both satellites had apogees less than 33 Re. If the nominal solar wind speed was 350 kin/s, it would take only 10 minutes for the solar wind to flow from the spacecraft apogee to the Earth. For these five cases, the hourly IMF conditions were quite stable. The time delay due to the solar wind transfer would not change the MF values significantly. But the MF values at the measurement time were still calculated by linearly interpolating the values of the previous and subsequent hours. For the Figure 1, the MF (in GSM coordinates) obtained this way was (1.5, -5.1,-2.2) in nT.
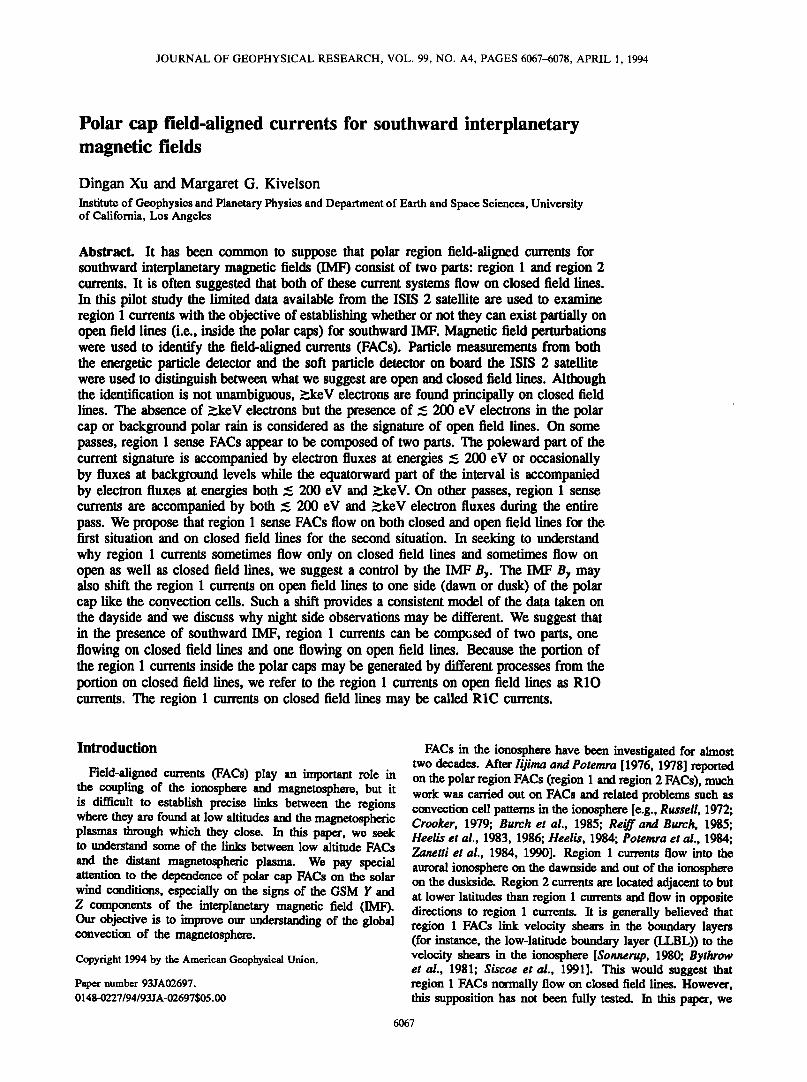
Figure 2 is an example of a dawn crossing in the northern hemisphere which reveals results similar to those of Figure 1: the region 1 sense FAC region falls between lines 1 and 3. Between lines 2 and 3 both •< 200 eV and >•keV

6070 XU AND KIVELSON: POLAR CAP FIELD-ALIGNED CURRENTS
MLT. 19.71 19.49 19.18 18.71 17.91 16.43 INV. LAT. 58.6 61.3 66.9 72.5 77.9 82.4
UT(min) 36 38 40 42 R1 44 46
; • ß ' ' ' I " ' ] • II I i
EPD Measurements •1 3 12 ] 1 I
._ .... !.^ - • e 4
_ _ 4
II I I I I I I • Ill II I I
UT(min) 36 38 40 42 44 46
UT(min) 36 38 40 42 44 46
Figure 1. Simultaneous measurements of magnetic field perturbations and electron flux for a dusk crossing. The top part is the perturbation of the magnetic field in the east-west direction. The middle panel of the plot consist of •>keV particle detector (EPD) observations. They contain plots of four energy channels with 150 eV, 1.3 keV, 4.1 keV and 9.6 keV plotted in logarithmic flux intensity versus time. The bottom part is the soft particle spectrum (SPS) observation. Its upper panel is a grey-scale spectrum for electrons. The vertical scales are logarithmic in energy from 1 eV to over 10 keV. Its lower panel is the electron flux measurement. Above the top plot are shown magnetic local time MLT and invariant latitude INV. LAT. Below each panel the ticks label the universal time (UT) in minutes. The year, day and hour of the observation are given in the left bottom comer of the plot. Lines 1, 2, 3 and 4 indicate distinct regions of the magnetic or particle signatures as discussed in the text. The 1-hour averaged IMF was (1.5, -5.1, -2.2)nT in GSM coordinates.
electrons were present, but both SPS and EPD only showed background flux levels between lines 1 and 2 even though the magnetic field showed a clear perturbation in this region. The current density for R1C currents was about 1.6/tA/m 2 and 0.3/tA/m 2 for R10 currents. The IMF for this case was (-0.8, 1.8,-2.7) nT.
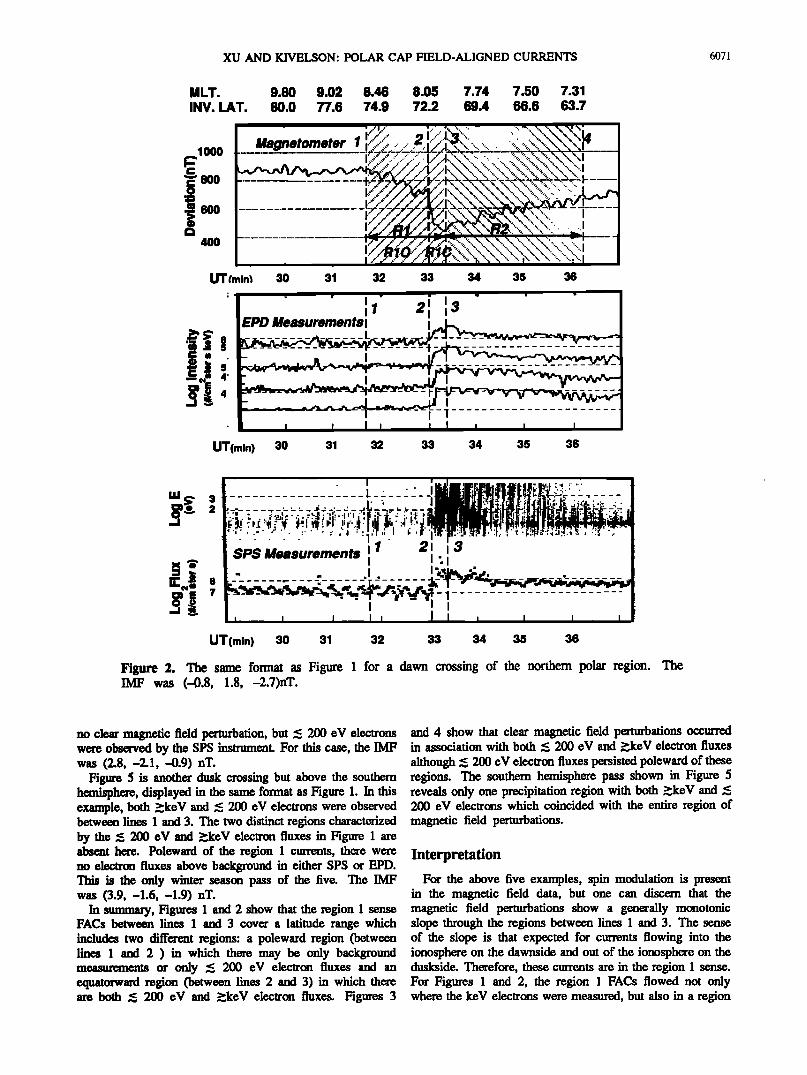
Figure 3 presents a dusk crossing of the northern hemisphere. It shows a different situation from Figure 1. Lines 1 and 2 coincide. Between lines 1 and 3, there were clear magnetic field perturbations and associated electron
fluxes both in EPD and SPS energy ranges. Poleward of this region, the magnetic field measurements do not show clear perturbations. As well, no keV electrons were observed by the EPD. However, •< 200 eV electrons were observed by the SPS insmunent. The IMF for this case was (-0.7, 1.7, -2.7) nT.
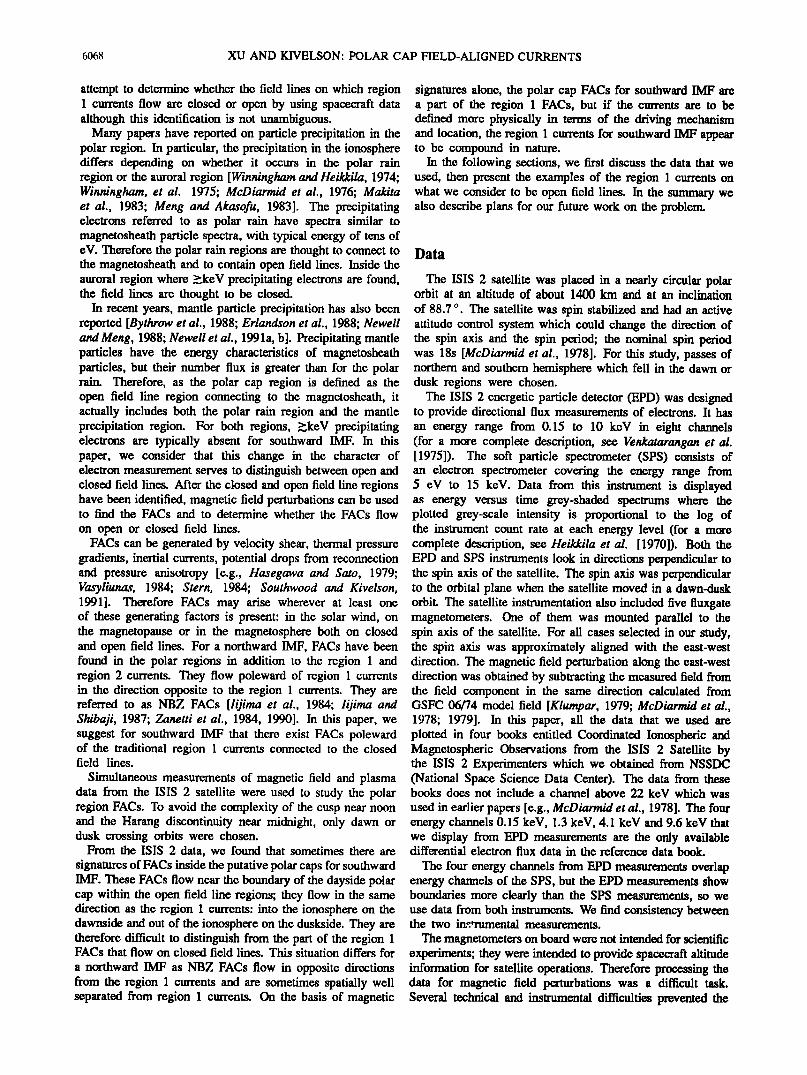
Figure 4 is an example of a dawn crossing in the northern hemisphere which reveals results similar to those of Figure 3. Lines 1 and 2 coincide. The region 1 sense currents between lines 1 and 3 are accompanied by both •keV and •< 200 eV electron fluxes. Poleward of this region, there is
XU AND KIVELSON: POLAR CAP FIELD-ALIGNED CURRENTS 6071
MLT. 9.80 9.02 8.46 8.05 7.74 7.50 7.31 INV. LAT. 80.0 77.6 74.9 72.2 69.4 66.6 63.7
• ! .................... i';•7;-..'T'....-".?'T..17,,i..' q?'•.'---..i"---.?'.-q_'-'-k.•,,?,'2,:-:/.?,,X -,..',,i ..... '" '"" "• '"' '"" '""" I' \-'x'"'- '"'- '"'- '"'- % '"-, '"-, '"--, ": "-- '"'- I • ",," ' /.,' ...' "15'•1 -...'--...'--..."-...',,, '•,, ",,, '-,,, --.. '--.. '-,.- ,......;L•.X..<-.,?,.,, . ..... . ..... I_ ................... :.., "-'" '""
,.- I ...., ..................... r•. ........ • .• ..... --•.-x,--K-x, -.,.-•:--..:--•-,7- -.-:. ....... ---- ,,oo I-' ..................... ` .... -1 '/.•...:'...--...,.(, ,,,--,, ..•,.,,.X'" .'"-,'"-...",",. -'-, ', 'x'"--..'--..;"-,
UT•min• 30 31 32 33 34 35 36
"1 ' ' 14' oi I,• ' ' ' I t &l i•' • EPD Measurements • • •.t-•
Ill .;: 5 .............
! i I I I I • • i
UT(min) 30 31 32 33 34 35 36
uJ•.
UT (min) 30 31 32 33 34 35 36
Figure 2. The same format as Figure 1 for a dawn crossing of the northern polar region. IMF was (-0.8, 1.8, -2.7)nT.
The
no clear magnetic field perturbation, but •< 200 eV electrons were observed by the SPS instnnnent. For this case, the IMF was (2.8,-2.1, -0.9) nT.
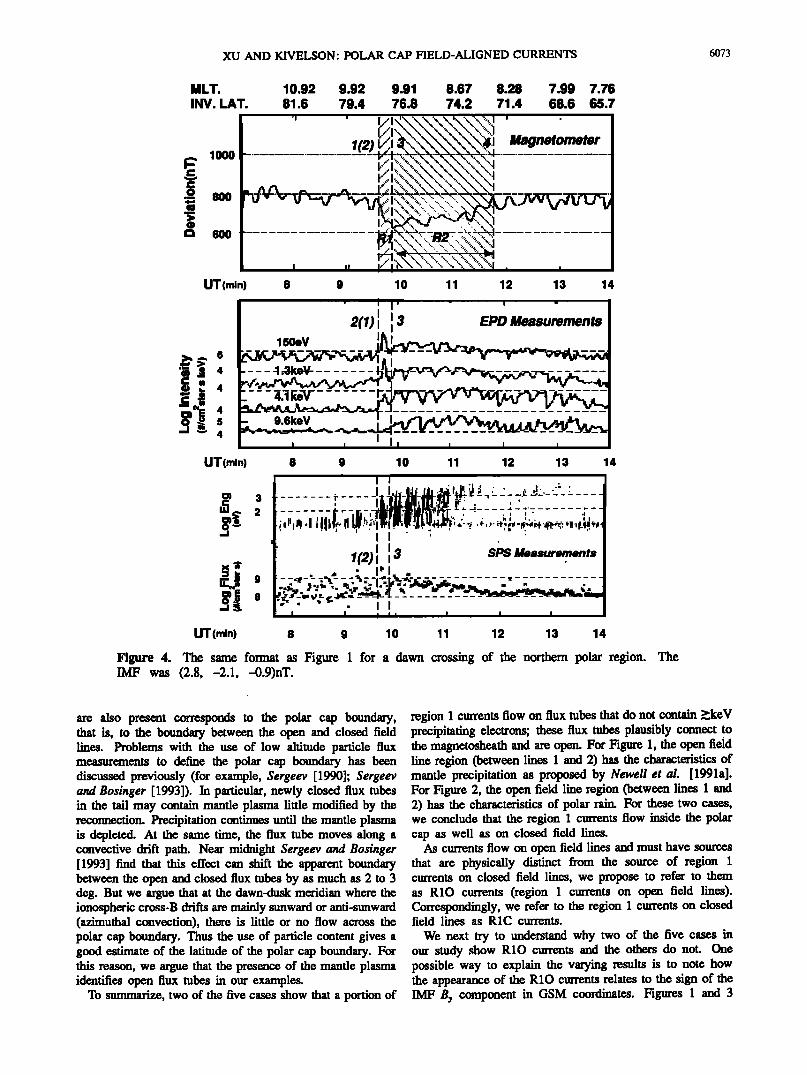
Figure 5 is another dusk crossing but above the southern hemisphere, displayed in the same format as Figure 1. In this example, both •keV and •< 200 eV electrons were observed between lines 1 and 3. The two distinct regions characterized by the • 200 eV and •>keV electron fluxes in Figure 1 are absent here. Poleward of the region 1 currents, there were no electron fluxes above back•ound in either SPS or EPD. This is the only winter season pass of the five. The IMF was (3.9,-1.6,-1.9) nT.
In summary, Figures 1 and 2 show that the region 1 sense FACs between lines 1 and 3 cover a latitude range which includes two different regions: a poleward region (between lines 1 and 2 ) in which there may be only background measurements or only •< 200 eV electron fluxes and an equatorward region (between lines 2 and 3) in which there are both • 200 eV and •keV electron fluxes. Figures 3
and 4 show that clear magnetic field perturbations occurred in association with both •< 200 eV and •keV electron fluxes although • 200 eV electron fluxes persisted poleward of these regions. The southern hemisphere pass shown in Figure 5 reveals only one precipitation region with both •>keV and •< 200 eV electrons which coincided with the entire region of magnetic field perturbations.
Interpretation
For the above five examples, spin modulation is present in the magnetic field data, but one can discern that the magnetic field perturbations show a generally monotonic slope through the regions between lines 1 and 3. The sense of the slope is that expected for currents flowing into the ionosphere on the dawnside and out of the ionosphere on the duskside. Therefore, these currents are in the region 1 sense. For Figures 1 and 2, the region 1 FACs flowed not only where the keV electrons were measured, but also in a region

6072 XU AND KIVELSON: POLAR CAP FIELD-ALIGNED CURRENTS
MLT
INV. LAT.
lOOO
UT (min)
16.55 16.00 15.05 13.26
69.3 75.0 80.2 8•.5
...... . ...... .._,- .. .,,_ . . , . . .
....... ...................... ........... '/ /R2 ,, .... .• . i/•, • ., .• .•~-..• ..•,.• , .. . . - r..-" ...... ..'• i•-. '•'. ..... ...-•,'"...' ..... "x ",. !
•-"..-'" ...... ..."./'•b.-'..¾1..--'•d•,, ...... ' ..... "•. "•.. "• ....... L." .." ,,•' ,," ,-' ,• .-"•.-' • :.. \ \\\%1
...- :,- ,,,' ,,,' •,,- ./ '-... ...
18 2O 22 24 26 28
UT(min) 21
UT(mln} 21
Figure 3. The same format as Figure 1 but for a dawn crossing of the northern polar region. The IMF was (--0.7, 1.7, -2.7)nT.
within which there was no •keV electrons but • 200 eV electrons continued (Figure 1) or there was only background measurement (Figure 2). In other words, the region 1 sense currents are associated with two bands of electrons. The
poleward band contains no •keV electrons; if electrons are present, they have energies • 200 eV; the equatorward band contains both • 200 eV and •keV electrons.
Mantle particle precipitation which has been reported previously can mainly consist of • 200 eV electrons [Meng and Akasofu, 1983; Hoffman et al., 1985; Bythrow et al., 1988; Erlandson et al., 1988; Newell and Meng, 1988, 1992; Newell et al., 1991a, b] . Newell et al. [1991a] and Newell and Meng [1992] used DMSP both ion and electron data to show that mantle particle precipitation is found poleward of the other boundary layers.
For northward IMF, Troshichev and Nishida [1992] found that it is difficult to define the polar cap boundary using only electrons, and Newell et al.'s [1991a, b] exan'tples showed that it was difficult to distinguish the LLBL and the mantle regions by examining electron precipitation alone. Nevertheless, for a southward IMF Troshichev and Nishida
[1992] found that electron flux and precipitation patterns showed clear differences between the auroral oval and the
higher latitude region, and in Newell et al.'s [1991a, b] examples the intensity and average energy of the precipitating electrons are larger in the LLBL than in the mantle region. As our cases are all observed with southward IMF, we use
the electrons to distinguish these plasma regimes. In Figure 1 between lines 1 and 2, most of the measured
electrons have energies below 200 eV. None of the exan'tples of Newell et al. [1991a, b] and Troshichev and Nishida [1992] show exclusively • 200 eV electrons in the regions identified as the LLBL or the PSBL. Hence we identify the region between lines 1 and 2 as mantle field lines. In Figure 2, FACs between lines 1 and 2 are found in a region without enhanced electron fluxes in either EPD or SPS. The background measurements from the SPS in this region corresponds to typical polar rain [Winningham and Heikkila, 1974; Winningham et al. 1975; Newell et al., 1991a, b].
The next step is to consider whether the lines 2 in Figure 1 and 2, the boundary between the regime containing only •< 200 eV electrons and the regime where •keV eleclxons
XU AND KIVELSON: POLAR CAP FIELD-ALIGNED CURRENTS 6073
MLT.
INV. LAT.
1000 60O
10.92 9.92 81.6 79.4
ß ! ! I
........
,
.., •
I I' I /
9.91 8.67 8.28 7.99 7.76 76.8 74.2 71.4 68.6 65.7 •,' ", ..... '" •- ! ' : --
'X, \_\ "• .... ' .... ••'"., '... •..7".• ....... ' .....
.................
.... x '• ' ..... -?-..' ..... %%
..•.'C ..... ' ..... ' ..... ' ..... %%'• ',•. '-. -.. -.. -• -% -% •
UT(min) 8 9 10 11 12 13 14
I 2(1)11 113 EPDMeasuements
'• • 4 ----1.-,1• ....... .••, --- . ....... ß .. 4
• -: --- •;•-• ....... • ............. •E 4
-I• 4 i i , UT(min) 8 9 10 11 12 13 14
' I ! --' '
| .... ', - ,-iIil , :' j;i' iii _ • • ...... ,- ,..,..,.-•. -:-,- .: •. .,
: - • .
1(2) 113 SPS •,•r•ents •j I . ß •1 • I
............. . ..........
UT(min) 8 9 10 11 12 13 14
Figure 4. The same format as Figure 1 for a dawn crossing of the northern polar region. IMF was (2.8, -2.1, -0.9)nT.
The
are also present corresponds to the polar cap boundary, that is, to the boundary between the open and closed field lines. Problems with the use of low altitude particle flux measurements to define the polar cap boundary has been discussed previously (for example, Sergeev [1990]; Sergeev and Bosinger [1993]). In particular, newly closed flux robes in the tail may contain mantle plasma little modified by the reconnection. Precipitation continues until the mantle plasma is depleted. At the same time, the flux robe moves along a convective drift path. Near midnight Sergeev and Bosinger [1993] find that this effect can shift the apparent boundary between the open and closed flux tubes by as much as 2 to 3 deg. But we argue that at the dawn-dusk meridian where the ionospheric cross-B drifts are mainly sunward or anti-sunward (azimuthal convection), there is little or no flow across the polar cap boundary. Thus the use of particle content gives a good estimate of the latitude of the polar cap boundary. For this reason, we argue that the presence of the mantle plasma identifies open flux robes in our examples.
To summarize, two of the five cases show that a portion of
region 1 currents flow on flux tubes that do not contain >•keV precipitating electrons; these flux robes plausibly connect to the magnetosheath and are open. For Figure 1, the open field line region (between lines I and 2) has the characteristics of mantle precipitation as proposed by Newell et al. [1991a]. For Figure 2, the open field line region (between lines 1 and 2) has the characteristics of polar rain. For these two cases, we conclude that the region 1 currents flow inside the polar cap as well as on closed field lines.
As currents flow on open field lines and must have sources that are physically distinct from the source of region 1 currents on closed field lines, we propose to refer to them as R10 currents (region 1 currents on open field lines). Correspondingly, we refer to the region 1 currents on closed field lines as R1C currents.
We next try to understand why two of the five cases in our study show R10 currents and the others do not. One possible way to explain the varying results is to note how the appearance of the R10 currents relates to the sign of the IMF B• component in GSM coordinates. Figures 1 and 3

6074 XU AND KIVELSON' POLAR CAP FIELD-ALIGNED CURRENTS
MLT. INV. LAT.
,• 80o
._o 600
c• 4oo
UT (min)
20.43 20.10 19.88 19.71 72.1 66.7 61.1 55.5
' j .... .-" :." .-" 1'.. "... '• '- '-. '-. '-:. •'- ..... - ..... ß ..... :"r..N ...... 7::,' ...... ' ...... ' ......
1(2• 3",,."'.,.' ..... ".. 4 • Magnetometer ..... ....................
•'". ...... . ...... :.--"/.•>.•'•i.., ....... ' ...... '"--..'• •':,-';--';/,,,. r,',,,-• c-.:-,",,'.
............ [••.? [• •¾:'-.•,...:, ......................... [•,• ,- ,... [,,, ,"q ,,. '. '?,[
[,.=,' •....-'• •',,,•-,,r [',-' -.'] ':• '- .... , I" ";" "1' "' "' I I
51 52 53 54 55 56 57
$ 4
UT (min)
I
I EPD Measurements
51 52 53 54 55 56 57
UT (min) 51 52 53 54 55 56 57
Figure 5. The same format as Figure 1 for a dusk crossing of the southern polar region. IMF was (3.9, -1.6, -1.9)nT.
The
were northern hemisphere duskside crossings in which IMF By was negative and positive, respectively. Figures 2 and 4 were northern dawn crossings in which ]MF By was positive and negative, respectively. Figure 5 was a southern dusk crossing with IMF By negative. These features of the passes are summarized in the first three columns of Table 1.
According to previous studies [Crooker, 1979; Burch et al., 1985; Reiff and Burch, 1985; Walker and Ogino, 1988], ionospheric convection patterns are skewed to the dawnside
Table 1. Comparisons Between Theoretical Expec- tation and observations of the R10 Currents.
Fig. Hemi- Expected Observa- Observed Consis- sphere IMF By R10 tion Made R10? tency?
1 northem < 0 dusk dusk clear yes 2 northern > 0 dawn dawn clear yes 3 northern > 0 dawn dusk no yes 4 northern < 0 dusk dawn no yes 5 southern < 0 dawn dusk no yes
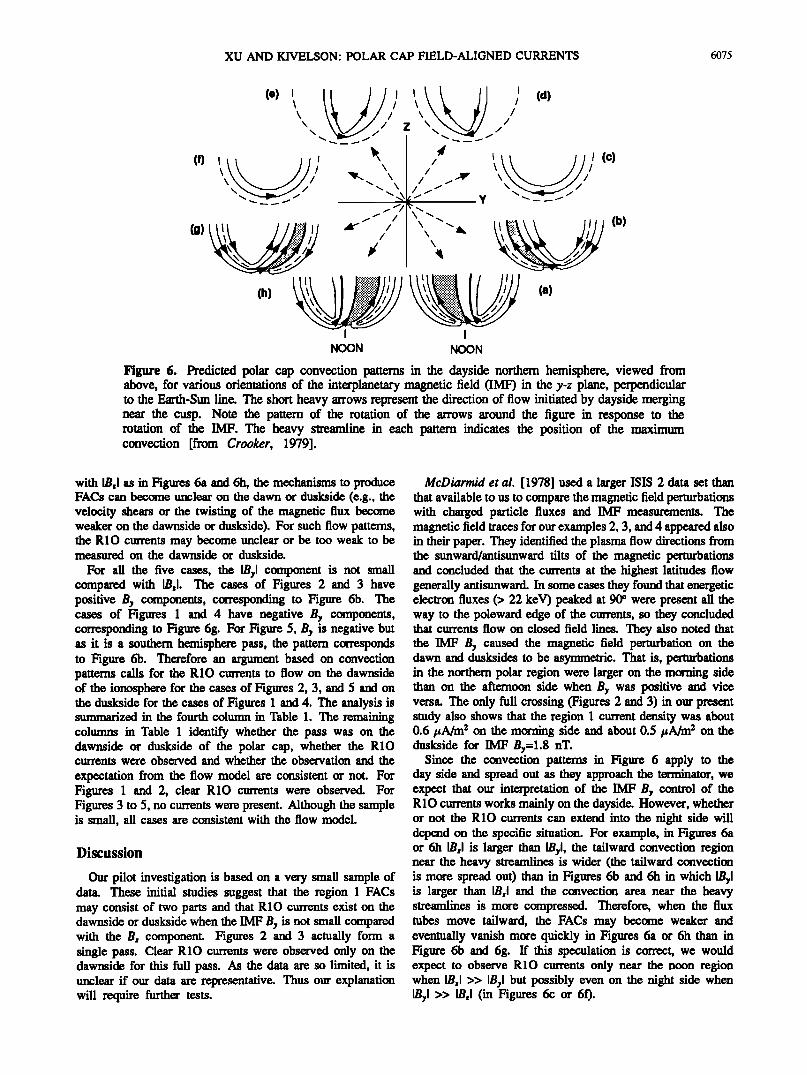
or the duskside in the presence of a finite IMF By component. Figure 6 comes from Crooker [ 1979]. It shows the convection patterns in the dayside northern hemisphere, viewed fi'om above, for various orientations of the IMF in the OSM Y-Z plane, perpendicular to the Earth-Sun line. The heavy streamlines in each pattern are reconnected open flux robes and indicate the region of maximum convection. For a southward IMF, if the By component is not small compared withBz as in Figures 6b and 6g, the convection cells in the ionosphere are skewed to the dawn or the duskside. Therefore the heavy streamlines are also skewed to the dawn or the duskside. For Figures 6b and 6g, the regions adjacent to the heavy streamlines can carry FACs if the mechanisms to produce FACs (e.g., velocity shears or the twisting of the reconnected magnetic flux) exist in these regions. Therefore part of the current is likely to flow on open field lines. According to this idea, for a negative By, the RIO currents should flow on the duskside as in Figure 6g; for a positive By, the R10 currents should flow on the dawnside as in Figure 6b. For a southern hemisphere pass, the R10 currents should flow in the opposite way. When the ]M] :r IB•l is small compared
XU AND KIVELSON: POLAR CAP FIELD-ALIGNED CURRENTS 6075
(0
(b)
I I
NOON NOON
Figure 6. Predicted polar cap convection patterns in the dayside northern hemisphere, viewed from above, for various orientations of the interplanetary magnetic field (IM• in the y-z plane, perpendicular to the Earth-Sun line. The short heavy arrows represent the direction of flow initiated by dayside merging near the cusp. Note the pattern of the rotation of the arrows around the figure in response to the rotation of the IMF. The heavy streamline in each pattern indicates the position of the maximum convection [from Crooker, 1979].
with IB, I as in Figures 6a and 6h, the mechanisms to produce FACs can become unclear on the dawn or duskside (e.g., the velocity shears or the twisting of the magnetic flux become weaker on the dawnside or duskside). For such flow patterns, the R10 currents may become unclear or be too weak to be measured on the dawnside or duskside.
For all the five cases, the IB•l component is not small compared with IB, I. The cases of Figures 2 and 3 have positive B• components, corresponding to Figure 6b. The cases of Figures 1 and 4 have negative B• components, corresponding to Figure 6g. For Figure 5, B• is negative but as it is a southern hemisphere pass, the pattern corresponds to Figure 6b. Therefore an argument based on convection patterns calls for the R10 currents to flow on the dawnside of the ionosphere for the cases of Figures 2, 3, and 5 and on the duskside for the cases of Figures 1 and 4. The analysis is summarized in the fourth column in Table 1. The remaining columns in Table 1 identify whether the pass was on the dawnside or duskside of the polar cap, whether the R10 currents were observed and whether the observation and the
expectation from the flow model are consistent or not. For Figures 1 and 2, clear R10 currents were observ• For Figures 3 to 5, no currents were present. Although the sample is small, all cases are consistent with the flow model.
Discussion
Our pilot investigation is based on a very small sample of data. These initial studies suggest that the region 1 FACs may consist of two parts and that R10 currents exist on the dawnside or duskside when the IMF B• is not small compared with the B, component. Figures 2 and 3 actually form a single pass. Clear R10 currents were observed only on the dawnside for this full pass. As the data are so limited, it is unclear if our data are representative. Thus our explanation will require further tests.
McDiarmid et al. [1978] used a larger ISIS 2 data set than that available to us to compare the magnetic field perturbations with charged particle fluxes and IMF measurements. The magnetic field traces for our examples 2, 3, and 4 appeared also in their paper. They identified the plasma flow directions from the sunward/antisunward tilts of the magnetic perturbations and concluded that the currents at the highest latitudes flow generally antisunward. In some cases they found that energetic electron fluxes (> 22 keV) peaked at 90 ø were present all the way to the poleward edge of the currents, so they concluded that currents flow on closed field lines. They also noted that the IMF B• caused the magnetic field perturbation on the dawn and dusksides to be asymmetric. That is, perturbations in the northern polar region were larger on the morning side than on the afternoon side when B• was positive and vice versa. The only full crossing (Figures 2 and 3) in our present study also shows that the region 1 current density was about 0.6 pA/m 2 on the morning side and about 0.5 pA/m 2 on the duskside for IMF B•=l.8 nT.
Since the convection patterns in Figure 6 apply to the day side and spread out as they approach the terminator, we expect that our interpretation of the IMF B• control of the R10 currents works mainly on the dayside. However, whether or not the R10 currents can extend into the night side will depend on the specific situation. For example, in Figures 6a or 6h IB, I is larger than IB•l, the tailward convection region near the heavy streamlines is wider (the tailward convection is more spread out) than in Figures 6b and 6h in which IB•l is larger than IB, I and the convection area near the heavy streamlines is more compressed. Therefore, when the flux tubes move tailward, the FACs may become weaker and eventually vanish more quickly in Figures 6a or 6h than in Figure 6b and 6g. ff this speculation is correct, we would expect to observe R10 currents only near the noon region when IB•l >> IB•l but possibly even on the night side when IB•l >> IB, I (in Figures 6c or 6f).
6076 XU AND KIVELSON: POLAR CAP FIELD-ALIGNED CURRENTS
Features controlling the intensity of the R10 currents may be the changing nature of the generating mechanisms of the R10 currents as the flux tubes move tailward. For example, the magnetic kinks of the •nnected flux tubes in the dayside propagate away from the reconnection location in the form of Alfven waves which are FAC-related. These kinks
generally diminish or disappear before the feet of the field lines move into the night side. So the R10 currents may be more intense on the day side than on the night side. One additional difference between the dayside and nightside is the conductivity which is well known to affect the intensity of the currents.
The above discussion suggests that whether or not we observe the R10 currents depends on the IMF situation and the location of the pass. In the work by McDiarmid et al. [1978], there was one dawn-dusk pass (Figure 2). For this example, the IMF was (-5.3, 2.4, -?.3)nT in GSM coordinates. For negativeB: and positiveBy, we expected that R10 currents would appear on the dawnside. But no clear R10 currents were present on the dawnside. For this pass, the ratio •B:/By• (~ 3) was larger than for any of the five cases that we studied; the magnetic local time of pass in the dawnside was as early as 0300, and the space, aft remained on the night side. Thus there are several lines of argument that may account for the absence of the R10 currents on this pass without invalidating the hypothesis that accounts for the cases shown in Figure 1-4. We should note that Figure 5 shows a night side pass, and the local time would also account for the absence of
the R10 currents.
Bythrow et al. [1981] found that low-energy electron data (200 eV-25 keV) indicated that the poleward limit of the region 1 currents is nearly coincident with the high-latitude limit of 1 keV plasma sheet electrons. Although they showed that the magnetic field perturbation could extend into the polar rain region (e.g., their Figure 2) and they speculated the region 1 currents could be on open field lines, their paper emphasized (as the paper's title suggests) that R1 currents mapped to the boundary layers on closed field lines.
Burch et al. [1985] and Reiff and Burch [1985] used DE data and the antiparallel merging hypothesis of Crooker [1979] to propose the coexistence of three distinct types of convection cells: viscous cells, merging cells and lobe cells. They found that the cusp currents flowed upward (downward) for a positive (negative) IMF By. They proposed a By current system which was an extension of the cusp currents in the morning (afternoon) sector for a negative (positive) IMF By. The R10 currents that we proposed have the traditional region 1 sense which is opposite to the cusp currents and they are located in the morning (aftemoon) sector for a positive (negative) IMF By.
In the present study, we have assumed that the region 1 and region 2 currents are infinite current sheets extended azimuthally and therefore ignore possible edge effects. For current sheets of finite extent, there can be some edge effects. For Figure 1, the magnetic local time of the observation of region 1 sense currents was from about 1752 to 1907 UT, and from about 0811 to 0836 UT for Figure 2. Both observations were made very near the dawn or dusk meridians. According to previous statistical studies of the distribution of the region 1 and region 2 currents in the ionosphere [lijima and Potemra, 1976; Bythrow et al., 1984; Spence, 1989], the current sheets extend azimuthally well beyond the local dawn and dusk regions. Therefore edge effects should be very
small near the dawn-dusk meridian. Actually according to Hoffman [ 1985], on the duskside of the ionosphere when both precipitating electrons and FACs calculated from magnetic field perturbations exist, they are well correlated in extent. For the dusk crossing of Figure 1, precipitating electrons and magnetic field perturbations were well collocated. This supports the suggestion that the magnetic field perturbation was caused by local FACs and not significantly affected by the edge effects. For the dawn crossing of Figure 2, upward cold ionospheric electrons can form the downward FACs between lines 1 and 2, so the absence of precipitating electrons is not inconsistent with our hypoth•is that FACs flow throu•out the region of field perturbations.
Recently, Beaujardiere et al. [1993] used DMSP data to confirm that the region 1 currents can flow on open field lines. Although they did not classify the appearance of the region 1 currents on open field lines according to different IMF conditions as done in this paper, some of their cases showed results similar to ours.
Summary
Simultaneous measurements of magnetic field perturbations and electron fluxes were used to investigate the location of the FACs in the polar region for southward IMF. The region of magnetic field perturbations sometimes includes two bands, with no keV but •< 200 eV electrons in the poleward portion and both •< 200 eV and keV electrons in the equatorward portion. The current intensities differ for the two regions. Thus the observed region 1 currents for southward IMF may in fact include two parts: one comes from closed field line regions in the magnetosphere and the other comes from open field line regions (the lobes or mantles). Therefore we propose that the region 1 FACs for southward IMF be classified separately to indicate whether they flow on open field lines (R10) or closed field lines (R1C).
Although the R10 currents and R1C currents flow in the same direction, they are distinguishable and are likely to be driven differently. Since there are a number of available mechanisms to generate FACs including pressure gradients, flow shear, and potential drops from reconnection processes, etc., the current intensifies produced from these different mechanisms may differ. The separation of the region 1 currents into two subclasses separated by the polar cap boundary may provide new insights into the mechanisms for generating the polar region FACs.
We intend to carry out more statistical and quantitative data analysis on the R10 currents using other spacecraft data in the future. In the meantime, we intend to study the R10 currents using an MHD simulation.
Acknowledgments. We acknowledge J. R. Burrows for his help in understanding the magnetic field data. We are also grateful to R. J. Walker for his help in the research and getting data. This work was supported by National Science Foundation under grant NSF ATM91-15557. The authors thank two referees for their valuable comments.
The Editor thanks L. J. Zanetfi and D. M. Klumpar for their assistance in evaluating this paper.
References
Beaujardiere, O. de la, J. Watermann, P. Newell, and F. Rich, Relationship between Birkeland current regions, particle
XU AND KIVELSON: POLAR CAP FIELD-ALIGNED CURRENTS 6077
precipitation, and electric fields. J. Geophys. Res., 98, 7711-7720, 1993.
Burch, J. L., et al., IMF By-d•dent plasma flow and Birkeland cutrents in thc daysidc magnetosphere, 1, Dynamics Explorer observation, J. Geophys. Res., 90, 1577-1593, 1985.
Bythrow, P.F., R. A. Heelis, W. B. Hanson, R. A. Power, and R. A. Hoffman, Observational evidence for a boundary layer sourc• of dayside region 1 field-aligned currents, J. Geophys. Res., 86, 5577-5589, 1981.
Bythrow, P. F., T. A. Potemra, and L. J. Zanetti, Variation of the auroral Birkeland current pattern associated with the north- south component of the IMF, in Magnetospheric Currents, Geophys. Monogr. Ser., vol. 28, edited by T. A. Potemra, pp. 131-136, AGU, Washington, D.C., 1984.
Bythrow, P. F., T. A. Potemra, R. E. Erlandson, L. J. Zanetti, and D. M. Klumpar, Birkeland currents and charged particles in the high-latitude prenoon region: A new interpretation, J. Geophys. Res., 93, 9791-9803, 1988.
Crooker, N. U., Dayside merging and cusp geometry, J. Geophys. Res., 84, 951-959, 1979.
Erlandson, R. E., L. J. Zanetti, T. A. Potemra, P. F. Bythrow, and R. Lundin, IMF B• dependence of region 1 Birkeland currents near noon, J. Geophys. Res., 93, 9804-9814, 1988.
Hasegawa, A., and T. Sato, Generation of field-aligned currents during substorm, in Dynamics of the Magnetosphere, edited by S. I. Akasofu, pp. 529-549, D. Reidel, Hingham, Mass., 1979.
Heelis, R. A., The effects of interplanetary magnetic field orientation on dayside high-latitude ionospheric convection, J. Geophys. Res., 89, 2873-2880, 1984.
Heelis R. A., J. C. Foster, O. de la Beaujardiere and J. Holt, Multistation measurements of high-latitude ionospheric convection,/. Geophys. Res., 88, 10,111-10,121, 1983.
Heelis, R. A., P. H. Reiff, J. D. •rmningham and W. B. Hanson, Ionospheric convection signature observed by DE 2 during northward interplanetary magnetic field, J. Geophys. Res., 91, 5817-5830, 1986.
Heikkila, W. J., J. B. Smith, J. Tarstrup, and J. D. •rlnningham, The soft particle spectrometer in the ISIS 1 satellite,Rev. Sci. lnstrum., 41, 1393, 1970.
Hoffman, R. A., M. Sugiura and N. C. Maynard, Current carriers for the field-aligned current system, Adv. Space Res., 5,, 109-126, 1985.
Iijima, T., and T. A. Potemra, The amplitude distribution of field-aligned currents at northern high latitude observed by Triad,/. Geophys. Res., 81, 2165-2174, 1976.
Iijima, T., and T. A. Potemra, Large-scale characteristics of field-aligned currents associated with substorms, J. Geophys. Res., 83, 599-615, 1978.
Iijima, T. and T. Shibaji, Global characteristics of northward IMF-associated (NBZ) field-aligned currents, J. Geophys. Res., 92, 2408-2424, 1987.
Iijima, T., T. A. Potemra, L. J. Zanetti, and P. F. Bythrow, Stable patterns of large-scale Birkeland currents in the polar region during strongly northward IMF, J. Geophys. Res., 89, 7441, 1984.
King, J. H., Interplanetary medim data book, Rep. NSSDC 77--04a, Nat. Space Sci. Data Cent., Greenbelt, Md., 1977.
Klumpar, D. M., Relationship between auroral particle distributions and magnetic field perturbations associated with field-aligned currents,/. Geophys. Res., 84, 6524-6532, 1979.
Makita, K., C. -I. Meng, and S., -I. Akasofu, The shifts of the auroral electron precipitation boundaries in the dawn-
dusk sector in association with geomagnetic activity and interplanetary magnetic field,J. Geophys. Res., 88, 7967- 7981, 1983.
McDiarmid, I. B., E. E. Budzinski, and J. R. Burrows,
Comparison of the Mead-Fairfield magnetic field model with particle measurements,./. Geophys. Res., 81, 3459-3461, 1976.
McDiarmid, I. B., J. R. Burrows, and M.D. Wilson, Comparison of magnetic field perturbations at high latitudes with charged particle and IMF measurements, J. Geophys. Res., 83, 681- 688, 1978.
McDiarmid, I. B., J. R. Burrows, and M.D. Wilson, Large-scale magnetic field perturbations and particle measurements at 1400 km on the daysided. Geophys. Res., 84, 1431-1441, 1979.
Meng, C.-I, and S.-I, Akasofu, Electron precipitation equatorward of the auroral oval and the mantle aurora in the midday sector, Planet. Space Sci., 31, 889-899, 1983.
Meng, C. -I, and K. Makita, Dynamic variations of the polar cap, in Solar Wind-Magnetospheric Coupling, edited by Y. Kamide and J. Slavin, 605-615, Terra Scientific, Tokyo, 1986.
Newell, P. T., and C. -I, Meng, The cusp and the cleft/LLBL: Low altitude identification and statistical local
time variation,/. Geophys. Res., 93, 14,549-14,556, 1988. Newell, P. T., W. J. Burke, C. -I. Meng, E. R. Sanchez, and M.
E. Greenspan, Identification of the plasma at low altitude,/. Geophys. Res., 96, 35-45,1991a.
Newell, P. T., W. J. Burke, E. R. Snachez, C. -I. Meng, M. E. Greenspan, and C. R. Clauer, The low-latitude boundary layer and the boundary plasma sheet at low altitude: Prenoon precipitation regions and convection reversal boundaries, J. Geophys. Res., 96, 21,01 3-21,023, 199 lb.
Newell, P. T., and C. -I. Meng, Mapping the dayside ionosphere to the magnetosphere according to particle precipitation characteristics,Geophys. Res. Lett. 19, 609-612, 1992.
Potemra, T. A., L. J. Zanetti, P. F. Bythrow, A. T. Lui, and T. Iijima. By-dependent convection patterns during northward interplanetary magnetic field, J. Geophys. Res., 89, 9753- 9760, 1984.
Reiff, P. H., and J. L. Burch, IMF By-dependent plasma flow and Birkeland currents in the dayside magnetosphere, 2, A global model for northward and southward IMF, J. Geophys. Res., 90, 1595-1609, 1985.
Russell, C. T., The configuration of the magnetosphere, inCritical Problems of Magnetospheric Physics, edited by E. R. Dyer, pp. 1-16, National Academy of Sciences, Washington, D.C., 1972.
Sergeev, V. A., Polar cap and cusp boundaries at day and night side,/. Geomagn. Geoelectr., 42, 683-695, 1990.
Sergeev, V. A., and T. Bosinger, Particle dispersion at the nightside boundary of the polar cap, J. Geophys. Res., 98, 233-241, 1993.
Siscoe, G. L., W. Lotko, and B. U. O. Sonnerup, A high-latitude, low-latitude boundary layer model of the convection current system,J. Geophys. Res., 96, 3487-3495, 1991.
Sonnerup, B. U. O., The theory of the low-latitude boundary layer,J. Geophys. Res., 85, 2017-2026, 1980.
Southwood, D. J. and M. G. Kivelson, An approximate description of field-aligned currents in a planetary magnetic field,/. Geophys. Res., 96, 67-75, 1991.
Spence, H. E., On the large-scale distribution of magnetospheric currents and thermal plasma, Ph.D. thesis, Univ. of Calif., Los Angeles, 1989.
Stern, D., Magnetospheric dynamo processes, Magnetospheric
6078 XU AND KIVELSON: POLAR CAP FIELD-ALIGNED CURRENTS
Currents,Geophys. Monogr. Ser., vol. 28, edited by T. A. Petetara, pp. 200-207, AGU, Washington, D.C., 1984.
Troshichev, O. A. and A. Nishida, Pattern of electron and
ion precipitation in northern and southern polar regions for northward interplanetary magnetic field conditions, J. Geephys. Res., 97, 8337-8354, 1992.
Vasyliunas, V. M., Fundamentals of current description, inMagnetospheric Currents,Geophys. Monogr. Ser., vol. 28, edited by T. A. Petetara, pp. 63-66, AGU, Washington, D. C., 1984.
Venkatarangan, P., J. B. Burrows, and I. B. McDiarmid, On the angular distributions of electrons in 'inverted V' substxucmresJ. Geephys. Res., 80, 66, 1975.
Walker, R. J., and T. Ogino, Field-aligned currents and magnetospheric convection: A comparison between MHD simulations and observations, inModeling Magnetospheric Plasma, Geephys. Mottogr. Ser., vol. 44, edited by T. E. Moore and J. H. Waite, Jr., pp. 39-49, AGU, Washington, D.C., 1988.
W•mningham, J. D., and W. J. Heikkila, polar cap auroral electron fluxes observed with ISIS 1, J. Geephys. Res., 79, 949-957, 1974.
Wrmningham, J. D., C. D. Anger, G. G. Shepard, D. J. Weber, and R. A. Wagner, The latitude morphology of 10--eV electron fluxes during magnetically quiet and disturbed times in the 210(O300 MLT sector, J. Geephys. Res., 80, 3148-3171, 1975.
Zanetti, L. J., T. A. Potemra, T. Iijima, W. Baumjohann and P. F. Bythrow, Ionospheric and Birkeland current distributions for northward interplanetary magnetic field: inferred polar convectionJ. Geephys. Res., 89, 7453-7458, 1984.
Zanetti, L. J., T. A. Potemra, R. E. Erlandson, P. F. Bythrow, B. J. Anderson, J. S. Murphree, and G. T. Marklund, Polar region Birkeland ctaxent, convection, and aurora for northward interplanetary magnetic field, J. Geephys. Res., 95, 5825-5833, 1990.
M. G. Kivelson and D. Xu, Institute of Geophysics and Planetaxy Physics and Department of Earth and Slmce Science, University of California, 405 Hilgard Avenue, Los Angeles, CA 90024-1567 (e-mail: mkivelson•igpp. ucla. edu; dxu•igpp. ucla. edu).
(Received November 10, 1992; revised June 30, 1993; accepted September 15, 1993.)