polar cap emission: modeling acceleration and beam geometry
TRANSCRIPT
Polar Cap Emission: ModelingAcceleration and Beam Geometry
A.K. HardingNASA Goddard Space Flight Center
Collaborators: M. Baring, I. Grenier, P. Gonthier, A. Muslimov, B. Zhang
• Polar cap acceleration & Pairs
• Electric field screening – Limits on acceleration
• High-energy luminosity
• Geometry of g-ray and radio beams
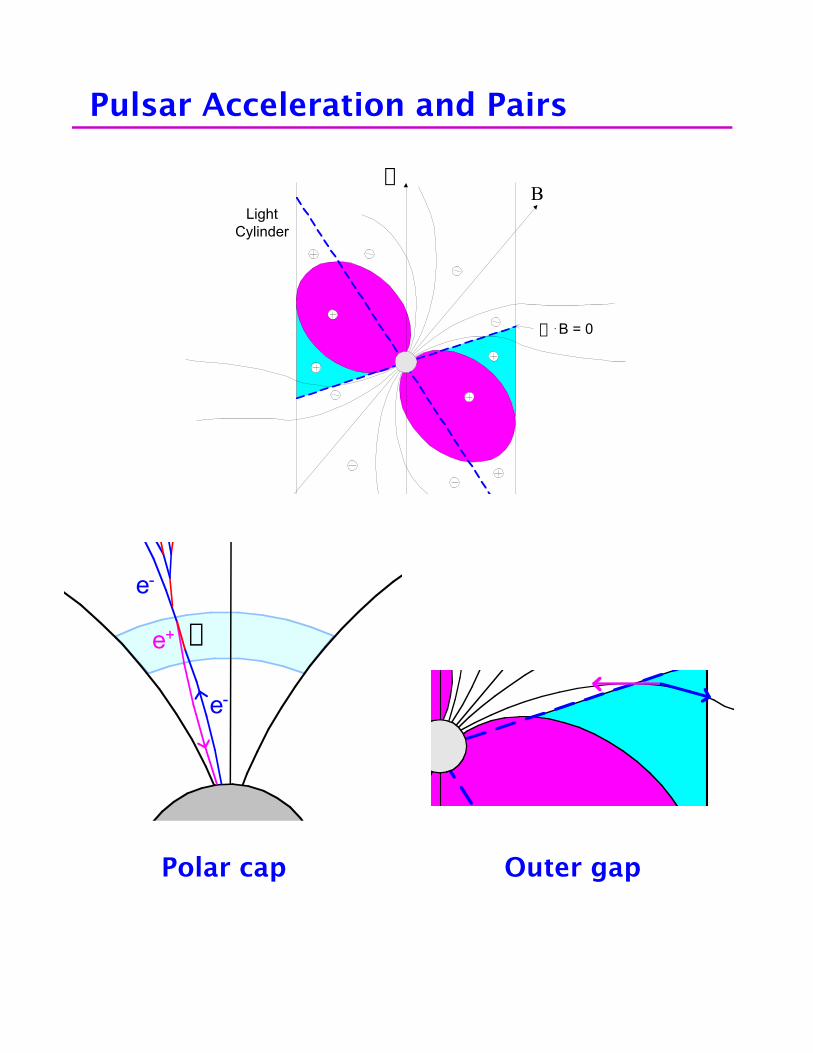
Pulsar Acceleration and Pairs
WB
LightCylinder
W . B = 0
WB
LightCylinder
W . B = 0
B
e+
e-
g
e-
Polar Cap Acceleration and Pair Cascades
Polar cap Outer gap
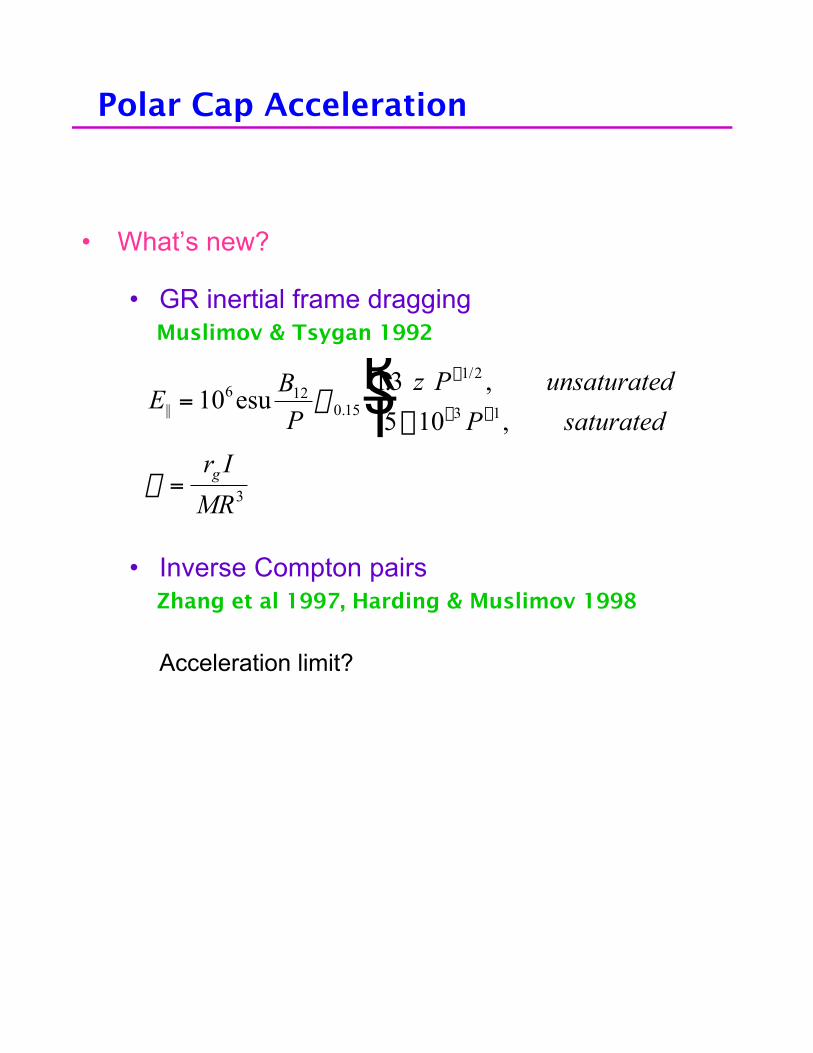
Polar Cap Acceleration
• What’s new?
• GR inertial frame dragging Muslimov & Tsygan 1992
• Inverse Compton pairs Zhang et al 1997, Harding & Muslimov 1998
Acceleration limit?
EB
P
z P unsaturated
P saturated
r I
MRg
|| .
/. ,
,=
¥
RST=
-
- -10
13
5 106 12
0 15
1 2
3 1
3
esu k
k

The Pair Formation Front
z0g - e-
PFF-
NS SURFACE
e-min
min
S z R S Sa p0 0= = +min[ ( ) ( )]min ming e
• Curvature Radiation
• Resonant ICS
• Non-resonant ICS
e grCR
hmc c
= 32
3bgz
P B
P B0
11 1412
4 7
7 412
10 3
12
168ª
RST-
-.
.
.
/ /
/
e gRICS crB B= 2 b gz
P B
P B0
2 312
1
5 412
3 20 01
7
17ª
RST-
-.
/
/ /
e gNRICS =
zP B
P B0
2 312
2 3
5 412
10 01
3
4ª
RST-
-.
/ /
/

10-3 10-2 10-1 100 101
B0/B
cr
10-6
10-5
10-4
10-3
10-2
10-1
100
P (s)
x = 0.7
CR, ICS Pair Front
CRICS, T6 = 0.5
ICS, T6 = 5.0ICS, T6 = 1.0
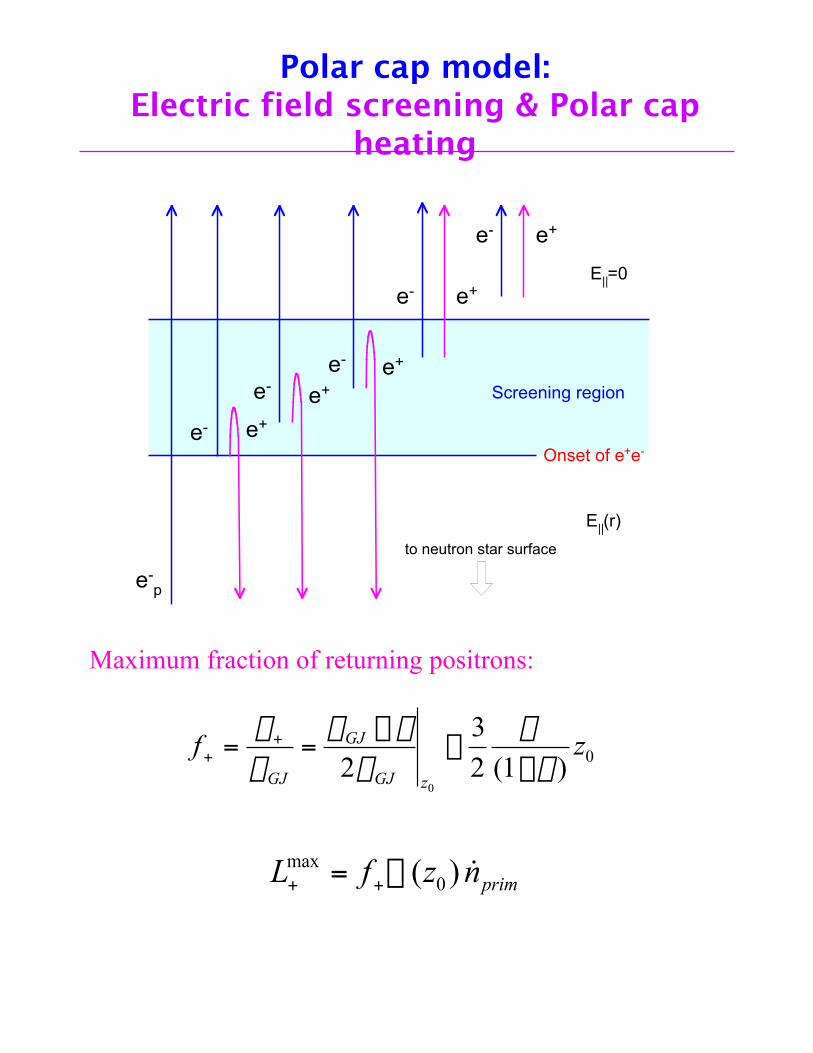
e- e+
e- e+
e- e+
e- e+
e- e+
e-p
Screening region
E||(r)
E||=0
Onset of e+e-
to neutron star surface
Polar cap model:Electric field screening & Polar cap
heating
Maximum fraction of returning positrons:
f zGJ
GJ
GJ z
++= =
-ª
-
rr
r rr
kk2
3
2 10
0( )
L f z nprim+ +=max ( ) &F 0

Pair Source Function
0 500 1000 1500
x (cm)
0.000
0.005
0.010
0.015
N pai
r / p
rimar
y
0.0e0 5.0e3 1.0e4 1.5e4 2.0e4 2.5e4
x (cm)
0.0e0
5.0e-5
1.0e-4
1.5e-4
N pai
r / p
rimar
y
Your text
First generation
All generations
Curvature radiation
Inverse Compton radiation

0 100 200 300 400 500 600 700
x (cm)
0.000
0.002
0.004
0.006
0.008
0.010
r/r G
J
EII
|Dr/rGJ|
r/rGJ
0
500
1000
1500
2000
eEII /m
c2
Screening E||
0 4000 8000 12000 16000
x (cm)
0.000
0.002
0.004
0.006
0.008
0.010
0.012
0.014
r/r G
J
EIIDr/rGJ
r/rGJ
0
20
40
60
80
eEII /m
c2
Curvature radiation
Inverse Compton radiation

Voltage at the Pair Formation Front and g-ray Luminosity
L z n z n R cprim GJ PCg pª =F F( ) & ( )0 02
• Curvature Radiation
• Resonant ICS
• Non-resonant ICS
F( )( / )
.
.&
/
/
/ /
//
z VP
P
LP B
P BE
o
rot
=RST
fi =RST
UVWµ
-
-
-
102
100 3
01
13 61 14
1 4
3227 14
126 7
9 412
1 2
t
g erg / s
F( )
.
.&
/ /
/ /
/
/ //
z VP
P
LP
P BE
o
rot
=RST
fi =RST
UVW/µ
-
-
-
-
103
2
100 3
0 05
117 6
61 2
5 461 4
3113 6
11 4121 2
1 2
t
t
g erg / s
F( )
.
.&
/ /
/
/ /
//
z VP
P
LP B
P BE
o
rot
=RST
fi =RST
UVW/µ
-
-
-
-
102
100 3
01
111 2
61 6
3 4
3013 6
122 3
11 412
1 2
t
g erg / s
Nearly constant!!

1030 1031 1032 1033 1034 1035 1036 1037 10381030
1031
1032
1033
1034
1035
1036
Hig
h E
nerg
y Lu
min
osity
(er
g/s)
L ~ Lsd
Spin-Down Luminosity (erg/s)
1055
-52
Gem
inga
0656
+14 19
51+
32 Vel
a17
06-4
4 1509
-58
Cra
b
Lpred
CR pair death lineJ0
218+
4232
1046
-58

OFF-BEAM
Altitude of lastpairs
ON-BEAM
Synchrotron
Curvature
Geometry of PC g-ray beams

W B
Radio Cone
On-beam g-ray ConeRadio Core
Geometry radio and g-ray beams

Vela pulsar radio profile
(Johnston et al. 2001)

Radio profiles of EGRET pulsars

Unidentified EGRET sources in the GouldBelt
• Distances 100-300 pc
• Luminosities:
• Possible origin: Accreting BHs? X
Accreting NSs? X
O or WR stars? X
Radio-quiet pulsars?Maybe
Grenier 2000
L( )> ª ¥ -100 6 1030 1MeV erg s

Simulation of off-beam and on-beamg-ray pulsars
(Perrot, Grenier & Harding 2002)

Summary
Polar cap models
What works ….
• Predicted luminosity
• High-energy spectral turnovers
• Off-pulse (off-beam) emission
Problems …
• Predicted (standard) size of g-ray beam
• Geometry of radio and g-ray beams
L Erotg µ & /1 2