pol 168 chican@/latin@ politics
DESCRIPTION
POL 168 Chican@/Latin@ Politics. Professor Jones Dept. of Political Science UC-Davis Summer 2009. Demographics and Politics. Let’s segue into demographics by thinking about the recent presidential election. Tom Tancredo ads were highly controversial… - PowerPoint PPT PresentationTRANSCRIPT

POL 168 POL 168 Chican@/Latin@ PoliticsChican@/Latin@ Politics
Professor JonesProfessor JonesDept. of Political ScienceDept. of Political Science
UC-DavisUC-DavisSummer 2009Summer 2009

Demographics and PoliticsDemographics and Politics
• Let’s segue into demographics by thinking about the recent presidential election.
• Tom Tancredo ads were highly controversial…
• …this despite his failure to gain any traction in the 2008 GOP contest.
• View some ads then discuss
Images: TancredoImages: Tancredo
• http://www.youtube.com/watch?v=Zng6I74L5QY&feature=related
• http://www.youtube.com/watch?v=rBK7bWh1m04&NR=1
• http://www.youtube.com/profile?user=TeamTancredo
DiscussionDiscussion
• Major Themes? • Who is the intended audience? • Would you call that “race-baiting”? • Was a major issue among voters• …especially Republican voters in the 08
primaries.• http://youtube.com/watch?v=AjVdALIgfBI• Leading issue in South Carolina• South Carolina

Census Data…Census Data…
• South Carolina
• http://www.censusscope.org/us/s45/chart_race.html

Who are “Latinos”? Who are “Latinos”?
• What counts as “Latino”…as “Hispanic”• The problem of “Spanish Origin” • 22 Countries satisfy this condition• Is it fair to say that anyone from one of these 22
countries is “just like” anyone from another of these 22 countries.
• How should we view “Latinos”• A bloc? Monolithic interests? • Pan-ethnicity vs. Groups

Counting Latin@sCounting Latin@s
• Census Enumeration– First systematic effort was in 1970– The “ethnicity” item: Spanish Origin?– Implication: 22 countries constitute Spanish
origin.– But, anyone can claim Hispanic identity.
• 2000 Census marked major change– Multiple races could be checked.
• What does the Census form look like?

How do we know what we know?How do we know what we know?Census 2000 Question on Hispanic/ Latino Origin

How do we know what we know?How do we know what we know?
Census 2000 Question on Race

Hispanic Population by Race: 2000
Race Number PercentTotal 35,305,818
One race 33,081,736 93.7White 16,907,852 47.9Black or African
American 710,353 2.0American Indian &
Alaska Native 407,073 1.2Asian 119,829 0.3Native Hawaiian &
Other Pacific Islander 45,326 0.1Some other race 14,891,303 42.2
Two or more races 2,224,082 6.3

What?What?
• It is clear the demarcation between race and ethnicity is far from clear.
• 42 percent of “Hispanic origin” claim “other” as race.
• The boundaries are fuzzy. • Note also that Census bureau demarcates
different kinds of groups…• But typically provides data aggregated over the
groups• i.e. “Hispanics”

Population ChangePopulation Change
• Important for you to understand massive shift in population characteristics taking place in US
• We measure this best with Census data.
• Useful to look at some data.
• …and put it in context.

U.S. Population Growth: U.S. Population Growth: 19901990-- 20002000
32.7
1312.9
58
0.0
10.0
20.0
30.0
40.0
50.0
60.0
70.0
Growth (in millions) Percent change
U.S. Population U.S.Hispanic Population
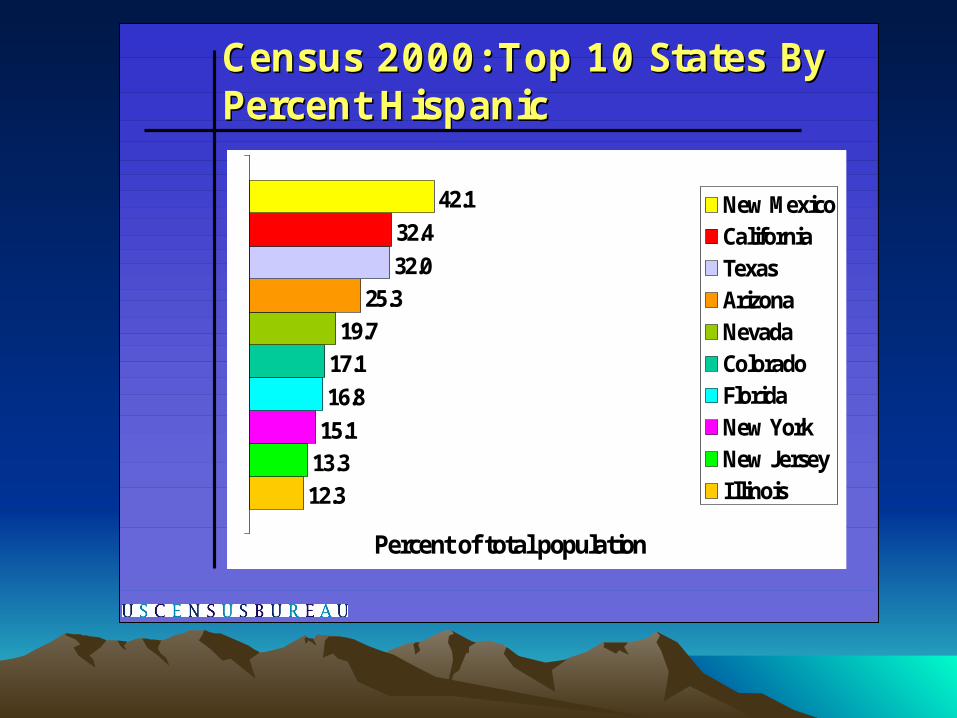
Census 2000: Top 10 States By Census 2000: Top 10 States By Percent HispanicPercent Hispanic
12.3
13.3
15.1
16.8
17.1
19.7
25.3
32.0
32.4
42.1
Percent of total population
New MexicoCaliforniaTexasArizonaNevadaColoradoFloridaNew YorkNew JerseyIllinois
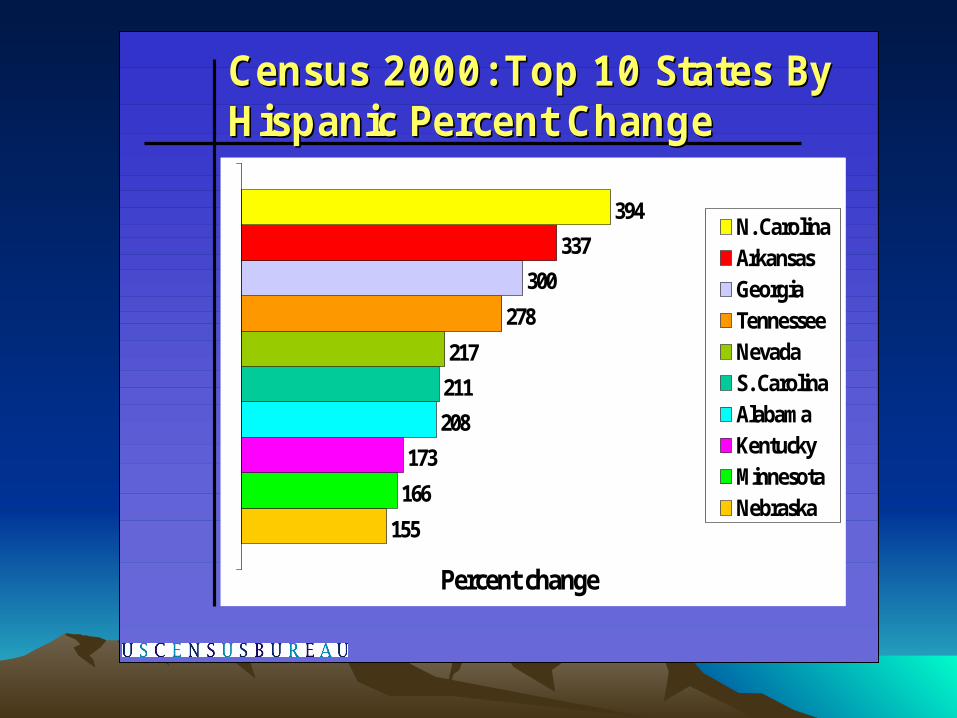
Census 2000: Top 10 States By Census 2000: Top 10 States By Hispanic Percent ChangeHispanic Percent Change
155
166
173
208
211
217
278
300
337
394
Percent change
N. CarolinaArkansasGeorgiaTennesseeNevadaS. CarolinaAlabamaKentuckyMinnesotaNebraska

Take-away points?Take-away points?
• Southern Exposure
• Contact Probabilities much higher…
• Even if overall population levels are low.
• Implications for these big changes?
• Understand that the population increases are not solely from a single country.
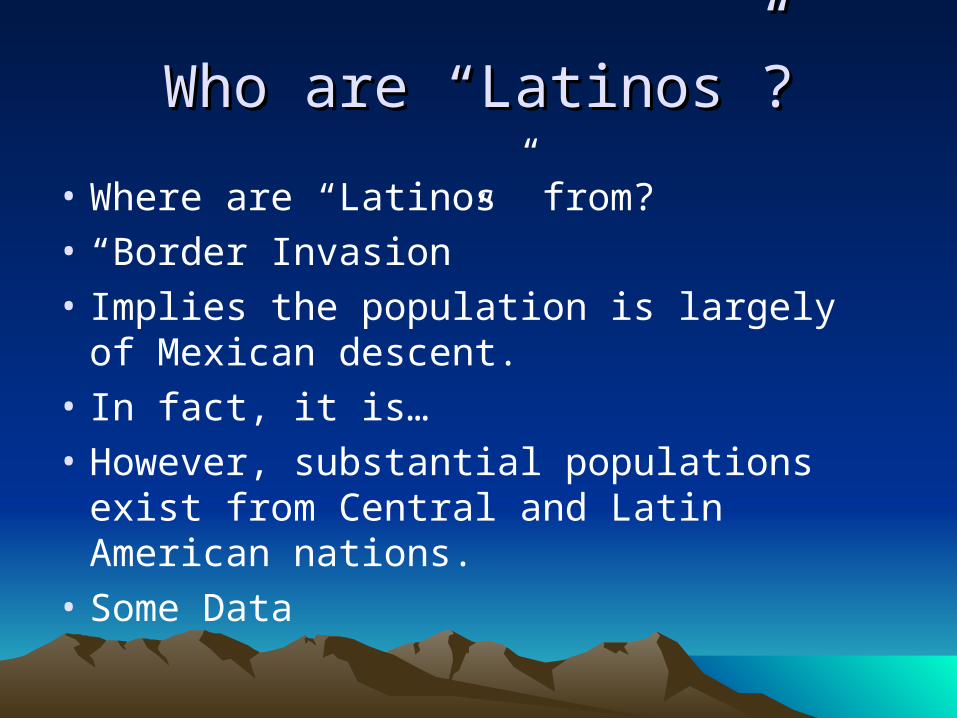
Who are “Latinos”?Who are “Latinos”?
• Where are “Latinos” from?
• “Border Invasion”
• Implies the population is largely of Mexican descent.
• In fact, it is…
• However, substantial populations exist from Central and Latin American nations.
• Some Data

Percent Distribution of the Percent Distribution of the Hispanic Population by Type: 2000Hispanic Population by Type: 2000
Puerto Rican
Cuban
Mexican
All OtherHispanicCentral American
Spaniard
South American

Hispanic Population by Hispanic Population by Type: 2000Type: 2000
Central American 1,686,937Costa Rican 68,588
Guatemalan 372,487
Honduran 217,569
Nicaraguan 177,684
Panamanian 91,723
Salvadoran 655,165
Other Central American 103,721
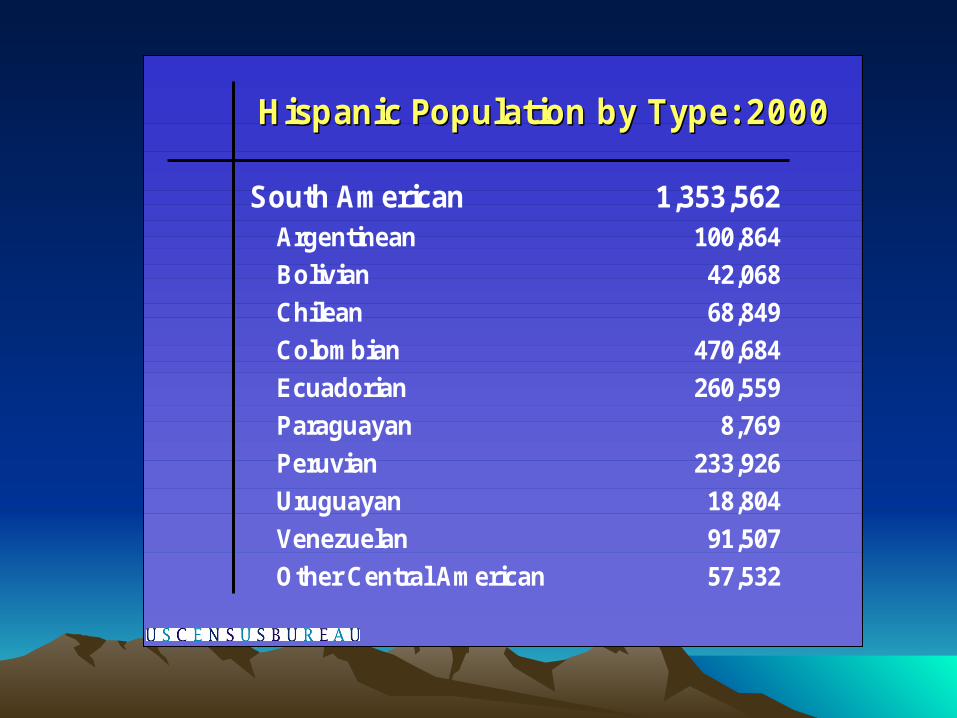
Hispanic Population by Type: 2000Hispanic Population by Type: 2000
South American 1,353,562Argentinean 100,864
Bolivian 42,068
Chilean 68,849
Colombian 470,684
Ecuadorian 260,559
Paraguayan 8,769
Peruvian 233,926
Uruguayan 18,804
Venezuelan 91,507
Other Central American 57,532
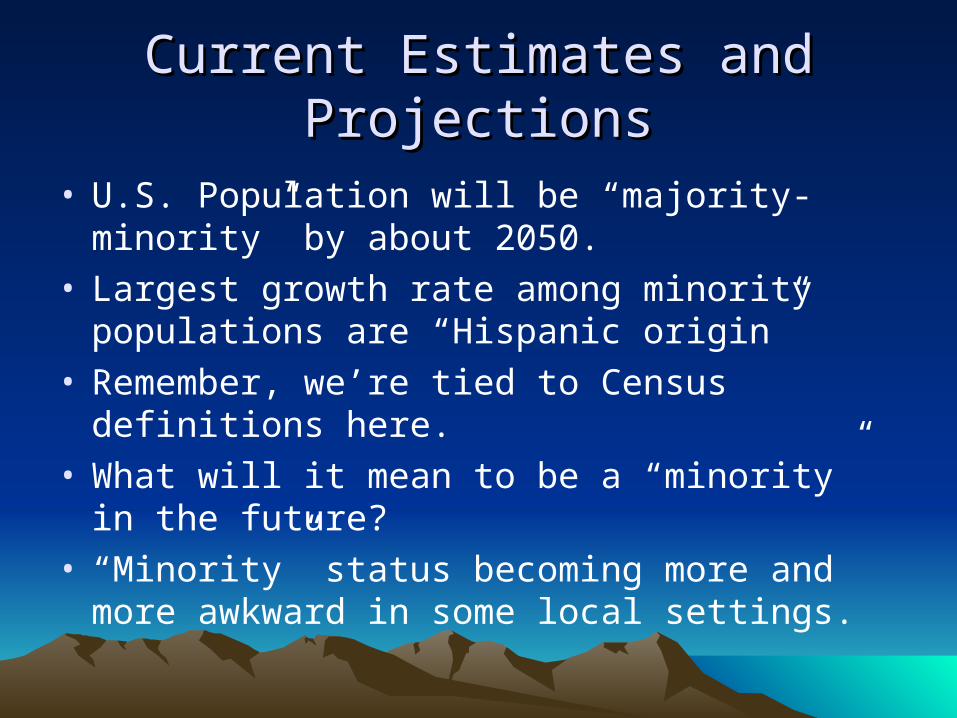
Current Estimates and ProjectionsCurrent Estimates and Projections
• U.S. Population will be “majority-minority” by about 2050.
• Largest growth rate among minority populations are “Hispanic origin”
• Remember, we’re tied to Census definitions here.
• What will it mean to be a “minority” in the future? • “Minority” status becoming more and more
awkward in some local settings.
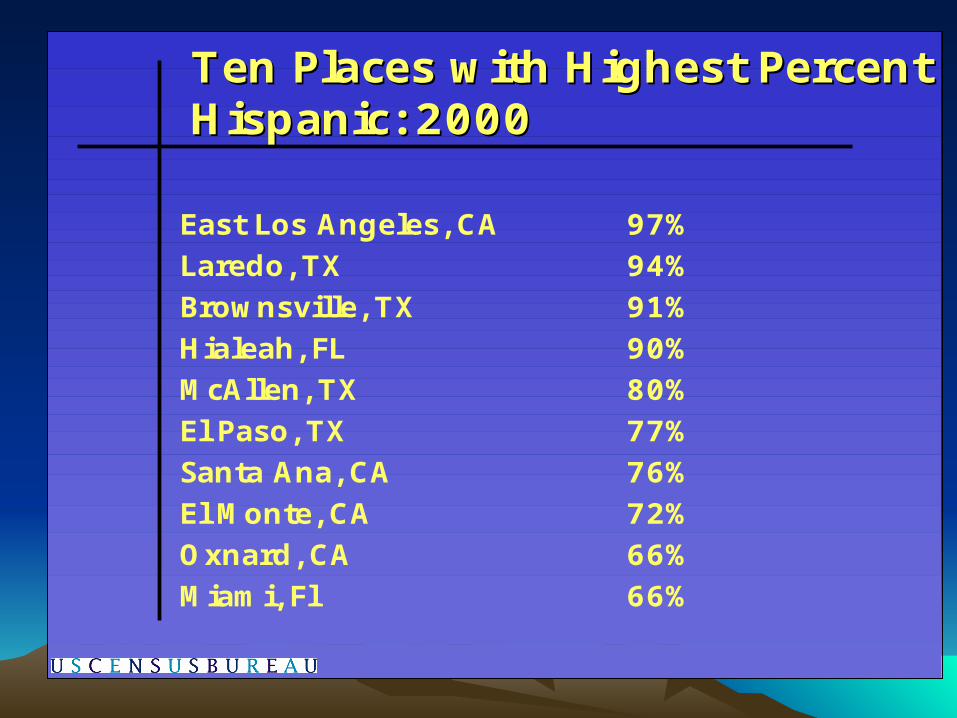
Ten Places with Highest Percent Ten Places with Highest Percent Hispanic: 2000Hispanic: 2000
East Los Angeles, CA 97%Laredo, TX 94%Brownsville, TX 91%Hialeah, FL 90%McAllen, TX 80%El Paso, TX 77%Santa Ana, CA 76%El Monte, CA 72%Oxnard, CA 66%Miami, Fl 66%

Predicted Population of US
0.0
10.0
20.0
30.0
40.0
50.0
60.0
70.0
80.0
90.0
2000 2010 2020 2030 2040 2050
Year
Per
cen
t o
f T
ota
l P
op
.
White Alone Black Alone Asian Alone
Hispanic (of any race) White, non-Hispanic All other races
Population Estimates: US Census BureauPopulation Estimates: US Census Bureau

More Clips for Thought from the More Clips for Thought from the 2008 Primary Season2008 Primary Season
• Ron Paul: http://www.youtube.com/watch?v=2T-iJKwskH4
• Bi-Partisan Attack Ad: http://www.youtube.com/watch?v=Qiw85f5fYGY

Percent Distribution of HispanicsPercent Distribution of Hispanicsby Type: 2006by Type: 2006
Source: Current Population Survey, Annual Social and Economic Supplement 2006
Puerto Rican8.6% Cuban
3.7%
Central American8.2%
South American6.0%
Other Hispanic8.0%
Mexican65.5%
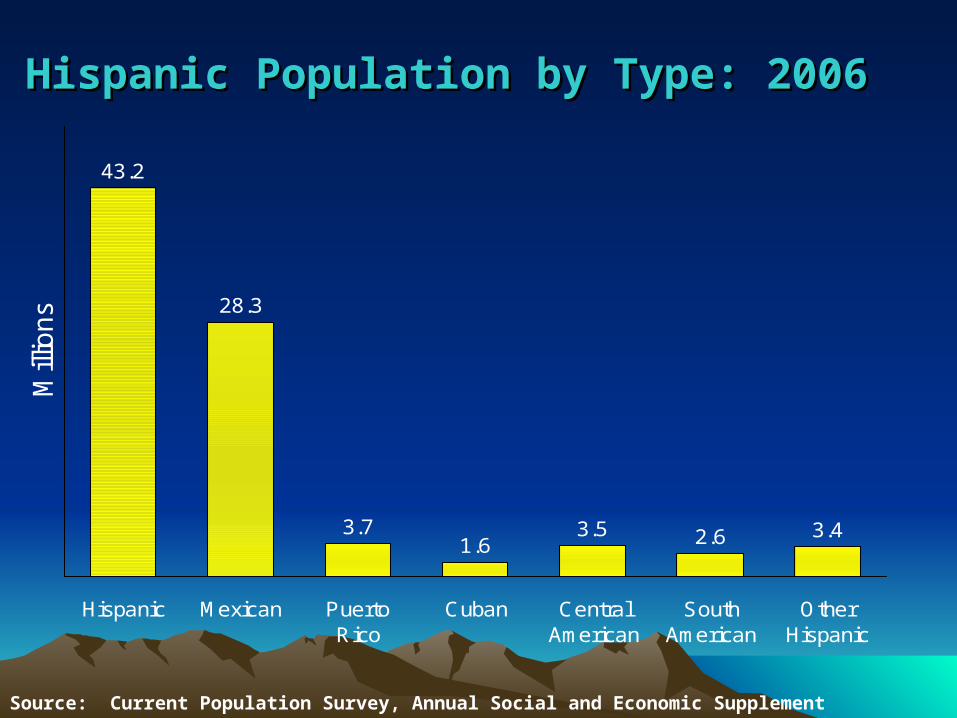
Hispanic Population by Type: 2006Hispanic Population by Type: 2006
43.2
28.3
3.71.6
3.5 2.6 3.4
Hispanic Mexican PuertoRico
Cuban CentralAmerican
SouthAmerican
OtherHispanic
Mill
ion
s
Source: Current Population Survey, Annual Social and Economic Supplement 2006

Nativity by Type of Hispanic Origin: 2006Nativity by Type of Hispanic Origin: 2006
87.9
60.1
31.3
68.4
0.6
61.868.8
31.238.2
99.4
61.4
31.638.6
68.7
39.9
12.1
Total Hispanic Mexican PuertoRican
Cuban CentralAmerican
SouthAmerican
OtherHispanic
Per
cent
Native Foreign Born
Source: Current Population Survey, Annual Social and Economic Supplement 2006

Implications of NativityImplications of Nativity
• The majority of “Hispanics” (that the Census counts) are native born.
• But again, we are tied to the Census counts.
• Who might the Census not count? • By the way, why might we care about
these numbers, politically? • Especially if the population is becoming
more geographically dispersed.
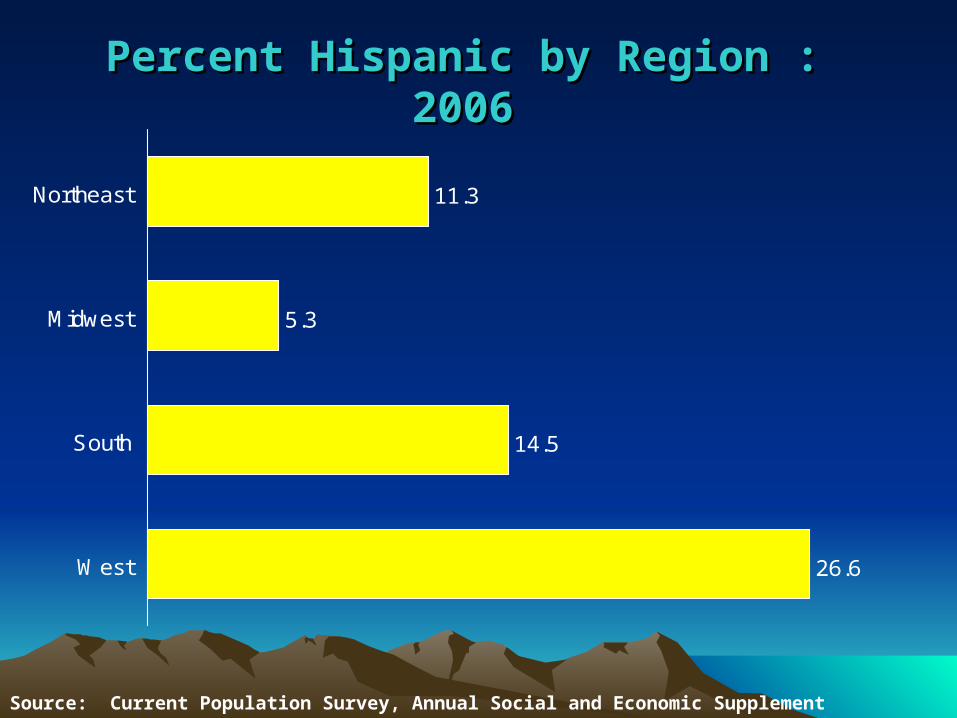
Percent Hispanic by Region : 2006Percent Hispanic by Region : 2006
Source: Current Population Survey, Annual Social and Economic Supplement 2006
26.6
14.5
5.3
11.3
West
South
Midwest
Northeast
This not just a This not just a Western/Southwestern “Issue”Western/Southwestern “Issue”
• Of course, what is the issue? – Immigration?– Jobs? – Health Care?
• Given demographic shifts, it is not surprising to observe importance of immigration debate.

Clips for ThoughtClips for Thought
• Humorous Clip (not meaning to pick on the President!)
• http://www.youtube.com/watch?v=sBskbZ9Pl6A
• Manassas Controversy
• http://www.youtube.com/watch?v=_9rnC9UZhV0&feature=related
Some Data Some Data
• Let’s take a look at population change:
• http://www.censusscope.org/us/map_hispanicpop.html
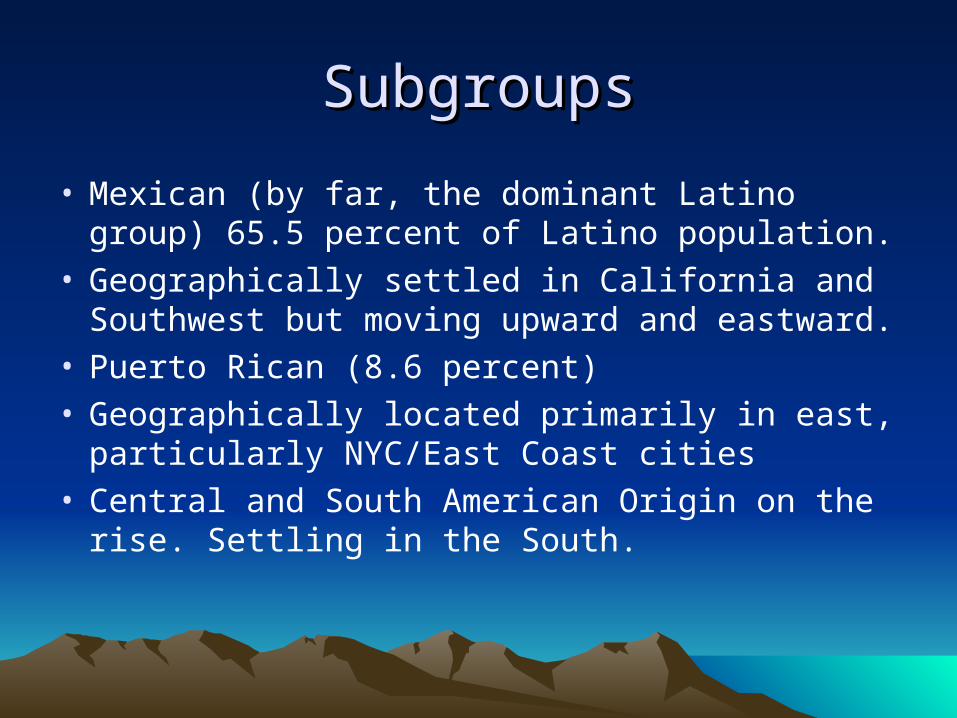
SubgroupsSubgroups
• Mexican (by far, the dominant Latino group) 65.5 percent of Latino population.
• Geographically settled in California and Southwest but moving upward and eastward.
• Puerto Rican (8.6 percent)• Geographically located primarily in east,
particularly NYC/East Coast cities• Central and South American Origin on the rise.
Settling in the South.

““Factoids” about the Mexican Factoids” about the Mexican PopulationPopulation
• 70 Percent of Californian Mexican Population are U.S. Citizens
• Implications?
• Mobilization?
• Immigration and Undocumented Migration
• Consider some data.

Immigration FlowsImmigration Flows
Annualized Immigration into U.S. (Pew Estimates, 2005)
0
200
400
600
800
1000
1200
1400
1600
1800
1992 1993 1994 1995 1996 1997 1998 1999 2000 2001 2002 2003 2004
Year
An
nu
al Im
mig
rati
on
(in
000
s)

Percentage of Average Annualized Immigration(Pew Estimates, 2005)
0
5
10
15
20
25
30
35
40
1992 1993 1994 1995 1996 1997 1998 1999 2000 2001 2002 2003 2004
Year
Per
cen
tag
e
Mexican
Other LatinAmericanOtherAsian

Unauthorized Migrants Living in U.S. (Pew Estimates, 2005)
3.9
5
8.4
10.3
0
2
4
6
8
10
12
1992 1996 2000 2004
Year
Nu
mb
er (
in M
illio
ns)
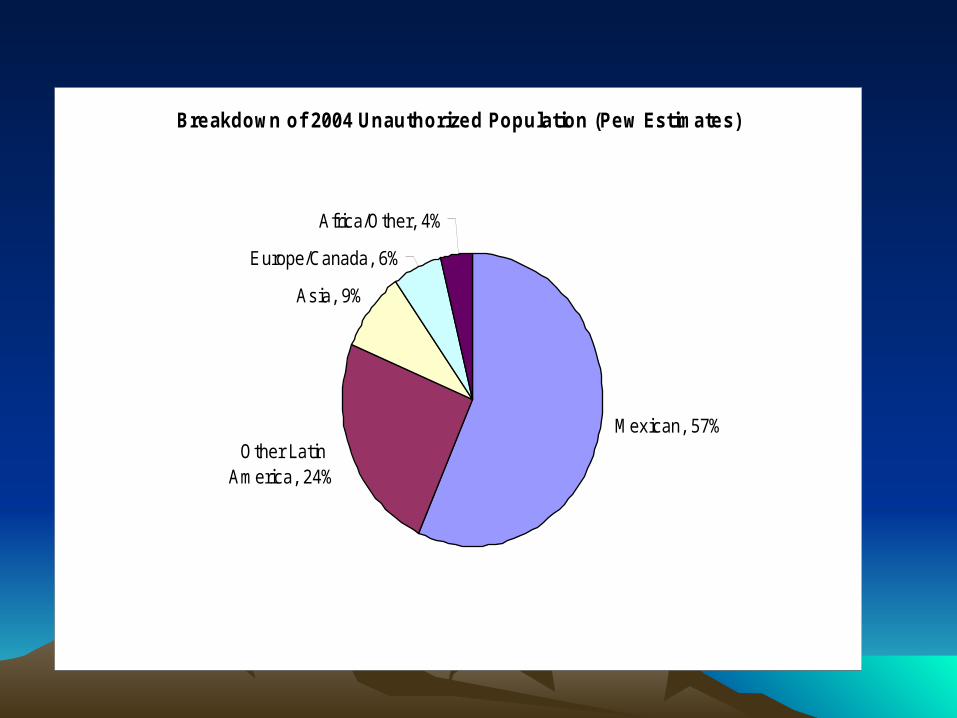
Breakdown of 2004 Unauthorized Population (Pew Estimates)
Other LatinAmerica, 24%
Asia, 9%
Europe/Canada, 6%
Africa/Other, 4%
Mexican, 57%

OTMOTM
• Census Category: Other than Mexican
• Used to demarcate individuals other than Mexican
• Some data…

Mexican and “OTM” ApprehensionsMexican and “OTM” Apprehensions
Deportable Aliens Apprehended in U.S.: Total and Mexican
0
200000
400000
600000
800000
1000000
1200000
1400000
1600000
1800000
2000000
1997 1998 1999 2000 2001 2002 2003 2004
Fiscal YearSource: Dept. of Homeland Security
Nu
mb
er A
pp
reh
end
ed
(i
n M
illio
ns
)
TotalMexican
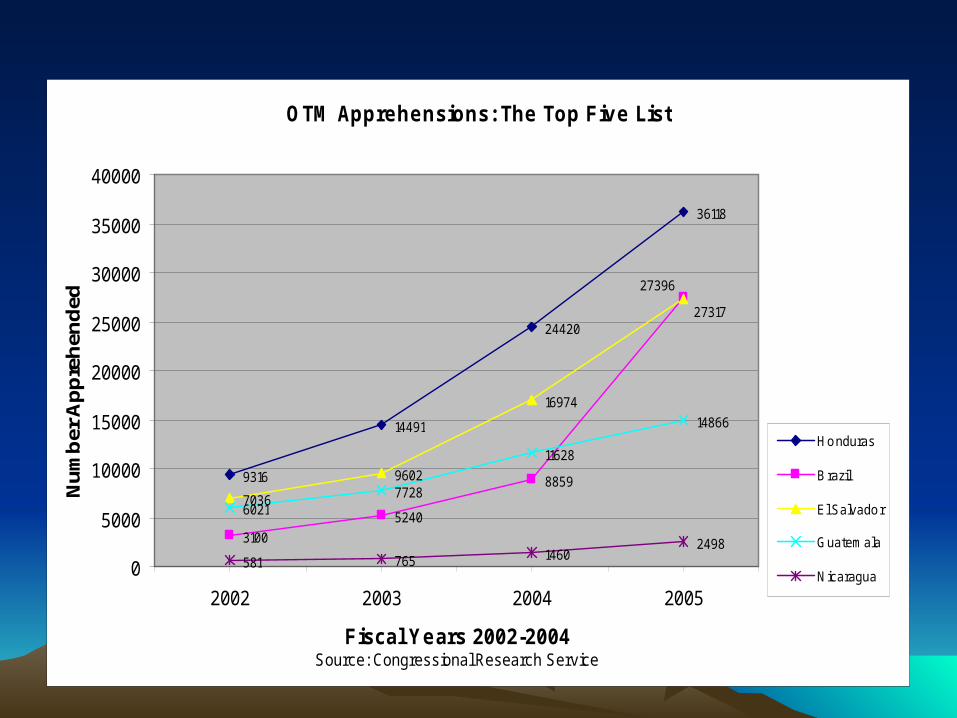
OTM Apprehensions: The Top Five List
9316
14491
24420
36118
31005240
88597036
9602
16974
60217728
11628
14866
581 765 14602498
27396
27317
0
5000
10000
15000
20000
25000
30000
35000
40000
2002 2003 2004 2005
Fiscal Years 2002-2004Source: Congressional Research Service
Nu
mb
er A
pp
reh
end
ed
Honduras
Brazil
El Salvador
Guatemala
Nicaragua

ContextContext
• What do all these data mean?
• Widely dispersed population
• From widely dispersed areas
• Potential impact in the 2008 election?
• …and beyond? (Redistricting, local elections, etc.)