point-cloud compression for vehicle-based mobile …
TRANSCRIPT

POINT-CLOUD COMPRESSION FOR VEHICLE-BASED MOBILE MAPPING SYSTEMS USING PORTABLE NETWORK GRAPHICS
K. Kohira a, H. Masuda a, *
a Dept. of Mechanical Engineering and Intelligent Systems, The University of Electro-Communications, 1-5-1 Chofugaoka, Chofu, Tokyo, Japan - (keisuke.kohira, h.masuda)@uec.ac.jp
Commission VI, WG VI/4
KEY WORDS: Mobile Mapping System, point-clouds, lossless compression
ABSTRACT:
A mobile mapping system is effective for capturing dense point-clouds of roads and roadside objects.Point-clouds of urban areas, residential areas, and arterial roads are useful for maintenance of infrastructure, map creation, and automatic driving. However, the data size of point-clouds measured in large areas is enormously large. A large storage capacity is required to store such point-clouds, and heavy loads will be taken on network if point-clouds are transferred through the network. Therefore, it is desirable to reduce data sizes of point-clouds without deterioration of quality. In this research, we propose a novel point-cloud compression method for vehicle-based mobile mapping systems. In our compression method, point-clouds are mapped onto 2D pixels using GPS time and the parameters of the laser scanner. Then, the images are encoded in the Portable Networking Graphics (PNG) format and compressed using the PNG algorithm. In our experiments, our method could efficiently compress point-clouds without deteriorating the quality.
1. INTRODUCTION
The vehicle-based mobile mapping system (MMS) is effective for capturing 3D shapes of roads, buildings, and roadside objects. Figure 1 shows an MMS, on which laser scanners, cameras, GPSs and IMU are mounted. The MMS captures point-clouds using laser scanners while running. Point-clouds of urban areas, residential areas, and arterial roads are useful for maintenance of infrastructure, map creation, automatic driving, computer graphics, and so on.
When high-performance laser scanners are installed on the MMS, the data size of point-clouds becomes very enormous. In recent years, the performance of laser scanners has been greatly improved. For example, the maximum data acquisition rate of the Z+F Profiler 9012 is 1.016 million measurements per second, and the one of the RIEGL VQ 450 is 0.55 million measurements per second. When the MMS with a high-performance laser scanner runs over a long distance, billions of points are captured in one day. While dense point-clouds maintain rich 3D information, the data volume often becomes extraordinary large. Many hard disks are required to store large-scale data, and it takes a long time to load the data from hard disks on RAM.
In order to reduce the storage capacity and shorten loading time for big data, data compression techniques are very important. Data compression reduces data sizes by encoding measured data in fewer bits.
In laser scanning, effective digits of 3D coordinates can be reduced according to the measurement accuracy of the MMS. In most cases, it is sufficient to record 3D coordinates up to 1 mm. However, even if the number of significant digits is reduced, the data size is still very large. Therefore, it is necessary to further reduce the data size of point-clouds using coherency among coordinates. 1
* Corresponding author
Several point-cloud compression methods have been proposed so far. There are three typical types of compression methods for point-clouds.
The first type of method is based on coherency between consecutive points. LASZIP proposed by (Isenburg, 2013) has been widely used to compress LiDAR data. This method compressed organized points based on the observation that coordinates of consecutive points are similar. However, it does not use adjacency relationships on 2D space in cases of MMS data. (He, et al. 2012) also compressed MMS data by encoding consecutive points as second order differences.
The second type of method is space partition for unorganized points. Most space partition methods for point-clouds are based on the octree or the k-d tree. The both methods recursively subdivide three-dimensional space and creates hierarchical structure of points. In octree-based methods, (Peng et al., 2003) and (Huang et al., 2006) proposed progressive lossless mesh encoders. (Kammerl et al., 2012) compressed unordered point-cloud streams by encoding differences between voxels. (Elseberg et al., 2013) proposed octree-based data structure to
Figure 1. Mobile mapping system
ISPRS Annals of the Photogrammetry, Remote Sensing and Spatial Information Sciences, Volume IV-2/W4, 2017 ISPRS Geospatial Week 2017, 18–22 September 2017, Wuhan, China
This contribution has been peer-reviewed. The double-blind peer-review was conducted on the basis of the full paper. https://doi.org/10.5194/isprs-annals-IV-2-W4-99-2017 | © Authors 2017. CC BY 4.0 License. 99

handle large points captured by terrestrial laser scanners. (Hornung et al., 2013) proposed an octree map compression method using probabilistic occupancy estimation. In kd-tree based methods, (Gandoin et al., 2002) proposed a progressive connectivity-coding algorithm using the kd-tree geometric coder proposed by (Devillers et al., 2000). (Hubo et al., 2006) proposed the Quantized kd-tree, in which points were encoded using quantized split-plane positions. The third type of method is based on 2D images for organized points. If 3D points can be mapped on a 2D lattice image, point-clouds would be more efficiently encoded. In terrestrial laser scanning, it is well-known that a point-cloud can be mapped on a 2D panoramic image if the scanner position is fixed. Even in mobile mapping, some researchers converted points into images for specific laser scanners. (Houshiar, 2015) mapped point-clouds captured at the fixed positions onto panoramic depth images, and encoded depth images using an image compression method. For MMS data, (Kaess et al., 2003) proposed a compression method for laser scanners that emit laser beams line by line, such as the SICK LMS series. They aligned scan lines in a lattice manner, and compressed them using an image compression method. (Masuda et al., 2015) also proposed a scan-line based compression method, in which a sequence of points was encoded using the second-order differences. (Tu et al., 2016) compressed raw point data of the Velodyne HDL-64S2, which emits 64 laser beams simultaneously. They converted a set of 64 scan lines into a panoramic image and applied compression methods for images and videos. However, these methods for mobile mapping data were developed only for specific types of laser scanners. A majority of laser scanners for MMSs, such as RIEGL VX and Z+F Profiler series, continuously emit laser beams in a spiral manner, as shown in Figure 2. In conventional methods, it is difficult to efficiently compress MMS data captured by these popular laser scanners. In this paper, we propose a novel image-based compression method for point-clouds captured by MMSs. Our main contribution is a novel compression framework for spiral-type laser scanners, and a novel image-based compression method for MMS data. In our method, point-clouds are projected onto a 2D lattice using GPS times and laser scanner parameters. Then, we segment point-clouds on the 2D lattice into groups of neighbor points, and compress each group of points using the Portable Network Graphics (PNG). Our method can compress point-clouds captured by MMSs without deteriorating the quality.
2. MAPPING POINT-CLOUDS ONTO 2D IMAGES
2.1 Mapping 3D Points on 2D Lattice
Point-clouds captured by MMSs do not maintain explicit 2D lattice structure, while point-clouds captured by TLSs can be easily converted to panoramic images. Therefore, we first consider a method for mapping point-clouds onto 2D images by assigning the pulse number and the rotation number to each point. In spiral-type laser scanners, laser beams are continuously emitted, as shown in Figure 2. Points are measured at the equal time interval. We suppose that point-clouds include (𝑥, 𝑦, 𝑧) coordinates, intensity values, and GPS times. A GPS time indicates when the point was captured. RGB colors are often added to points in post processing, but we do not discuss RGB colour attributes in this paper, because compression of RGB
colours is trivial. Since point-clouds are converted into images in our method, RGB colours can be simply compressed using any image compression method. In this paper, let {𝑝!} be the sequence of points, 𝑡𝑖 be the elapsed time from the start of laser scanning until point 𝑝𝑖 is measured. We also denote the rotation frequency of the laser scanner as 𝑓, and the pulse repetition frequency of the laser scanner as 𝜔. The rotation frequency is the number of rotations
Figure 2. Trajectory of the laser beams
Figure 3. Neighbour points on scan-lines
Figure 4. The rotation number
Figure 5. The phase number
ISPRS Annals of the Photogrammetry, Remote Sensing and Spatial Information Sciences, Volume IV-2/W4, 2017 ISPRS Geospatial Week 2017, 18–22 September 2017, Wuhan, China
This contribution has been peer-reviewed. The double-blind peer-review was conducted on the basis of the full paper. https://doi.org/10.5194/isprs-annals-IV-2-W4-99-2017 | © Authors 2017. CC BY 4.0 License.
100
of laser beams per second, and the pulse repetition frequency is the number of measurements per 1/𝑓 second. Since the laser beam rotates once in 1/𝑓 second, we subdivide a point-cloud every 1/𝑓 second. We call each segment as a scan-line. As shown in Figure 3, neighbour points on the next scan-line are captured 1/𝑓 second later. In order to map a point-cloud on a 2D image, we assign the phase number and the rotation number to each point. The rotation number is the sequential number of scan-lines, as shown in Figure 4. Points on the same scan-line have the same rotation number. The rotation number of point pi can be calculated as:
𝐽! = INT(𝑓 ∙ 𝑡!) (1) INT(𝑥) is the function that returns the integer part of 𝑥. The phase number 𝐼𝑖 indicates the sequential order of point p! on the scan-line. Figure 5 shows the phase numbers. Points with the same phase number are ordered on the same column. The phase number can be calculated as:
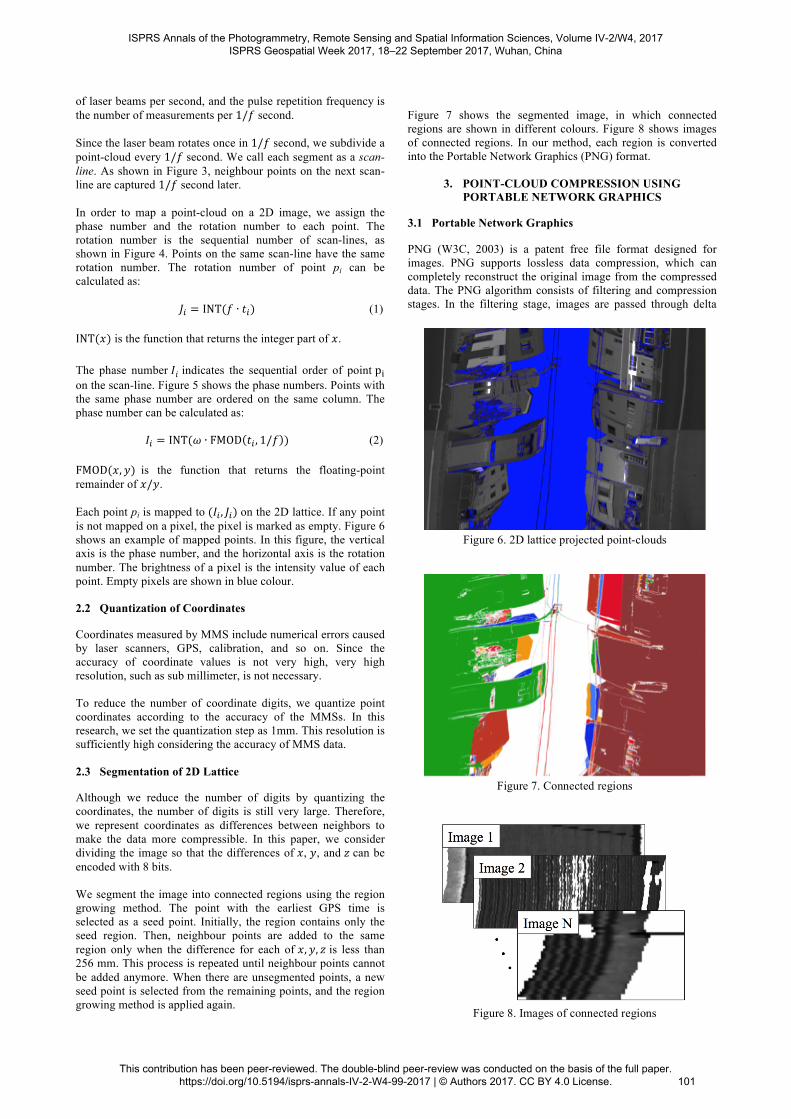
𝐼! = INT(𝜔 ∙ FMOD 𝑡! , 1/𝑓 ) (2) FMOD(𝑥, 𝑦) is the function that returns the floating-point remainder of 𝑥/𝑦. Each point pi is mapped to (𝐼! , 𝐽!) on the 2D lattice. If any point is not mapped on a pixel, the pixel is marked as empty. Figure 6 shows an example of mapped points. In this figure, the vertical axis is the phase number, and the horizontal axis is the rotation number. The brightness of a pixel is the intensity value of each point. Empty pixels are shown in blue colour. 2.2 Quantization of Coordinates
Coordinates measured by MMS include numerical errors caused by laser scanners, GPS, calibration, and so on. Since the accuracy of coordinate values is not very high, very high resolution, such as sub millimeter, is not necessary. To reduce the number of coordinate digits, we quantize point coordinates according to the accuracy of the MMSs. In this research, we set the quantization step as 1mm. This resolution is sufficiently high considering the accuracy of MMS data. 2.3 Segmentation of 2D Lattice
Although we reduce the number of digits by quantizing the coordinates, the number of digits is still very large. Therefore, we represent coordinates as differences between neighbors to make the data more compressible. In this paper, we consider dividing the image so that the differences of 𝑥, 𝑦, and 𝑧 can be encoded with 8 bits. We segment the image into connected regions using the region growing method. The point with the earliest GPS time is selected as a seed point. Initially, the region contains only the seed region. Then, neighbour points are added to the same region only when the difference for each of 𝑥, 𝑦, 𝑧 is less than 256 mm. This process is repeated until neighbour points cannot be added anymore. When there are unsegmented points, a new seed point is selected from the remaining points, and the region growing method is applied again.
Figure 7 shows the segmented image, in which connected regions are shown in different colours. Figure 8 shows images of connected regions. In our method, each region is converted into the Portable Network Graphics (PNG) format.
3. POINT-CLOUD COMPRESSION USING PORTABLE NETWORK GRAPHICS
3.1 Portable Network Graphics
PNG (W3C, 2003) is a patent free file format designed for images. PNG supports lossless data compression, which can completely reconstruct the original image from the compressed data. The PNG algorithm consists of filtering and compression stages. In the filtering stage, images are passed through delta
Figure 6. 2D lattice projected point-clouds
Figure 7. Connected regions
Figure 8. Images of connected regions
ISPRS Annals of the Photogrammetry, Remote Sensing and Spatial Information Sciences, Volume IV-2/W4, 2017 ISPRS Geospatial Week 2017, 18–22 September 2017, Wuhan, China
This contribution has been peer-reviewed. The double-blind peer-review was conducted on the basis of the full paper. https://doi.org/10.5194/isprs-annals-IV-2-W4-99-2017 | © Authors 2017. CC BY 4.0 License.
101
filtering to make the image compressible. In the compression stage, Deflate algorithm (Deutsch, 1996) is applied to the filtered byte sequences. In this compression algorithm, LZ77 cording (Ziv et al., 1977) and Huffman cording are combined. The PNG format supports several types of images. We use the PNG format for RGB images with alpha channels to encode point-clouds. 3.2 Differences of Coordinates
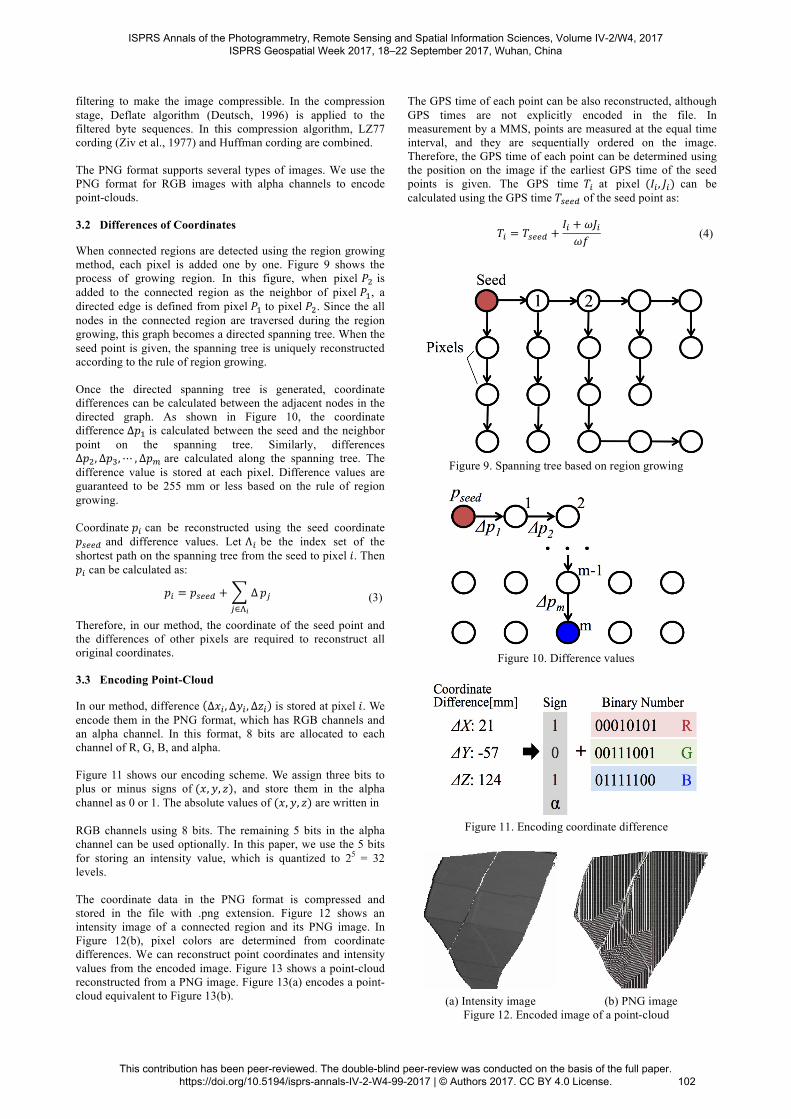
When connected regions are detected using the region growing method, each pixel is added one by one. Figure 9 shows the process of growing region. In this figure, when pixel 𝑃! is added to the connected region as the neighbor of pixel 𝑃!, a directed edge is defined from pixel 𝑃! to pixel 𝑃!. Since the all nodes in the connected region are traversed during the region growing, this graph becomes a directed spanning tree. When the seed point is given, the spanning tree is uniquely reconstructed according to the rule of region growing. Once the directed spanning tree is generated, coordinate differences can be calculated between the adjacent nodes in the directed graph. As shown in Figure 10, the coordinate difference ∆𝑝! is calculated between the seed and the neighbor point on the spanning tree. Similarly, differences ∆𝑝!,∆𝑝!,⋯ ,∆𝑝! are calculated along the spanning tree. The difference value is stored at each pixel. Difference values are guaranteed to be 255 mm or less based on the rule of region growing. Coordinate 𝑝! can be reconstructed using the seed coordinate 𝑝!""# and difference values. Let Λ! be the index set of the shortest path on the spanning tree from the seed to pixel 𝑖. Then 𝑝! can be calculated as:
𝑝! = 𝑝!""# + ∆!∈!!
𝑝! (3)
Therefore, in our method, the coordinate of the seed point and the differences of other pixels are required to reconstruct all original coordinates. 3.3 Encoding Point-Cloud
In our method, difference Δ𝑥! ,Δ𝑦! ,Δ𝑧! is stored at pixel 𝑖. We encode them in the PNG format, which has RGB channels and an alpha channel. In this format, 8 bits are allocated to each channel of R, G, B, and alpha. Figure 11 shows our encoding scheme. We assign three bits to plus or minus signs of (𝑥, 𝑦, 𝑧), and store them in the alpha channel as 0 or 1. The absolute values of (𝑥, 𝑦, 𝑧) are written in RGB channels using 8 bits. The remaining 5 bits in the alpha channel can be used optionally. In this paper, we use the 5 bits for storing an intensity value, which is quantized to 25 = 32 levels. The coordinate data in the PNG format is compressed and stored in the file with .png extension. Figure 12 shows an intensity image of a connected region and its PNG image. In Figure 12(b), pixel colors are determined from coordinate differences. We can reconstruct point coordinates and intensity values from the encoded image. Figure 13 shows a point-cloud reconstructed from a PNG image. Figure 13(a) encodes a point-cloud equivalent to Figure 13(b).
The GPS time of each point can be also reconstructed, although GPS times are not explicitly encoded in the file. In measurement by a MMS, points are measured at the equal time interval, and they are sequentially ordered on the image. Therefore, the GPS time of each point can be determined using the position on the image if the earliest GPS time of the seed points is given. The GPS time 𝑇! at pixel (𝐼! , 𝐽!) can be calculated using the GPS time 𝑇!""# of the seed point as:
𝑇! = 𝑇!""# +𝐼! + 𝜔𝐽!𝜔𝑓
(4)
Figure 9. Spanning tree based on region growing
Figure 10. Difference values
Figure 11. Encoding coordinate difference
(a) Intensity image (b) PNG image
Figure 12. Encoded image of a point-cloud
ISPRS Annals of the Photogrammetry, Remote Sensing and Spatial Information Sciences, Volume IV-2/W4, 2017 ISPRS Geospatial Week 2017, 18–22 September 2017, Wuhan, China
This contribution has been peer-reviewed. The double-blind peer-review was conducted on the basis of the full paper. https://doi.org/10.5194/isprs-annals-IV-2-W4-99-2017 | © Authors 2017. CC BY 4.0 License.
102

In our method, the coordinate and GPS time of the seed are required to reconstruct the original coordinates and GPS times. In our implementation, these values are stored as the file name of compressed data. 3.4 Encoding Fragmented Regions
In our method, each connected region is compressed as a PNG file. When an image is segmented into connected regions, large regions are generated from buildings, roads, and roadside objects. On the other hand, small fragmented regions are also generated from tree leaves, cables, and noises. In Figure 14, while a large connected region is generated from a building, many fragmented regions are generated from an electric cable. In our method, while the compression efficiency for large regions is very high, the efficiency is poor for fragmented regions with few points. Therefore, we compress only large regions by the PNG algorithm. In this paper, we regard regions with 5 or less points as fragmented regions. In Figure 15, fragmented regions are shown in red colour. In residential areas, fragmented regions are mainly generated from cables and trees. Table 1 shows ratios of points in fragmented regions for point-clouds A and B in Figure 16. Since many trees are included in the point-cloud B, more fragmented regions are generated from tree leaves. In both cases, the numbers of points in fragmented regions are very small, because areas of tree leaves and cables are much smaller than ones of roads and building walls, In our method, points in fragmented regions are separately encoded without using the PNG algorithm. In this paper, we simply encode points in fragmented regions in a binary format without compression, because the number of points in fragmented regions is relatively very small.
4. EXPERIMANTAL RESULTS
We evaluated our compression method using two datasets A and B, which were measured in a residential district in Japan using Mitsubishi Electric MMS Type X. The mounted laser scanner was Z+F Profiler 9012. As shown in Figure 16, point-clouds A and B include houses, roads, utility poles, and so on. Point-cloud B also includes many trees, and therefore a lot of fragmented regions are generated from dataset B. The numbers of points are 9.79 million in point-cloud A, and 6.54 million in point-cloud B. For data compression, we used a PC with 3.1 GHz Intel core i5 CPU and 16 GB RAM. We compared our method with the scan-line based compression
ASCII Binary Scan-Line Based
Our Method
Size 552.4 MB 319.5 MB 30.1 MB 23.0 MB
Ratio 100 % 57.8 % 5.4 % 4.2 % Table 2. Compression results of point-cloud A
ASCII Binary Scan-Line Based
Our Method
Size 367.6 MB 213.2 MB 24.1 MB 18.4 MB
Ratio 100 % 58.0 % 6.6 % 5.0 % Table 3. Compression results of point-cloud B
(a) PNG image
(b) Points
Figure 13. Image and points representing the same object
(a) Large region (b) Fragmented region
Figure 14. Sizes of connected regions
(a) Electric cable (b) Tree leaves
Figure 15. Fragmented regions
Number of Points
Large Regions Fragmented Region Data A 9,762,923 (99.7%) 30,365 (0.3%)
Data B 6,448,844 (98.7%) 86,445 (1.3%) Table 1. Number of points in large and fragmented regions
ISPRS Annals of the Photogrammetry, Remote Sensing and Spatial Information Sciences, Volume IV-2/W4, 2017 ISPRS Geospatial Week 2017, 18–22 September 2017, Wuhan, China
This contribution has been peer-reviewed. The double-blind peer-review was conducted on the basis of the full paper. https://doi.org/10.5194/isprs-annals-IV-2-W4-99-2017 | © Authors 2017. CC BY 4.0 License.
103
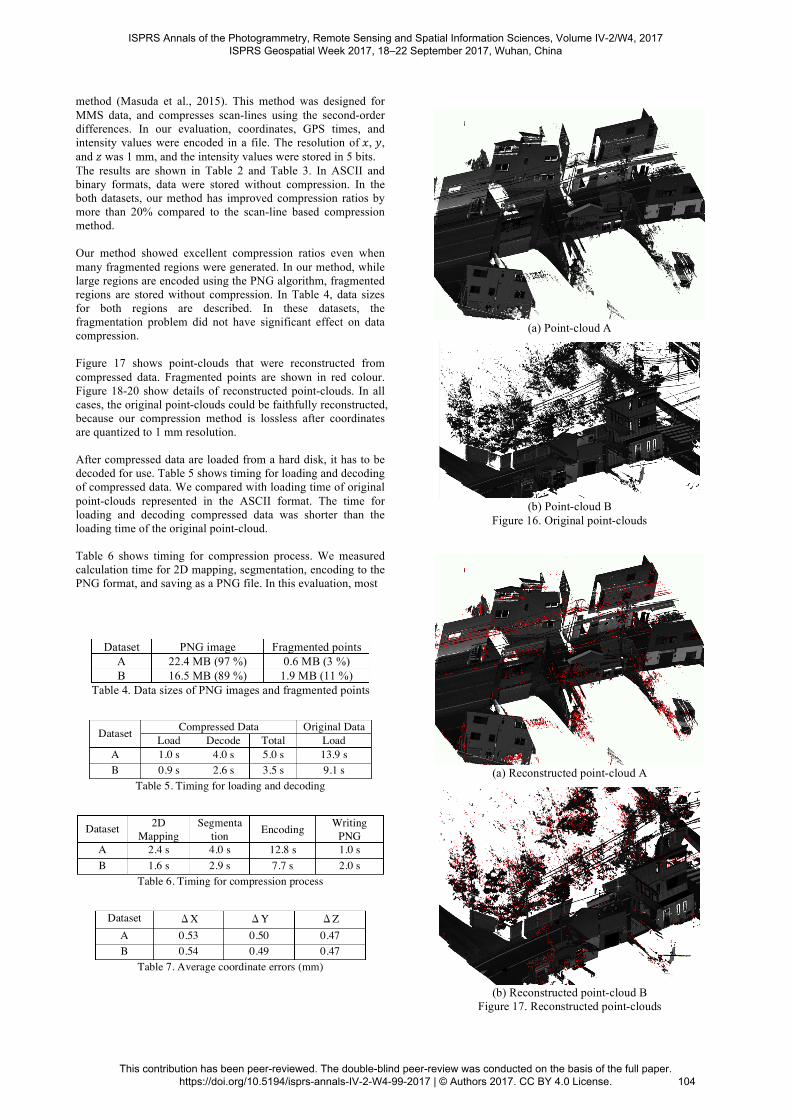
method (Masuda et al., 2015). This method was designed for MMS data, and compresses scan-lines using the second-order differences. In our evaluation, coordinates, GPS times, and intensity values were encoded in a file. The resolution of 𝑥, 𝑦, and 𝑧 was 1 mm, and the intensity values were stored in 5 bits. The results are shown in Table 2 and Table 3. In ASCII and binary formats, data were stored without compression. In the both datasets, our method has improved compression ratios by more than 20% compared to the scan-line based compression method. Our method showed excellent compression ratios even when many fragmented regions were generated. In our method, while large regions are encoded using the PNG algorithm, fragmented regions are stored without compression. In Table 4, data sizes for both regions are described. In these datasets, the fragmentation problem did not have significant effect on data compression. Figure 17 shows point-clouds that were reconstructed from compressed data. Fragmented points are shown in red colour. Figure 18-20 show details of reconstructed point-clouds. In all cases, the original point-clouds could be faithfully reconstructed, because our compression method is lossless after coordinates are quantized to 1 mm resolution. After compressed data are loaded from a hard disk, it has to be decoded for use. Table 5 shows timing for loading and decoding of compressed data. We compared with loading time of original point-clouds represented in the ASCII format. The time for loading and decoding compressed data was shorter than the loading time of the original point-cloud. Table 6 shows timing for compression process. We measured calculation time for 2D mapping, segmentation, encoding to the PNG format, and saving as a PNG file. In this evaluation, most
(a) Point-cloud A
(b) Point-cloud B
Figure 16. Original point-clouds
(a) Reconstructed point-cloud A
(b) Reconstructed point-cloud B
Figure 17. Reconstructed point-clouds
Dataset PNG image Fragmented points
A 22.4 MB (97 %) 0.6 MB (3 %) B 16.5 MB (89 %) 1.9 MB (11 %)
Table 4. Data sizes of PNG images and fragmented points
Dataset Compressed Data Original Data Load Decode Total Load
A 1.0 s 4.0 s 5.0 s 13.9 s B 0.9 s 2.6 s 3.5 s 9.1 s
Table 5. Timing for loading and decoding
Dataset 2D Mapping
Segmentation Encoding Writing
PNG A 2.4 s 4.0 s 12.8 s 1.0 s B 1.6 s 2.9 s 7.7 s 2.0 s
Table 6. Timing for compression process
Dataset ΔX ΔY ΔZ
A 0.53 0.50 0.47 B 0.54 0.49 0.47
Table 7. Average coordinate errors (mm)
ISPRS Annals of the Photogrammetry, Remote Sensing and Spatial Information Sciences, Volume IV-2/W4, 2017 ISPRS Geospatial Week 2017, 18–22 September 2017, Wuhan, China
This contribution has been peer-reviewed. The double-blind peer-review was conducted on the basis of the full paper. https://doi.org/10.5194/isprs-annals-IV-2-W4-99-2017 | © Authors 2017. CC BY 4.0 License.
104

computation time was used for segmentation and encoding processes. The total computation time is 20.2 sec for point-cloud A, and 14.2 sec for point-cloud B. In our method, coordinates are quantized to 1 mm resolution. Table 7 shows the average distance errors between the original points without quantization and the reconstructed points. In the both datasets, the average distance errors were about 0.5 mm. Considering the measurement accuracy of MMSs, the resolution of reconstructed point-clouds are sufficient.
5. CONCLUSION
We proposed a novel compression method for point-clouds captured by a vehicle-based mobile mapping system. In our method, point-clouds were projected onto pixels of an image using the rotation number and the phase number, and the image was segmented into connected regions. Then points in each connected region were encoded to the PNG format, and compressed using the PNG algorithm. In our experiments, our method could achieve better compression ratios compared to the scan-based compression method. In future work, we would like to improve compression rates. Since there are other lossless compression methods, such as JPEG 2000, we would like to investigate other compression schemes. In our method, it takes time to encode point-clouds. We would like to improve our algorithm to shorten encoding time. Currently, we evaluated our method only in residential areas. We would like to evaluate our method using point-clouds of highways and suburbs.
ACKNOWLEDGEMENTS
MMS data in this paper are courtesy of AISAN Technology Co.Ltd. We would like to thank for their helpful support.
REFERENCES
Devillers, O., Gandoin, P. M., 2000. Geometric compression for interactive transmission. IEEE Visualization 2000. Proceedings, pp. 319-326. Deutsch, L. P., 1996. DEFLATE compressed data format specification version 1.3. RFC Editor. Elseberg, J., Borrmann, D., Nüchter, A., 2013. One billion points in the cloud–an octree for efficient processing of 3D laser scans. ISPRS Journal of Photogrammetry and Remote Sensing, 76, pp. 76-88. Gandoin, P. M., Devillers, O., 2002. Progressive lossless compression of arbitrary simplicial complexes. ACM Transactions on Graphics (TOG), 21(3), pp.372-379. He J., Masuda H., 2012. Reconstruction of Roadways and Walkways Using Point-Clouds from Mobile Mapping System, Asian Conference on Design and Digital Engineering, Article 100099. Hornung, A., Wurm, K. M., Bennewitz, M., Stachniss, C., Burgard, W., 2013. OctoMap: An efficient probabilistic 3D mapping framework based on octrees. Autonomous Robots, 34(3), pp. 189-206.
(a) Original points
(b) Reconstructed points
Figure 18. Points of roads and a car
(a) Original points
(b) Reconstructed points
Figure 19. Points of a traffic sign
(a) Original points
(b) Reconstructed points
Figure 20. Points of electric cables
ISPRS Annals of the Photogrammetry, Remote Sensing and Spatial Information Sciences, Volume IV-2/W4, 2017 ISPRS Geospatial Week 2017, 18–22 September 2017, Wuhan, China
This contribution has been peer-reviewed. The double-blind peer-review was conducted on the basis of the full paper. https://doi.org/10.5194/isprs-annals-IV-2-W4-99-2017 | © Authors 2017. CC BY 4.0 License.
105

Houshiar, H., Nüchter, A., 2015. 3D point cloud compression using conventional image compression for efficient data transmission. Information, Communication and Automation Technologies (ICAT), 2015 XXV International Conference, pp. 1-8. Huang, Y., Peng, J., Kuo, C. C. J., Gopi, M. 2006. Octree-Based Progressive Geometry Coding of Point Clouds. Symposium on Point-Based Graphics pp. 103-110. Hubo, E., Mertens, T., Haber, T., Bekaert, P., 2006. The quantized kd-tree: Efficient ray tracing of compressed point clouds. Interactive Ray Tracing 2006, IEEE Symposium, pp. 105-113. Isenburg, Martin., 2013. Laszip. Photogrammetric Engineering & Remote Sensing 79(2), pp.209-217. Masuda, H., He, J., 2015. TIN generation and point-cloud compression for vehicle-based mobile mapping systems. Advanced Engineering Informatics, 29(4), pp.841-850. Kaess, M., Arkin, R. C., Rossignac, J., 2003. Compact encoding of robot-generated 3D maps for efficient wireless transmission. IEEE Intl. Conf. on Advanced Robotics (ICAR), pp. 324-331. Kammerl, J., Blodow, N., Rusu, R. B., Gedikli, S., Beetz, M., Steinbach, E., 2012. Real-time compression of point cloud streams. Robotics and Automation (ICRA), 2012 IEEE International Conference, pp. 778-785. Peng, J., Kuo, C. J., 2003. Octree-based progressive geometry encoder. ITCom 2003. International Society for Optics and Photonics, pp. 301-311. Tu, C., Takeuchi, E., Miyajima, C., Takeda, K., 2016. Compressing continuous point cloud data using image compression methods. Intelligent Transportation Systems (ITSC), 2016 IEEE 19th International Conference, pp. 1712-1719. W3C., 2003. Portable network graphics (png) specification, http://www.w3.org/TR/PNG/. Ziv, J., Lempel, A., 1977. A universal algorithm for sequential data compression. IEEE Transactions on information theory, 23(3), pp.337-343.
ISPRS Annals of the Photogrammetry, Remote Sensing and Spatial Information Sciences, Volume IV-2/W4, 2017 ISPRS Geospatial Week 2017, 18–22 September 2017, Wuhan, China
This contribution has been peer-reviewed. The double-blind peer-review was conducted on the basis of the full paper. https://doi.org/10.5194/isprs-annals-IV-2-W4-99-2017 | © Authors 2017. CC BY 4.0 License.
106