pocketome via comprehensive identification and classification of
TRANSCRIPT
Pocketome via Comprehensive Identificationand Classification of Ligand BindingEnvelopes*Jianghong An‡, Maxim Totrov§, and Ruben Abagyan‡¶
We developed a new computational algorithm for the ac-curate identification of ligand binding envelopes ratherthan surface binding sites. We performed a large scaleclassification of the identified envelopes according totheir shape and physicochemical properties. The predict-ing algorithm, called PocketFinder, uses a transformationof the Lennard-Jones potential calculated from a three-dimensional protein structure and does not require anyknowledge about a potential ligand molecule. We vali-dated this algorithm using two systematically collecteddata sets of ligand binding pockets from complexed(bound) and uncomplexed (apo) structures from the Pro-tein Data Bank, 5616 and 11,510, respectively. As many as96.8% of experimental binding sites were predicted atbetter than 50% overlap level. Furthermore 95.0% of theasserted sites from the apo receptors were predicted atthe same level. We demonstrate that conformational dif-ferences between the apo and bound pockets do notdramatically affect the prediction results. The algorithmcan be used to predict ligand binding pockets of unchar-acterized protein structures, suggest new allosteric pock-ets, evaluate feasibility of protein-protein interaction inhi-bition, and prioritize molecular targets. Finally the database of the known and predicted binding pockets for thehuman proteome structures, the human pocketome, wascollected and classified. The pocketome can be used forrapid evaluation of possible binding partners of a givenchemical compound. Molecular & Cellular Proteomics4:752–761, 2005.
Prediction of ligand binding sites is a fundamental step inthe investigation of the molecular recognition mechanism andfunction of a protein. An increasing number of protein struc-tures are becoming available from high throughput structuralgenomic projects prior to biological and functional character-ization. Therefore, computational methods to predict ligandbinding sites are becoming increasingly important.
There are three independent sources of information thatcan be used to infer the location of possible ligand bindingsites on the surface of a protein: (i) protein structure, (ii)
evolutionary information (sequence alignments), and (iii) li-gand/substrate information. A number of sophisticated algo-rithms using evolutionary information or algorithms predictinglocations of binding sites for specific substrates have beenpublished (1–3). Here we attempted to develop an algorithmthat is based solely on the protein structure and without anyprior knowledge about the nature of the substrate. We hy-pothesized that the structure itself is sufficiently informative,whereas the evolutionary conservation and the nature of theligand can only be used as optional contributions.
Proteins are involved in several kinds of molecular interac-tions: with other proteins, DNA, RNA, peptides, and smallmolecules. In this study we present an algorithm to predict thebinding envelopes near potential small ligand binding sites orareas that could be targeted with small “druglike” com-pounds. Once the ligand binding pocket is predicted, a highthroughput ligand docking procedure or structure-based drugdesign (4–9) can be used to generate a list of the lead mole-cules. The properties of druglike molecules are well studied(10, 11) and cover a certain range of sizes, typically withmolecular mass between 300 and 700 daltons. Therefore, weexcluded from consideration very small ligands, such as met-als and small solvent molecules, as well as very large sub-strates. However we wanted to develop an algorithm thatwithin this size range does not depend on the nature of theligand.
A number of structure-based pocket prediction algorithmshave been published over the last 10 years. They can bedivided into two general classes: (i) geometric algorithms and(ii) probe mapping/docking algorithms. Geometric ap-proaches analyze protein surfaces to find clefts. SURFNET(12) detects the gap regions in proteins by fitting spheres intothe spaces between protein atoms. The sphere fitting processresults in a number of separate groups of interpenetratingspheres, which correspond to the cavities and clefts of theprotein. LIGSITE (13), an improved version of POCKET (14),identifies clefts by putting the protein in a regular Cartesiangrid and scanning along the x, y, and z axes and the cubicdiagonals for areas that are enclosed on both sides by pro-tein. APROPOS (15) and CAST (16) are based on the �-shapealgorithm, which identifies pockets by comparing surfaces ofthe protein generated with different levels of detail. PASS (17)identifies the “active site points” by coating the protein sur-face with a layer of spherical probes and then filtering out
From the ‡Department of Molecular Biology, The Scripps ResearchInstitute and §Molsoft, LLC, La Jolla, California 92037
Received, October 11, 2004, and in revised form, March 7, 2005Published, MCP Papers in Press, March 9, 2005, DOI 10.1074/
mcp.M400159-MCP200
Research
© 2005 by The American Society for Biochemistry and Molecular Biology, Inc.752 Molecular & Cellular Proteomics 4.6This paper is available on line at http://www.mcponline.org
those that clash with the protein or are not sufficiently buried.In addition to those pure geometrical methods, some ap-proaches based on mapping/docking and scoring of molec-ular fragments have been proposed (18–23). Two excellentrecent reviews of computational tools for identification ofsmall molecule binding sites in proteins give a good overviewof the field (1, 24).
Pure geometric methods are relatively straightforward, butthere is no direct physical meaning behind them. On the otherhand, methods using molecular fragment mapping and liganddocking are better physically justified but computationallyexpensive and cannot always provide a good discriminationbetween correct and incorrect sites. Also the previously pub-lished methods were typically tested on relatively small datasets. Although APROPS used a relatively large test set ofabout 300 structures, others only used 10–50 selected testcases. This is despite the fact that almost 30,000 x-ray struc-tures have been deposited in the Protein Data Bank (25, 26).Finally, because the ultimate goal of the binding site predic-tion methods is to find active sites on uncharacterized struc-tures, it is important to test and validate the algorithms onlarge sets of the “unbound” or apo structures. Only the PASSalgorithm was tested on a data set of 21 apo structures; theother publications did not test the effect of induced confor-mational changes on the prediction accuracy. A benchmarktest based on a large, systematic data set of apo structures isnecessary for evaluating protein-ligand binding site identifica-tion methods.
In this study, we present and validate a novel algorithm forprediction of ligand binding pockets. The algorithm calledPocketFinder is based on a transformation of the Lennard-Jones potential. Like pure geometric approaches, Pocket-Finder is fast and capable of identifying clefts and cavitiesregardless of the nature of the substrate while being moresensitive and specific. Furthermore, in contrast to other meth-ods, the PocketFinder algorithm not only detects the locationof the binding pocket but also predicts envelopes represent-ing the shape and size of putative ligand binding volume. Themethod was tested on a systematically collected data set 2orders of magnitude larger than previous benchmarks: 5,616binding sites collected from ligand-protein complexes and11,510 apo binding sites inferred from the complexes byhomology. All small molecule binding envelopes from thehuman structural proteome were collected and clustered intoa pocketome. The predicted binding envelopes were hierar-chically clustered. The complete pocketome may be useful forunderstanding a complex network of interactions betweensmall molecules and the cell proteins.
MATERIALS AND METHODS
All three-dimensional protein structures were taken from the Oc-tober 3, 2003 Protein Data Bank release. Prior to computation, weremoved all ligands and water molecules from the structure. Protein-ligand binding pockets are predicted based on the grid potential mapof van der Waals interaction of the receptor. To determine the regions
of consistently high van der Waals attraction, the following four-stepprocedure was applied.
Step 1—The first step was to create the grid potential map of thevan der Waals force field using a probe atom (parameters for analiphatic carbon were used) in orthogonal parallelepiped surround-ing receptor atoms (27). The grid had 1.0-Å spacing, and a marginof 1.0 Å beyond the dimensions of the protein was added. Thepotential was calculated according to the Lennard-Jonesformula,
Pp0 � �
l�1
N �AXlC
rpl12 �
BXlC
rpl6 � (Eq. 1)
where rpl is the distance between the probe p placed at a grid nodeand the protein atom Xl. Parameters AXC and BXC are taken from theEmpirical Conformational Energy Program for Peptides (ECEPP)/3molecular mechanics force field. Pp
0 values were further truncated intothe min(Pp
0), �0.8 range to retain only the attractive regions.Step 2—The second step was to smooth (space average) the
potential map to emphasize the regions with the van der Waalspotential consistently low across significant space span and to avoidexcessive density fragmentation. Smoothing was performed by aniterative averaging of the potential Pijk
n on each grid node (i,j,k) withthe adjacent nodes.
Pn�1ijk � �Pn
ijk � �Pni�1jk � Pn
i�1jk � Pnij�1k � Pn
ij�1k � Pnijk�1
� Pnijk�1�/6�/2 (Eq. 2)
Iterative application of this transformation closely approximates a(more computationally expensive) convolution with an averagingfunction.
P�r�� ��f���, r��P 0����d��; f���, r�� � e � ����r�� �2
; � � �23
Niter
(Eq. 3)
Ten iterations were performed, corresponding to the smoothinglength parameter (radius) � of �2.6 Å.
Step 3—The third step was to create putative ligand envelopes bycontouring the resulting map at a level Pcont calculated as follows,
Pcont � mean�Pijk� � � � r.m.s.d.�Pijk� (Eq. 4)
where the threshold parameter � � 4.6 was established on the trainingdata set, mean(Pijk) and r.m.s.d.(Pijk) are an average and a root meansquare difference of all map potential values Pijk.
Step 4—The fourth step was to sort the created envelopes by theirvolumes and filter out those smaller than 100 Å3. All parameters forthe map transformations were optimized using a large, diverse set ofbinding sites. The algorithm was coded with the ICM1 scriptinglanguage (28, 29).
RESULTS
Because our main objective was to develop and validate anaccurate algorithm for predicting protein-ligand binding sites
1 The abbreviations used are: ICM, internal coordinate mechanics;LP-Set, liganded pocket set collected from complexes; UP-Set, un-liganded pocket set collected from apo structures; RO, relative over-lap of predicted patch to the real binding patch; SCOP, StructuralClassification of Proteins; MDM2, ubiquitin-protein ligase e3 mdm2;LFA-1, lymphocyte function associated antigen 1.
Identification and Classification of Ligand Envelopes
Molecular & Cellular Proteomics 4.6 753
to which a typical druglike small molecule may bind, we firststudied the size distribution of known drugs. We then com-piled a comprehensive data base of appropriate protein ligandbinding sites for benchmarking the performance of the pocketprediction algorithm.
Compiling an Exhaustive Benchmark of Ligand BindingSites—We started from the October 30, 2003 release of theProtein Data Bank that contained 17,730 crystallographicstructures of proteins. Then we collected all structures thatare complexed with heteromolecules (tagged by HET key-words in the Protein Data Bank) to compile a data set ofobserved binding sites from protein-ligand complexes (ligan-ded-pocket set (LP-Set)). This resulted in 13,431 Protein DataBank entries and 3,561 unique heteromolecules. Several fil-ters were used to produce the liganded protein-ligand bindingsite data set. First, we introduced a ligand size and frequencyfilter. Heteromolecules containing fewer than seven heavyatoms were excluded in this research. This excluded metalsand popular crystallization buffer components. To avoid abenchmark bias toward the most frequent ligands, we ex-cluded high frequency cofactors or substrates, such ashemes, N-acetyl-D-glucosamine, �-D-mannose, certain sug-ars, etc. This filter reduced the number of entries to 7,275(about 54% of all complexes). Second, a receptor quality filterwas used. Only entries with resolution better than 2.5Å wereretained. Proteins that consist of fewer than 50 or more than2,000 residues were also excluded. This filter reduced thenumber of entries to 5,736. We applied other filters that didnot reduce the size of the data set significantly but cleaned upthe data as follows: (i) heteromolecules that are far away fromthe receptors (no atoms of the heteromolecules were within3.5 Å from the receptor) were removed; (ii) heteromoleculesthat contact the symmetric parts of the receptor (within 3.5 Åin distance) were removed because their binding sites areformed between the asymmetric units, and building a correctmodel requires biological information; (iii) ion clusters wereremoved; and (iv) duplicate combinations of Protein DataBank entries and ligands were removed. The final data setconsisted of 5,616 protein-ligand binding sites (LP-Set). Thatis the combination of 4,711 Protein Data Bank entries with2,175 unique ligands.
Collecting Protein-Ligand Binding Sites from the Uncom-plexed Structures—Because our main goal was to predict apotential binding envelope from an uncomplexed structure, itwas critical to compile a benchmark of unliganded pocketsites (UP-Set). This additional data set helped us to validatethe pocket prediction algorithm in a more realistic situation.Unliganded pockets may not be as obvious as the ligandedpockets due to the ligand-induced conformational changes.Side chains often obstruct a part of the pocket in the absenceof the ligand. The UP-Set was collected by superimposing theprotein structure in the LP-Set onto its uncomplexed homo-logues and mapping the ligand to them. The proteins (apostructures) in the UP-Set had to meet the following criteria. (i)
The sequence identity between apo structure and complexedprotein is over 95%. (ii) The resolution of the structure is betterthan 2.5 Å. (iii) There are no mutations among the surfaceresidues within 8 Å around the mapped ligand. (iv) There areno other ligands within 8 Å around the mapped ligand in theapo structure.
Only the single chain receptors in the LP-Set were used tofind the apo structures. The only reason for using the singlechain receptors was to simplify the process of identifyinghomologues and superimposing the structures. We pre-served all alternative binding pockets in the UP-Set to avoidan arbitrary choice of one representative unliganded pocket.A total of 11,510 unliganded pockets projections were col-lected from the eligible Protein Data Bank entries. Thesemapped binding sites corresponded to 1,445 binding sitesfrom LP-Set. As a result, the UP-Set contains on averageabout eight different mappings of the same binding site inLP-Set.
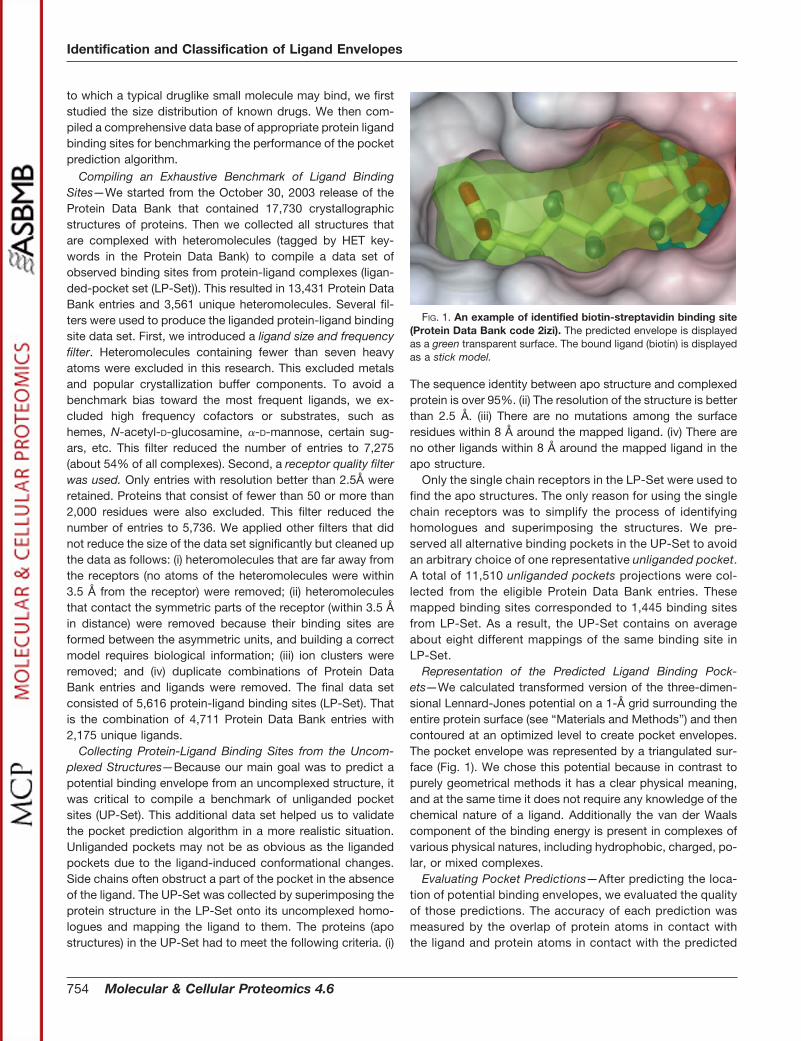
Representation of the Predicted Ligand Binding Pock-ets—We calculated transformed version of the three-dimen-sional Lennard-Jones potential on a 1-Å grid surrounding theentire protein surface (see “Materials and Methods”) and thencontoured at an optimized level to create pocket envelopes.The pocket envelope was represented by a triangulated sur-face (Fig. 1). We chose this potential because in contrast topurely geometrical methods it has a clear physical meaning,and at the same time it does not require any knowledge of thechemical nature of a ligand. Additionally the van der Waalscomponent of the binding energy is present in complexes ofvarious physical natures, including hydrophobic, charged, po-lar, or mixed complexes.
Evaluating Pocket Predictions—After predicting the loca-tion of potential binding envelopes, we evaluated the qualityof those predictions. The accuracy of each prediction wasmeasured by the overlap of protein atoms in contact withthe ligand and protein atoms in contact with the predicted
FIG. 1. An example of identified biotin-streptavidin binding site(Protein Data Bank code 2izi). The predicted envelope is displayedas a green transparent surface. The bound ligand (biotin) is displayedas a stick model.
Identification and Classification of Ligand Envelopes
754 Molecular & Cellular Proteomics 4.6
envelope. This relative overlap (RO) parameter wascalculated as follows,
RO � �AL � AE�/AL (Eq. 5)
where AL is the solvent-accessible area of the receptor atomswithin 3.5 Å from a bound ligand, and AE is the solvent-accessible area of the receptor atoms within 3.5 Å from thepredicted envelope. A completely failed prediction wouldhave RO equal to zero, whereas a perfect prediction wouldhave RO close to 1.0. However, this requirement would be toostrict because obviously the same pocket may bind differentligands, and all these ligands may share a core site but extendin different directions. We define the threshold of successfulprediction as RO � 0.5, i.e. at least 50% of the accessiblearea AL has to be overlapped by the predicted area (AE).
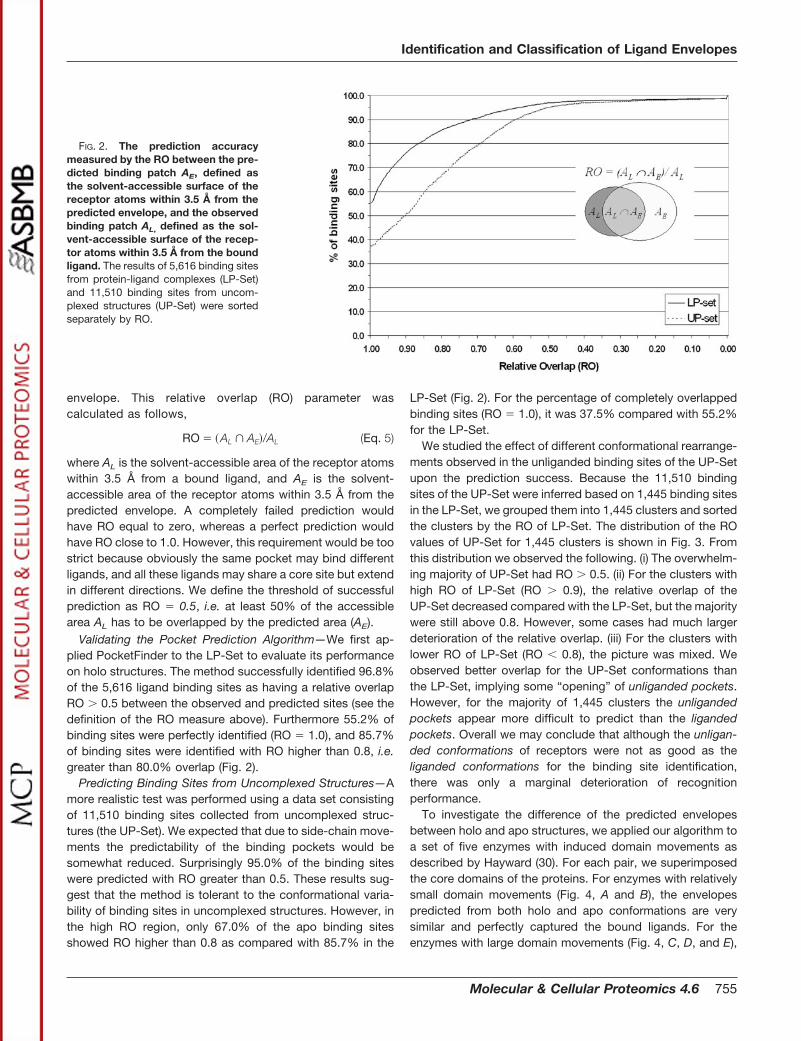
Validating the Pocket Prediction Algorithm—We first ap-plied PocketFinder to the LP-Set to evaluate its performanceon holo structures. The method successfully identified 96.8%of the 5,616 ligand binding sites as having a relative overlapRO � 0.5 between the observed and predicted sites (see thedefinition of the RO measure above). Furthermore 55.2% ofbinding sites were perfectly identified (RO � 1.0), and 85.7%of binding sites were identified with RO higher than 0.8, i.e.greater than 80.0% overlap (Fig. 2).
Predicting Binding Sites from Uncomplexed Structures—Amore realistic test was performed using a data set consistingof 11,510 binding sites collected from uncomplexed struc-tures (the UP-Set). We expected that due to side-chain move-ments the predictability of the binding pockets would besomewhat reduced. Surprisingly 95.0% of the binding siteswere predicted with RO greater than 0.5. These results sug-gest that the method is tolerant to the conformational varia-bility of binding sites in uncomplexed structures. However, inthe high RO region, only 67.0% of the apo binding sitesshowed RO higher than 0.8 as compared with 85.7% in the
LP-Set (Fig. 2). For the percentage of completely overlappedbinding sites (RO � 1.0), it was 37.5% compared with 55.2%for the LP-Set.
We studied the effect of different conformational rearrange-ments observed in the unliganded binding sites of the UP-Setupon the prediction success. Because the 11,510 bindingsites of the UP-Set were inferred based on 1,445 binding sitesin the LP-Set, we grouped them into 1,445 clusters and sortedthe clusters by the RO of LP-Set. The distribution of the ROvalues of UP-Set for 1,445 clusters is shown in Fig. 3. Fromthis distribution we observed the following. (i) The overwhelm-ing majority of UP-Set had RO � 0.5. (ii) For the clusters withhigh RO of LP-Set (RO � 0.9), the relative overlap of theUP-Set decreased compared with the LP-Set, but the majoritywere still above 0.8. However, some cases had much largerdeterioration of the relative overlap. (iii) For the clusters withlower RO of LP-Set (RO � 0.8), the picture was mixed. Weobserved better overlap for the UP-Set conformations thanthe LP-Set, implying some “opening” of unliganded pockets.However, for the majority of 1,445 clusters the unligandedpockets appear more difficult to predict than the ligandedpockets. Overall we may conclude that although the unligan-ded conformations of receptors were not as good as theliganded conformations for the binding site identification,there was only a marginal deterioration of recognitionperformance.
To investigate the difference of the predicted envelopesbetween holo and apo structures, we applied our algorithm toa set of five enzymes with induced domain movements asdescribed by Hayward (30). For each pair, we superimposedthe core domains of the proteins. For enzymes with relativelysmall domain movements (Fig. 4, A and B), the envelopespredicted from both holo and apo conformations are verysimilar and perfectly captured the bound ligands. For theenzymes with large domain movements (Fig. 4, C, D, and E),
FIG. 2. The prediction accuracymeasured by the RO between the pre-dicted binding patch AE, defined asthe solvent-accessible surface of thereceptor atoms within 3.5 Å from thepredicted envelope, and the observedbinding patch AL, defined as the sol-vent-accessible surface of the recep-tor atoms within 3.5 Å from the boundligand. The results of 5,616 binding sitesfrom protein-ligand complexes (LP-Set)and 11,510 binding sites from uncom-plexed structures (UP-Set) were sortedseparately by RO.
Identification and Classification of Ligand Envelopes
Molecular & Cellular Proteomics 4.6 755
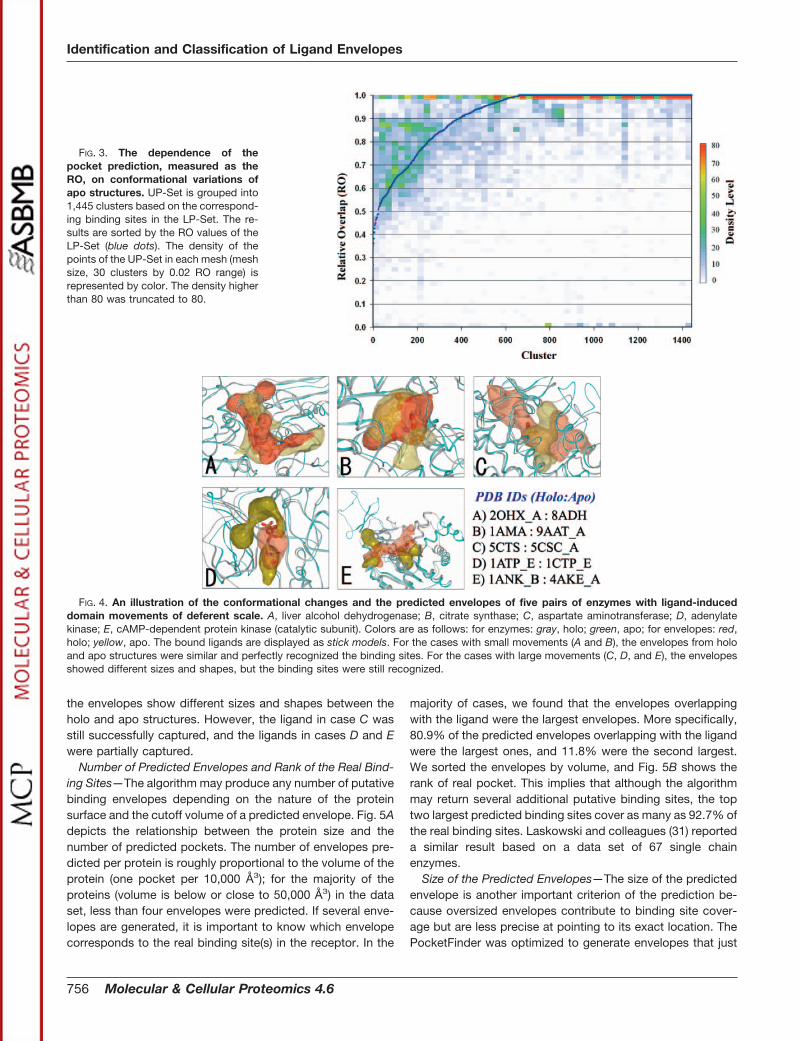
the envelopes show different sizes and shapes between theholo and apo structures. However, the ligand in case C wasstill successfully captured, and the ligands in cases D and Ewere partially captured.
Number of Predicted Envelopes and Rank of the Real Bind-ing Sites—The algorithm may produce any number of putativebinding envelopes depending on the nature of the proteinsurface and the cutoff volume of a predicted envelope. Fig. 5Adepicts the relationship between the protein size and thenumber of predicted pockets. The number of envelopes pre-dicted per protein is roughly proportional to the volume of theprotein (one pocket per 10,000 Å3); for the majority of theproteins (volume is below or close to 50,000 Å3) in the dataset, less than four envelopes were predicted. If several enve-lopes are generated, it is important to know which envelopecorresponds to the real binding site(s) in the receptor. In the
majority of cases, we found that the envelopes overlappingwith the ligand were the largest envelopes. More specifically,80.9% of the predicted envelopes overlapping with the ligandwere the largest ones, and 11.8% were the second largest.We sorted the envelopes by volume, and Fig. 5B shows therank of real pocket. This implies that although the algorithmmay return several additional putative binding sites, the toptwo largest predicted binding sites cover as many as 92.7% ofthe real binding sites. Laskowski and colleagues (31) reporteda similar result based on a data set of 67 single chainenzymes.
Size of the Predicted Envelopes—The size of the predictedenvelope is another important criterion of the prediction be-cause oversized envelopes contribute to binding site cover-age but are less precise at pointing to its exact location. ThePocketFinder was optimized to generate envelopes that just
FIG. 3. The dependence of thepocket prediction, measured as theRO, on conformational variations ofapo structures. UP-Set is grouped into1,445 clusters based on the correspond-ing binding sites in the LP-Set. The re-sults are sorted by the RO values of theLP-Set (blue dots). The density of thepoints of the UP-Set in each mesh (meshsize, 30 clusters by 0.02 RO range) isrepresented by color. The density higherthan 80 was truncated to 80.
FIG. 4. An illustration of the conformational changes and the predicted envelopes of five pairs of enzymes with ligand-induceddomain movements of deferent scale. A, liver alcohol dehydrogenase; B, citrate synthase; C, aspartate aminotransferase; D, adenylatekinase; E, cAMP-dependent protein kinase (catalytic subunit). Colors are as follows: for enzymes: gray, holo; green, apo; for envelopes: red,holo; yellow, apo. The bound ligands are displayed as stick models. For the cases with small movements (A and B), the envelopes from holoand apo structures were similar and perfectly recognized the binding sites. For the cases with large movements (C, D, and E), the envelopesshowed different sizes and shapes, but the binding sites were still recognized.
Identification and Classification of Ligand Envelopes
756 Molecular & Cellular Proteomics 4.6
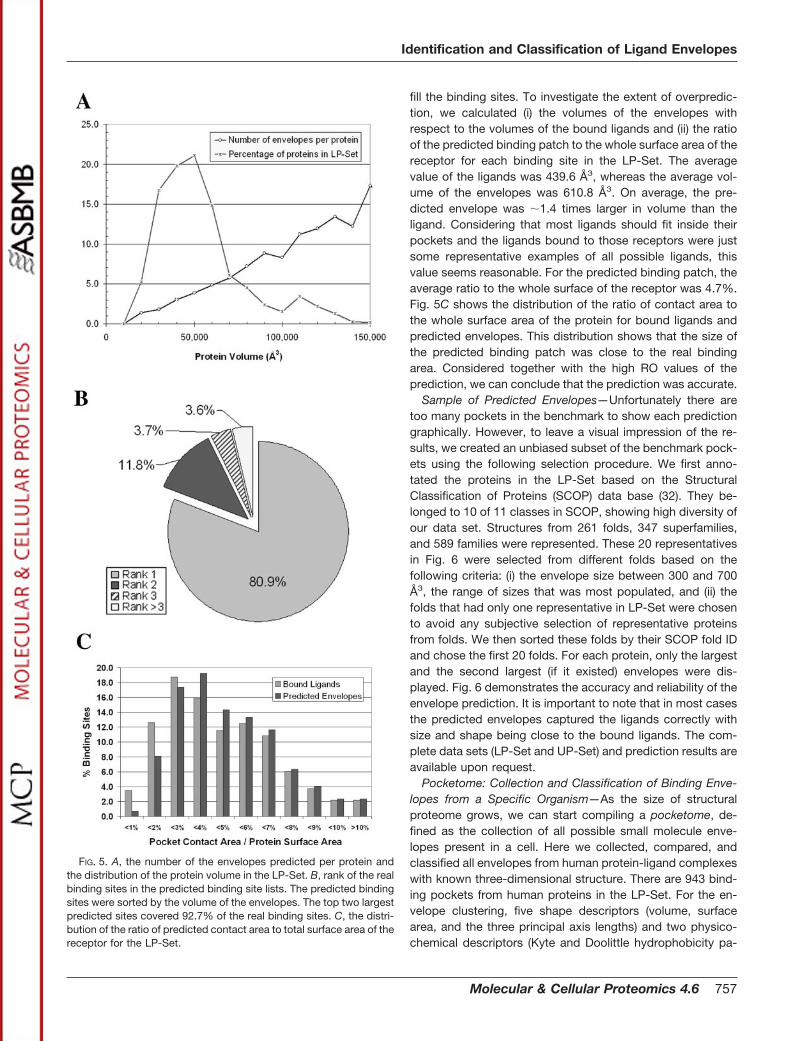
fill the binding sites. To investigate the extent of overpredic-tion, we calculated (i) the volumes of the envelopes withrespect to the volumes of the bound ligands and (ii) the ratioof the predicted binding patch to the whole surface area of thereceptor for each binding site in the LP-Set. The averagevalue of the ligands was 439.6 Å3, whereas the average vol-ume of the envelopes was 610.8 Å3. On average, the pre-dicted envelope was �1.4 times larger in volume than theligand. Considering that most ligands should fit inside theirpockets and the ligands bound to those receptors were justsome representative examples of all possible ligands, thisvalue seems reasonable. For the predicted binding patch, theaverage ratio to the whole surface of the receptor was 4.7%.Fig. 5C shows the distribution of the ratio of contact area tothe whole surface area of the protein for bound ligands andpredicted envelopes. This distribution shows that the size ofthe predicted binding patch was close to the real bindingarea. Considered together with the high RO values of theprediction, we can conclude that the prediction was accurate.
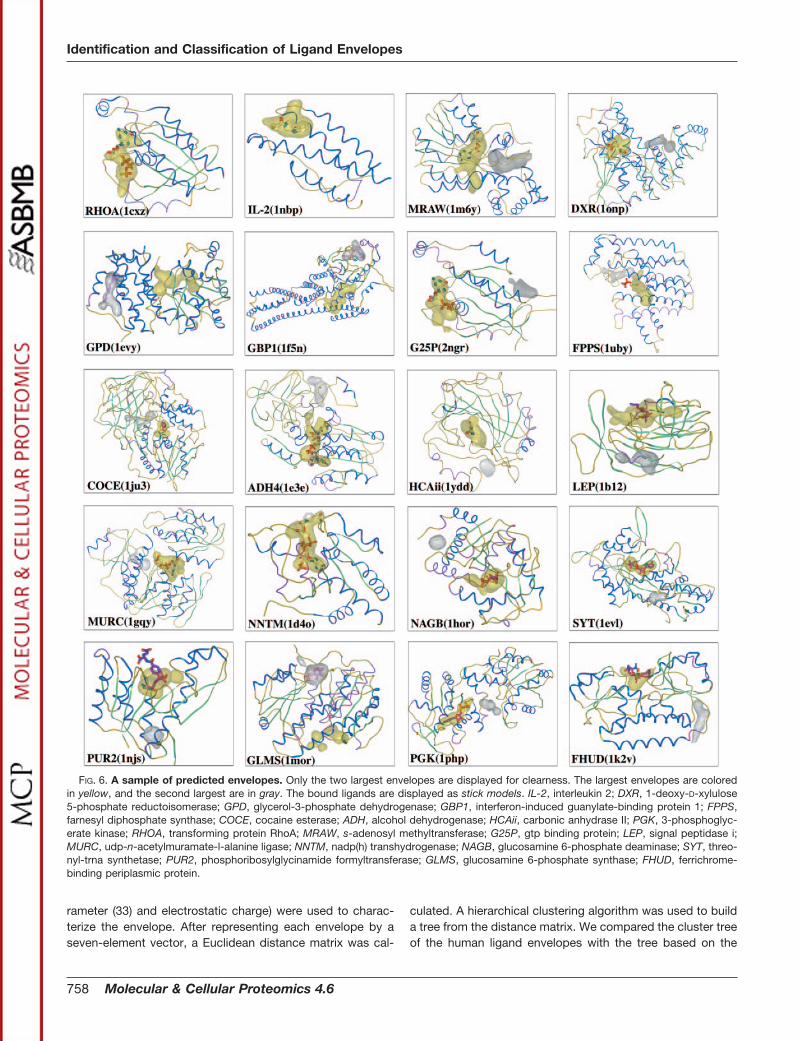
Sample of Predicted Envelopes—Unfortunately there aretoo many pockets in the benchmark to show each predictiongraphically. However, to leave a visual impression of the re-sults, we created an unbiased subset of the benchmark pock-ets using the following selection procedure. We first anno-tated the proteins in the LP-Set based on the StructuralClassification of Proteins (SCOP) data base (32). They be-longed to 10 of 11 classes in SCOP, showing high diversity ofour data set. Structures from 261 folds, 347 superfamilies,and 589 families were represented. These 20 representativesin Fig. 6 were selected from different folds based on thefollowing criteria: (i) the envelope size between 300 and 700Å3, the range of sizes that was most populated, and (ii) thefolds that had only one representative in LP-Set were chosento avoid any subjective selection of representative proteinsfrom folds. We then sorted these folds by their SCOP fold IDand chose the first 20 folds. For each protein, only the largestand the second largest (if it existed) envelopes were dis-played. Fig. 6 demonstrates the accuracy and reliability of theenvelope prediction. It is important to note that in most casesthe predicted envelopes captured the ligands correctly withsize and shape being close to the bound ligands. The com-plete data sets (LP-Set and UP-Set) and prediction results areavailable upon request.
Pocketome: Collection and Classification of Binding Enve-lopes from a Specific Organism—As the size of structuralproteome grows, we can start compiling a pocketome, de-fined as the collection of all possible small molecule enve-lopes present in a cell. Here we collected, compared, andclassified all envelopes from human protein-ligand complexeswith known three-dimensional structure. There are 943 bind-ing pockets from human proteins in the LP-Set. For the en-velope clustering, five shape descriptors (volume, surfacearea, and the three principal axis lengths) and two physico-chemical descriptors (Kyte and Doolittle hydrophobicity pa-
FIG. 5. A, the number of the envelopes predicted per protein andthe distribution of the protein volume in the LP-Set. B, rank of the realbinding sites in the predicted binding site lists. The predicted bindingsites were sorted by the volume of the envelopes. The top two largestpredicted sites covered 92.7% of the real binding sites. C, the distri-bution of the ratio of predicted contact area to total surface area of thereceptor for the LP-Set.
Identification and Classification of Ligand Envelopes
Molecular & Cellular Proteomics 4.6 757
rameter (33) and electrostatic charge) were used to charac-terize the envelope. After representing each envelope by aseven-element vector, a Euclidean distance matrix was cal-
culated. A hierarchical clustering algorithm was used to builda tree from the distance matrix. We compared the cluster treeof the human ligand envelopes with the tree based on the
FIG. 6. A sample of predicted envelopes. Only the two largest envelopes are displayed for clearness. The largest envelopes are coloredin yellow, and the second largest are in gray. The bound ligands are displayed as stick models. IL-2, interleukin 2; DXR, 1-deoxy-D-xylulose5-phosphate reductoisomerase; GPD, glycerol-3-phosphate dehydrogenase; GBP1, interferon-induced guanylate-binding protein 1; FPPS,farnesyl diphosphate synthase; COCE, cocaine esterase; ADH, alcohol dehydrogenase; HCAii, carbonic anhydrase II; PGK, 3-phosphoglyc-erate kinase; RHOA, transforming protein RhoA; MRAW, s-adenosyl methyltransferase; G25P, gtp binding protein; LEP, signal peptidase i;MURC, udp-n-acetylmuramate-l-alanine ligase; NNTM, nadp(h) transhydrogenase; NAGB, glucosamine 6-phosphate deaminase; SYT, threo-nyl-trna synthetase; PUR2, phosphoribosylglycinamide formyltransferase; GLMS, glucosamine 6-phosphate synthase; FHUD, ferrichrome-binding periplasmic protein.
Identification and Classification of Ligand Envelopes
758 Molecular & Cellular Proteomics 4.6
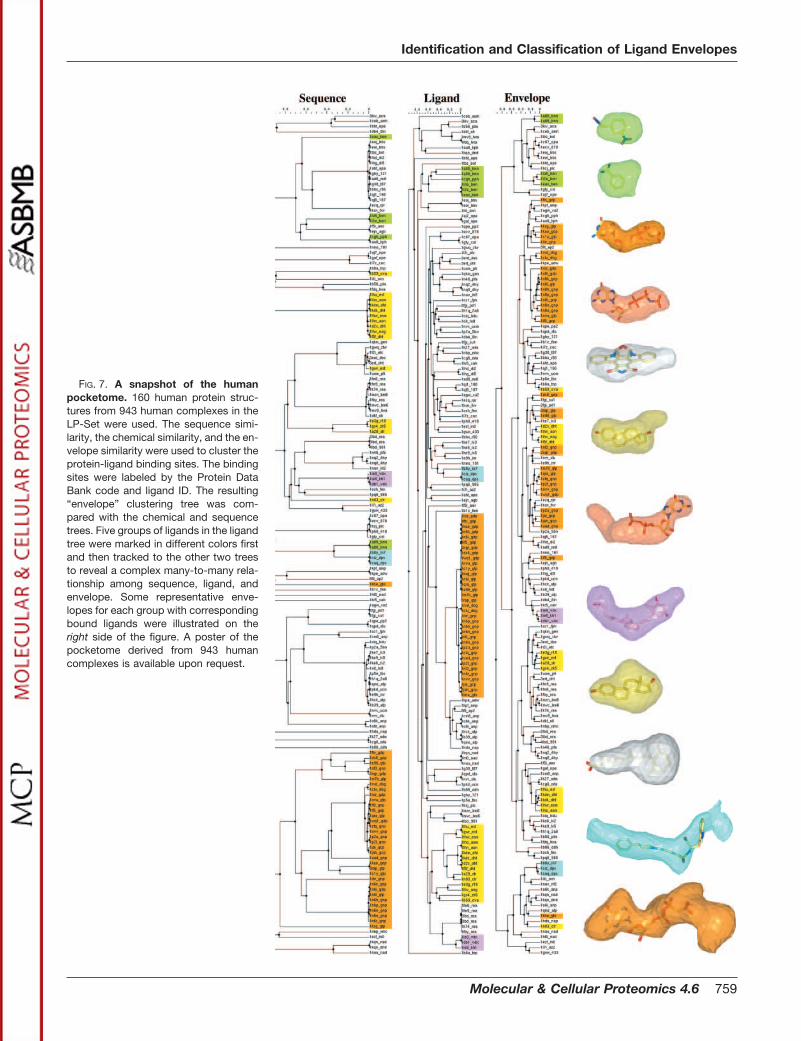
FIG. 7. A snapshot of the humanpocketome. 160 human protein struc-tures from 943 human complexes in theLP-Set were used. The sequence simi-larity, the chemical similarity, and the en-velope similarity were used to cluster theprotein-ligand binding sites. The bindingsites were labeled by the Protein DataBank code and ligand ID. The resulting“envelope” clustering tree was com-pared with the chemical and sequencetrees. Five groups of ligands in the ligandtree were marked in different colors firstand then tracked to the other two treesto reveal a complex many-to-many rela-tionship among sequence, ligand, andenvelope. Some representative enve-lopes for each group with correspondingbound ligands were illustrated on theright side of the figure. A poster of thepocketome derived from 943 humancomplexes is available upon request.
Identification and Classification of Ligand Envelopes
Molecular & Cellular Proteomics 4.6 759
chemical similarity between ligands. This comparison high-lights the complex relationship between ligands and theirpockets. We know that the same pocket can bind chemicallydifferent ligands of somewhat different size and properties,and the same small molecule can bind to rather differentpockets. Fig. 7 shows a fragment of those trees constructedfrom 160 binding sites (the tree for all 943 binding sites ofavailable human protein-ligand complex structures is avail-able upon request) where each branch is labeled by theProtein Data Bank code and ligand ID. These trees representthree different types of information: the classification by thesequences provides evolutionary information, the classifica-tion by the ligands shows chemical similarity (Tanimoto coef-ficient) of the bound ligands, and the classification by theenvelopes provides the similarity of the binding pockets. Weinvestigated five groups of ligands in the ligand tree (coloredby green, blue, orange, yellow, and pink, respectively) andobserved that, in most of the cases, the ligands belonging tothe same group were clustered closely in the other trees aswell. However, the difference between the classifications wasobserved, reflecting the complex nature of the ligand-pocketrelationship: a ligand can bind to different pockets, and thesame pocket may be good for different ligands. The clusteringtree of putative ligand envelopes provided a new viewpoint forunderstanding the ligand-pocket relationship. By counting thenumber of similar envelopes we can estimate how common orrare a pocket is in the pocketome.
DISCUSSION AND CONCLUSIONS
We demonstrated that the PocketFinder algorithm can suc-cessfully identify or predict protein-ligand binding envelopesfrom complexed and apo structures. We also compiled thefirst draft of a human “pocketome” consisting of 943 enve-lopes. Albeit incomplete, this pocketome can grow along withthe structural proteome.
A small number of binding sites could not be identified bythe algorithm. For 5,616 binding sites from the LP-Set, 66cases were completely missed (no relative overlaps, RO � 0)by the identification. We visually examined all these cases and
found that these binding sites were either very small or veryshallow. All of them could still be identified by adjusting theparameters (contouring level and volume cutoff of the enve-lope) of the program. However, adjusting the parameters todetect small or shallow binding sites may result in highernumber of false positives. Practically if the program alwaysreturns a long list of putative binding sites, the prediction is oflittle value. However, when applying the method to a specificprotein, the “average” optimal parameters can be adjustedbased on the additional biological and structural data such asthe flexibility of B-factors and the feedback from the inspec-tion of the prediction result. If no pocket can be found byusing the default average parameters or if the pockets arelikely to be small/shallow, for example in the case of peptidebinding sites, one can try to adjust the parameters to findsmaller or shallower pockets if there are compelling reasonsto expect their existence.
In conclusion, of the 5,616 protein-ligand binding sites ofcomplexes we tested, the PocketFinder method correctlyidentified 96.8% of the known binding sites. 85.7% of thebinding sites showed coverage of the known contact areahigher than 80.0%. For correctly identified binding sites,80.9% were the largest envelopes, and 11.8% were the sec-ond largest. The average ratio of the predicted binding patchto the total surface area of the protein was 4.7%, implying thatthe prediction was quite specific and had a low false positiverate. The prediction rate for 11,510 binding sites from apostructures (UP-Set) was 95.0%, close to that of the LP-Set.The RO in general was somewhat lower than that of theLP-Set, but 67.0% of the binding sites still had 80% or betteroverlap.
The proposed pocket prediction algorithm can be used toidentify possible binding site locations for orphan receptors orfor uncharacterized secondary binding sites of known recep-tors. Furthermore ligand design can be directed by the pre-dicted envelope. It can also be used to prioritize novel targetsby the “druggability” of identified pockets. In addition, apply-ing the algorithm to separated protein subunits and evaluatingthe strength of “pocket potential” at the interface patches may
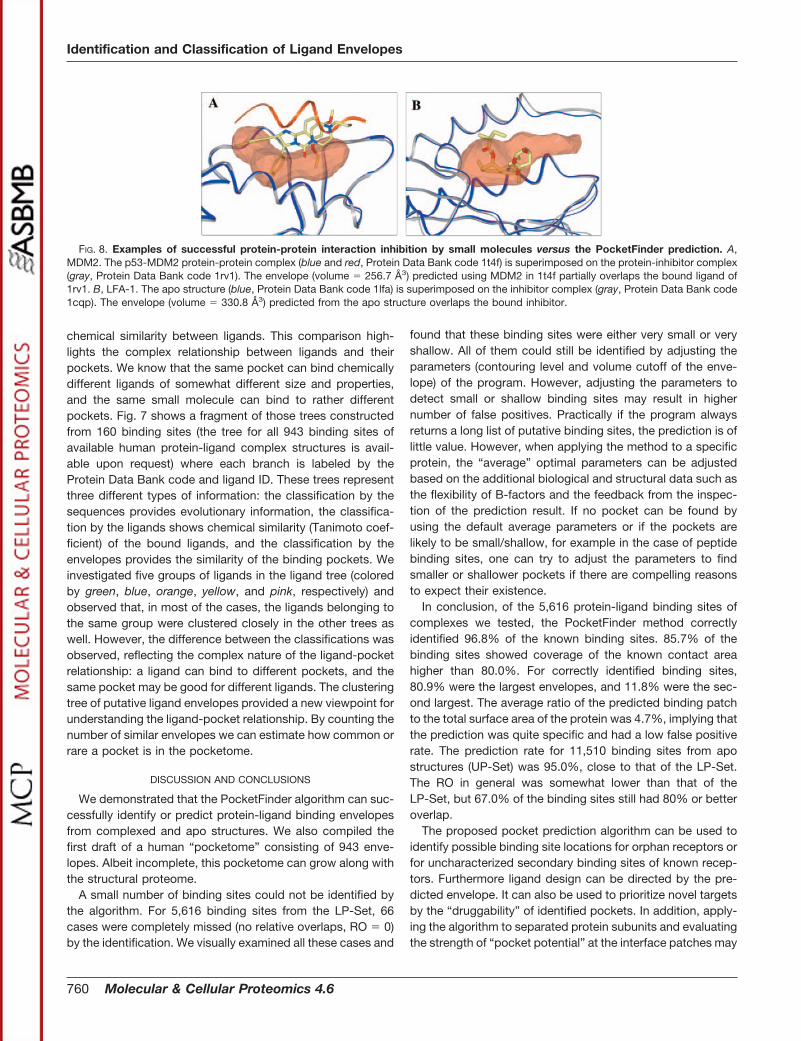
FIG. 8. Examples of successful protein-protein interaction inhibition by small molecules versus the PocketFinder prediction. A,MDM2. The p53-MDM2 protein-protein complex (blue and red, Protein Data Bank code 1t4f) is superimposed on the protein-inhibitor complex(gray, Protein Data Bank code 1rv1). The envelope (volume � 256.7 Å3) predicted using MDM2 in 1t4f partially overlaps the bound ligand of1rv1. B, LFA-1. The apo structure (blue, Protein Data Bank code 1lfa) is superimposed on the inhibitor complex (gray, Protein Data Bank code1cqp). The envelope (volume � 330.8 Å3) predicted from the apo structure overlaps the bound inhibitor.
Identification and Classification of Ligand Envelopes
760 Molecular & Cellular Proteomics 4.6
help evaluate the feasibility of protein-protein interaction in-hibition. Fig. 8 shows some examples of successful protein-protein interaction inhibition by small molecules targeting thetranscriptional regulator MDM2 and LFA-1. We found pocketsin the protein-protein interfaces from the apo structures thatoverlapped the bound ligands.
Using our algorithm, we can identify and collect potentialsmall molecule binding envelopes in a structural proteome;cluster them into classes and categories according to theirsize, shape, and physicochemical properties; and comparethis classification with the classification of chemical sub-strates or ligands. We expect the pocketome to grow alongwith the structural proteome and the improvements of theenvelope prediction and classification methods.
Acknowledgments—We thank Brian Marsden, Colin Smith, AndyOrry, and Sanjay Saldanha for the discussion of the manuscript andEugene Raush and Levon Budagyan from Molsoft for help in cluster-ing and preparation of the illustrations. J. H. A. and R. A. also thankMolSoft for making the ICM program available for this research.
* This work was supported in part by Department of Energy GrantER63042. The costs of publication of this article were defrayed in partby the payment of page charges. This article must therefore be herebymarked “advertisement” in accordance with 18 U.S.C. Section 1734solely to indicate this fact.
¶ To whom correspondence should be addressed: Dept. of Molec-ular Biology, The Scripps Research Inst., TPC-28, La Jolla, CA 92037.Tel.: 858-784-8595; Fax: 858-784-8299; E-mail: [email protected].
REFERENCES
1. Campbell, S. J., Gold, N. D., Jackson, R. M., and Westhead, D. R. (2003)Ligand binding: functional site location, similarity and docking. Curr.Opin. Struct. Biol. 13, 389–395
2. Lichtarge, O., Yao, H., Kristensen, D. M., Madabushi, S., and Mihalek, I.(2003) Accurate and scalable identification of functional sites by evolu-tionary tracing. J. Struct. Funct. Genomics 4, 159–166
3. Lichtarge, O., and Sowa, M. E. (2002) Evolutionary predictions of bindingsurfaces and interactions. Curr. Opin. Struct. Biol. 12, 21–27
4. Walters, W. P., Stahl, M. T., and Murcko, M. A. (1998) Virtual screening—anoverview. Drug Discov. Today 3, 160–178
5. Klebe, G. (2000) Recent developments in structure-based drug design. J.Mol. Med. 78, 269–281
6. Gane, P. J., and Dean, P. M. (2000) Recent advances in structure-basedrational drug design. Curr. Opin. Struct. Biol. 10, 401–404
7. Abagyan, R., and Totrov, M. (2001) High-throughput docking for leadgeneration. Curr. Opin. Chem. Biol. 5, 375–382
8. Shoichet, B. K., McGovern, S. L., Wei, B., and Irwin, J. J. (2002) Leaddiscovery using molecular docking. Curr. Opin. Chem. Biol. 6, 439–446
9. Anderson, S., and Chiplin, J. (2002) Structural genomics: shaping the futureof drug design? Drug Discov. Today 7, 105–107
10. Veber, D. F., Johnson, S. R., Cheng, H. Y., Smith, B. R., Ward, K. W., andKopple, K. D. (2002) Molecular properties that influence the oral bioavail-ability of drug candidates. J. Med. Chem. 45, 2615–2623
11. Lipinski, C. A. (2000) Drug-like properties and the causes of poor solubilityand poor permeability. J. Pharmacol. Toxicol. Methods 44, 235–249
12. Laskowski, R. A. (1995) SURFNET: a program for visualizing molecular
surfaces, cavities, and intermolecular interactions. J. Mol. Graph. 13,323–330
13. Hendlich, M., Rippmann, F., and Barnickel, G. (1997) LIGSITE: automaticand efficient detection of potential small molecule-binding sites in pro-teins. J. Mol. Graph. Model. 15, 359–363
14. Levitt, D., and Banaszak, L. (1992) POCKET: a computer graphics methodfor identifying and displaying protein cavities and their surroundingamino acids. J. Mol. Graph. 10, 229–234
15. Peters, K. P., Fauck, J., and Frommel, C. (1996) The automatic search forligand binding sites in proteins of known three-dimensional structureusing only geometric criteria. J. Mol. Biol. 256, 201–213
16. Liang, J., Edelsbrunner, H., and Woodward, C. (1998) Anatomy of proteinpockets and cavities: Measurement of binding site geometry and impli-cations for ligand design. Protein Sci. 7, 1884–1897
17. Brady, G. P., Jr., and Stouten, P. F. (2000) Fast prediction and visualizationof protein binding pockets with PASS. J. Comput.-Aided Mol. Des. 14,383–401
18. Dennis, S., Kortvelyesi, T., and Vajda, S. (2002) Computational mappingidentifies the binding sites of organic solvents on proteins. Proc. Natl.Acad. Sci. U. S. A. 99, 4290–4295
19. Kortvelyesi, T., Silberstein, M., Dennis, S., and Vajda, S. (2003) Improvedmapping of protein binding sites. J. Comput.-Aided Mol. Des. 17,173–186
20. Ruppert, J., Welch, W., and Jain, A. (1997) Automatic identification andrepresentation of protein binding sites for molecular docking. Protein Sci.6, 524–533
21. Verdonk, M. L., Cole, J. C., Watson, P., Gillet, V., and Willett, P. (2001)SuperStar: improved knowledge-based interaction fields for proteinbinding sites. J. Mol. Biol. 307, 841–859
22. Bliznyuk, A., and Gready, J. (1999) Simple method for locating possibleligand binding sites on protein surfaces. J. Comput. Chem. 9, 983–988
23. Glick, M., Robinson, D. D., Grant, G. H., and Richards, W. G. (2002)Identification of ligand binding sites on proteins using a multi-scaleapproach. J. Am. Chem. Soc. 124, 2337–2344
24. Sotriffer, C., and Klebe, G. (2002) Identification and mapping of small-molecule binding sites in proteins: computational tools for structure-based drug design. Farmaco 57, 243–251
25. Bernstein, F. C., Koetzle, T. F., Williams, G. J., Meyer, E. E., Jr., Brice, M. D.,Rodgers, J. R., Kennard, O., Shimanouchi, T., and Tasumi, M. (1977) TheProtein Data Bank: a computer-based archival file for macromolecularstructures. J. Mol. Biol. 112, 535–542
26. Berman, H. M., Westbrook, J., Feng, Z., Gilliland, G., Bhat, T. N., Weissig,H., Shindyalov, I. N., and Bourne, P. E. (2000) The Protein Data Bank.Nucleic Acids Res. 28, 235–242
27. Totrov, M., and Abagyan, R. (1997) Flexible protein-ligand docking byglobal energy optimization in internal coordinates. Proteins Suppl. 1, 29,215–220
28. Abagyan, R., Totrov, M., and Kuznetsov, D. (1994) ICM: a new method forstructure modeling and design: applications to docking and structureprediction from the distorted native conformation. J. Comput. Chem. 15,488–506
29. MolSoft (2000) ICM 2.8 Program Manual, MolSoft, LLC, San Diego, CA30. Hayward, S. (2004) Identification of specific interactions that drive ligand-
induced closure in five enzymes with classic domain movements. J. Mol.Biol. 339, 1001–1021
31. Laskowski, R. A., Luscombe, N. M., Swindells, M. B., and Thornton, J. M.(1996) Protein clefts in molecular recognition and function. Protein Sci. 5,2438–2452
32. Andreeva, A., Howorth, D., Brenner, S. E., Hubbard, T. J., Chothia, C., andMurzin, A. G. (2004) SCOP database in 2004: refinements integratestructure and sequence family data. Nucleic Acids Res. 32, D226–D229
33. Kyte, J., and Doolittle, R. F. (1982) A simple method for displaying thehydropathic character of a protein. J. Mol. Biol. 157, 105–132
Identification and Classification of Ligand Envelopes
Molecular & Cellular Proteomics 4.6 761