pnwis 2015 annual conference technical program last ... · pnwis 2015 annual conference technical...
TRANSCRIPT
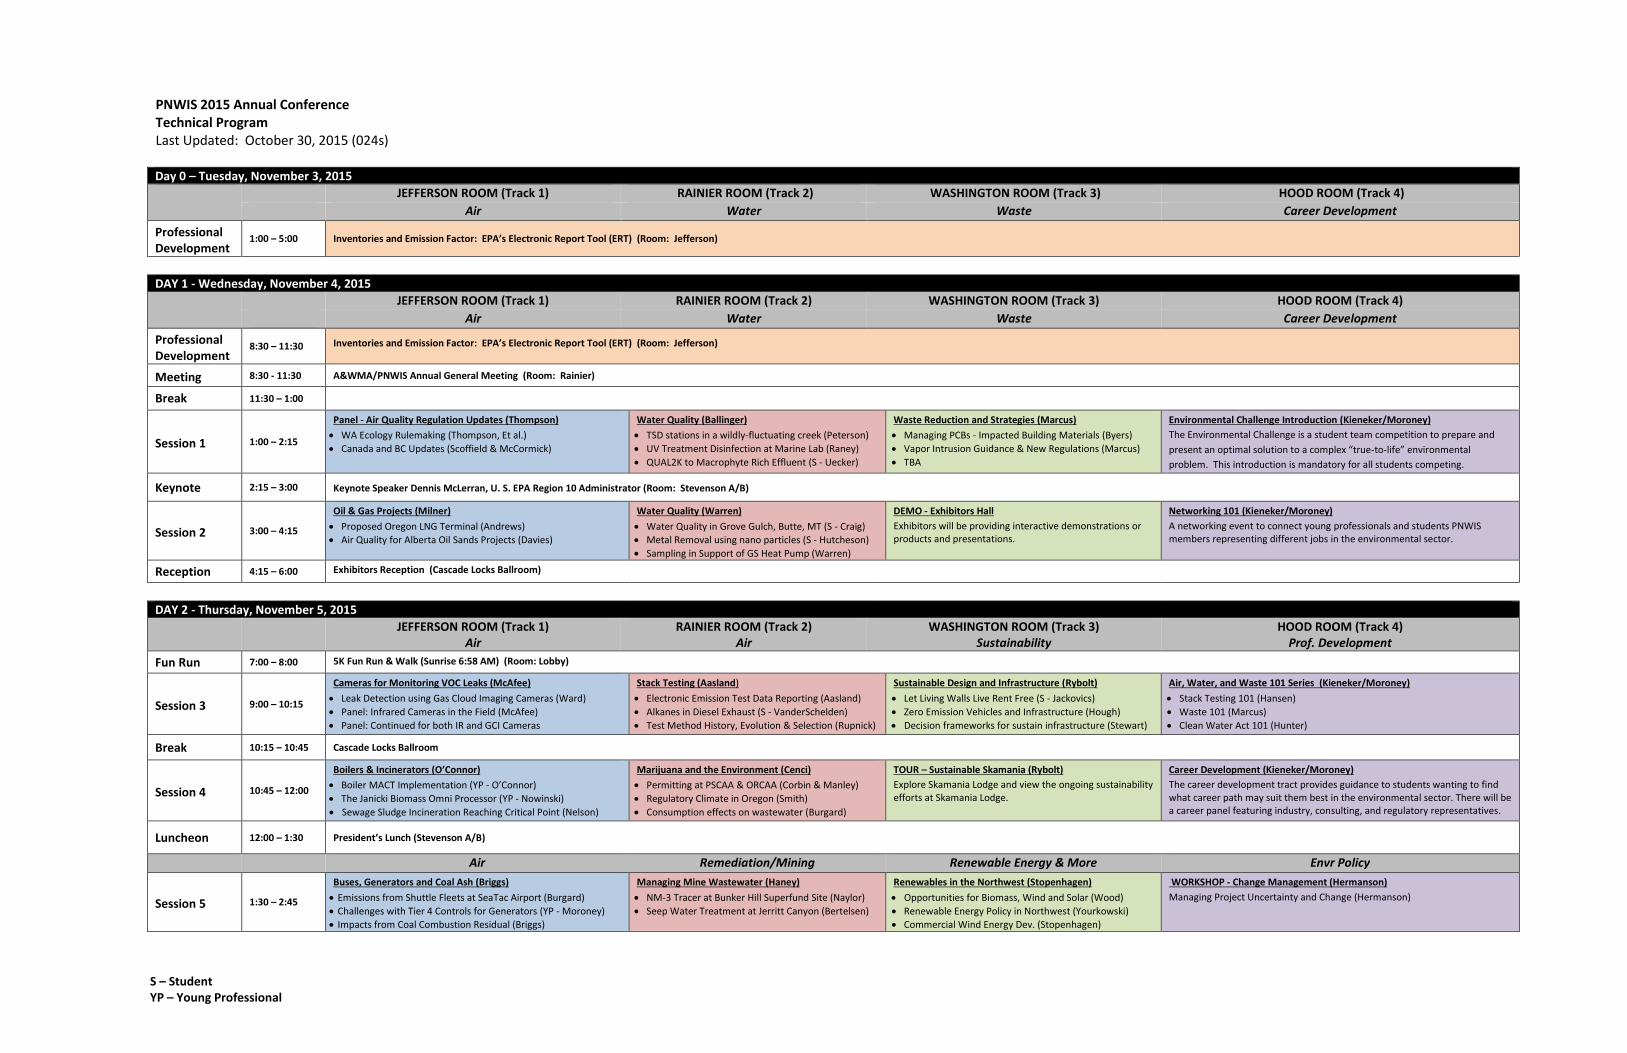
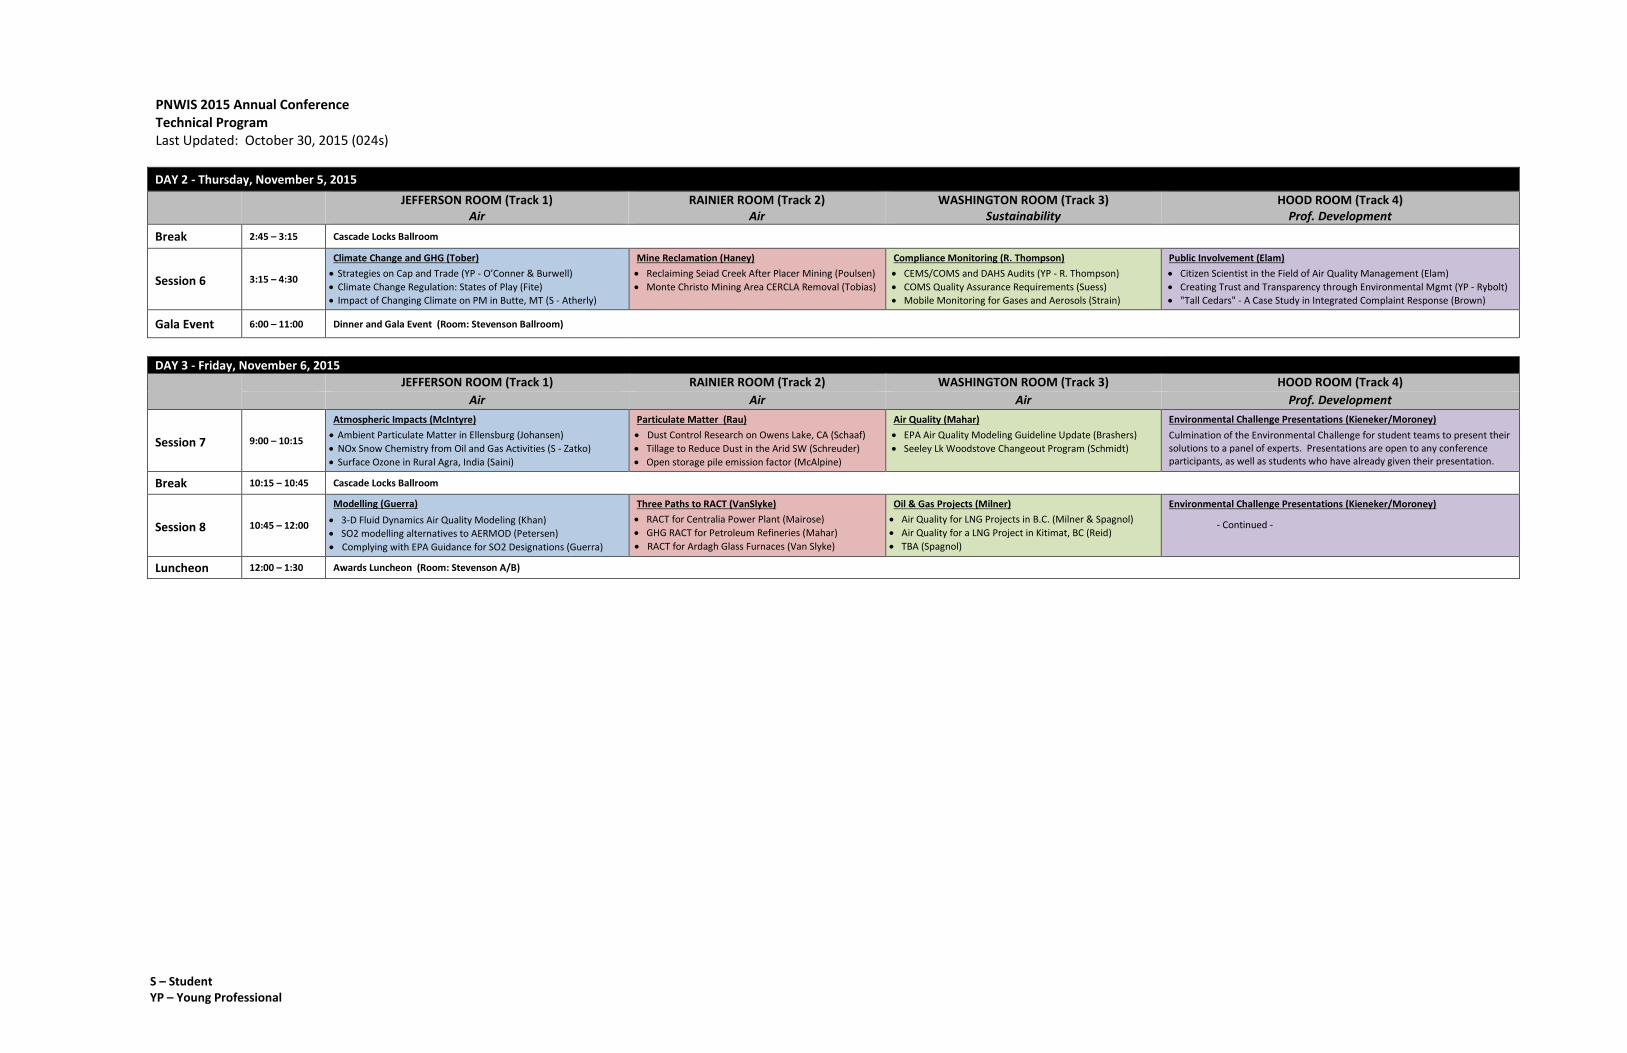
PNWIS 2015 Annual Conference Technical Program Last Updated: October 30, 2015 (024s)
S – Student YP – Young Professional
Day 0 – Tuesday, November 3, 2015 JEFFERSON ROOM (Track 1) RAINIER ROOM (Track 2) WASHINGTON ROOM (Track 3) HOOD ROOM (Track 4)
Air Water Waste Career Development
Professional Development
1:00 – 5:00 Inventories and Emission Factor: EPA’s Electronic Report Tool (ERT) (Room: Jefferson)
DAY 1 - Wednesday, November 4, 2015
JEFFERSON ROOM (Track 1) RAINIER ROOM (Track 2) WASHINGTON ROOM (Track 3) HOOD ROOM (Track 4)
Air Water Waste Career Development
Professional Development
8:30 – 11:30 Inventories and Emission Factor: EPA’s Electronic Report Tool (ERT) (Room: Jefferson)
Meeting 8:30 - 11:30 A&WMA/PNWIS Annual General Meeting (Room: Rainier)
Break 11:30 – 1:00
Session 1 1:00 – 2:15
Panel - Air Quality Regulation Updates (Thompson) WA Ecology Rulemaking (Thompson, Et al.)
Canada and BC Updates (Scoffield & McCormick)
Water Quality (Ballinger) TSD stations in a wildly-fluctuating creek (Peterson)
UV Treatment Disinfection at Marine Lab (Raney)
QUAL2K to Macrophyte Rich Effluent (S - Uecker)
Waste Reduction and Strategies (Marcus) Managing PCBs - Impacted Building Materials (Byers)
Vapor Intrusion Guidance & New Regulations (Marcus)
TBA
Environmental Challenge Introduction (Kieneker/Moroney) The Environmental Challenge is a student team competition to prepare and
present an optimal solution to a complex “true-to-life” environmental
problem. This introduction is mandatory for all students competing.
Keynote 2:15 – 3:00 Keynote Speaker Dennis McLerran, U. S. EPA Region 10 Administrator (Room: Stevenson A/B)
Session 2 3:00 – 4:15
Oil & Gas Projects (Milner) Proposed Oregon LNG Terminal (Andrews)
Air Quality for Alberta Oil Sands Projects (Davies)
Water Quality (Warren) Water Quality in Grove Gulch, Butte, MT (S - Craig)
Metal Removal using nano particles (S - Hutcheson)
Sampling in Support of GS Heat Pump (Warren)
DEMO - Exhibitors Hall Exhibitors will be providing interactive demonstrations or products and presentations.
Networking 101 (Kieneker/Moroney) A networking event to connect young professionals and students PNWIS members representing different jobs in the environmental sector.
Reception 4:15 – 6:00 Exhibitors Reception (Cascade Locks Ballroom)
DAY 2 - Thursday, November 5, 2015
JEFFERSON ROOM (Track 1) Air
RAINIER ROOM (Track 2) Air
WASHINGTON ROOM (Track 3) Sustainability
HOOD ROOM (Track 4) Prof. Development
Fun Run 7:00 – 8:00 5K Fun Run & Walk (Sunrise 6:58 AM) (Room: Lobby)
Session 3 9:00 – 10:15
Cameras for Monitoring VOC Leaks (McAfee) Leak Detection using Gas Cloud Imaging Cameras (Ward)
Panel: Infrared Cameras in the Field (McAfee)
Panel: Continued for both IR and GCI Cameras
Stack Testing (Aasland) Electronic Emission Test Data Reporting (Aasland)
Alkanes in Diesel Exhaust (S - VanderSchelden)
Test Method History, Evolution & Selection (Rupnick)
Sustainable Design and Infrastructure (Rybolt) Let Living Walls Live Rent Free (S - Jackovics)
Zero Emission Vehicles and Infrastructure (Hough)
Decision frameworks for sustain infrastructure (Stewart)
Air, Water, and Waste 101 Series (Kieneker/Moroney) Stack Testing 101 (Hansen)
Waste 101 (Marcus)
Clean Water Act 101 (Hunter)
Break 10:15 – 10:45 Cascade Locks Ballroom
Session 4 10:45 – 12:00
Boilers & Incinerators (O’Connor) Boiler MACT Implementation (YP - O’Connor)
The Janicki Biomass Omni Processor (YP - Nowinski)
Sewage Sludge Incineration Reaching Critical Point (Nelson)
Marijuana and the Environment (Cenci) Permitting at PSCAA & ORCAA (Corbin & Manley)
Regulatory Climate in Oregon (Smith)
Consumption effects on wastewater (Burgard)
TOUR – Sustainable Skamania (Rybolt) Explore Skamania Lodge and view the ongoing sustainability efforts at Skamania Lodge.
Career Development (Kieneker/Moroney) The career development tract provides guidance to students wanting to find what career path may suit them best in the environmental sector. There will be a career panel featuring industry, consulting, and regulatory representatives.
Luncheon 12:00 – 1:30 President’s Lunch (Stevenson A/B)
Air Remediation/Mining Renewable Energy & More Envr Policy
Session 5 1:30 – 2:45
Buses, Generators and Coal Ash (Briggs) Emissions from Shuttle Fleets at SeaTac Airport (Burgard)
Challenges with Tier 4 Controls for Generators (YP - Moroney)
Impacts from Coal Combustion Residual (Briggs)
Managing Mine Wastewater (Haney) NM-3 Tracer at Bunker Hill Superfund Site (Naylor)
Seep Water Treatment at Jerritt Canyon (Bertelsen)
Renewables in the Northwest (Stopenhagen) Opportunities for Biomass, Wind and Solar (Wood)
Renewable Energy Policy in Northwest (Yourkowski)
Commercial Wind Energy Dev. (Stopenhagen)
WORKSHOP - Change Management (Hermanson) Managing Project Uncertainty and Change (Hermanson)
PNWIS 2015 Annual Conference Technical Program Last Updated: October 30, 2015 (024s)
S – Student YP – Young Professional
DAY 2 - Thursday, November 5, 2015
JEFFERSON ROOM (Track 1)
Air RAINIER ROOM (Track 2)
Air WASHINGTON ROOM (Track 3)
Sustainability HOOD ROOM (Track 4)
Prof. Development
Break 2:45 – 3:15 Cascade Locks Ballroom
Session 6 3:15 – 4:30
Climate Change and GHG (Tober) Strategies on Cap and Trade (YP - O’Conner & Burwell)
Climate Change Regulation: States of Play (Fite)
Impact of Changing Climate on PM in Butte, MT (S - Atherly)
Mine Reclamation (Haney) Reclaiming Seiad Creek After Placer Mining (Poulsen)
Monte Christo Mining Area CERCLA Removal (Tobias)
Compliance Monitoring (R. Thompson) CEMS/COMS and DAHS Audits (YP - R. Thompson) COMS Quality Assurance Requirements (Suess) Mobile Monitoring for Gases and Aerosols (Strain)
Public Involvement (Elam) Citizen Scientist in the Field of Air Quality Management (Elam)
Creating Trust and Transparency through Environmental Mgmt (YP - Rybolt)
"Tall Cedars" - A Case Study in Integrated Complaint Response (Brown)
Gala Event 6:00 – 11:00 Dinner and Gala Event (Room: Stevenson Ballroom)
DAY 3 - Friday, November 6, 2015
JEFFERSON ROOM (Track 1) RAINIER ROOM (Track 2) WASHINGTON ROOM (Track 3) HOOD ROOM (Track 4)
Air Air Air Prof. Development
Session 7 9:00 – 10:15
Atmospheric Impacts (McIntyre) Ambient Particulate Matter in Ellensburg (Johansen)
NOx Snow Chemistry from Oil and Gas Activities (S - Zatko)
Surface Ozone in Rural Agra, India (Saini)
Particulate Matter (Rau)
Dust Control Research on Owens Lake, CA (Schaaf)
Tillage to Reduce Dust in the Arid SW (Schreuder)
Open storage pile emission factor (McAlpine)
Air Quality (Mahar)
EPA Air Quality Modeling Guideline Update (Brashers) Seeley Lk Woodstove Changeout Program (Schmidt)
Environmental Challenge Presentations (Kieneker/Moroney) Culmination of the Environmental Challenge for student teams to present their solutions to a panel of experts. Presentations are open to any conference participants, as well as students who have already given their presentation.
Break 10:15 – 10:45 Cascade Locks Ballroom
Session 8 10:45 – 12:00
Modelling (Guerra) 3-D Fluid Dynamics Air Quality Modeling (Khan)
SO2 modelling alternatives to AERMOD (Petersen)
Complying with EPA Guidance for SO2 Designations (Guerra)
Three Paths to RACT (VanSlyke) RACT for Centralia Power Plant (Mairose)
GHG RACT for Petroleum Refineries (Mahar)
RACT for Ardagh Glass Furnaces (Van Slyke)
Oil & Gas Projects (Milner) Air Quality for LNG Projects in B.C. (Milner & Spagnol)
Air Quality for a LNG Project in Kitimat, BC (Reid)
TBA (Spagnol)
Environmental Challenge Presentations (Kieneker/Moroney)
- Continued -
Luncheon 12:00 – 1:30 Awards Luncheon (Room: Stevenson A/B)

Jonathan PetersonSovereign Consulting, Inc(206) [email protected] CItyWA 98024n/a
Installing data-logging stations in a wildly-fluctuating, TDS-impacted creekSovereign Consulting's characterization of the mining impact on a large creek in Ohio was intensified in January of 2015, via the deployment of data loggers on that creek between mining outfalls. Site-operations and weather were continually changing the relative amount of Total Dissolved Solids (TDS) that each mining outfall was contributing to the larger creek, so that each manually-measured event yielded different results. More-frequent TDS readings were needed in order to shape a cost-effective outfall management plan. | |Eleven stations were setup to obtain 10-minute TDS and flows readings (using conductivity and water-pressure), and one telemetry station would provide real-time warnings at certain TDS thresholds within the creek. Lab results and channel-wading measurements were part of the calibration effort. | |Installations were initially damaged, and the telemetry start-up proved difficult. The experience prompted the design of a new monument and cartridge, and refined hardware-selection criteria. The session will cover monument-design and maintenance, evaluate TDS and flow, and outline the cost-benefits of some available hardware options. | |

Mark Milner and John SpagnolStantec(604) [email protected]/a
Atmospheric Environment Assessments for LNG Projects in British ColumbiaProponents have launched as many as nineteen LNG projects to be located along the British Columbia (BC) west coast. LNG projects consist of natural gas reception, processing and LNG export capabilities with third-party owned pipeline operators to supply natural gas. |In BC, a project cannot proceed until the proponent has provided appropriate consultations with stakeholders including First Nations and potentially affected communities, and have approval from both the provincial and federal regulatory agencies. One of the most valued components of the environmental assessment process is the Atmospheric Environment which includes an assessment of expected air quality, greenhouse gas, acoustic and light environments during project construction and operations. |The effects of both the land and marine based activities producing air emissions must be considered and a cumulative assessment to include all future projects. A greenhouse gas management study must estimate the total amounts of the greenhouse gases that are expected to be produced. The province expects that the greenhouse gas emissions totals to be less than 0.16 of the total LNG produced. Acoustic and light assessments need to consider the existing environment, project effects, and cumulative effects while adhering to BC Oil and Gas Commission and Health Canada guidelines. |

Crispina O'ConnorERM(530) [email protected] professional (35 or younger graduated more than a year ago)
Boiler MACT ImplementationAbstract |A brief overview will be provided of the energy assessment and tune-up work practice standards required under CFR (Code of Federal Regulations), Title 40, Part 63, Subpart DDDDD, National Emission Standards for Hazardous Air Pollutants for Major Sources: Industrial, Commercial, and Institutional Boilers, and Process Heaters. The discussion will include what should and should not be included in the energy assessment report along with the importance of making the assessment a collaborative effort involving multiple onsite personnel including the energy coordinator, operations, and maintenance personnel. Strategies for completing and self-certifying compliance with the periodic tune-up requirements will also be covered. This presentation will be based on lessons learned and provide the audience with practical approaches to meeting these requirements. |Speaker Bio |Ms. Crispina O'Connor is an environmental consultant with ERM-West, Inc. and has participated/lead energy assessments at both minor and major sources including manufacturing facilities, refineries, and terminals. Ms. O'Connor is listed as a certified energy assessor and EIT. Prior to working at ERM she served for 8 years in the U.S. Navy where she supervised operation and maintenance of 2 power plants including nuclear reactors, steam turbines and distilling units providing propulsion, electrical power, and water for the air craft carrier USS John C. Stennis. |
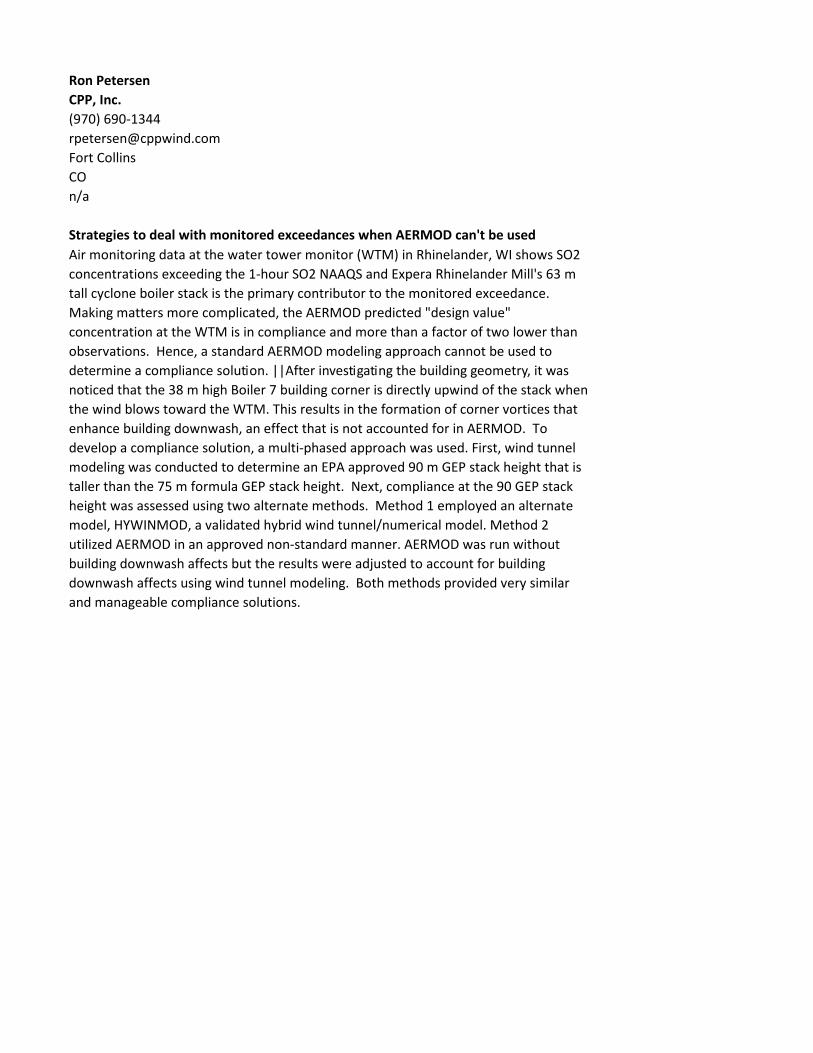
Ron PetersenCPP, Inc.(970) [email protected] CollinsCOn/a
Strategies to deal with monitored exceedances when AERMOD can't be usedAir monitoring data at the water tower monitor (WTM) in Rhinelander, WI shows SO2 concentrations exceeding the 1-hour SO2 NAAQS and Expera Rhinelander Mill's 63 m tall cyclone boiler stack is the primary contributor to the monitored exceedance. Making matters more complicated, the AERMOD predicted "design value" concentration at the WTM is in compliance and more than a factor of two lower than observations. Hence, a standard AERMOD modeling approach cannot be used to determine a compliance solution. | |After investigating the building geometry, it was noticed that the 38 m high Boiler 7 building corner is directly upwind of the stack when the wind blows toward the WTM. This results in the formation of corner vortices that enhance building downwash, an effect that is not accounted for in AERMOD. To develop a compliance solution, a multi-phased approach was used. First, wind tunnel modeling was conducted to determine an EPA approved 90 m GEP stack height that is taller than the 75 m formula GEP stack height. Next, compliance at the 90 GEP stack height was assessed using two alternate methods. Method 1 employed an alternate model, HYWINMOD, a validated hybrid wind tunnel/numerical model. Method 2 utilized AERMOD in an approved non-standard manner. AERMOD was run without building downwash affects but the results were adjusted to account for building downwash affects using wind tunnel modeling. Both methods provided very similar and manageable compliance solutions.

Kasia NowinskiJanicki Bioenergy(702) [email protected] VernonWAYoung professional (35 or younger graduated more than a year ago)
The Janicki Biomass Omni-Processor Model S200Meeting sanitation needs in the developing world is an ongoing challenge. Most toilets in the developing world are located over pits and oftentimes this sewage ends up in a river, stream, bay, ocean, etc. without further treatment resulting in drinking water contamination. To prevent sewage disposal into the environment, Janicki Bioenergy builds machines that utilize sewage biomass as a fuel and convert it into electrical power and clean drinking water. The Omni-Processor Model S100 is capable of processing 12.3 m3 of sludge per day and can produce 10,800 liters of water per day. It can produce 150 kW of power (at maximum power, water production will be limited). This model has been shipped to Dakar, Senegal for measuring real world performance. Currently, Janicki Bioenergy is constructing the Omni-Processor Model S200 which can process 92.3 m3 of sludge per day and can produce 50,000 - 86,000 liters of water per day and 150 - 250 kW of electricity. This talk will provide an overview of the Omni-Processor system. In addition, this talk will address the air pollution controls employed and the applicable air quality requirements for the Omni-Processor Model S200. |
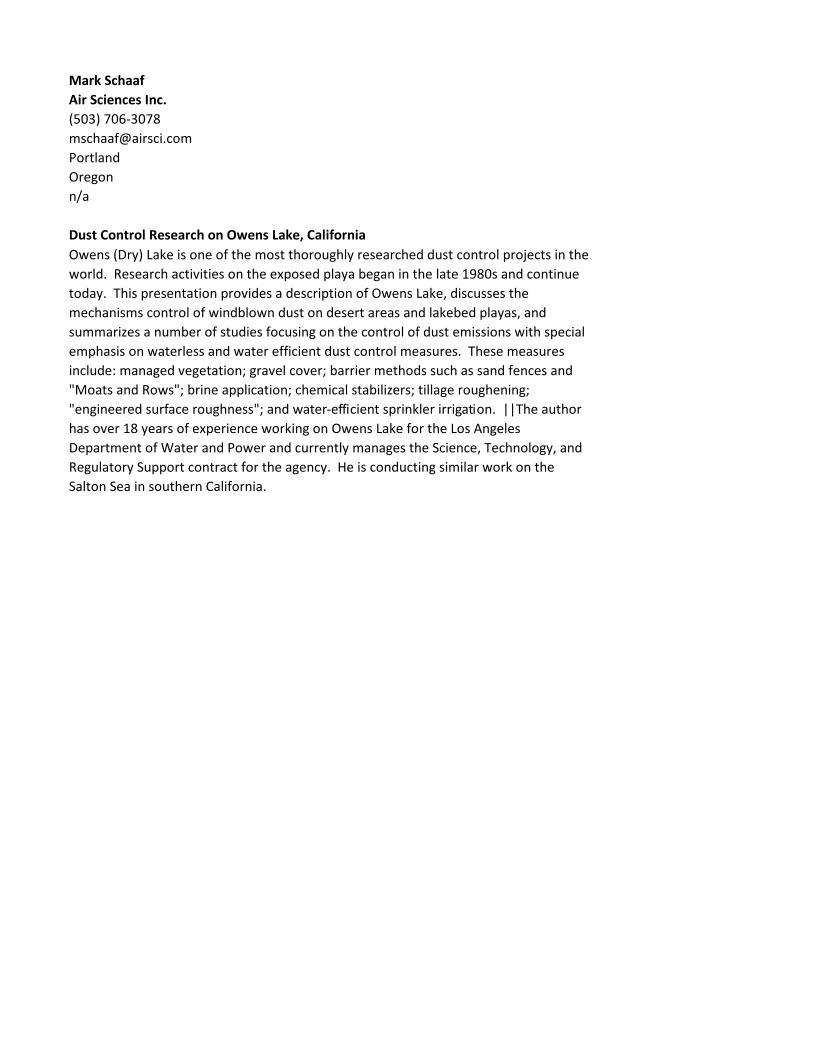
Mark SchaafAir Sciences Inc.(503) [email protected]/a
Dust Control Research on Owens Lake, CaliforniaOwens (Dry) Lake is one of the most thoroughly researched dust control projects in the world. Research activities on the exposed playa began in the late 1980s and continue today. This presentation provides a description of Owens Lake, discusses the mechanisms control of windblown dust on desert areas and lakebed playas, and summarizes a number of studies focusing on the control of dust emissions with special emphasis on waterless and water efficient dust control measures. These measures include: managed vegetation; gravel cover; barrier methods such as sand fences and "Moats and Rows"; brine application; chemical stabilizers; tillage roughening; "engineered surface roughness"; and water-efficient sprinkler irrigation. | |The author has over 18 years of experience working on Owens Lake for the Los Angeles Department of Water and Power and currently manages the Science, Technology, and Regulatory Support contract for the agency. He is conducting similar work on the Salton Sea in southern California.

Judith AaslandTRC Environmental Corporation(425) [email protected]/a
Navigating the Complexities of Electronic Emission Test Data ReportingEPA has implemented an evolving program that requires many industries to electronically create and submit stationary source sampling test plans and final test reports to regulatory agencies using the Electronic Reporting Tool (ERT). Today, there are dozens of source categories and over 36 methods that are subject to electronic reporting requirements. This presentation will demystify electronic reporting requirements, highlight the implications of erroneously reported data, outline best practices for ERT submittals, and explore the future of electronic reporting. |

Sergio GuerraCPP, Inc.(970) [email protected] CollinsCOn/a
How to Comply with EPA's Updated Guidance for SO2 Area Designations EPA is under a Court order to complete the remaining SO2 designations for the rest of the country in three additional rounds. On March 20, 2015 the EPA released an updated guidance for 1-hr SO2 area designations. The two options included are compliance through dispersion modeling or ambient monitoring. Of these two options, dispersion modeling is the fastest and most cost effective one to characterize SO2 air quality. However, this compliance demonstration can be challenging given that AERMOD tends to produce overly conservative concentration estimates. Source characterization techniques and probabilistic techniques may be used to achieve compliance with the 1-hour NAAQS. The use of source characterization and probabilistic techniques in dispersion will be discussed. A case study will be presented to evaluate the use of alternative probabilistic methods to complement the shortcomings of current dispersion modeling practices. This case study includes the use of the Monte Carlo technique and the use of a reasonable background concentration to combine with the AERMOD predicted concentrations. The use of these methods is in harmony with the probabilistic nature of the NAAQS and can help demonstrate compliance through dispersion modeling analyses, while still being protective of the NAAQS. Additionally, the monitoring option will also be discussed.

Daniel BurgardUniversity of Puget Sound(253) [email protected]/a
In-use Emission Measurements of Airport Shuttle Vehicles and Taxi Fleet at Seattle-Tac In-use emissions were measured from passenger vehicles servicing the Seattle-Tacoma International Airport. These vehicles include shuttle vans, town cars, and taxis (primarily composed of the Toyota Prius). In-use emissions were measured using a remote sensing device (RSD) and individual vehicles were measured and identified. Gaseous CO, HC, NOx (both NO and NO2), and NH3 measurements were recorded for approximately 2000 commercial vehicles (550 unique vehicles) September 28th-29th, 2013 as they exited the passenger pickup/dropoff area This fleet of assumingly high-mileage vehicles were composed of gasoline, diesel, gasoline hybrid and CNG vehicles, although the majority of the taxi measurements were from gasoline hybrid vehicles. All fuel types showed premature emissions aging with increased levels of CO, HC, NOx, and NH3. For comparison purposes, another Toyota Prius hybrid fleet of non-taxis were measured the same year with a similar driving mode. The comparison fleet was measured in west Los Angeles and the difference in CO, HC, NOx and NH3 emissions between the same model year vehicles is striking. The presumably high-mileage, Prius airport taxis show significant emissions deterioration after about 4 years of use.
Crispina O'Connor & Ariane BurwellERM(206) [email protected] professional (35 or younger graduated more than a year ago)
Strategies from California: How to reduce corporate environmental and financial risks Since 2012, California has led the way in pricing carbon. Businesses operating in California now incorporate environmental externalities into annual operating costs. As a result, economic growth and carbon emissions have been decoupled. Driven by the need to reduce emissions, it is estimated that by 2016, a quarter of the world's emissions will be covered by varying cap and trade programs. Many US states, including Washington, and governments worldwide are now considering following California's robust program and joining the UN's Framework Convention on Climate Change (COP21). |Given the creation of this challenging environmental and financial market, ERM will present effective management strategies for compliance with cap and trade requirements. These strategies will cover the full cycle of compliance planning and execution, and provide tips for your business. Finally, a case study will be used to share lessons from a representative facility in California. | |Speakers |Ms. Crispina O'Connor is an environmental consultant with ERM, Inc. based in Seattle, Washington within the Air Quality and Climate Change (AQCC) Practice. |Ms. Ariane Burwell is an environmental consultant with ERM, Inc. based in Walnut Creek, California. She has extensive experience advising clients on cap and trade programs around the world.

Peter ReidStantec Consulting Inc.(403) [email protected]/a
LNG Canada's Air Quality Assessment: A Study in ContrastsLNG Canada is proposing to construct and operate a liquefied natural gas facility in the District of Kitimat, British Columbia. It includes an LNG processing and storage site, and a marine terminal. The EA certificate was issued on June 17 2015. | |Kitimat (pop. 8,335) is located on BC's North Coast, a region of temperate rainforest and rugged coastal terrain. RioTinto Alcan, the main employer, is just finishing its $2B Kitimat Modernization Project. LNG Canada is one of several LNG facilities proposed for the area. It is located adjacent to the RTA smelter site. | |Modelling of both CACs (SO2, NO2, CO, PM2.5, H2S) and acidic deposition was completed. Speciated VOCs were modelled, and supplemental analyses of CACs was undertaken in support of an HHERA. While ozone was raised as a potential substance of interest, subsequent discussions resulted in it being screened out. All modelling was carried out using the CALPUFF modelling system driven by a 3-year WRF derived CALMET data set. | |Concurrent with this assessment the Province conducted a separate CALPUFF assessment driven by a 3-year MM5 derived CALMET data set. A third CALPUFF assessment driven this same MM5 derived CALMET data set was conducted earlier in support of RTAs modernization project. | |Discussion will focus on the effects of SO2 and NO2, both for the facility alone and cumulatively. The acidification and HHERA work are also described. The LNG Canada findings will be compared to the MM5 based CALMET modelling.

Maarten SchreuderAir Sciences Inc.(971) [email protected]/a
Evaluation of Surface Roughening through Tillage as a Measure to Reduce Fugitive Dus Fugitive dust emissions from agricultural fields and naturally open areas in dry, windy climates can contribute significantly to episodic high atmospheric concentrations of particles with an aerodynamic diameter less than ten microns (PM10), both in the United States as well as internationally. This presentation discusses the results of a 3-year field study to evaluate surface roughening through tillage as a measure to reduce PM10 emissions from aeolian processes. The study was located on Owens (dry) Lake, California. A 200-acre site with clay soils was tilled and monitored for meteorology (wind speed and direction), sand motion (saltation), PM10 concentration gradients, surface conditions, and visual dust plumes. Study results show that tillage successfully reduced PM10 emissions through the elimination of saltation and the creation of hard, stable crusted and clodded surfaces.
Anne JohansenCentral Washington University(509) [email protected]/a
Pilot Air Quality Study in Ellensburg During Winter 2014/15Ambient air pollution has been linked to cardiovascular and respiratory disease. Steadily declining air quality in rural Kittitas Valley in Central Washington has recently drawn federal attention in this regard and efforts are in place to increase understanding of sources. Here, mobile sampling was carried out to establish temporal and geographical patterns of fine particulate matter (PM2.5) during cold winter days when stagnant air traps pollutants in the valley. Black carbon (BC) was monitored to make potential inferences about particle sources. Five sampling trips, encompassing 25 hours of mobile monitoring in the Ellensburg area were completed January-June, 2015. Results indicate that (i) the most prevalent source of PM2.5 stems from wood burning for home heating during cool afternoons/evenings, and (ii) vehicular emissions represent a smaller but significant amount of PM especially during rush-hour traffic and when temperatures are elevated and home heating is absent. The stationary PM2.5 EPA monitor on the roof of the Community Center generally under-predicts concentrations obtained during mobile monitoring. Ellensburg High School students designed additional sampling projects with the personal BC monitor. With this new data, the community is better positioned to formulate strategies on how to best mitigate against winter air pollution.

Lawson FiteAmerican Forest Resource Council(503) [email protected] ORn/a
Climate Change Regulation: States of PlayClimate change regulation is in flux at the state, regional and federal levels. This talk will provide an overview of the status of regulations in legislatures, agencies and courts, including Oregon's Low Carbon Fuel Standard, California cap & trade, and EPA climate rules. Recommended for attorneys, compliance officers, and anyone interested in climate change regulation.

Elizabeth RaneyPNNL(206) [email protected]/a
Ultraviolet Treatment Disinfection of Wastewater at a Marine Research LaboratoryThe Marine Sciences Laboratory (MSL) in Sequim, Washington operates a plant to treat wastewater from research operations. Seawater and freshwater are both used for research activities that are primarily related to marine and coastal resources and wastewater to the plant includes both of these components. A treatment plant is necessary because research may involve non-native species and organisms or other contaminants and the treated wastewater is discharged into Sequim Bay on the Strait of Juan de Fuca of the Pacific Ocean. The plant has included an ozone treatment system for disinfection followed by filtration with activated carbon. Ultraviolet (UV) treatment was installed in 2013 to replace ozone for disinfection, and sampling was conducted to verify the disinfection rate achieved by the UV system prior to bypassing the ozone system. Sampling results indicated that over 99% disinfection rates were achieved with the pre-treatment UV system based on heterotrophic plate count (HPC) analysis. The mean disinfection rate was 99.94% with a 95% confidence interval of ± 0.04%. The data also passed a recommended statistical test using the log of the data to determine that the system provided 99% or better disinfection rates with 95% confidence.

Graham VanderScheldenWashington State University(253) [email protected] (In school or graduated within one year)
Using a PTR-MS Adapted to Use NO+ as the Reagent Ion for Measurement of Long Cha The PTR-MS is an instrument used for making measurements of volatile organic compounds in real time, using the proton transfer reaction between H3O+ and organics to create ions and a mass spectrometer to count these ions. Making measurements of organic compounds using a PTR-MS can be complicated by molecular fragmentation caused by the dissociative nature of many proton transfer reactions in the PTR-MS. Additionally, because ions are counted by unit molecular weight, positive interferences can occur as a result of compounds and/or fragment ions sharing a molecular weight. Our PTR-MS has been modified to allow NO+ to be used as a reagent ion instead of H3O+. We have found that NO+ yields a much simpler mass spectrum for n-alkanes than H3O+, which allows individual alkanes to be identified in the PTR-MS mass spectrum. Another advantage of using NO+ as a reagent ion is that it circumvents mass interferences that occur between aldehydes and alkylnaphthalene compounds in the H3O+ mass spectrum. Measurements of fresh diesel exhaust were made using the PTR-MS equipped with NO+ as the reagent ion to portray the advantage of using NO+ to identify these compounds in a complex sample.

Renuka SainiDr. Bhim Rao Ambedkar University, Agra, India(971) [email protected] Pradeshn/a
Surface Ozone in Rural Agra over a Two-Year Period: Characteristics, Trends and Ozone Rapid economic development and an increasing demand for food in India have drawn attention to the role of ozone at pollution levels on crop yields. This study helps to understand characteristics, diurnal and seasonal cycle and trends of surface ozone better at rural site of Agra (India), the city of 'Taj Mahal' (2710'N, 78º05'E, 169 msl), from January 2012 to December 2013. Seasonal variations in surface ozone show maximum concentration in the summer (49.4 - 51.2 ppbv) followed by winter (23.7-28.0 ppbv). O3 has an inverse relationship with its precursor. The high NO2 values were observed in the post-monsoon (20.6 - 44.5 ppbv) followed by winter (17.2 - 39.3 ppbv). Daytime maxima in ozone concentration were recorded between 1200 and 1400 h, whereas morning and evening hours showed lower concentrations of ozone. The average rate of increase in ozone concentration between 09 and 12 h has been observed to be 7.1 ppbv h−1. We find that the daily maximum and daytime 8-h (10-17 h) ozone levels are increasing at a rate of about 1.7 (± 0.7) and 1.3 (± 0.56) ppbv y−1, respectively. The AOT40 (Accumulated exposure Over a Threshold of 40 ppbv) threshold was exceeded significantly during winter (D-J-F) and pre-monsoon (M-A-M) (Rabi crop growing season) season in India. Calculated backward trajectories for the days with maximum O3 concentration clearly pointed out the transport from the NW and W to S/SE and SW direction at Agra in different seasons.

Mervyn DaviesStantec Consulting Ltd.(403) [email protected]/a
Air Quality Assessment Approach for the Alberta Oil Sands RegionThe development of bitumen extraction facilities in the Athabasca oil sands region located in northeastern Alberta has been the subject of provincial, national, and international interests. Air quality changes associated with oil sands developments are typically examined by multistakeholder groups to address common regional issues and by industry to obtain environmental approvals. This presentation provides an overview of the approach and the findings associated with a recently submitted regulatory submission for the approval of an integrated oil sands mining and extraction operation. Specifically, the following assessment items are discussed: air quality issues examined; spatial and temporal boundaries; linkages to other disciplines; project mitigation; emission inventory preparation; use of ambient monitoring data; meteorological modelling approach; dispersion modelling approach; air quality results and presentation; and follow-up management and monitoring.

Sarah WardRebellion Photonics(713) 218-0101 [email protected]/a
Automated Gas Leak Detection and Monitoring using a Gas Cloud Imaging (GCI) Video Current gas leak detectors are ineffective safety monitoring and decision making tools. Alarms are often difficult to verify and require significant resources (instrumentation and trained personnel) to identify the size, direction, and origin of leak. In bad weather conditions it becomes even more difficult to find the leak and verify that there had been a true positive alarm and not a false positive alarm. Due to these difficulties, often times "problematic" gas leak detectors are de-tuned rendering them useless and/or ignored until more resources can be brought in to find the leak. This hinders the decision making process and increases risk and lost product. To address this need, Rebellion Photonics has developed an innovative, fully automatic, gas leak detection video camera system that can be deployed around rigs and refineries for continuous (24/7) monitoring. Instead of providing a single alarm value like current gas leak detectors, the gas cloud imaging (GCI) camera provides operators with easy-to-interpret false-colored video showing the location, direction, size, and concentration of a gas leak. The GCI camera is a true decision making tool that can operate in all weather conditions as well as day and night as it does not require any external light sources. The camera's technology is based on Rebellion Photonics' patented "snapshot" hyperspectral imaging approach which can capture a gases unique infrared absorption spectral fingerprint.

Liaqat KhanNorthwest Hydraulic Consultants(206) [email protected] 98188n/a
Three-Dimensional Computational Fluid Dynamics Model Analysis of Flue Gas Dispersi A three-dimensional computational fluid dynamics model simulating the transport, dispersion, and interaction of flue gas plumes from three stacks is presented in this paper. The modeling approach considers the flue gas as a single-phase, miscible mixer of air and 2,000 ppm of nitrogen dioxide (NO2), the pollutant of interest. The plumes at 277°C temperature are discharged in the atmosphere by a 50-m and two 70-m high stacks with exhaust velocity varying from 7.5 to 15 m/s. The model indicates the exit momentum and buoyancy are sufficiently high to prevent stack-tip downwash. The vertically rising plumes are deflected by the ambient wind and dissipated by turbulence. These plumes merge a short distance downstream and form a cross-sectional shape resembling that of an inverted kidney, as reported in previous studies. The entrainment of ambient air dilutes the NO2 concentration to 20 ppm and reduces the temperature by 250°C in a horizontal distance of 250 m. At the same time, the plume rises by 50 m and the NO2 concentration and temperature increase on the roof of a 50 m high building on the downstream are undetectable. The model study confirms effectiveness of the stacks in dispersing the flue gases.

David L. Elam, JrTRC(919) [email protected] HillNCn/a
The Emerging Role of the Citizen Scientist in the Field of Air Quality ManagementOver the past two decades, and particularly in recent years, we've witnessed the growth of the citizen scientist community. A citizen scientist is a volunteer - who may or may not have scientific training - who collects or processes scientific data in connection with research or an investigation. The work of this community has been recognized in a variety of scientific disciplines including astronomy, ecology, and wildlife biology. | |Advances in ambient air quality measurement technology, coupled with the power of smart phones and cloud computing, have provided a new opportunity for citizen scientists. Today, we see citizen scientists collecting and reporting ambient air quality data using measurement technology that can be purchased at a fraction of the cost of Federal Reference Method equipment. In many cases, these data are being collected without the establishment of data quality objectives that frame the proper collection and interpretation of these data. | |This presentation will examine the emerging role of the citizen scientist, highlight some citizen scientist ambient air quality measurement programs, identify organizations that support the citizen scientist community, and offer guidance on how the professional scientific community can work with the citizen scientists to improve expectations for and the quality of citizen scientist data. |
Melissa McAfeePSCAA(206) [email protected]/a
Through the Looking Glass - Infrared Cameras in the FieldPanel Session with Zach Hedgpeth, PE, EPA Region 10, Jason Bouwman, Northwest Clean Air Agency and Melissa McAfee, Puget Sound Clean Air Agency | |Over the past year our agencies have used an IR camera to look at air emissions in the field. Using this newer technology we were able to see |•Combustion emissions |•Digester gas leaks |•Fumes from open paint cans and from spray painting |•Gasoline leaks from cars fueling, storage tanks, loading terminals, delivery trucks and refineries |•Looping plumes |•Bio-filter activity |•And more |Although expensive, the camera is portable and mostly easy to use. This session starts with an overview of the camera technology and uses. Then papers follow to show video examples of our findings. The session will conclude with a panel discussion to explore current and future needs for this evolving technology. |

Matt MoroneyLandau Associates, Inc(425) [email protected]/a
The Challenges of Voluntarily Adopting Tier 4 Emissions Controls for Backup GeneratorVoluntary adoption of Tier 4 emissions controls for large diesel-fired standby electrical generators is becoming more common for companies aiming to be the "good neighbor" and/or anticipate future regulatory requirements. This presentation will summarize what emissions controls are currently available, why they are being used, and how their use is being integrated into air quality permits for facilities in Washington. Early indications show there are significant operational, regulatory, and financial hurdles that need to be overcome before widespread use on standby and emergency generators is practical in Washington. Early adopters have found there can be a financial disincentive when elevated monitoring costs are incurred after installing a more protective control technology.

Maria ZatkoUniversity of Washington(206) [email protected] professional (35 or younger graduated more than a year ago)
Examining the influence of snow photochemistry as a source of nitrogen oxides to the Nitrogen oxides (NOx) and volatile organic carbon (VOC) emissions from oil and gas extraction activities in remote Utah (Uintah Basin) play a major role in wintertime ground-level ozone exceedance events (up to 140 ppb). Ozone exceedance events occur only when the ground is snow covered, suggesting that snow may provide an additional source of NOx to the boundary layer. Vertical profiles of nitrate concentration, nitrate isotopes (δ15N), and light-absorbing impurities from snow collected during the Uintah Basin Winter Ozone Study 2014 (UBWOS2014) are incorporated into a snow photochemistry column model to examine the influence of snow nitrate photolysis on the boundary layer NOx budget in the Uintah Basin. Snow-surface δ15N(NO3-) measurements range from -5‰ to 10‰ and suggest that this budget is dominated by anthropogenic NOx emissions, except directly following fresh snowfall events. The modeled daily-averaged fluxes of snow-sourced NOx range from 4.1x10⁷-9.6x10⁸ molec cm-2 s-1 and are most dependent on surface snow nitrate concentrations. Anthropogenic NOx emissions estimates for Uintah and Duchesne counties reported in Ahmadov et al. [2015] are over 200 times higher than the snow-sourced NOx emission estimates presented here, implying that snow photochemistry can be neglected when developing ozone reduction strategies for the Uintah Basin.

Nicole BriggsGradient(206) [email protected] - Washingtonn/a
Framework for Evaluating the Relative Impacts of Surface Impoundment Closure OptioCoal-powered utilities are receiving increased pressure from regulators and the public to close unlined surface impoundments containing coal combustion residual (CCR). The two primary options are in-place closure, with capping and engineering controls, and excavation of the CCR for transport to and re-disposal in a lined landfill. To help inform these closure options, we have developed a practical, science-based decision tool that comprehensively evaluates the potential impacts to human health and the environment associated with both closure scenarios. The framework examines impacts to worker safety and evaluates resource use; it also examines more traditional media-specific exposure pathways, including impacts to groundwater, surface water, and outdoor air. Relying on the application of a transparent, scientifically defensible approach, the framework enables utilities to develop closure plans that minimize human health and environmental impacts while generating data that can be used to inform regulators and the public. This presentation introduces the key framework steps and provides an overview of its application to a hypothetical utility site, with an emphasis on evaluating potential air impacts for the closure scenario alternatives.

Maggie CorbinPuget Sound Clean Air Agency(206) [email protected]/a
Lessons Learned - Permitting Marijuana Growing in the Puget Sound regionThe Puget Sound Clean Air Agency received their first request to process an air permit from a marijuana producer in June of 2014. Since that time, they have received more than 25 permit applications. This presentation will summarize the broad range of options that have been proposed for controlling VOCs and odors from these operations, barriers to permit issuance, and how enforcement plays into the permitting process.

Stephen NelsonCoal Creek Environmental Associates(425) [email protected]/a
Feeling the Heat and Increasing the Pressure - Sewage Sludge Incineration Reaching th On March 21, 2011 EPA promulgated an Emission Guideline (EG) for Existing Sewage Sludge Incinerators (SSIs), in accordance with Section 129 of the Clean Air Act. According to provisions of the Clean Air Act, this set in motion a process in which EPA was to prepare a Federal Implementation Plan converting the EG into enforceable rules by March 21, 2013, with a compliance date of March 21, 2016. | |Operators of SSIs are faced with many challenges in meeting this deadline. This presentation will cover many of the challenges facing operators of sludge incinerators in Region X, including: | |•Options to comply with numeric standards. |•Provisions of the proposed rule that are inconsistent with reality. |•Procedural difficulties associated with the lack of a Federal Implementation Plan that have made it impossible to for most SSIs comply with the rule by the deadline date. |

David SuessDSG Solutions(206) [email protected]/a
Lessons Learned Implementing the Recently Promulgated Continuous Opacity Monitor Continuous Opacity Monitoring Systems (COMS) quality assurance (QA) requirements within 40 CFR 60 Appendix F, "Procedure 3" became effective on November 12, 2014 for stationary sources that use a COMS to demonstrate compliance with a 40 CFR 60 opacity emissions limit. The regulation describes (a) the need to develop a COMS quality assurance/quality control (QA/QC) program, (b) required daily, quarterly and annual QA testing requirements, (c) a required corrective(?) action program, (d) recordkeeping and reporting requirements, as well as (e) temporary opacity monitor utilization requirements. To supplement the rule, the United States Environmental Protection Agency (USEPA) also published a document with suggested COMS post maintenance diagnostic tests. Prior to the promulgation of this regulation, QA/QC requirements were largely developed by state agencies or within site specific QA/QC plans, which led to inconsistencies between facilities. Based on extensive experience assisting numerous facilities implement Procedure 3, we will present (a) a review of the COMS QA/QC regulatory requirements, (b) numerous regulatory clarification responses provided by USEPA, (c) challenges implementing the COMS QA/QC program and (d) lessons learned throughout the implementation process. Special attention will be given to the primary zero alignment, which is the annual quality assurance testing requirement that must be conducted prior to the end of 2015.

Rex ThompsonDSG Solutions(206) [email protected] professional (35 or younger graduated more than a year ago)
Continuous Emission/Opacity Monitoring System (CEMS/COMS) and Data Acquisition Continuous Emission/Opacity Monitoring Systems (CEMS/COMS) and Data Acquisition and Handling Systems (DAHS) are critical components of many facilities' air compliance programs. A strong working knowledge of the hardware, software, and applicable regulations is required to fully understand these extremely complex systems; further, many who work around these systems only do so on a limited basis. As such, shortcomings in these systems often go unnoticed; in some cases such shortcomings may consist of potentially serious compliance issues that come to light during a compliance audit. Thus, facilities may want to periodically pursue internal or third-party audits of their CEMS/COMS/DAHS and/or their air program in general. In particular, a review may be warranted for numerous reasons such as permit or regulation revisions, changes in staff, hardware/software updates, facility purchase/expansion, preparation for an upcoming compliance audit, or due to a general lack of confidence in the existing program/systems. DSG Solutions has performed CEMS/COMS/DAHS audits at numerous power generation facilities across the country in recent years and we will share some of our experiences and findings.

Dan BurgardUniversity of Puget Sound(253) [email protected]/a
Using Sewers as a Tool to Understand Legalized Retail Sales Effects on Marijuana Cons Marijuana is the most popular illicit drug in the world. In recent years, laws have been passed both at the U.S. state level and in another country legalizing the growth, production, and sale of recreational marijuana in Colorado and Washington (2012), Uruguay (2013), and Alaska, Oregon, and Washington DC (2014). This unprecedented test comes with no direct scientific data available to understand how these new recreational use laws will affect marijuana consumption and public health. This paper will attempt to provide a timely understanding of how initial sales of adult recreational marijuana impact its use within a population. Using wastewater-based drug epidemiology, we will present preliminary measurements of the aqueous sewer available metabolite of the main active ingredient in cannabis. Samples are from two wastewater treatment plants serving a city of approximately 200,000 inhabitants in Washington State. Over 100 days are sampled annually with every week represented, as well as periods of daily sampling. Samples were collected starting eight months before the first recreational retail stores opened. A unique aspect of Washington State marijuana legalization is the use of a traceability system to record the mass and potency for each product sold. Thus a total mass of active ingredient legally sold can be calculated and compared with wastewater derived data to provide a mass balance and thus an estimate of market share of legal, recreational marijuana.

Samantha HutchesonMontana Tech(406) [email protected] (In school or graduated within one year)
Characterization of Heavy Metal Removal from Aqueous Solutions using Natural Fibers Heavy metals are found in varying concentrations in water sources including mining waste streams. The heavy metals need to be removed to meet the discharge standards and or to reduce any health effects. This research is focused on using a natural fiber as a substrate and incorporating nano metallic particles to remove toxic metals from water. The natural fibers with and without nano metallic particles were subjected to various loads of toxic metals, specifically copper, cadmium, nickel and zinc to evaluate the performance of the filter. The preliminary results indicate that the toxic metals will compete for access to active sites on the fibers and that for a variety of reasons; some will be removed at higher rates than others. At concentrations of about 10 mg/l, copper was removed more effectively than the other three metals when they were all present at the same concentration of 10 mg/l. Research at lower concentrations is still ongoing.

Garrett CraigMontana Tech of the University of Montana(406) [email protected] (In school or graduated within one year)
Characterizing Nutrient Loading and Heavy Metal Transport for Grove Gulch in Butte, MNutrients in streams are essential to the aquatic life that inhabits them; however, excess nutrients can lead to degradation of the aquatic ecosystem. Concentrations of heavy metals that exceed the local surface water quality standards are also extremely toxic to the entire stream ecosystem. | |Grove Gulch, a tributary to Blacktail Creek, drains primarily open range, landfills, and reclaimed mining lands. Grove Gulch flows approximately 6 miles before joining Blacktail Creek in Butte, MT. Historic mining in the Grove Gulch watershed has led to significant inputs of metals into the stream, particularly zinc, copper, lead, arsenic, and iron. | |To characterize Grove Gulch, surface water and sediment samples were collected at different locations along the length of the stream, as well as at different flow conditions. Samples were then analyzed for nutrients and heavy metals. | |From the data analysis it appears that nitrates (during runoff) and metal concentrations (during base flow and runoff) are significantly elevated downstream of the landfills and abandoned mines. The largest concentrations of nitrates and phosphates and certain metals occurred during storm runoff events, thus resulting in a substantial increase in loading. Abandoned mines and landfills in the watershed appear to be possible source of nitrates and metals. |
Michael G. Byers CRETE Consulting Inc, PC(206) [email protected]/a
Options for Managing Polychlorinated Biphenyl (PCB)-Impacted Building Materials The management of building materials that are impacted with PCB's might seem like a difficult and costly issue, however, utilizing recent EPA TSCA guidance updates can make this process much more straightforward and less costly. |PCBs were used in many building materials between the 1950s and the 1979, most widely in caulking and paint, because of their ability to improve plasticity. Over time, PCBs present in building materials can leach into the surrounding materials and can also deteriorate and spread contamination. |An evaluation of demolition debris management options was conducted for an 117,000-square foot concrete warehouse with PCB-contaminated building materials. The demolition evaluation included a pilot-scale abrasive-blasting test for removing PCB source material and an evaluation of recycling, encapsulation, and landfill disposal options. The results of these evaluations were used to guide management options for this structure and can also be extrapolated to other similar structures. |For the warehouse, based on the results of this evaluation and the recent EPA TSCA reinterpretation, the PCB-contaminated building material was defined as PCB Bulk Product Waste and disposed at a Subtitle D landfill even with some material samples suggesting TSCA-level PCBs. This resulted in significant cost savings relative to the other management options. Based on this case study, for other structures use of the EPA TSCA reinterpretation should be strongly considered. |

Dylan UeckerMontana Tech(406) [email protected] FallsMTStudent (In school or graduated within one year)
Application of QUAL2K to a Macrophyte Rich Effluent Dominated SystemSilver Bow Creek (SBC, Blacktail Creek to Warm Springs Creek) is a small urbanized stream in western Montana (MT) identified as impaired for nitrate, total nitrogen and total phosphorus on the 2014 303(d) list. Enrichment of SBC occurs primarily from a single municipal point source that results in excessive primary production. Macrophyte growth, large diel water-quality swings, and nightly hypoxic conditions impair aquatic life uses. The objective of this study is to apply QUAL2K (a surface water-quality model) to a 5.6 km long reach of SBC to predict in-stream dissolved oxygen (DO) concentrations under different nutrient loading scenarios. Preliminary model runs have produced poor results, however, due in part to a large macrophyte biomass present in SBC. Photosynthesis during the day drives DO well above saturation and contributes to hypoxic conditions at night through respiration. Currently QUAL2K does not support macrophytes, so approximations were made using closely spaced point sources with diurnal variation to accommodate the macrophyte DO source/sink. The presentation will discuss a method that has been devised to account for macrophytes in the QUAL2K model along with presenting results for the different nutrient load scenarios. Based on this work, the model code should be revised before applied to similar macrophytes dominated streams.

J.D. McAlpineRamboll Environ(775) [email protected] MoinesWAn/a
Open storage pile emission factor development using a combination of CFD modeling a Fugitive emissions are an important air quality issue for facilities that handle loose granular materials. For environmental assessment and permitting, fugitive emissions are typically estimated using AP-42 or other published emission factors. However, these factors may not be accurate given that the rate of fugitive emissions from open storage piles is highly variable and site dependent. Emission rates are a function of material composition, pile shape, soil moisture, pile age, meteorology, and other dynamic factors. | |In this study, computational fluid dynamics (CFD) modeling was used to simulate wind flow and dust emission at a facility with large open storage piles. On-site particulate matter measurements were used to verify and tune the CFD model. The modeling and measurements are used to build an emission factor model for the facility using a Monte-Carlo scheme to account for the range of input uncertainties. The model is used to estimate annual fugitive emissions at a facility to assist with environmental assessment of a planned facility expansion. The annual estimates are compared to estimates using AP-42.

Jason Poulsen, PWSGeoEngineers, Inc.(208) [email protected]/a
Reclaiming Seiad Creek After 100+ Years of Placer MiningSiskiyou County California has been a source of gold and platinum for more than 100 years. In addition to gold, platinum also been recovered from the Klamath River and its tributaries, including those in the Seiad Valley. Seiad Creek also is home to another valuable natural resource: Coho salmon. | |Seiad Creek currently is one of the most productive Coho salmon tributaries to the Middle Klamath subbasin. While portions of the larger Seiad Creek system possesses relatively high quality Coho habitat, salmon habitat in other reaches of the creek have been adversely impacted by historic placer mining activities and construction of multiple non-engineered cobble levees. In addition to negatively impacting Coho spawning and rearing habitat, these levees have breached multiple times during high flow events, flooding the small town of Seiad, and causing erosion and aggradation on neighboring properties. | |The Seiad Creek Habitat Enhancement Project was developed with initial funding provided from PacifiCorp and as a joint effort between the Karuk Indian Tribe (Karuk Tribe) and private property owners. The purpose of the project was to enhance and increase juvenile and adult Coho salmon habitat while at the same time reducing erosion and flooding events on Seiad Creek. The project provided an opportunity to combine the Karuk Tribe's desire to improve Coho salmon habitat and neighboring property owner's needs to reduce loss of land due to erosion and flooding events.

Chris AtherlyRamboll-Environ(406) [email protected] (In school or graduated within one year)
Impact of a Changing Climate on Fine Particulate Concentrations in Butte, MontanaA model was developed to assess the potential change in fine particulate (PM2.5) concentrations in Butte, Montana over the course of the 21st century as changes in local climate and particulate emission rates begin to take effect. The EPA AERMOD regulatory model was run using NARCCAP climate data for time periods through 2070, and the results were compared to the National Ambient Air Quality Standards to determine if there is the potential for future impacts to human health. Additionally, the effectiveness of a wood stove change out program was evaluated to determine its ability to reduce PM2.5 concentrations below regulatory standards.

Bart BrashersRamboll Environ(425) [email protected]/a
Changes to Appendix W - the Modeling GuidelinesChanges to 40 CFR 51 Appendix W, the Modeling Guidelines, are underway. Proposed Guidelines were published in July 2015, and a public hearing (the EPA 11th Conference on Air Quality Modeling) was held in August. Comments were due in October, so we're on track for an effective date of July 2016. This talk will summarize and interpret the proposed changes, and how it might affect modeling for your future permitting projects.

James StrainAmbiLabs(250) [email protected] AlberniBCn/a
Design and Deployment of a Mobile Monitoring Vehicle for the Real-Time Measureme During the autumn of 2015 a mobile monitoring vehicle was constructed for use of the measurement of indicator gases and aerosols in the oil and gas production region of Northern British Columbia, Canada. The vehicle was constructed to allow for autonomous operational capabilities, to provide a stable internal operational environment for the monitoring instrumentation, and built with additional protections to allow for continuous sampling with the vehicle in motion in on and off roadway uses. The inlet manifold of the vehicle was constructed to create a split sample stream for the measurement of both gaseous and aerosols parameters and was designed for stationary and in transit sampling. Initial deployment of the vehicle will occur in the winter of 2015. Results of vehicle area sampling measurements will be compared with existing stationary monitoring sites.
Erik NaylorMaul Foster & Alongi (971) [email protected]/a
NM-363 Tracer Study, Bunker Hill Superfund Site, East Fork Ninemile Creek BasinIdentification of ongoing sources to contaminated sites is perhaps the most critical step to ensuring effective and lasting cleanup actions. At the Bunker Hill Superfund Site in Idaho, potential ongoing sources of metals to a highly impacted watershed have been evaluated through a series of investigations and an ongoing water quality monitoring program. Currently, the source(s) of metals loading to EFNM Creek downstream from mine waste piles and adjacent to a seep (NM-363), are not sufficiently characterized. Site observations, investigations, water quality monitoring programs and historical research identified a number of potential loading sources in addition to the Interstate Millsite and/or Tamarack Complex waste piles that may be contributing to EFNM Creek metals loading through the seep. Sources may include the Interstate Millsite and/or the Tamarack Complex. A groundwater tracer study was therefore designed and implemented to substantiate the mine waste piles as a primary source of metals into the seep, and subsequently the EFNM Creek, and to eliminate the possibility of the seep being an additional source.

Dan MaharNorthwest Clean Air Agency(360) [email protected] VernonWAn/a
GHG RACT for Petroleum RefineriesOn June 28, 2014, Chapter 173-485 WAC became effective requiring reasonably available control requirements (RACT) for greenhouse gas emissions at petroleum refineries located in Washington state. The rule was the first of its kind in the United States to comprehensively regulate greenhouse gases from petroleum refineries. This presentation will explain how and why the rule was developed, and what the five effected refineries are doing to comply with the RACT rule.

Ryan TobiasCascade Earth Sciences(541) [email protected]/a
Monte Cristo Mining Area CERCLA Remval ActionThe Monte Cristo Mining Area (MCMA) is situated in a remote area of the northern Cascades in eastern Snohomish County. Elevated concentrations of legacy contaminants, primarily arsenic and lead, have been documented in a 9.5-mile stretch of the South Fork Sauk River and tributaries originating within the MCMA. The Removal Action was initiated in June 2015 to address physical and chemical hazards associated with nine features consisting of a mill, assay shack, mines, ore collection terminals, and haulage ways. Waste materials from the majority of near features were excavated and hauled to the repository from July through September. Removal of about 2,000 yards of waste rock from the Pride of the Woods Mine (located within the HMJ Wilderness) necessitated the use of a heavy-lift helicopter to move excavators and haul material for transport to the repository. Following placement, the repository was lined and covered with a three-foot soil cap to promote establishment of early seral vegetation. Heavy recreational use, coupled with concerns over archaeological and wilderness resources, and endangered species complicated Removal Action objectives.

Brad HermansonGEI Consultants(503) [email protected]/a
Managing Project Uncertainty and ChangeWe like to think that change doesn't happen on our projects. We gather all our stakeholders and work hard to plan our projects. We generate plans that we feel are bullet-proof. Everything should go perfectly, right? Well, hate to burst your project management bubble, but NO project goes perfectly. None. | |Why can we say that so definitively? Because there are lots of kinds of uncertainty and change that we face on projects. Some things are tiny and are the little things that happen each day (you know, when you have a crisis deadline and the printer bonks out). And then there are the bigger changes, some we can predict and others we could sit in a room for months planning and never predict. | |This talk explores the sources of uncertainty we face on projects and the different kinds of change that happen on projects. Once we have identified the different types of change, we will face reality that every kind of change typically happens on projects, and our main skill as a project manager is to adjust to the balances of change. The talk will provide examples and we'll get into a healthy discussion of how change affects us. |

Allyson JackovicsPort of Seattle(206) [email protected] (In school or graduated within one year)
Let Living Walls live rent free: Selling green where it can't sell itselfIf it can't produce clean energy, save water or un-melt the icebergs, why should you care about living walls? Living walls are interior or exterior artistic vertical gardens, or a wall full of plants. Studies show that living walls can improve air quality, reduce stress, and even potentially increase retail revenue, but there is comparatively little ROI or direct environmental benefit compared to other green building infrastructural opportunities. Yet living walls present the opportunity to visually promote an organizations' sustainability and become a dynamic art piece. Selling the idea of a living wall to decision makers can be more difficult than selling other environmental efforts with more direct impacts. This presentation will discuss how to prioritize green building features and infrastructure and focusing on project priorities and your business' strategies and objectives.

David WarrenPNNL(509) [email protected] 99352n/a
Sampling and Monitoring in Support of a Ground-Source Heat PumpResearch facilities constructed in 2010 incorporated a novel technology that uses groundwater's constant temperature to provide centralized heating, cooling, and hot water for the buildings. The ground-source heat pump (GSHP) is an open-loop heating and cooling system that operates by withdrawing groundwater from four production wells, routing the water through a building heat exchanger system, then reinjecting it into the aquifer through four injection wells. The GSHP is a key component in the sustainable design, construction, and operation of the building that was awarded gold certification by the U.S. Green Building Council's Leadership in Energy and Environmental Design program. |Because the water is re-injected back into the ground, the local regulatory agency issued a temporary state waste discharge permit to have the groundwater monitored for temperature changes and potential influence on pollutants from underground contamination plumes. Sampling and monitoring focuses on contaminants found in regional contaminant plumes that might be drawn toward the ground-source heat pump during groundwater withdrawal and on potential increases in the temperature of groundwater that will reach the Columbia River. This presentation provides a brief history of operations, discusses the issues related to these sampling and monitoring activities, and presents sampling results. |
Benjamin SchmidtMissoula City-County Health Department(406) [email protected]/a
Seeley Lake Wood Stove Changeout Program Seeley Lake is a small mountain valley community with frequent winter temperature inversions that trap wood smoke from home heating on the valley floor. In 2010 the Seeley Lake Community, along with Missoula County, took a leading role to address the wood stove smoke problems that were found in Seeley Lake neighborhoods. Over several years, the Seeley Lake Community Council, Seeley Lake Community Foundation, Missoula County, other agencies, and businesses worked together on education efforts and a wood stove change program that improved the Seeley Lake's air quality. Strategies used in Seeley Lake's stove change out program are applicable to other communities. | |A video on Seeley Lake's wood stove change out program can be found on You Tube.

Steve Van SlykePuget Sound Clean Air Agency(206) [email protected]/a
RACT Determination Process for a Glass PlantThe agency just issued a general regulatory order to establish RACT emission limits for particulate matter and sulfur dioxide on two glass melting furnaces at a container glass plant in Seattle. This presentation will review the details that led to the initiation of the process, the technical analysis necessary to complete the process, and the criteria used to make the final determination. The work is subject to appeal, but it is possible to highlight the documented work up to the date of the adoption of the RACT order.

Merlyn HoughLane Regional Air Protection Agency(541) 736-1056 ext. [email protected]/a
The Future of Electric Vehicles Is Here!The future of electric vehicles is here! No longer are we worried about "Who Killed the Electric Car?" but rather we are experiencing "The Revenge of the Electric Car" with exciting developments to overcome the old perception barriers of the range, performance, cost and style of electric vehicles. |Sustainable energy use meets the needs of the present without compromising the ability of future generations to meet their energy needs. Almost all of the cars and trucks we drive run on fuels derived from oil, which is non-renewable. Electric vehicles draw some or all of their power from the U.S. electricity grid instead of the gas pump, resulting in significant reductions in the oil consumption, global warming emissions, and fueling costs of driving. |Electric vehicle owners report that they are not only cleaner and cheaper, but also very fun to drive with excellent acceleration. Most U.S. drivers drive less than 60 miles per weekday, well within the range of battery-electric vehicles. Federal tax incentives, based on the energy and environmental benefits, provide a $7500 tax credit for the purchase of an electric vehicles. So why do less than 1% of U.S. households currently have an electric vehicle? This should not be! Let's explore what is needed to increasing transportation electrification for a clean and energy-independent future. |

Paul T. Mairose PESouthwest Clean Air Agency(360) [email protected]/a
RACT Process for a Coal Fired Power PlantThe Southwest Clean Air Agency issued one of the first RACT determinations in Washington State for a major facility in 1995. The RACT process was not well defined at that time and the process took two attempts to achieve a final RACT Order including an appeal to the Washington Supreme Court. This presentation will review the process used, the technical analysis involved in arriving at a decision, explain the legal challenges, review the unique decision process and describe the final outcome.

Aaron ManleyORCAA(360) [email protected] professional (35 or younger graduated more than a year ago)
Marijuana and the EnvironmentI'm partnering with Maggie Corbin and Carole Cenci from PSCAA for the "Marijuana and the Environment" abstract Thursday morning. I'll give a 5-10 minute report on ORCAA's approach to regulating the marijuana industry, and answer questions afterward as time permits.
Bryan SmithOregon Department of Environmental Quality(503) [email protected]/a
Regulatory Climate for Legal Marijuana in OregonMarijuana production, processing and sales are now legal in Oregon and multiple agencies are responsible for implementing the rules and regulations that will affect this emerging industry. The Oregon Department of Environmental Quality (DEQ) is not requiring a specific air quality permit for marijuana growers, but growers still need to comply with all applicable DEQ regulations relating to air, water and solid waste. Other agencies besides DEQ will regulate issues such as pesticide usage and testing, wastewater management and odor control.

Jeanni RupnickTRC Environmental Corporation(425) [email protected] professional (35 or younger graduated more than a year ago)
Compliance Test Method History, Evolution, and Selection: Developing an Appropriate In 1955, the Air Pollution Control Act was the first federal U.S. legislation enacted that pertained to air pollution research. In 1963, the Clean Air Act (CAA) was passed as the first law pertaining to the control of air emissions. In 1970, 1977 and 1990, major amendments to the law, requiring regulatory controls for air pollution, were passed. Today, there are dozens of source categories and hundreds of test methods that are currently utilized to quantify air pollutants. This presentation will provide a brief overview of air emissions regulatory history as well as the ongoing process of identifying the best applicable test methods for each source test program.

Rebecca BrownNorthwest Clean Air Agency(360) [email protected] VernonWAn/a
"Tall Cedars" - A Case Study in Integrated Complaint ResponseRebecca Brown from Northwest Clean Air Agency will tell the story of "Tall Cedars", a case study that started with an odor complaint and made national news. She will describe how her use of an integrated approach brought resolution to a long standing problem. Come learn more about this unusual situation and the unusual approach that finally resolved it.

Carrie AndrewsCH2M(503) [email protected]/a
Oregon LNG Terminal ProjectThe Oregon LNG project includes and import/export liquefied natural gas terminal in Warrenton, OR and an associated 86 mile pipeline interconnecting with the Williams Pipeline in Woodland, Washington. The project examined many resource areas, including water quality, vegetation and wildlife, wetlands, dredging, air quality, waste management, and public safety to name a few. This presentation will review the components of permitting the project through the federal, state and local jurisdictions as well as highlight some of the specific air quality impacts and how they were assessed.

Kennet BertelsenMorrison Maierle, Inc.(509) [email protected]/a
Seep Water Treatment at Jerritt Canyon Mine, Elko, NVThis project involved reclamation activities associated with treating seep water from three rock dump areas (RDAs) at the Jerritt Canyon Mine. The mine needed to protect adjacent natural surface drainages from high sulfate water seepage from mine rock dump areas (RDA's). Testing indicated that the media in the existing treatment test trench was spent and an updated collection and treatment system was needed. The project team developed a passive treatment strategy for these remote RDAs. This presentation will focus on the site design, approvals, implementation, and construction of the Engineering Design Change (EDC) for each site as recommended by the process engineering study. The site development required integration of the new systems into the existing sites, while causing minimal disturbance to the RDAs. The work was completed in compliance with a Consent Decree between the Nevada Department of Environmental Protection, the US Environmental Protection Agency, and Varis Gold.

Margo ThompsonWA State Dept of Ecology(360) [email protected]/a
Panel - Air Quality Regulation Updates in the Pacific NorthwestThis panel includes Margo Thompson, Al Newman, Rich Hibbard and Joanna Ekrem from the WA State Department of Ecology discussing a variety of topics including rulemaking under 173-400 WAC General Regulations for Air Pollution Sources, 173-401 WAC Operating Permit Regulation, 173-442 WAC Clean Air Rule (new climate change rule), State Implementation Plan projects, Clean Power Plan (111(d)), Regional Haze and the new ozone standard. |The panel will also include Trevor Scoffield with Metro Vancouver and Warren McCormick with the British Columbia Ministry of the Environment discussing air quality regulation updates in British Columbia and Canada. |

Steve RyboltPort of Seattle(206) [email protected] professional (35 or younger graduated more than a year ago)
Creating Trust and Transparency through Environmental Mgmt If a tree feel in the woods and no one was around, would it make a sound? If your tree fell on your neighbor's property when they were not home, would they make a sound when they got home? What if you told your neighbor your tree was going to fall on their property, would they still make a sound? | |Transparent and strategic communication can lead to trust, progressive relationships, and proactive environmental compliance. Within environmental compliance, communication is critical and often a requirement. Communicating projects and situations can occur through a variety of methods, i.e. social media, presentations, publications, press releases, community meetings, and individualized attention with stakeholders. In some scenarios, under communicating may often be an effective strategy as to not over-complicate a project or situation. Conversely, over communicating may completely thwart a project. This presentation will review and evaluate three recent environmental projects at Sea-Tac International Airport and the communications strategies that were deployed. By looking at these case studies, it will be evident that finding a balanced communication strategy is critical to proactive environmental compliance and stakeholder engagement. |

Thomas R. WoodSTOEL RIVES LLP (503) [email protected]/a
The EPA Clean Power Plan; Impact and Opportunities in the NorthwestThe EPA Clean Power Plan creates opportunities and hindrances for renewable energy in the Northwest. This part of the session will provide an overview of the structure of the Clean Power Plan and how it creates tools for states to use to incent (or disincent) renewable energy development.

Cameron YourkowskiRenewable Northwest(503) [email protected]/a
Renewable Energy in the Northwest: Past, Present, and PolicyOverview of the renewable energy development in Washington, Oregon, Idaho and Montana and policy considerations going forward. Focus on the impact of the Clean Power Plan on renewable energy development in the Northwest.

Kirk W. StopenhagenVorticity Consulting, LLC(425) [email protected]/a
Wind Energy in PNWIS Country: Existing Projects & the Basics of Developing Commerci The Pacific Northwest has been at the forefront of installing commercial wind projects since 2000 and is known for being the first area outside of California where wind energy has blossomed. Although new projects are not as prevalent in recent years, new projects are coming on line in every PNWIS state and British Columbia. A summary of recent regional development will be presented along with the basics of how a project gets from an idea to a reality.