pnnl: mechanistic-based ductility prediction for complex
TRANSCRIPT
Mechanistic-based Ductility Prediction for Complex Mg Castings
X Sun (PI) Pacific Northwest National Laboratory
Richland, WA, USA
2012 DOE Vehicle Technology Program Review May 14-18, 2012
1
Project ID#: LM057
This presentation does not contain any proprietary, confidential, or otherwise restricted information

Overview
Timeline Start: Oct. 2010 End: Sep. 2013 25% Complete
Budget Total funding:
DOE - $1,800K Industries (in-kind) - $900K
Funding in FY11: DOE - $600k Industry - $300k
Funding in FY12: DOE - $600k Industry - $300k
Barriers Limited ductility of Mg castings hindering its wider applications as vehicle components Lack of capability of conventional computational software/models in predicting ductility of Mg castings, resulting from various types of defects
Partners University of Michigan Ford Motor Company Mag-Tec Casting Corporation CANMET Materials Technology Laboratory
2 2
Project Objectives
Background and motivation Conventional computational technique (i.e., homogenization, continuum damage mechanics, crystal plasticity) and some phenomenological approaches have no or very limited ductility predictive capability for Mg castings
Provide a modeling framework that can be used in future Mg alloy design and casting process optimization
Develop an empirical casting process simulation tool that can estimate the variation in ductility and be used by the casting industry in the near future Develop a mechanistic-based predictive capability that can be coupled with future advances in casting process simulation and will lead to further casting process optimization and alloy design
3

Deliverables
A validated simulation tool for estimating the spatial variation of ductility and the influence of casting process variables (on-going; due 6/30/2012) Modeling and experimental methods in quantifying location-dependent intrinsic and extrinsic ductility limiting factors for complex Mg castings (on-going; due 9/30/2012) Experimentally validated predictive models for stress versus strain curves, including ductility, for Mg castings considering both intrinsic and extrinsic ductility limiting factors (on-going)
4

Technical Approaches
Cast a number of AM50/AM60 castings of complex geometries under a variety of conditions (i.e., melt temperature, shot speed, die temperature, gating geometry) Perform alloying and casting process simulation to predict spatial variations in casting defects and other microstructural features under different conditions Characterize microstructure and defect features at various locations of the castings and perform tensile tests with samples machined from various locations Develop a quality-mapping capability for estimating/controlling ductility of Mg castings based on tensile test results and various casting parameters Develop a mechanistic-based ductility prediction capability with separate consideration of intrinsic factors and extrinsic factors
5
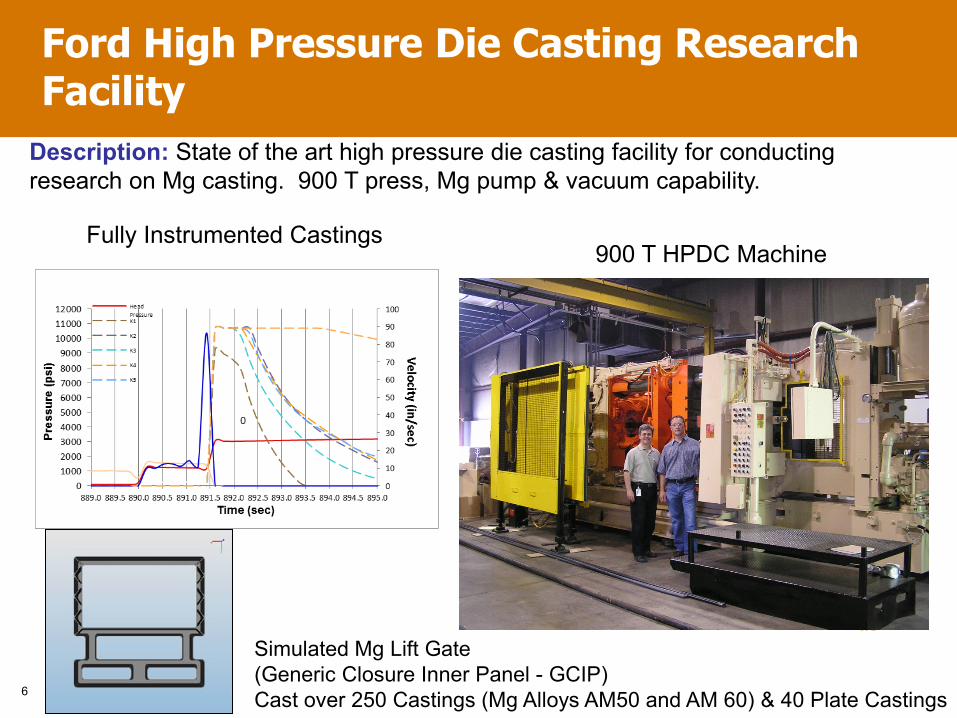
Description: State of the art high pressure die casting facility for conducting research on Mg casting. 900 T press, Mg pump & vacuum capability.
Ford High Pressure Die Casting Research Facility
Simulated Mg Lift Gate (Generic Closure Inner Panel - GCIP) Cast over 250 Castings (Mg Alloys AM50 and AM 60) & 40 Plate Castings
Fully Instrumented Castings 900 T HPDC Machine
6
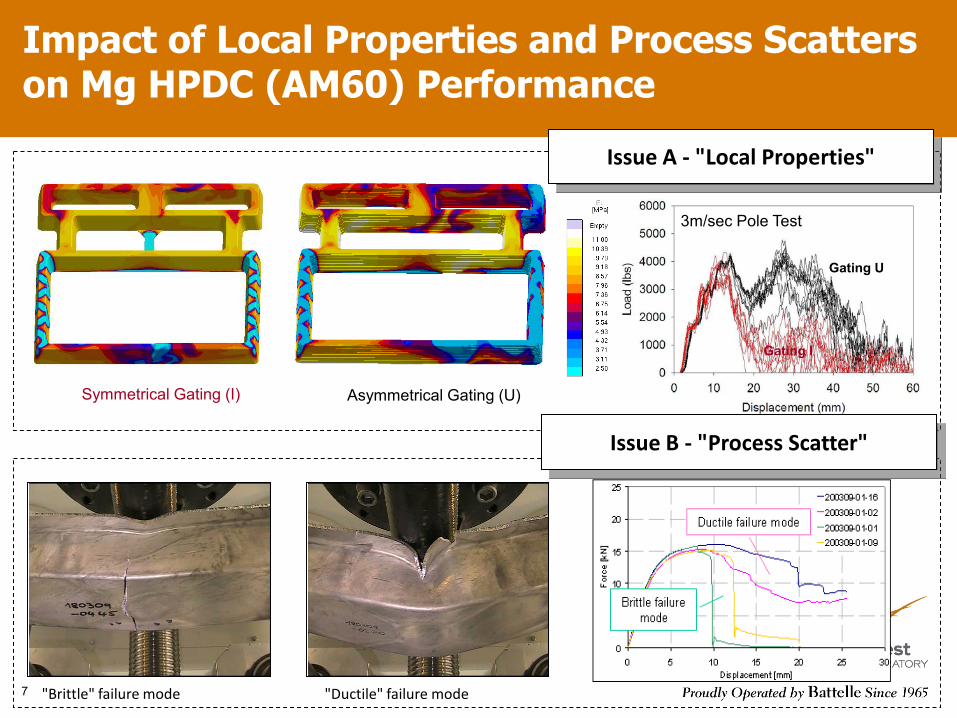
"Ductile" failure mode "Brittle" failure mode
Asymmetrical Gating (U) Symmetrical Gating (I)
Gating I
Gating U
3m/sec Pole Test
Issue A - "Local Properties"
Impact of Local Properties and Process Scatters on Mg HPDC (AM60) Performance
Issue B - "Process Scatter"
7

Technical Accomplishments -- Quality Mapping of Local Ductility
8
Quality Index = c1*FL^c2+c3*Ma^c4+c5*AP^c6+c7*ST^c8
Different Processing Conditions: • Melt Temp • Die Temp • Flow Pattern • Shot Speed • …
Different Criteria Functions: • Flow Length • Air Entrapment • Air Contact • Solidification Time • …
Optimization of criteria functions and constants to give local index map for Mechanical Properties (i.e. ductility).

9
Technical Accomplishments --MAGMAsoft Simulations (1)
(a)
Plug
Center Feeder
(b)
580mm
Generic Closure Inner Panel (GCIP) (a) Front View (b) Back View
Used GCIP as a case to generalize the correlation between criteria function and elongation of Mg high pressure die casting.
Table 1. Actual values used in MAGMA soft simulation, representing processing conditions
Filling profile of A condition (a) actual filling profiles for the set of castings(b) actual median filling profile (c) filling profile used in MAGMAsoft simulation
Criteria Function
10
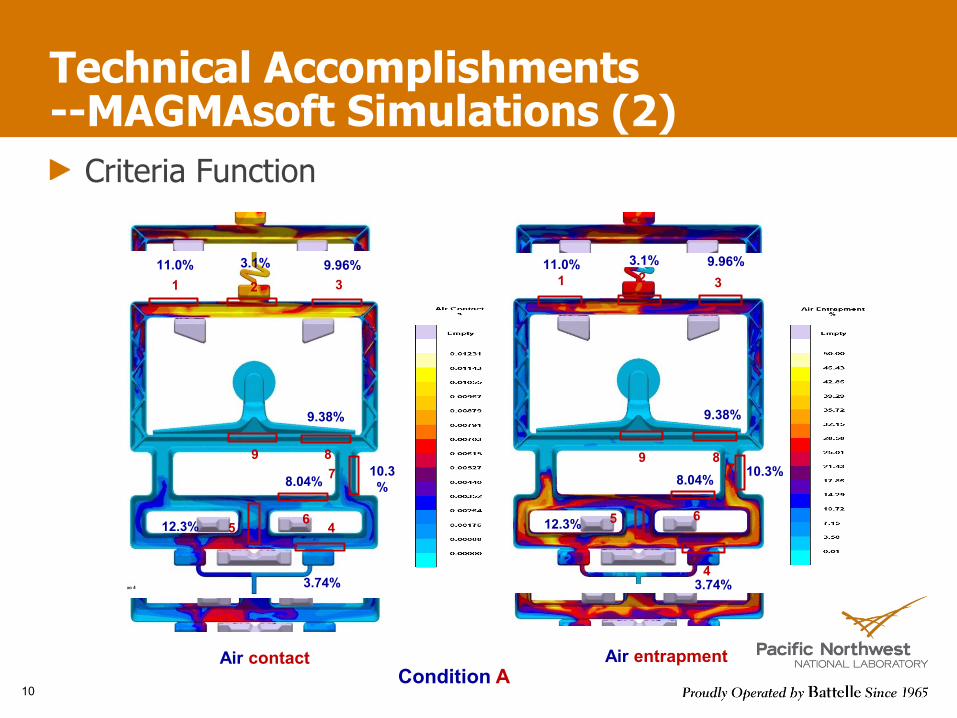
Technical Accomplishments --MAGMAsoft Simulations (2)
Condition A Air contact
1 2 3
5
9 8
6 4
7
11.0% 3.1% 9.96%
9.38%
10.3% 8.04%
3.74%
12.3%
1 2 3
5
9 8
6
4
7
11.0% 3.1% 9.96%
9.38%
10.3% 8.04%
3.74%
12.3%
Air entrapment

Designation Alloy Fast Shot m/sec
Melt Temp Degree C
Gating Configuration
Center Feeder
A AM60 5.2 675 No plug No
G AM60 5.08 731 plug No
U AM60 5.84 720 plug Yes
Q AM60 6.09 727 plug Yes
Technical Accomplishments -- Stress-Strain Curves (AM60, Condition U)
Samples were cut from the same location (#2)
Failed tensile samples
Stress-strain curves 11

Elongation = 26.291 -18.96*STnorm 0.19934 -1.8144*FLnorm 0.91472 -5.8475*AEnorm 4 - 7.0759*ACnorm 0.92389 + 27.613*Tnorm 4
The criteria functions were normalized as follows: STnorm = Liq to Sol/4; AEnorm = AE/35; FLnorm = FL/1500; ACnorm = AC/0.015; Tnorm = (T100%-620)/620 R2 = 0.51
0
2
4
6
8
10
12
14
0 2 4 6 8 10 12 14
Pred
icte
d el
onga
tion
(%)
Measured elongation (%)
Comparison of the test and predicted elongation
Technical Accomplishments --Preliminary Quality Map Relationship for Ductility
12
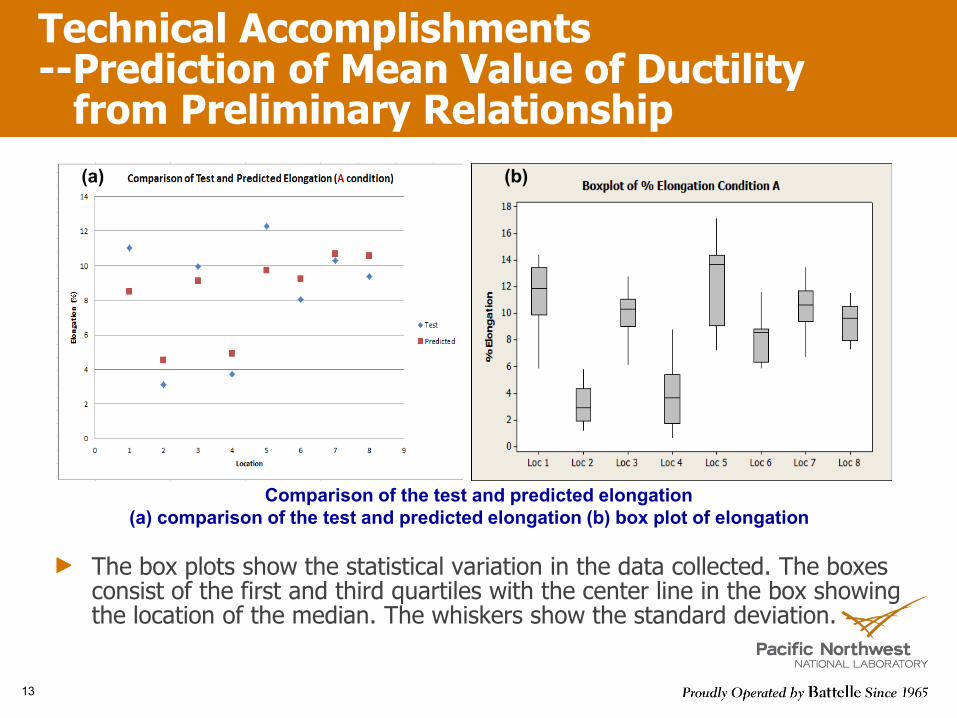
Comparison of the test and predicted elongation (a) comparison of the test and predicted elongation (b) box plot of elongation
(a) (b)
The box plots show the statistical variation in the data collected. The boxes consist of the first and third quartiles with the center line in the box showing the location of the median. The whiskers show the standard deviation.
Technical Accomplishments --Prediction of Mean Value of Ductility from Preliminary Relationship
13
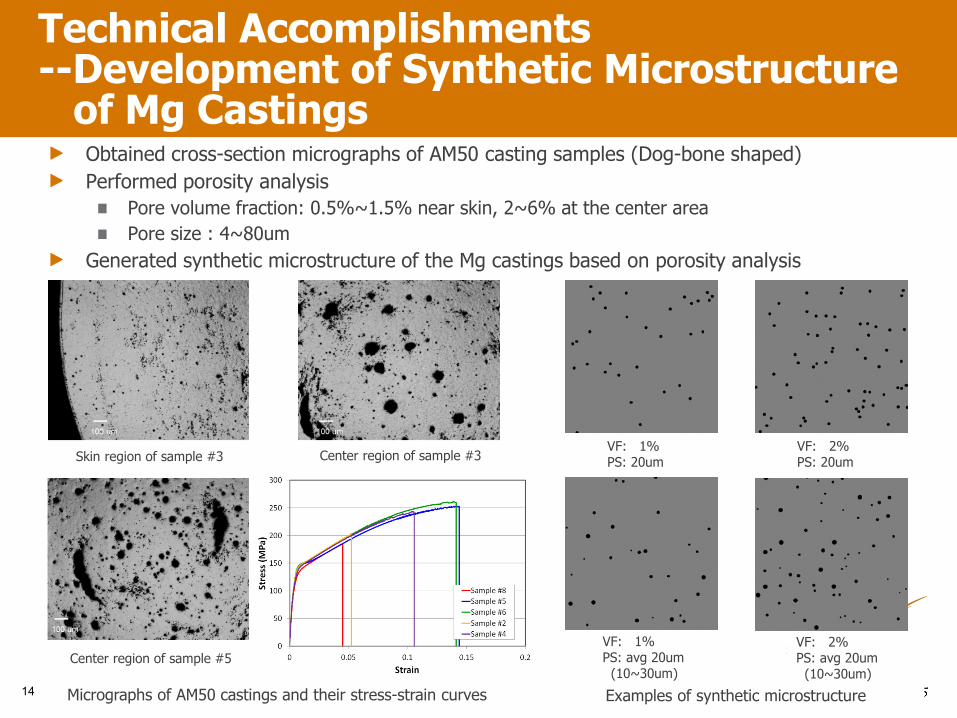
Obtained cross-section micrographs of AM50 casting samples (Dog-bone shaped) Performed porosity analysis
Pore volume fraction: 0.5%~1.5% near skin, 2~6% at the center area Pore size : 4~80um
Generated synthetic microstructure of the Mg castings based on porosity analysis
14
Technical Accomplishments --Development of Synthetic Microstructure of Mg Castings
Micrographs of AM50 castings and their stress-strain curves Examples of synthetic microstructure
VF: 1% PS: 20um
VF: 2% PS: 20um
VF: 1% PS: avg 20um (10~30um)
VF: 2% PS: avg 20um (10~30um)
Skin region of sample #3 Center region of sample #3
Center region of sample #5

15
Technical Accomplishments -- Developed Finite Element-based Ductility Prediction Technique for Mg Castings
Input stress-strain curve
x
y
x
y
x
y
VF: 1% PS: avg 20um (10~30um) x-dir. tension
y-dir. tension
Generated finite element models based on synthetic microstructures
2-Dimensional plane-stress model Model size: 1mm X 1mm, Mesh size: 2um Elastic modulus : 45GPa, Yield strength: 140MPa Constant plastic hardening rate (1,065MPa) is assumed Intrinsic critical strain (Ecr) : εp=14% (No hardening is present beyond this) Failure : based on plastic strain localization induced by pores
Simulation cases 3 different pore volume fractions : 1, 2, 4% 5 different pore sizes : 4, 12, 20, 28, 40 um in diameter 2 different pore size distributions : constant/distributed pore size Ran 6 different simulations for each case to obtain statistics
Predicted tress-strain curves for x-dir. and y-dir.
Size dependence of Ecr

16
Technical Accomplishments --Predicted S-E Curves for Various Pore Sizes (VF=1%, Constant Pore Size Distribution)
PS: 4~40um
6 stress-strain curves predicted for 6 microstructures under each condition Ductility depends on pore distributions in the model In general, ductility decreases as pore size increases
PS: 4um PS: 12um PS: 20um
PS: 28um PS: 40um

17
Technical Accomplishments --Effects of Pore Size, Volume Fraction and Distribution on Uniform Elongation (VF=1%, Constant Pore Size Distribution) In general, uniform elongation decreases as pore size and/or volume fraction increases
This may not always be the case in some range of pore size and volume fraction since the mean distance between the pores seems to have substantial influence on ductility Needs further study Considered pore size distributions (i.e., constant/distributed) do not show significant difference
Constant pore size Distributed pore size
Effect of pore size
Effect of pore volume fraction

Technical Accomplishments -- Preliminary Results of 3-D X-ray Tomography
18
X-ray scanned
Longitudinal (L)
Width (W)
Thickness (T)
Movie
T
W
Pore
T
W #71U
#71U
Visual representation of pores in samples
#71U (VF: 0.64%)
#123U (VF: 1.04%)
#76U (VF: 0.62%)
Image analysis is underway based on X-ray tomography The result will be used for actual microstructure-based finite element modeling
L
T W
Summary
Over 250 castings of AM50/AM60 were cast under variety of conditions Preliminary quality map for predicting average local values of ductility was developed and it predicts similar trends to those of experimental measurements Approaches for predicting knit lines and ductility variability are under evaluation Fractographic analysis for development of empirical micromechanical ductility model has been initiated X-ray tomography has been used to generate three-dimensional images of tensile samples with porosity in it Two-dimensional finite element analysis has been conducted based on synthetic microstructures with different pore size, volume fraction and distributions Mesh size effect and scalability regarding FEA have been studied
19
Collaborations
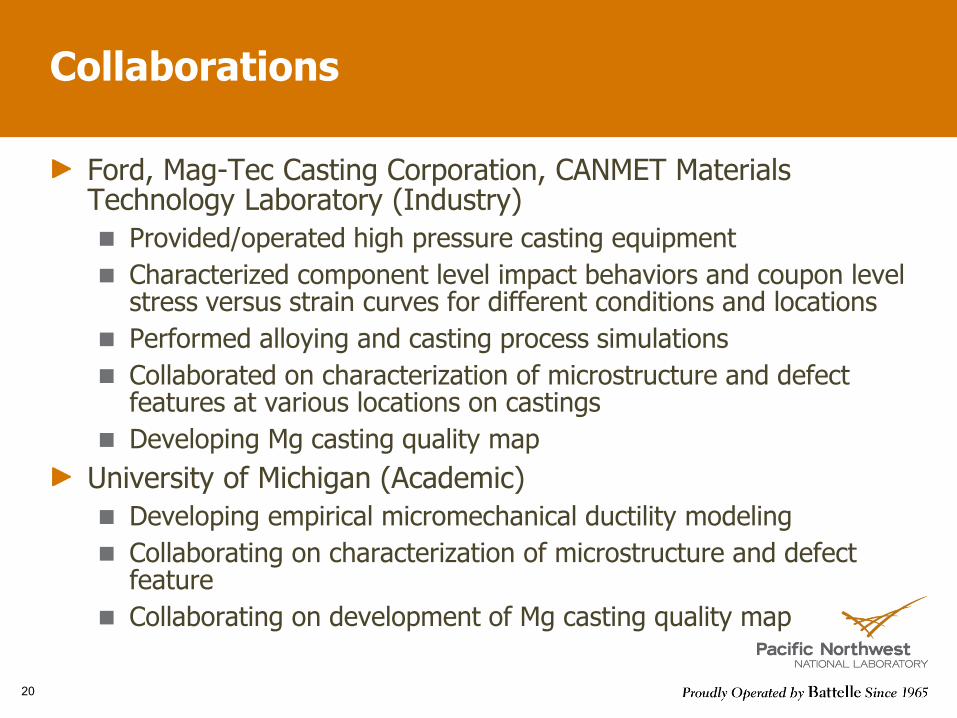
Ford, Mag-Tec Casting Corporation, CANMET Materials Technology Laboratory (Industry)
Provided/operated high pressure casting equipment Characterized component level impact behaviors and coupon level stress versus strain curves for different conditions and locations Performed alloying and casting process simulations Collaborated on characterization of microstructure and defect features at various locations on castings Developing Mg casting quality map
University of Michigan (Academic) Developing empirical micromechanical ductility modeling Collaborating on characterization of microstructure and defect feature Collaborating on development of Mg casting quality map
20

Proposed Future Work
21
Evaluate approaches for predicting knit lines and ductility variability Improve quality mapping capability Complete fractographic analysis for empirical micromechanical model For synthetic microstructures, extend the modeling regime to include other porosities up to 10% and maximum pore size up to 500µm Perform actual microstructure-based finite element models based on X-ray tomography to validate the modeling method Experimentally quantify size-dependent critical strain/strength Perform actual microstructure-based finite element analysis to examine the interactions and competitions between the pores and the brittle eutectic β phase Quantify the skin effects on the predicted ductility with various thicknesses of pore-free zone
Technical Back-up Slides
22

Casting
Solid solutions Entrapped Air / Micro porosity Eutectic Phases
Chemistry
Thermodynamics
n Processing
Microstructure
Properties Ductility HCF/LCF Yield Strength
HPDC Mg Processing-Structure-Property ICME Foundational Engineering Problem Linkages
Current
Future 23
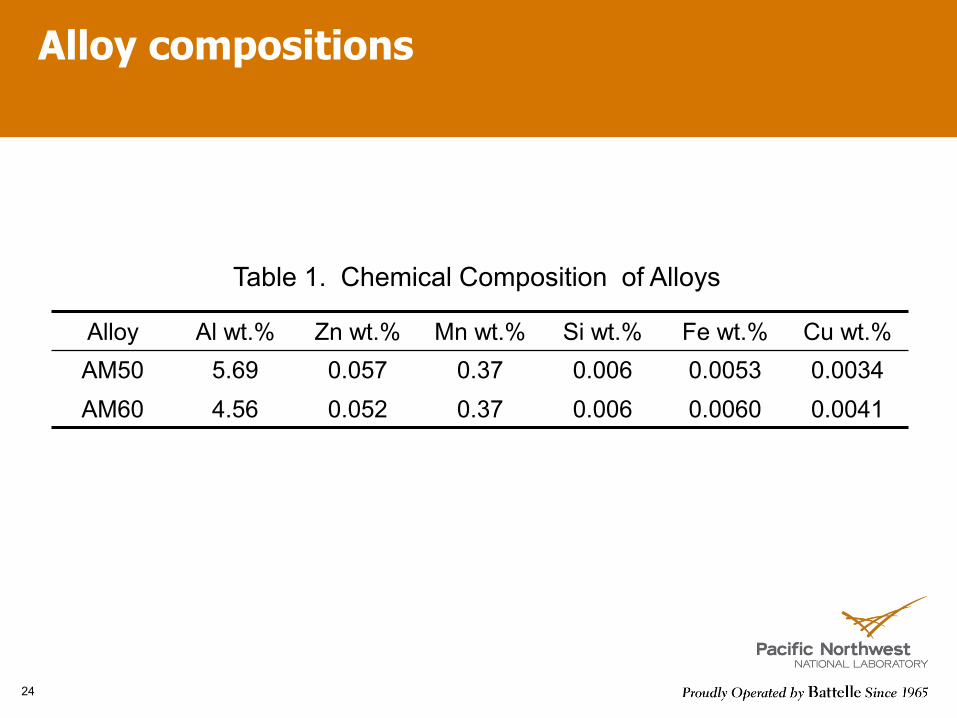
Alloy compositions
Alloy Al wt.% Zn wt.% Mn wt.% Si wt.% Fe wt.% Cu wt.% AM50 5.69 0.057 0.37 0.006 0.0053 0.0034 AM60 4.56 0.052 0.37 0.006 0.0060 0.0041
Table 1. Chemical Composition of Alloys
24

Examples of Synthetic Microstructures
Pore Volf. 1%
Const. pore size
PS 4um
Pore Volf. 4%
Const. pore size
Pore Volf. 1%
Distri. pore size
PS 4um
PS 20um PS 40um
PS 20um PS 40um
AVG. PS 4um AVG. PS 20um AVG. PS 40um 25

Effects of Pore Size Distribution
The two pore size distributions considered here do not have significant difference in the ductility
VF: 1% VF: 2%
VF: 4%
26

27
Technical Accomplishments --Mesh Size Effects Study
Used hole models (1mmx1mm) with mesh size ranging from 1um to 50um Critical strain was correspondingly determined for each mesh size by adjusting critical strains to have the same uniform elongation as that of base model
MS: 34.4um MS: 10.1um MS: 2.5um
S-E curves for different mesh size models (based on same Ecr=14%)
S-E curves with same UE (based on adjusted Ecr) Mesh size effect on Ecr
28
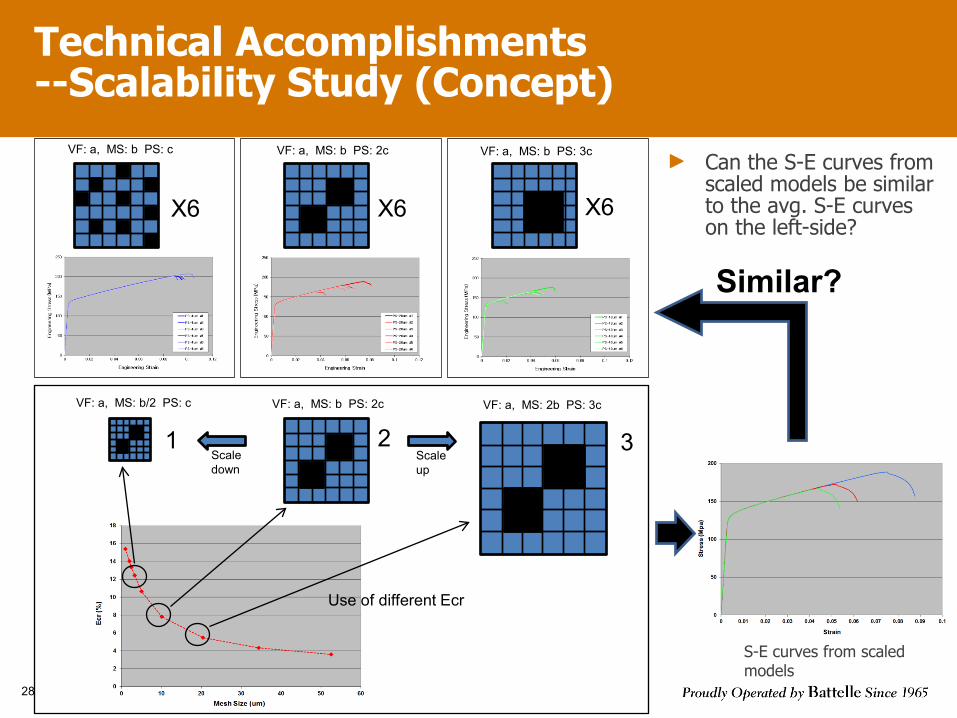
Technical Accomplishments --Scalability Study (Concept)
Can the S-E curves from scaled models be similar to the avg. S-E curves on the left-side?
X6 X6 X6
VF: a, MS: b PS: c VF: a, MS: b PS: 2c VF: a, MS: b PS: 3c
1 2 3
VF: a, MS: b/2 PS: c VF: a, MS: b PS: 2c VF: a, MS: 2b PS: 3c
Scale down
Scale up
Use of different Ecr
Similar?
S-E curves from scaled models

29
Technical Accomplishments --Scalability Study (Application)
Uniform elongations (normalized) based on scaling method are compared with those predicted from 6 model simulations Scaling with PS 4um/40um models do not seem to match well with prediction from 6 model simulations
Different pore shape (for PS 4um models) and pore distribution (relatively uneven distribution for PS 40um models) are suspected to be the sources for the discrepancy
Within the ranges considered in this study, scalability appears to be applied to the models with reasonable pore shapes/distributions
With a PS 4um model With a PS 12um model With a PS 20um model
With a PS 28um model With a PS 40um model