png domestic election observation study · level 8, deloitte tower, douglas st, port moresby, ncd...
TRANSCRIPT

Level 8, Deloitte Tower, Douglas St, Port Moresby, NCD PNG tel +675 321 5411
Level 6, Tower 3, 9 Lawson St, Southport, QLD AUSTRALIA tel +617 5532 4666
Tebbutt House, 18 Suva Street, Toorak, Suva FIJI +679 331 5555
[email protected] www.tebbuttresearch.com
PNG Domestic Election Observation Study:
Observations on the Conduct of the 2013 LLG Elections
Findings from surveys completed
by PNGEC election observers
Managed by:
Cardno Emerging Markets through the
PNG Electoral Support Program (ESP).
Prepared for: PNG Electoral Commission
Analysis of surveys by:
Tebbutt Research
October, 2013

2
Table of Contents
Table of Contents ...................................................................................................................... 1
Background and Methodology .................................................................................................. 3
Executive Summary and Considerations ................................................................................... 5
Team Leader Observations ........................................................................................................ 7
Candidate Information ...................................................................................................... 8
Polling Team ...................................................................................................................... 8
Polling Place Layout and Setup .......................................................................................... 9
Presiding Officer Duties ................................................................................................... 10
Lock & Sealing of Ballot Boxes ......................................................................................... 10
Voter Flow ....................................................................................................................... 10
Electoral Rolls .................................................................................................................. 12
Issuing Ballot Papers ........................................................................................................ 13
Voter Assistance .............................................................................................................. 14
Secret Voting ................................................................................................................... 14
Scrutineers ....................................................................................................................... 15
Security ............................................................................................................................ 15
Completion of Election Returns ...................................................................................... 17
Ward Councillor Ballot Papers ......................................................................................... 17
Presiding Officer Training (N=71) .................................................................................... 18
Polling Official Training (N=71) ........................................................................................ 19
ARO Training (N=71) ........................................................................................................ 20
Site Tallies (Voter Counts, Assistance, and Secret Balloting) .......................................... 21
Voter Experiences .................................................................................................................... 23
Demographics .................................................................................................................. 23
Voting Behaviours ........................................................................................................... 23
3
Background and Methodology
The 2013 PNG Local Level Government Elections were conducted across the country in July
and August 2013. Mobile polling teams in each district were charged with completing
polling and counting within 35 days of the close of each election. The polls and subsequent
vote counts in selected parts of the country were monitored by domestic election observers
authorized by the Electoral Commissioner to report on the conduct of the 2013 LLG
elections.
Domestic observer teams working under the auspices of the LLG Election Observation
program generated impartial qualitative and quantitative data assessing adherence to
established voting laws and principles by individuals and groups charged with convening,
operating, and monitoring polling stations. Data was collected at the ward/polling station
level around:
The conduct of the poll and count;
Self-reported experiences of voters in the form of voter surveys; and
The process by which voting assistance was administered and to whom, as well as the
level of secrecy adhered to in the casting of ballots.
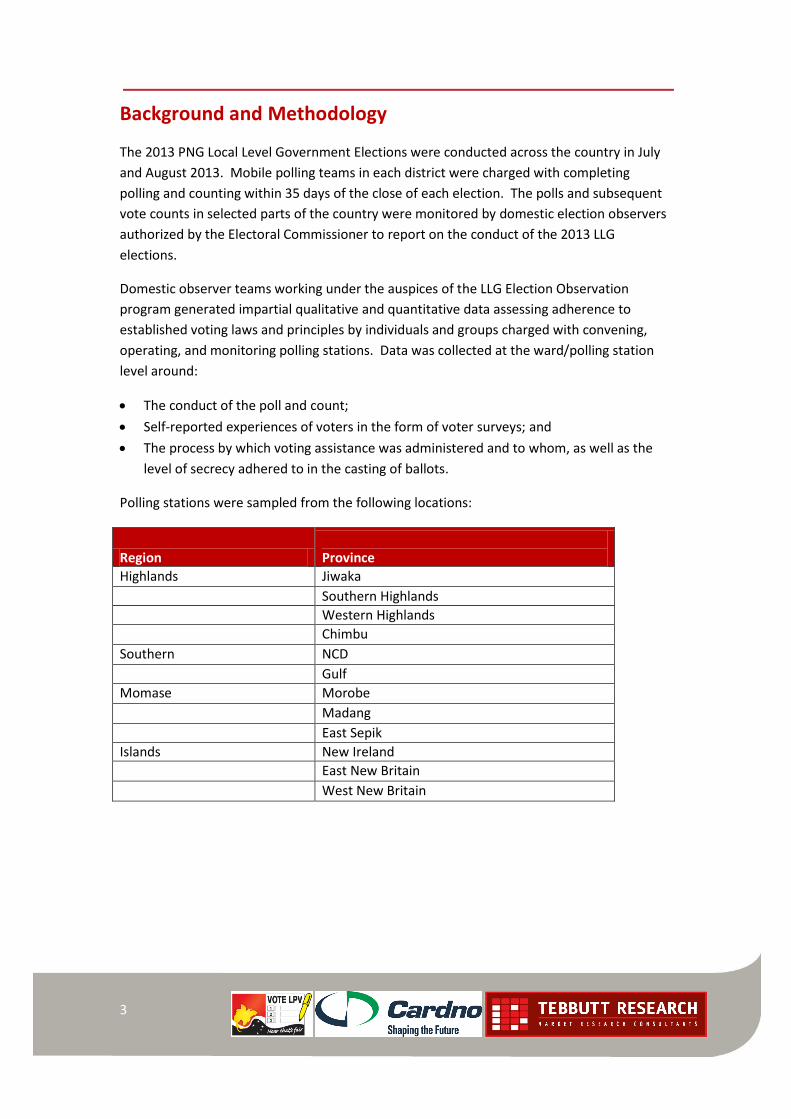
Polling stations were sampled from the following locations:
Region Province
Highlands Jiwaka
Southern Highlands
Western Highlands
Chimbu
Southern NCD
Gulf
Momase Morobe
Madang
East Sepik
Islands New Ireland
East New Britain
West New Britain

4
More specifically:
Team leaders completed 79 polling station reports based on their direct observations of
the conduct of the elections at select polling stations. These reports captured:
candidate information,
polling team composition,
polling place layout and setup,
presiding officer duties,
sealing of ballot boxes,
voter flow in polling stations,
inking procedures,
the marking of names off the
electoral rolls,
the issuing of ballot papers,
voting assistance procedures,
the secrecy of ballots,
the role of scrutineers,
security, the completion of
election returns,
the counting of votes at the ward
level
information about the training of
presiding officers, polling officials,
and AROs (as reported by officials
themselves)
Team leaders and volunteers observed and tallied voter flow through polling stations at
two different points during the course of their site visits for a total of 170 recorded
observational periods. Tallies included information about the number of male and
female voters who turned out to vote during the course of observations, the amount of
voter assistance that was required in the voting process, and observations with regards
to privacy and the secrecy of ballots.
Surveys were conducted by volunteer observers with 1,706 voters about their voting
experiences.
All forms and questionnaires used as part of this undertaking were created and administered
by PNGEC’s Domestic Observer Teams. For the purposes of this project, Tebbutt Research
was commissioned to undertake data entry and analysis only.
The following report seeks to provide a high level analysis of impartial data provided by
Domestic Observer Teams. It is intended to inform and further improve PNGEC
management of and operational plans for future elections.
It is important to note that data presented for individual questions may not add up to 100%;
there was a significant and varying degree of non-response to questions in all three forms
utilized – the team leader and observer reports, as well as voter surveys.
For further information on the analysis, please contact Tebbutt Research. For all other
information about the Domestic Observer Program, please contact the Papua New Guinea
Electoral Commission.

5
Executive Summary and Considerations The Highlands
All research efforts to date – including findings from two independent surveys of voters
conducted by Tebbutt Research and data gathered through the Domestic Observer program
– indicate there are still considerable and serious problems plaguing almost every aspect of
the voting process in the Highlands.
Data gathered by domestic observer teams during the 2013 LLG elections further confirms
anecdotal as well as quantitative reports of reoccurring, large-scale violations of election
laws in the Highlands. Procedural and ethical violations span the gamut, including
everything from unlawful voting by unregistered voters, to violence, to voting fraud carried
out at the hands of polling officials and law enforcement.
While there are a smattering of reports of inconsistent electoral procedures and confusion
plaguing some other stations across the country, these problems are nowhere near as
problematic or consistent as they are in the Highlands. In fact, team reports from polling
stations in other regions of the country are by and large satisfactory. With few exceptions,
Highlands’ polling stations were most frequently cited by observer teams for voting
irregularities during the 2013 LLG elections.
Problems included:
At two polling stations in the Highlands, polling officials were seen forging fraudulent
ballots while police stood by.
Fighting erupted at one Highlands station while observers were present, resulting in the
death of a civilian.
One in three Highlands stations observed was improperly setup.
Voting at a majority of Highlands stations was done out in the open, and there was no
secrecy in the voting process.
Three-quarters of stations in the Highlands failed to accommodate the needs of disabled
voters.
A majority of stations were disorderly and were cited for queuing problems.
Adults not listed on the rolls were still allowed to vote at some stations (they were
allowed to come back and vote after adults listed on the rolls had voted).
Teams witnessed assistance being forced upon voters in 15 stations across the country,
13 of which were located in the Highlands.
6
Women
In addition to problems in the Highlands, results indicate women continue to be under-
represented in the elections and polling processes in PNG. Women comprise a relatively
small percentage of the candidate pool as well as elections staff. In light of historical
attempts to restrict women’s right to vote of their own free will, imbalances in women’s
representation in the elections process may still require addressing:
On average, there were about 5 polling officials present per station, only one of whom
was female.
Only 37 of the 613 scrutineers present were women, averaging fewer than 0.5 female
scrutineers per station.
Most stations did not provide separate voting compartments for men and women.
Trainings
A majority of Presiding Officers, polling officials and AROs seem to have participated in
elections trainings, which they rate relatively well, but teams did not or were not able to
confirm trainings for a significant portion of station officials (14% of stations were
unaccounted for with regards to the training of Presiding Officers, 21% for polling officials,
and 41% for AROs). Given the importance of trainings to ensuring safe and legal voting
conditions at stations, renewed attention might be in order in this area.
A Note for Observers
There was a significant amount of non-response to questions in all three forms (team leader
reports, voter flow tallies, and voter surveys). It is impossible to determine whether non-
response equals a negative response, a response of “don’t know”, or a response of “not
applicable”. Many questions did not provide for a “don’t know” response in code lists. It is
also unclear whether interviewers themselves failed to properly code and record question
answers or whether interviewees (in the case of voter surveys in particular) refused to
respond to particular questions. We highly recommend allowing Tebbutt Research or
another specialist market research organization to either format or review future surveys
before the start of field to check both question wording and response codes.
In addition, only 2 per cent of voter surveys were completed with adults over the age of 65.
This may reflect a low incidence of seniors at the polls or a failure to adequately represent
this group in the survey process. Future teams may require additional training with regards
to intercept interviewing best practices to ensure voters from all ends of the demographic
spectrum are represented in efforts.
The report that follows provides a detailed analysis of all measures explored by Domestic
Observer Team in addition to the highlights referenced above.

7
Team Leader Observations
Form 1: Team leaders completed 79 polling station reports based on their direct
observations of the conduct of the elections at select polling stations. These reports
captured:
candidate information,
polling team composition,
polling place layout and setup,
presiding officer duties,
sealing of ballot boxes,
voter flow in polling stations,
inking procedures,
the marking of names off the
electoral rolls,
the issuing of ballot papers,
voting assistance procedures,
the secrecy of ballots,
the role of scrutineers,
security, the completion of
election returns,
the counting of votes at the ward
level
information about the training of
presiding officers, polling officials,
and AROs
Given the small sample size for this portion of the research, we are only able to report out
percentages on the overall sample and not at the regional level. In order to illustrate
differences at the regional level, we provide actual counts (eg. 2 of 21 polling stations
observed in the Highlands...). Regional differences are significant enough on most questions
to require mention.

8
Candidate Information
By observers’ count, almost 2,000 candidates ran in local elections covered by these
efforts, including ward councillors and council Presidents. Relatively few, however, were
women. Women accounted for roughly 17% of candidates for ward council seats and
only about 5% of candidates running for President.
Number Total N=79
Hlands N=22
Momase N=29
Islands N=22
South. N=6
Total Candidates Contesting Ward 487 120 169 169 29
Total Female 82 59 12 8 3
Total Candidates Contesting President 1279 224 680 290 85
Total Female 64 23 22 18 1
Avg Candidates Contesting Ward 6.16 5.45 5.83 7.68 4.83
Avg Female 1.04 2.68 0.41 0.36 0.5
Avg Candidates Contesting President 16.19 10.18 23.45 13.18 14.17
Avg Female 0.81 1.05 0.76 0.82 0.17
Polling Team
On average there were about 5 polling officials present per polling station observed, with roughly one female official per site.
Two in five locations recruited additional polling officials from the ward (roughly one per ward).
For the most part, polling officials were clearly identified in polling places, seemed to properly understand their role and were well trained. (There were two recorded instances in the Highlands, however, of egregious behaviour on the part of polling officials – see “Issuing of Ballot Papers”.)
Total N=79
Hlands N=22
Momase N=29
Islands N=22
South. N=6
Total Polling Officials 387 99 160 101 27
Total Female 80 14 27 32 7
Additional Polling Officials Recruited 81 18 31 26 6
Avg Polling Officials 4.9 4.5 5.52 4.59 4.5
Avg Female 1.01 0.64 0.93 1.45 1.17
% Yes
Additional Polling Officials Recruited - % Yes 44%
N Sizes too small to report out percentages
Clearly Identified in Polling Place - % Yes 84%
Properly Understood their Role - % Yes 84%
Appear to be Well-Trained - % Yes 79%

9
Polling Place Layout and Setup
There were roughly two polling compartments per station. All regions had 2-3
compartments per station with the exception of the Highlands – on average, the 22
stations visited in the Highlands had 1 compartment each.
Basically all accounts of improperly setup stations were from the Highlands
(approximately one-third, 7 of 22 Highlands stations observed were improperly setup).
All other regions seem to have provided decent voting conditions (with the exception of
informational displays and candidate posters). There was only one report of improperly
setup stations in Momase and the Southern regions and none in the Islands.
Highlands stations failed to ensure private voting conditions, accommodate the needs of
the disabled, or even provide the necessary tools to vote (pens).
More than half of Highlands stations failed to screen compartments for privacy or
provide pens (all other regions equipped stations with pens).
While a sampling of polling stations across the country failed to accommodate the
needs of the disabled, the problem was worst in the Highlands where three-quarters
of stations visited were not setup to accommodate disabled voters.
Total N=79
Hlands N=22
Momase N=29
Islands N=22
South. N=6
Polling Compartments 167 25 87 44 11
Avg Polling Compartments Per Station 2.11 1.1 3 2 1.83
Improperly Setup stations 11% N=7 N=1 N=0 N=1
Stations Setup to Accommodate the Disabled - No 34% N=17 N=4 N=4 N=2
Compartments Positioned to Screen Voter from Observation - No 24% N=13 N=3 N=1 N=2
Pens Provided - No 18% N=14 N=0 N=0 N=0
All regions, however can be faulted for failing to clearly display candidate posters - 30%
of stations across the country did not display candidate posters (Ward Councillor or
President). Posters, when displayed, were largely displayed in public areas or in polling
compartments.

10
Presiding Officer Duties
Presiding officers around the country seem to have followed protocol:
All officers observed allocated duties to polling officials and made sure ballot papers
were secure at all times.
89% briefed polling staff before polling commenced; monitored polling and issuing
of votes procedures; and issued a pre-LLG election speech with just a few exceptions
across regions.
81% gave polling officials meal breaks during the day (as observed by team leaders).
The vast majority of pre-election speeches included the following:
Layout of the polling place (91%);
Movement of voters inside the polling place (91%);
The method of marking the ballot papers (87%);
Giving assistance to certain voters (86%);
The purpose of the candidate posters (83%);
The indelible ink regulations (81%);
What happens with a spoilt ballot paper (74%); and
Rules for campaigning at polling places (73%).
Lock & Sealing of Ballot Boxes
Ballot boxes seem to have been marked properly - 90% of ballot boxes were clearly
marked for the Ward seat and 86% for the Presidential seat. The few mislabelled boxes
sited occurred in the Highlands.
Observers were unable to determine if all ballot boxes were empty prior to polling –
72% reported they were empty. Observers could not/did not determine the state of the
remaining ballot boxes (21% no answer or not sure), with the exception of 5 ballot boxes
(6%) in Momase and the Islands which were not empty but sealed from Presidential
polling in previous wards.
Observers do not report any failures to securely fasten inner tags to ballot boxes in the
presence of Scrutineers (with the exception of 1 instance), but more than one-third
(36%) of reports failed to account for this aspect of polling (no answer or not sure).
Voter Flow
For the most part, voting failed to commence at 8AM: 82% of polling stations observed
did not commence voting at 8AM; only 10% or 8 of 79 stations observed began polling
promptly at 8AM. Another 8% of reports failed to address this question. None of the
polling stations observed in the Highlands and Southern regions commenced voting at
8AM.
Actual start times range from 8:15AM until noon, with 29% of late starters up and
running by 9AM, and another 34% by 10AM.

11
Only about half of observed sites (57%) maintained voter queues properly throughout
the day, but disorderly queues were more of a problem in Highlands’ polling stations
than anywhere else. More than half of Highlands stations observed had queuing
problems compared to only a handful of cases in other regions.
Total N=79
Hlands N=22
Momase N=29
Islands N=22
South. N=6
Voter Queues Properly Controlled - Yes 56% N=4 N=18 N=16 N=4
Voter Queues Properly Controlled - No 27% N=12 N=4 N=4 N=1
Queuing was the primary method used to move voters through the polls in the Islands
and Southern regions, while stations in the Highlands and Momase were more likely to
call names alphabetically from electoral rolls to signal voters’ turn to vote (thus the lack
of orderly queues in the Highlands). Only 5% of polling stations overall gave household
heads an allocation of ballot papers for their entire household.
Total N=79
Hlands N=22
Momase N=29
Islands N=22
South. N=6
Voters Formed a Queue 57% N=7 N=12 N=21 N=5
Names were Called Alphabetically 46% N=12 N=19 N=2 N=3
Household Heads Given an Allocation 5% N=3 N=1 N=0 N=0
According to observers, in several instances in the Highlands, voting commenced with
names being read from the Electoral Roll but this practice was abandoned, when voters
became agitated by wait times, in favour of queuing in order of arrival.
“Name calling was abandoned afterwards and thereafter, voters voted in order of arrival”
Highlands (form 51)
“Initially, voters names were called alphabetically but after a while voters randomly voted in
order of arrival. Voter flow was disjointed and disorderly.”
Highlands (form 53)
From what observers could tell, ink was applied to voters’ fingers everywhere with the
exception of 7 stations in the Highlands. (Inking procedures was not determined for 9%
of stations.)

12
The majority of stations which applied ink did so for every voter, but 13% of stations
observed used ink inconsistently and 6% not at all, though these discrepancies occurred
entirely in the Highlands and Momase.
Total N=79
Hlands N=22
Momase N=29
Islands N=22
South. N=6
Ink was applied to each and every voter 81% N=14 N=26 N=19 N=5
Ink was used on/off throughout the day 13% N=8 N=2 N=0 N=0
Ink was used initially but later abandoned 5% N=2 N=2 N=0 N=0
Ink was not used at all 6% N=4 N=1 N=0 N=0
No answer 14% N=4 N=3 N=3 N=1
In several cases in the Highlands, volunteers observed indelible ink being applied only to
registered voters; unregistered and under-aged voters were allowed to vote but not
marked in this manner.
“The indelible ink was used only on the eligible adult voters, but not on the underage voters.
Some adult voters whose names were not on the electoral roll, but have voted didn’t receive
the ink on their fingers.”
Highlands (form 50)
That said, not all stations checked to see if voters’ fingers had already been inked at
another or the same polling station earlier in the day, though a majority followed
procedure on this point (68% checked for previous inking; 15% did not). A handful of
stations across regions were noted for failing to check for previous applications of ink,
with the greatest number occurring in the Highlands. (Compliance on this point was not
noted for 16% of stations.)
Electoral Rolls
The electoral rolls were used (91% of stations), and polling officials marked voters’
names off the rolls, everywhere except at 3 polling stations in the Highlands (use of the
electoral rolls has not been determined for 5% of stations).
Three in ten presiding officers (30% no), however, did not question people to establish
their identity and eligibility to vote (54% yes, 15% no answer/not sure). Instances in
which officers failed to question voters to establish their identity occurred across
regions, but were highest in the Highlands and the Islands (10 stations in the Highlands
and 9 in the Islands).
Just fewer two in five (37%) polling officials encountered difficulties locating names on
the alphabetical electoral roll. Relatively equal numbers (34%) located names with
relative ease.

13
The majority of observer teams witnessed voters being turned away from the polls
because their names were not listed on the rolls (63% yes, 19% no, 17% no response/not
sure). In total 597 voters were turned away in the presence of observer teams, an
average of 12 voters per polling station.
Total N=50
Hlands N=7
Momase N=20
Islands N=19
South. N=4
Total voters turned away 607 41 214 226 126
Avg voters turned away 12.14 5.86 10.7 11.89 31.5
In some cases in the Highlands, individuals not listed on the rolls were instructed to
return later in the day to vote once everyone on the roll had voted. A similar attempt
in the Islands resulted in an arrest.
“Most (unregistered voters) were told to vote later after registered names are exhausted
and only when there are extra ballot papers”
Highlands (Form 56)
“A campaign manager was caught and arrested giving out names to locals who were not
registered in the common roll. He did this because he had a copy of the common roll with
him.” Islands (Form 20)
Issuing Ballot Papers
Almost all Presiding Officers and Polling Officials signed or initialled the back of ballot
papers; most also wrote the ward or LLG name on the front of ballot papers and
reminded voters how to fill in papers.
Three in ten (29%) actually completed ballot papers on voters’ behalf – mostly in the
Highlands and mostly, but not always, at voters’ request.
In two stations in the Highlands, volunteers observed officials filling in ballots
themselves. It was reported that officials at these stations appeared to be turning
away voters from the polling area and filling out all ballot papers in favour of
particular candidate.
“Whether the polling officials were adequately trained or had been informed of their roles,
their actions at the polling site ran contrary to the election laws: they (all 5 males) directly
partook in marking the ballot papers of both the ward councillor and presidential candidate.
This was done in full view of 5-6 police personnel there.
…
Voters did not get to vote. The polling officials do. Although foul play was obviously applied,
the polling officials basically followed the usual procedures to make voting appear credible
(official), which otherwise wasn’t the case. Although the general mood at the polling site
appeared to be one of total agreement, other voters could have been forced into

14
agreement, or forcefully surrendered their choices without prior consultation.”
Highlands (form 44)
Total N=79
Hlands N=22
Momase N=29
Islands N=22
South. N=6
Always sign or initial the back of the ballot paper 92% N=20 N=25 N=22 N=6
Write on the front of the ballot paper the Ward or LLG name 72% N=19 N=18 N=20 N=0
Remind the voter how to correctly fill in the ballot paper 70% N=18 N=18 N=18 N=1
Make, fill in, or complete the ballot paper on a voter's behalf 29% N=11 N=5 N=7 N=0
Voter Assistance
Voters requested assistance during 81% of station observations; requests for assistance
were observed at a majority of polling stations across regions. There were only 5
stations where requests for assistance did not occur during observation periods (another
13% of team leaders failed to complete this point in their reports).
Assistance was most often provided by voters’ own family members (46%) or by
Presiding Officers (41%). In 16% of instances of requests for assistance, assistance was
provided by candidate supporters (this occurred largely in the Islands). There were only
3 observed instances of a police officer providing voting assistance.
One in five (19%) teams observed assistance being forced upon voters who did not
directly request it. Thirteen of 15 stations where these incidents took place were
located in the Highlands and 2 in Momase. In the Highlands, assistance was largely
forced upon women, illiterate and older voters.
Campaign managers or party officials were present at about half (47%) of stations
observed; managers and/or party officials tried to coerce voters into voting a certain
way out roughly one-third (35%) of sites where they were spotted.
Only 5% of team leaders saw someone trying to buy votes at polling stations, with 1 or 2
(at most) occurrences of this type of misconduct occurring in each region.
Secret Voting
Voters were permitted to vote in private everywhere except for the Highlands, where
15 of 22 polling stations observed were cited for failing to allow voters to vote in
private.
In 13 of the 15 polling stations in question, the layout of the polling place forced
voters to vote in view of scrutineers.
10 of the 15 polling stations did not use voting compartments and voting took place
in public.
In 9 stations, voters were required to indicate their votes verbally and people could
hear.

15
In 9 stations, wantoks and other clan members were allowed inside the polling area.
In 7 stations, campaign managers and supporters were allowed inside the polling
area.
The large crowds assembled to vote in the Highlands were one of the main barriers to
privacy while voting, as one of the domestic observers noted below.
“The polling ring (booth) was surrounded by all, including men, women, and children.
Campaign managers, supporters, scrutineers and candidates were amongst the crowd.
The chances of ensuring a secret ballot were drastically reduced.”
Highlands Province (form 54)
Scrutineers
Relatively equal numbers of candidates were observed being represented by scrutineers
(34%) as were not (39%). (One-quarter – 26% – of team leaders were not sure or failed
to answer this question.)
613 scrutineers were observed – an average of 8 scrutineers per polling station.
Highlands stations had the fewest number of scrutineers, with an average of 3
scrutineers per station observed.
Only 37 of the 613 scrutineers present were women, averaging 0.47 female scrutineers
per station. Only two female scrutineers were observed in the Highlands.
For the most part, scrutineers had a signed appointment notice (58% yes, 15% no, 26%
no response/don’t know) and there was a clearly marked area for most, but not all,
scrutineers to stand in (62% yes, 28% no, 10% no response/not sure).
That said, 32% of observer teams cited scrutineers for interfering in the polling process
(54% no, 14% no response/don’t know) even though for the most part, they seemed to
understand their role (52% yes, 14% no, 34% no response/not sure).
Security
Security was required at about one-third of polling stations (34%) across the country
(and with relatively equal frequency across regions). More than half (58%) did not
require security.
Weapons were seen in civilian hands at polling stations in two of four regions – at 13 of
22 stations in the Highlands and 4 of 22 stations in the Islands. In the Islands, weapons
were not used to influence voting. Observers were not sure what weapons were used
for in the Highlands, but there were disturbances in half (7) of the Highlands stations
where weapons were spotted in civilians hands.
Polling officials were assaulted in 14% of stations with the highest incidence of assaults
occurring in the Highlands (5 reported stations). Observers also witnessed threats to
police officials in 6% of stations (at roughly one station per region).

16
In one case, and observer team in the Highlands witnessed a violent death resulting
from a “dispute over the polling venue.” The team noted that the “atmosphere was
quite tense and intimidating” and that security was inadequate as “police reservists did
nothing to contain violence leading to the death.”

17
Though the majority of violence was observed in the Highlands there were incidences of
violence in other regions. Polling officials at one polling place in Momase reported that
they had been “threatened and assaulted - stones thrown at them” several days earlier.
But on the day of polling the observer team noted that “when it (voting) commenced
police presence quietened the situation.”
In addition to violence, at 5 stations in the Highlands, observers witnessed individuals
attempting to bribe polling officials. Bribery was not witnessed anywhere else.
Communities tended to shy away from the task of maintaining law and order at polling
stations; teams from only 10% of stations observed communities taking control to
maintain order and compliance.
Completion of Election Returns
Observer teams only reported observations around the completion of election returns
for 68% of stations, the vast majority of whom immediately reconciled used and unused
ballots after polling closed (63% yes, 5% no, 32% no answer/not sure). Only one or two
stations observed in each region failed to immediately reconcile ballots at the end of
polling.
Similar numbers reconciled tally sheets after polling closed (62% yes, 6% no, 32% no
response/not sure).
A majority but not all Presiding Officers completed their election returns immediately
after polling closed and in the presence of observer teams (53% yes, 14% no, 32% no
answer/not sure). Presiding officers failed to complete their returns immediately at 4
stations in the Highlands and 5 in Momase.
Teams observed one in four (24%) Presiding Officers who needed assistance completing
returns (30% no, 46% no response/not sure). Presiding officers at more than half of
Islands stations observed required assistance (13/22).
Regardless, POs largely secured unused ballot papers (61% yes, 6% no, 33% no
response/not sure).
Ward Councillor Ballot Papers
Teams were able to account for four in five stations with regards to the counting of
ballots at the ward level – slightly more than half (54%) of stations complete counting at
the ward level, another 29% did not. Teams could not/did not account for 16% of
stations on this point. Stations in the Islands were least likely to count ballots at the
ward level (16/22 stations did not).
Polling officials seem to have been allocated roles for counting everywhere except for
the Islands, though teams could not determine the allocation of roles for 31% of stations
observed. Ten of 22 Islands stations did not allocate roles for counting.
Teams were able to confirm that 67% of stations were led by polling officials who had
been given training in counting. They were not able to make a determination for the
remainder of stations.

18
For the most part, Presiding Officers briefed polling officials before the start of counting
(62% yes, 4% no, 34% no answer/not sure).
Basically all stations observed at the end of polling used plastic sheet rolls as a tally
board for results (58% yes, 8% no, 35% no response/not sure).
Only 1 station in Momase was cited for not completing election results forms (total
across regions - 53% yes, 1% no, 46% no response/not sure).
Community with an understanding of the LPV system was involved in counting at one-
quarter (23%) of polling stations, largely in the Islands and Southern regions.
Presiding Officer Training (N=71)
Most Presiding Officers worked for PNGEC during the National Elections (82% yes, 6%
no, 13% no answer), almost all of whom received training at the time (98%).
N=58:
Nine in ten POs rate the training they received at the time of the national elections
highly (40% very good, 48% good). Only 7% believed their training to be average and 5%
described it as poor.
N=71:
Just fewer than nine in ten (86%) of POs said they received training for the LLG elections,
the remaining 14% failed to answer this question.
N=61:
Almost everyone who indicated they received training for the LLG elections:
received a copy of the PO manual (97% yes, 8% no, 5% no answer),
were given a chance to ask questions (87% yes, 10% no, 3% no answer),
received all the information they needed (92% yes, 7% no, 2% no answer),
believed procedures to have been clearly explained (87% yes, 7% no, 6% no
answer/not sure), and
understood the training (93% yes, 7% no answer/not sure).
One-quarter of trainings (25%) did not cover women and the elections (74% yes).
One in five (18%) did not cover HIV/AIDS and elections (77% yes).
15% did not cover PWD rights during elections (84% yes).
Two-thirds (67%) of PO trainees rated their training as good (51%) or very good (16%).
Another 18% as average and 12% as poor.
Trainees tended to think their LLG training was the same (53%) or better (23%) than the
training they received for the national elections. Less than one-quarter (23%) thought
their LLG training was worse than the training they received for the national elections.

19
Polling Official Training (N=71)
Polling officials were less likely than POs to have also worked for PNGEC during the
National Elections (55% yes, 25% no, 20% no answer); basically everyone employed
during the national elections received training at the time (95%).
N=39: (Small Sample Size)
Nine in ten officials rate the training they received at the time of the national elections
highly.
N=71:
Slightly fewer polling officials may have received training for the LLG elections than did
Presiding Officers (78% yes, 1% no), but is unclear given the high rate of non-response to
this question (21%).
N=55:
The vast majority of trainees:
were given a chance to ask questions (86% yes, 15% no),
received all the information they needed (89% yes, 11% no),
believed procedures to have been clearly explained (91% yes, 9% no), and
understood the training (87% yes, 2% no, 11% no answer/not sure).
Trainees were slightly less likely to have received a copy of the PO manual, however
(62% yes, 33% no, 6% no answer).
Nine in ten trainings (89%) covered rights of people with disabilities, only 11% did not.
Trainings for polling officials were more likely to cover the rights of people with
disabilities than the rights of women and voters living with HIV/AIDs:
One in five trainings (20%) did not cover women and the elections (76% yes).
One-quarter (26%) did not cover HIV/AIDS and elections (73% yes).
Three-quarters (76%) of officials rated their training as good (35%) or very good (42%) –
giving their training higher ratings than did POs. Another 16% rated their training as
average and 7% as poor.

20
ARO Training (N=71)
Three in five Election Managers/AROs confirmed AROs at their site received training for
the LLG elections (59% yes, 3% no, 38% no answer).
N=42: (Small Sample Size)
About half of stations trained AROs before the issue of writs (52%), while the remainder
provided training during the pre-polling period (48%).
On average only 1 female ARO was trained per station.
Basically all ARO training sessions: (questions may have been answered by managers
responsible for trainings)
provided an opportunity to ask questions (100% yes),
distributed training manuals (93% yes),
followed a presenter’s guide (98% yes),
believed procedures to have been clearly explained (91% yes, 9% no), and
were understood by trainees (87% yes, 2% no, 11% no answer/not sure).
Election Managers/AROs report having covered almost all of the topics about which
observers enquired during training sessions, that topics were covered comprehensively,
and that there were practical counting exercises included in sessions:
N= %
Receipt of nominations 42 100
Polling team 42 100
Conducting the draw 41 98
Ethics 41 98
Admin arrangements 41 98
HIV/AIDS 41 98
Women & elections 40 95
PWD 40 95
Polling schedules 38 91
Polling place layout and setup 38 91
Preparation for commencement 38 91
Pre-LLG election speech 38 91
Seal / Lock procedures 38 91
Indelible ink mark 38 91
Issue of ballot papers 38 91
Spoilt ballot papers 38 91
Assistance to voters 38 91
Materials & equipment 37 88
Monitoring polling procedures 37 88
Completing election returns 37 88
Security 36 86
Procedures for marking rolls 36 86
How to conduct count 36 86

21
Declaration of poll 36 86
N= %
Issuing section votes 35 83
Roles & responsibilities 35 83
Competing forms 66A & 66B 35 83
Packing ballot papers 35 83
Setup for counting 34 81
Materials and forms 34 81
Scrutineers 33 79
Engaging temp staff 32 76
Problems you may encounter 31 74
There were only 2 reports (5%) of AROs not being paid for travel BUT AROs at most sites
(81% yes) complained about non-payment of outstanding debts from previous elections
(5% no, 14% no answer/not sure).
Site Tallies (Voter Counts, Assistance, and Secret Balloting)
Form 3: In addition to their own analysis of station conduct, team leaders and
volunteers tallied voter flow through polling stations at two different instances during
their site visits for a total of 175 observations. Tallies included information about the
amount of voter assistance that was required in the voting process, as well as the
number of secret versus non-secret ballots cast.
Notable findings include: The 5,248 voters observed flowing in and out of stations during
observational periods were evenly divided between the sexes (2,684 male and 2,564
female). (The voter survey data, however, paints a different picture and the voter
survey sample leans more heavily male than female.)
More women than men were observed requesting assistance (779 men compared to
1065 women). Voters, however, self-report (in the voter survey) having required
assistance in relatively equal numbers (24% and 27%, respectively).
One-quarter of women (27%) who were observed getting assistance had assistance
forced upon them compared to 31% of men
About half of voters were observed voting in the open (53% no secret ballot) – this was a
relatively equal problem for male and female voters observed.

22
All Voters
Total Count
Assistance Given Secret Ballot
None Request Forced Yes No
Total 5248 2097 1844 744 3424 1807
Highlands 1333 362 320 651 418 915
Islands 355 301 52 2 332 23
Momase 2559 624 1314 89 2362 180
Southern 1001 810 158 2 312 689
Males
Total Count
Assistance Given Secret Ballot
None Request Forced Yes No
Total 2684 1238 779 346 1765 903
Highlands 670 265 120 285 246 424
Islands 175 153 22 0 164 11
Momase 1296 361 585 60 1186 94
Southern 543 459 52 1 169 374
Females
Total Assistance Given
Secret Ballot
Count None Request Forced Yes No
Total 2564 859 1065 398 1659 904
Highlands 663 97 200 366 172 491
Islands 180 148 30 2 168 12
Momase 1263 263 729 29 1176 86
Southern 458 351 106 1 143 315
(*It is important to keep in mind that tallies around voter assistance and secret balloting
do not equal the total number of voters who were observed moving in and out of polling
stations. As with other data, observers did not complete observations for all measures.)

23
Voter Experiences Form 2: Surveys were conducted by volunteer observers with 1,706 voters about their
voting experiences.
Demographics The demographic breakdown of adults interviewed is as follows:
%
Men 57%
Women 40%
Total <45 70%
18-24 18%
25-34 28%
35-44 24%
Total 45+ 25%
45-54 15%
55-64 8%
65+ 2%*
Highlands 36%
Momase 39%
Islands 19%
Southern 6%
Only 2% of exit polls with voters were conducted among voters ages 65+. We cannot
extrapolate from the data whether few older adults voted or whether observers were more
likely to conduct interviews with younger adults. This may suggest the need for additional
observer training on interview protocol in the event of future, similar projects.
Voting Behaviours
Four in five individuals (82%) interviewed at polling stations had already voted, some of
whom voted more than once. Seven per cent (7%) of voters interviewed voted more
than one time in the LLG elections, most of whom say they voted two or three times. It
is possible these individuals cast votes at the behest of other household members, but we
do not have additional information on this point.
In the Highlands, 79% of survey respondents had actually voted - 85% of Highlands
voters voted once while 15% report having voted multiple times. Within the Highlands,
improper voting was worst in the Western Highlands and Chimbu.

24
Number of Times Voted
Voters Only % Voted 1x % Voted 2+x
Highlands Voters 85% 15%
Southern Highlands 88% 12%
Western Highlands* 76% 24%
Chimbu* 61% 39%
*Small samples were conducted in the Western Highlands (n=52) and Chimbu (n=47). Data
should be treated as indicative rather than absolute.
Conversely, Momase (98% voted once) and Islands (97%) voters were most likely to have
voted only once. (Ninety percent of Southern voters cast only one vote.)
Four in five (83%) adults interviewed at polling stations found their name on the
electoral roll, another 5% were unable to find their name on the rolls (there was no
response coded for 12% of adults). The youngest cohort of voters was least likely to
locate their name on the voter rolls when they went to their polling station (see below).
Regionally, the Highlands experienced the largest discrepancies with voter rolls, only
64% of adults in the Highlands report their name was listed on the voter rolls, whereas
79% of Highlands adults interviewed had already voted. Please note, however, a
relatively high number of Highlands adults did not answer this question, and we
cannot definitively determine whether non-response = a negative response or a
response of “do not know”.
Name on the Electoral Roll
% Yes % No No Answer
Total 83% 5% 12%
Highlands 64% 7% 29%
Southern Highlands 61% 5% 34%
Western Highlands* 65% 2% 34%
Chimbu 83% 12% 5%
Momase 96% 2% 2%
Islands 92% 5% 3%
Southern 91% 7% 2%
18-24 79% 9% 12%
25-34 85% 4% 12%
35-44 84% 5% 11%
45-54 91% 3% 7%
55+ 87% 2% 11%
*Yes/No Totals do not add to 100 – 12% of survey respondents did not answer this question.
*Small sample size in the Western Highlands (n=62). Data should be treated as indicative
rather than absolute.

25
A little more than half of adults (55%) received LPV/civic awareness prior to the election
(37% no and 7% no answer). Younger adults were more likely to have been the
recipients of education/awareness efforts prior to the elections and exposure to
education decreases with age.
And while voting irregularities seem to have been highest in the Highlands, adults there
were most likely to report having received LPV/civic awareness prior to the LLG
elections. Incidence of prior education is lowest in Momase and the Southern region.
LPV/Civic Awareness Prior to Elections
% Yes % No No Answer
Total 55% 37% 7%
Highlands 77% 13% 10%
Momase 38% 59% 4%
Islands 56% 35% 8%
Southern 38% 47% 14%
18-24 63% 30% 7%
25-34 58% 36% 7%
35-44 54% 41% 5%
45-54 54% 39% 6%
55+ 48% 48% 6%
Recalled awareness efforts were largely carried out by civil society organizations (48% -
calculated among adults who received awareness prior to the election) and PNGEC
(39%). (Another 16% were educated by another organization.)
About two in five adults who were the recipient of awareness efforts, attended
awareness sessions in markets (42%) or their village generally (37%). Another one in ten
(11%) were communicated with in schools or in a church (9%).

26
The voting process was confusing for a significant portion of adults – 18% of adults
interviewed found the voting system confusing and difficult compared to 75% who said
it was easy to use. Another 7% failed to answer this question (in keeping with the
number of adults interviewed who reported they had not voted at the time of the
interview). The oldest cohort of adults (65+) seems to have found the voting process
most confusing (n=35 – too small to report out actual percentages), as did voters in the
province of East Sepik in Momase.
Impressions of the Voting System
% Easy % Confusing No Answer
Total 75% 18% 7%
Highlands 72% 17% 11%
Momase 74% 22% 4%
East Sepik 33% 65% 2%
Morobe 89% 8% 4%
Madang 90% 5% 5%
Islands 85% 11% 5%
Southern 78% 19% 3%
That said, more than four in five voters understood (84%) they had three vote choices
(7% no and 9% no answer). Miscomprehension of vote choices was significantly higher
in Momase (14%, due to East Sepik - 45% no) than other regions (3% in the Highlands,
3% in the Islands, and 1% in the Southern region).
By their own account, one-quarter of adults (26%) required assistance to vote (67% did
not and 7% did not answer). The youngest cohort of voters was least likely to require
assistance (only 15% of 18-24 year-olds required assistance) whereas the oldest cohort
of adults was most likely to require assistance. Roughly half of adults ages 65+ required
assistance to vote (n=35, sample size too small to report out actual percentages).
Men and women report having required assistance in relatively equal numbers (25% and
27%, respectively).
Voters in the Islands were least in need of assistance to vote:
Voting Assistance
% Required
Assistance
Total 26%
Highlands 32%
Momase 24%
Islands 17%
Southern 28%

27

28
Highlands voters confirm there were privacy issues at polling stations, and three in five
Highlands voters (61%) were unable to vote in private (26% yes and 13% no answer).
Lack of privacy was an issue for roughly one in five voters in other regions (20% of
Momase voters were unable to vote in private, 17% in the Islands, and 15% in the
Southern region). In the Highlands, privacy violations are worst in Chimbu (62%) and the
Southern Highlands (65%).
As we have seen in this and other data, coercion is a significant barrier to independent
voting in the Highlands where 37% of adults interviewed as part of these efforts say
someone got them to vote a certain way. Reports of coercion are problematic
throughout the country but nowhere as near as bad in other regions as in the Highlands
(3% in Momase, 11% in the Islands, and 12% in the Southern region).
In keeping with this, one-third (33%) of adults in the Highlands received money or gifts
to vote in a certain way (57% no and 10% no answer) compared to only 6% of Momase,
6% of Islands, and 9% of adults in the Southern region.
A plurality of adults in the Highlands acknowledge election conduct was worse this year
than last (42% worse) compared to 16% of adults in Momase, 15% in the Islands, and 3%
in the Southern region.