pn 1497 waste characterization methodology for direct ... · david douglas british columbia...
TRANSCRIPT
RECOMMENDED WASTE CHARACTERIZATION METHODOLOGY
FOR DIRECT WASTE ANALYSIS STUDIES IN CANADA
Report Prepared for:
CCME Waste Characterization Sub-Committee
Prepared by:
SENES Consultants Limited 121 Granton Drive, Unit 12
Richmond Hill, Ontario L4B 3N4
April 30, 1999
PN 1497
CCME Recommended Waste Characterization Methodology
32532 – Final Report – 30 April 1999 i SENES Consultants Limited
TABLE OF CONTENTS Page No.
EXECUTIVE SUMMARY .......................................................................................................ES-1
1.0 INTRODUCTION ...............................................................................................................1
2.0 REVIEW OF EXISTING WASTE CHARACTERIZATION STUDIES AND GUIDELINES ......................................................................................................................4 2.1 Review of Waste Characterization Studies ..............................................................4 2.2 Review of Existing Waste Characterization Guidelines ..........................................7
2.2.1 British Columbia Manual .............................................................................7 2.2.2 Ontario Ministry of Environment Procedures for the Residential
Waste Stream ...............................................................................................9 2.2.3 Ontario Ministry of Environment Procedures for the Commercial
Waste Stream .............................................................................................10 2.2.4 The California Integrated Waste Management Board Method ..................11
3.0 OVERALL APPROACH...................................................................................................14 3.1 Waste Characterization Approach .........................................................................14 3.2 Sample Selection ....................................................................................................15 3.3 Number of Samples................................................................................................15 3.4 Waste Categories ...................................................................................................16 3.5 Data Analysis and Reporting .................................................................................16
4.0 STUDY DESIGN...............................................................................................................17 4.1 Definition of Study Goals and Scope .....................................................................17 4.2 Recognition of Implementation Limitations ..........................................................17 4.3 Preliminary Data Collection ..................................................................................17 4.4 Study Planning .......................................................................................................18
4.4.1 Landfill-Based Sampling Programs ...........................................................18 4.4.2 Generator-Based Sampling Programs ........................................................19 4.4.3 Study Area and Timing ..............................................................................19 4.4.4 Seasonality .................................................................................................20 4.4.5 Precision Requirements .............................................................................20 4.4.6 Sample Weight ...........................................................................................22 4.4.7 Stratification of Study Population ..............................................................23 4.4.8 Waste Categories .......................................................................................23
5.0 SAMPLING AND MEASUREMENT PROCEDURES ...................................................28 5.1 Equipment and training ..........................................................................................28 5.2 Health and Safety ...................................................................................................28 5.3 Permission for Sample Collection .........................................................................28 5.4 Sample Collection ..................................................................................................29 5.5 Sample Sorting .......................................................................................................29 5.6 Moisture Content ...................................................................................................30 5.7 Data Recording ......................................................................................................31
CCME Recommended Waste Characterization Methodology
32532 – Final Report – 30 April 1999 ii SENES Consultants Limited
6.0 DATA ANALYSIS AND REPORTING ...........................................................................35 6.1 Raw Results ...........................................................................................................35 6.2 Averages for Sector and Season ............................................................................35 6.3 Reporting................................................................................................................36
7.0 RECOMENDED LOCATIONS FOR PILOT DEMONSTRATIONS .............................37
REFERENCES ..............................................................................................................................39
GLOSSARY ............................................................................................................................... G-1 APPENDICES: Appendix A: Comparison of Waste Categories Used by
Reviewed Studies and Methodologies Appendix B: Contact Information for Material Industries and
Associations Appendix C: Detailed Description of Statistical Methods
Disclaimer: This publication is a working paper only. It contains information which has been prepared for, but not approved by, the Canadian Council of Ministers of the Environment (CCME). CCME is committed to reflect the highest standards of research and analysis in its publications. Since CCME itself does not conduct research or author reports, it is not responsible for the accuracy of the data contained in the publications and does not warrant, or necessarily share or affirm, in any way, any opinions expressed therein.
CCME Recommended Waste Characterization Methodology
32532 – Final Report – 30 April 1999 ES-1 SENES Consultants Limited
EXECUTIVE SUMMARY The objective of this report is to provide guidance for conducting waste characterization studies in Canada. It flows from the results of the 1996 National Packaging Survey and the Canadian Council of Ministers of the Environment (CCME) request to know more about residential packaging composition and diversion in particular. The National Packaging Survey did indicate a 51.2% diversion of packaging waste from landfill between 1988 and 1996. Statistics Canada, which was commissioned to undertake the survey, could not, however, break out industrial, commercial and industrial (IC&I) waste diversion from residential waste diversion. The National Packaging Task Force decided, therefore, that a practical means of determining what was actually in landfill was a useful tool to pursue. Waste composition studies have been undertaken for many years but there has been little consistency in scope, approach, design, sampling, measurement, analysis or reporting of results. This study attempts to harmonize the various approaches used so that valid comparisons can be made between and within jurisdictions in Canada. At the same time, this study allows for a wide diversity of approaches to address widely varying objectives and interests: IC&I and/or residential; urban/suburban/rural; high income/middle income/low income areas; whether the region uses multi-material curb-side/depots or deposit system; fall/spring/summer; etc. The methodology developed in this study is based on direct waste analysis. Direct waste analysis involves the actual quantification of waste through for example, sampling and weighing trucks as they enter a landfill or collecting samples from generators, and conducting waste audits and studies where samples are sorted by waste type and weighed. This method was selected because it can potentially provide data that is detailed and accurate. As part of the research conducted to develop this methodology, a number of waste characterization studies undertaken in Canada in the last ten years were reviewed. In addition, existing guidelines for conducting waste composition studies used in three North American jurisdictions (British Columbia, California and Ontario) were reviewed. The recommended methodology includes guidance on:
the design of the study;
sample selection to minimize bias in sample collection;
sample size determination techniques to ensure a sufficient number of samples are collected to achieve the desired level of precision;
CCME Recommended Waste Characterization Methodology
32532 – Final Report – 30 April 1999 ES-2 SENES Consultants Limited
standardized waste categories to allow data to be combined or compared across different studies; and,
data analysis and reporting techniques. To demonstrate the utility of the methodology, recommendations on locations for pilot demonstrations, which encompass jurisdictions with different demographics (urban and rural) and different diversion programs, have been made. From discussions with various government and industry representatives, the following potential locations for pilot projects were identified.
Halifax which is an amalgamated municipality that encompasses both urban and rural areas;
The Regional Municipality of Cape Breton;
Winnipeg;
A rural Manitoba community;
The Town of Markham in Ontario;
The City of Windsor, Ontario;
The Bluewater Recycling Association which is an association of 57 municipalities in south western Ontario; and,
The Quinte Program in south western Ontario. It estimated that the cost of undertaking the pilot demonstrations would range between $7,500 to $15,000 depending upon the goals of the study and the nature of local programs. It is expected that this report will provide provinces, territories, municipalities and industry with an information base from which they can identify and implement focused waste diversion efforts thereby contributing to cost effective progress towards and beyond the goal for 50% waste diversion by 2000.
CCME Recommended Waste Characterization Methodology
32532 – Final Report – 30 April 1999 ES-3 SENES Consultants Limited
ACKNOWLEDGEMENTS The authors of this document would like to thank the various contributors, which supported our efforts. In addition to the funding provided by the Waste Characterization Sub-committee through the Canadian Council of Ministers of the Environment, we gratefully acknowledge the input provided by the follow individuals: Andrew Marr Greater Vancouver Regional District Policy and Planning Department Barry Friesen Nova Scotia Department of the Environment Bob Graham RIS Ltd. Bryan Levia Yukon Territorial Government Cathy Circo Canadian Plastics Industry Association David Douglas British Columbia Ministry of Environment, Lands & Parks Diane Kunec Canadian Council of Ministers of the Environment Doug Symington Consumers Glass Duncan Bury Environment Canada Fred Edgecombe Canadian Plastics Industry Association Glenn Parker Procter & Gamble Inc. Gregg Hallsworth Saskatchewan Environment and Resource Management Jean-Marc Jalbert Ministere de l’Environnement et de la Fuane Jim Dickson Alcan Rolled Products Company Jim Ferguson Manitoba Department of Environment Joanne Glynn New Brunswick Department of the Environment John Jackson Citizens’ Network on Waste Management John Mullinder Paper and Paperboard Packaging Environmental Council John Paulowich Canadian Steel Can Recycling Council Joseph Hruska Corporations Supporting Recycling Paul Remillard Greater Vancouver Regional District Policy and Planning Department Peter Williams Alberta Environmental Protection Richard Holt Greater Vancouver Regional District Policy and Planning Department Rob Sinclair Regional Municipality of Ottawa-Carleton Sherri Watson Federation of Canadian Municipalities Susan Antler Food and Consumer Products Manufacturers of Canada Tom Watkins Capital Regional District, British Columbia Translation of this document was provided by the New Brunswick Department of the Environment.
CCME Recommended Waste Characterization Methodology
32532 – Final Report – 30 April 1999 1 SENES Consultants Limited
1.0 INTRODUCTION The objective of this report is to provide guidance for conducting waste characterization studies in Canada. It flows from the results of the 1996 National Packaging Survey and the Canadian Council of Ministers of the Environment (CCME) request to know more about residential packaging composition and diversion in particular. The National Packaging Survey did indicate a 51.2% diversion of packaging waste from landfill between 1988 and 1996. Statistics Canada, which was commissioned to undertake the survey, could not, however, break out industrial, commercial and industrial (IC&I) waste diversion from residential waste diversion. The National Packaging Task Force decided, therefore, that a practical means of determining what was actually in landfill was a useful tool to pursue. Waste composition studies have been undertaken for many years but there has been little consistency in scope, approach, design, sampling, measurement, analysis or reporting of results. This study attempts to harmonize the various approaches used so that valid comparisons can be made between and within jurisdictions in Canada. At the same time, this study allows for a wide diversity of approaches to address widely varying objectives and interests: IC&I and/or residential; urban/suburban/rural; high income/middle income/low income areas; whether the region uses multi-material curb-side/depots or deposit system; fall/spring/summer; etc. It is important to recognize that waste characterization studies reveal only one moment in time (a snapshot). By themselves they do not directly indicate progress in reduction or re-use or recycling of materials. They indicate only what occurred at that point in time. Repeated studies over several years using the same approach and design are clearly necessary to discern any patterns or trends in waste diversion. It is also important to note that packaging is only one part of the waste stream and that decision-makers must consider that whole stream (whether residential or IC&I) when developing policy options and management initiatives. The report develops a consistent methodology for waste composition analysis and recommends locations for pilot demonstrations to verify it. It also provides an indication of the cost of such pilot demonstrations. It is expected that this report will provide provinces, territories, municipalities and industry with an information base from which they can identify and implement focused waste diversion efforts
CCME Recommended Waste Characterization Methodology
32532 – Final Report – 30 April 1999 2 SENES Consultants Limited
thereby contributing to cost effective progress towards and beyond the goal for 50% waste diversion by 2000. Previous studies have identified four main waste characterization approaches, which are described below.
Direct Waste Analysis which involves the actual quantification of waste, through for example, sampling and weighing trucks as they enter a landfill, or collecting samples from generators, and conducting waste audits and studies where samples are sorted by waste type and weighed.
Material Flows Analysis (MFA) which involves estimating the quantity of different materials in the waste stream based on records of production and/or purchases and adjustments for imports and exports, and product lifetimes.
Survey Analysis, which involves estimating the amount of different materials in the waste stream using data already, recorded in other sources.
Empirical Analysis which uses data collected in one of the three previous methods to derive empirical relationships or equations that can be used to estimate waste quantities or composition for other similar areas or for larger areas.
Direct waste analysis studies are generally either landfill-based or generator-based. In landfill-based studies, waste arriving at the landfill (or transfer station) is sampled whereas, in generator-based studies waste is collected from a selected sample of generators (e.g. households, institutions, industry). Generator-based studies generally provide greater flexibility in terms of dividing a sector into a number of sub-groups or strata with similar waste generation characteristics. The methodology developed in this study is based on direct waste analysis, as this method can provide data that is fairly detailed and accurate. As mentioned above, results from direct waste analysis studies can usually be extrapolated to similar jurisdictions using empirical analysis. Materials flow analysis can provide useful information for large geographical areas (such as countries), but is not appropriate for provincial and municipal estimates due to the difficulty of capturing inter-provincial and inter-municipal flow of goods. The accuracy of survey analysis results is dependent upon the existence of detailed records. Improved record keeping of items such as the number of bags of garbage generated per household, the blue box set out frequency, etc. can provide additional information for estimating waste generation, and diversion.
CCME Recommended Waste Characterization Methodology
32532 – Final Report – 30 April 1999 3 SENES Consultants Limited
The report addresses both residential and IC&I waste streams. It focuses upon the characterization of non-hazardous waste that is collected from households, institutions and businesses for recycling, composting or disposal. The methodology is designed for use by a number of different user groups including:
municipalities;
provinces;
industry associations; and,
institutions. Waste characterization studies may be undertaken to collect information for use in a variety of different applications, including:
the design of effective diversion programs for recyclables and organics;
implementing collection and processing systems;
testing the effectiveness of public education programs;
the design of materials recovery and composting facilities; and,
estimating environmental impacts of diversion and solid waste systems. The methodology recommended in this report was developed based on a review of methodologies used in various studies conducted in Canada over the last ten years and discussions with provincial, municipal, industry, and non-governmental organization (NGO) stakeholders. Section 2 of the report documents the results of the review of waste characterization studies undertaken in Canada and existing guidelines for waste characterization analysis. Section 3 describes the overall approach used in the development of the methodology. Section 4 provides guidance on the design of waste characterization studies. Section 5 outlines sample and measurement procedures. Section 6 provides guidance on data reporting and presentation of results. Section 7 recommends potential locations for pilot studies and estimates the associated costs.
CCME Recommended Waste Characterization Methodology
32532 – Final Report – 30 April 1999 4 SENES Consultants Limited
2.0 REVIEW OF EXISTING WASTE CHARACTERIZATION STUDIES AND GUIDELINES
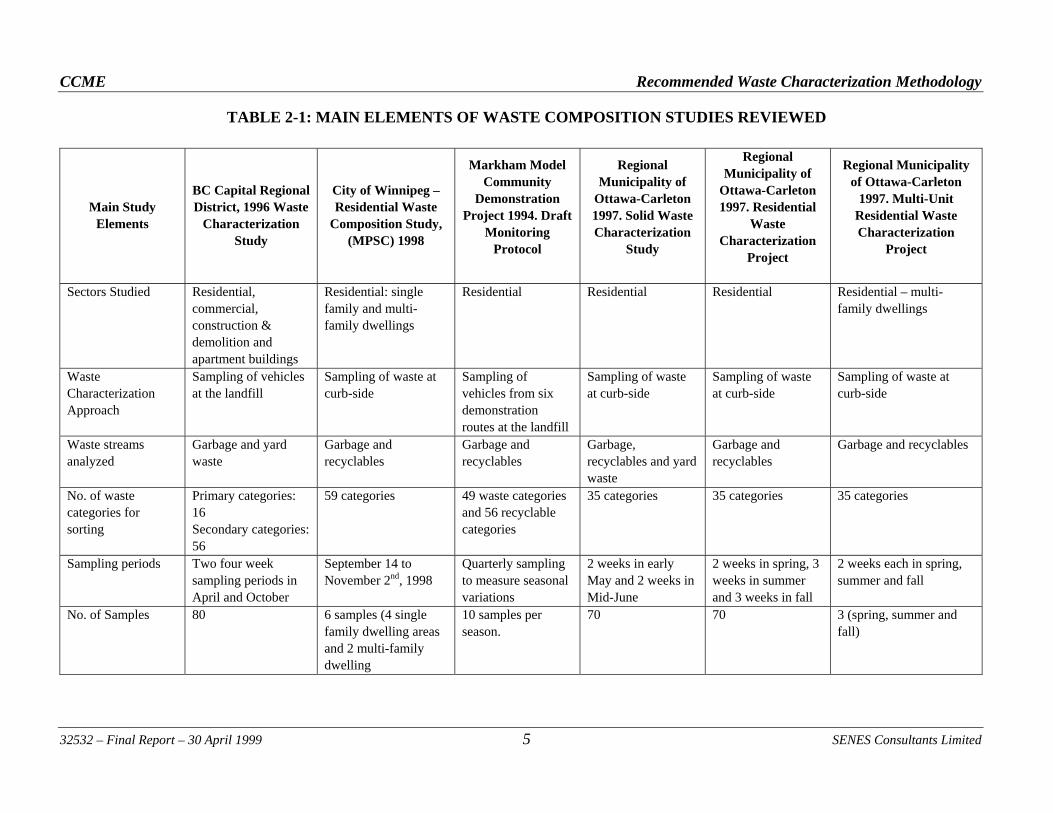
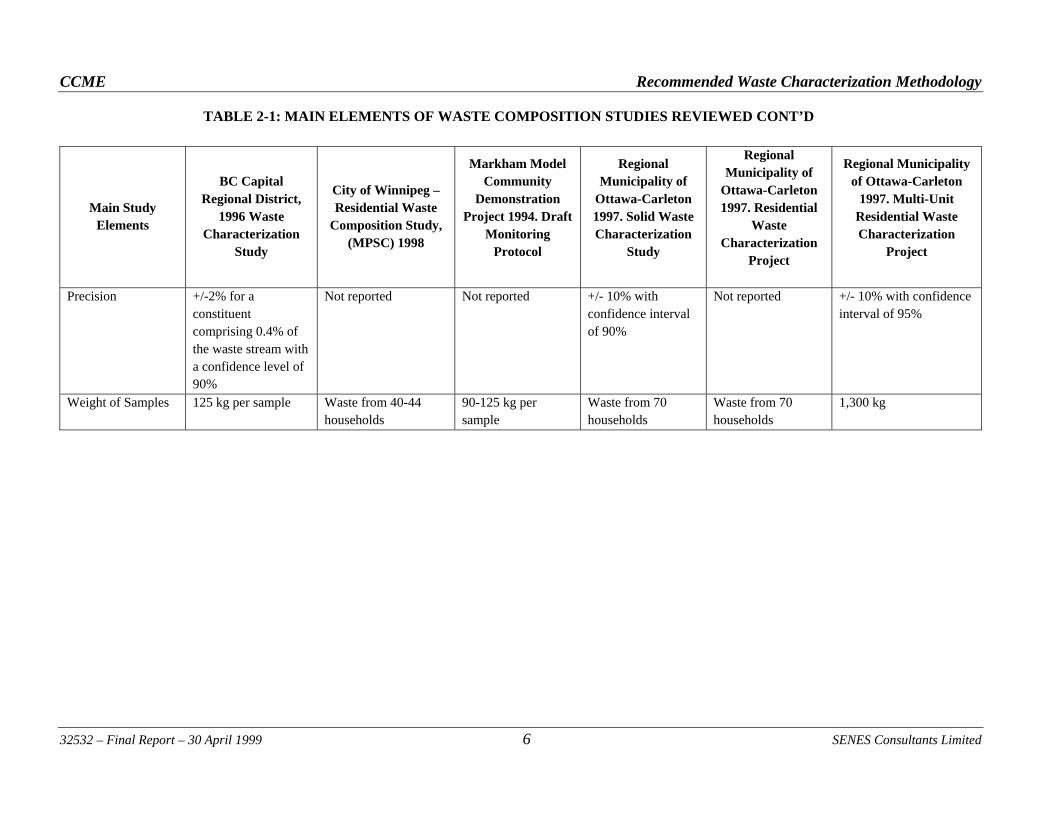
2.1 REVIEW OF WASTE CHARACTERIZATION STUDIES Reports from a number of waste characterization studies undertaken in the last ten years were collected from regions across Canada and the United States. A search of scientific literature databases was also conducted to identify additional sources of information for consideration in the development of this document. The review of the studies indicates that most of the work done to date has been in the area of residential waste compositions. Few reports or methodologies exist that reflect the complexities of determining the composition of IC&I waste. Table 2.1 summarizes the main elements of several of the waste composition studies reviewed. Numerous other studies also provide useful and interesting insights into the various approaches and results. These include the studies undertaken in Lunenburg, Nova Scotia and Quinte, Ontario. A detailed comparison of the waste categories used to sort the wastes in each of the studies was undertaken. It was found that the categories used varied substantially from study to study, with most studies dividing the categories into primary and secondary groupings. Generally 10-15 primary categories and 40-60 secondary categories were defined. A table showing the waste categories used in each of the studies reviewed is attached in Appendix A. Sampling location was another issues examined in the reviewed documents. Generally, samples were collected either at the curb-side or at the landfill. Depending upon the objectives of the study, both approaches were deemed to be appropriate. For studies into generation rates, diversion rates and disposal rates, curb-side collection was preferred as it allowed paired data sets to be collected to compare the proportion of the generated wastes that were being diverted (recycled) or disposed. Collection of wastes at the landfill was commonly used to simplify the collection process and to ensure all landfill-destined wastes were accounted for in the study. The weight of the sample to be sorted was one of the more consistent factors across the studies. A number of the studies referenced research by Britton (1972), Klee and Carruth (1970), and Lohani and Ko (1988). In general the studies sorted samples that were 90 – 135 kg. The number of samples collected and sorted in the reviewed studies varied from four per strata to ten per strata. In total some studies examined over 100 samples and others examined only 10, on an equivalent weight basis. A few of the studies reviewed, estimated the number of samples based on the desired level of precision and confidence in the results.
CCME Recommended Waste Characterization Methodology
32532 – Final Report – 30 April 1999 5 SENES Consultants Limited
TABLE 2-1: MAIN ELEMENTS OF WASTE COMPOSITION STUDIES REVIEWED
Main Study Elements
BC Capital Regional District, 1996 Waste
Characterization Study
City of Winnipeg – Residential Waste
Composition Study, (MPSC) 1998
Markham Model Community
Demonstration Project 1994. Draft
Monitoring Protocol
Regional Municipality of
Ottawa-Carleton 1997. Solid Waste Characterization
Study
Regional Municipality of
Ottawa-Carleton 1997. Residential
Waste Characterization
Project
Regional Municipality of Ottawa-Carleton
1997. Multi-Unit Residential Waste Characterization
Project
Sectors Studied Residential, commercial, construction & demolition and apartment buildings
Residential: single family and multi-family dwellings
Residential Residential Residential Residential – multi-family dwellings
Waste Characterization Approach
Sampling of vehicles at the landfill
Sampling of waste at curb-side
Sampling of vehicles from six demonstration routes at the landfill
Sampling of waste at curb-side
Sampling of waste at curb-side
Sampling of waste at curb-side
Waste streams analyzed
Garbage and yard waste
Garbage and recyclables
Garbage and recyclables
Garbage, recyclables and yard waste
Garbage and recyclables
Garbage and recyclables
No. of waste categories for sorting
Primary categories: 16 Secondary categories: 56
59 categories 49 waste categories and 56 recyclable categories
35 categories 35 categories 35 categories
Sampling periods Two four week sampling periods in April and October
September 14 to November 2nd, 1998
Quarterly sampling to measure seasonal variations
2 weeks in early May and 2 weeks in Mid-June
2 weeks in spring, 3 weeks in summer and 3 weeks in fall
2 weeks each in spring, summer and fall
No. of Samples 80 6 samples (4 single family dwelling areas and 2 multi-family dwelling
10 samples per season.
70 70 3 (spring, summer and fall)
CCME Recommended Waste Characterization Methodology
32532 – Final Report – 30 April 1999 6 SENES Consultants Limited
TABLE 2-1: MAIN ELEMENTS OF WASTE COMPOSITION STUDIES REVIEWED CONT’D
Main Study Elements
BC Capital Regional District,
1996 Waste Characterization
Study
City of Winnipeg – Residential Waste
Composition Study, (MPSC) 1998
Markham Model Community
Demonstration Project 1994. Draft
Monitoring Protocol
Regional Municipality of
Ottawa-Carleton 1997. Solid Waste Characterization
Study
Regional Municipality of
Ottawa-Carleton 1997. Residential
Waste Characterization
Project
Regional Municipality of Ottawa-Carleton
1997. Multi-Unit Residential Waste Characterization
Project
Precision +/-2% for a constituent comprising 0.4% of the waste stream with a confidence level of 90%
Not reported Not reported +/- 10% with confidence interval of 90%
Not reported +/- 10% with confidence interval of 95%
Weight of Samples 125 kg per sample Waste from 40-44 households
90-125 kg per sample
Waste from 70 households
Waste from 70 households
1,300 kg
CCME Recommended Waste Characterization Methodology
32532 – Final Report – 30 April 1999 7 SENES Consultants Limited
Seasonal variations were recognized to exist by most studies. In general, an attempt to evaluate this variation was based on repeating the study at different times of the year and comparing the results. No large variations in the composition of the residential wastes other than in the yard wastes were reported. 2.2 REVIEW OF EXISTING WASTE CHARACTERIZATION GUIDELINES As part of the research conducted to develop this methodology, the following existing North American guidelines for conducting waste composition studies were reviewed:
BC Environment 1991. Procedural Manual for Municipal Solid Waste Composition Analysis, November;
Ontario Ministry of Environment 1991. Procedures for the Assessment of Solid Waste Residential and Commercial, Volume III of the Ontario Waste Composition Study, July; and,
California Integrated Waste Management Board 1998. CIWMB Uniform Waste Disposal Characterization Method.
The sections below summarize the main elements of each of these methodologies. 2.2.1 British Columbia Manual The BC manual only addresses the characterization of residential and commercial/institutional wastes. It does not cover industrial wastes. 2.2.1.1 Waste Characterization Approach The BC manual recommends the use of a disposal site (e.g. landfill or incinerator) based approach and lists a number of advantages of this approach including:
It provides a better appreciation of the waste entering the landfill and ensures that a part of the waste stream is not overlooked;
It provides a better estimate of large and bulky items; and,
It is more cost effective. 2.2.1.2 Sample Selection The BC manual states that vehicles from which samples are obtained should be chosen randomly with no bias towards morning or afternoon or, large and small loads. It recommends that the loads should come from the entire week, including weekends if possible. A systematic sampling
CCME Recommended Waste Characterization Methodology
32532 – Final Report – 30 April 1999 8 SENES Consultants Limited
methodology is recommended whereby every nth vehicle is selected. Each sub-waste stream (e.g. residential vs. IC&I, single family dwellings vs. multifamily dwellings, etc) studied is required to be considered separately. The BC manual describes the use of the grid method for sampling waste from selected truck loads in order to ensure that the samples are obtained from random locations in the waste pile. 2.2.1.3 Number of Samples The BC manual provides a look-up chart for estimating the number of samples required based on the desired precision levels with 90% confidence and the coefficient of variation of the waste stream. The BC manual recommends a sample size of 136 kg after the removal and weighing of large and oversize items. The BC manual recommends that samples of 100-500 grams of the materials that are susceptible to variation in moisture content (such as paper, plastics, textiles, etc.) should be sent for moisture content analysis. This is to allow dry weight compositions and “as-generated” weight compositions to be estimated from the wet weight compositions obtained from the weighing of the sorted wastes. 2.2.1.4 Material Categories The BC manual lists 15 main categories and 60 sub-categories. The manual recognizes that depending on the goal of the study, fewer categories may be required. 2.2.1.5 Data Analysis Methods The BC manual describes the following data analysis steps:
Input of wet weight data into a spreadsheet;
Calculating the percent composition on a wet weight basis;
Using moisture content values to convert wet weights into dry weights; and,
Calculating percent composition on a dry weight basis.
CCME Recommended Waste Characterization Methodology
32532 – Final Report – 30 April 1999 9 SENES Consultants Limited
2.2.2 Ontario Ministry of Environment Procedures for the Residential Waste Stream 2.2.2.1 Waste Characterization Approach The Ontario report describes the procedures that were used to undertake waste composition studies in three Ontario municipalities. The approach used in these studies was based on sampling of garbage and recyclables at the point of generation. The recommended study design takes into account socio-economic and demographic characteristics of a population. The study used sample areas consisting of enumeration areas (EA) (defined by Statistics Canada) classified by income (high, medium and low) and housing type (single, multi, and mixed). Each EA is made up of approximately 300 dwellings and has a population of between 600 and 800 persons. EAs were randomly selected and a curb-side refuse sampling plan was developed based on a procedure for assigning random starting points for refuse collections at street intersections throughout the EA. 2.2.2.2 Number and Size of Samples At a minimum, nine samples were collected from each EA studied. Each sample was a minimum of 100 kg. This sample size was based on achieving a desired level of statistical accuracy for kitchen waste. The report recognizes that larger sample sizes would be required to obtain the same level of accuracy for smaller components of the waste stream such as glass and ferrous metals. Yard wastes were weighed and recorded wherever they were encountered but this information was excluded from the calculation of residential waste composition because of its seasonal variability. Where large or bulky items were placed at the curb for collection with the garbage, the weight of these items was excluded from the 100 kg sample. This decision was made provided that the item(s) were judged by a person with experience in waste composition studies to not be a part of the regular waste stream. The study recommended the setting up of separate year-long monitoring programs for yard wastes and large or bulky items. 2.2.2.3 Waste Categories Fourteen main categories and nearly 50 sub-categories of materials are defined in the study. The study recommends that, where an item composed of several materials is found, it should be classified on the basis of the predominant material by weight. 2.2.2.4 Data Analysis Methods The Ontario report outlines the following data analysis procedures:
Calculation of the percent composition of waste;
CCME Recommended Waste Characterization Methodology
32532 – Final Report – 30 April 1999 10 SENES Consultants Limited
Calculation of per capita waste generation rates in municipalities with and without blue box programs; and,
Estimation of the waste component generation rate based on the percent composition and the per capita waste generation rate.
2.2.3 Ontario Ministry of Environment Procedures for the Commercial Waste Stream 2.2.3.1 Waste Characterization Approach and Sample Selection The methodology recommended for the characterization of commercial waste in the Ontario study was based on sampling at the point of generation and included the following elements:
Selection of SIC codes for the study;
Selection of sample businesses;
Collection of waste samples;
Waste Sorting; and,
Analysis and Reporting. A study of SIC codes was done to determine which codes are dominant in the area and which could be combined in terms of types of wastes produced. Major groups were identified for study. In some cases general groups were desegregated to investigate the sub-groups within a group. The selection of the businesses included discussions with the operators and possibly site visits prior to sampling. The business needed to:
not share a waste collection bin with another operation;
not have a internal compactor bin and preferably not any compactor; and,
locate the waste bin in a safely accessible location. Samples were collected a day prior to a scheduled pick-up. Some businesses were visited 3 or more times to collect a week’s worth of waste. Two to three sites were sampled per day. Larger bins (6 – 8 cu. yd.) were only half sorted. The number of employees at the site was also recorded. 2.2.3.2 Number and Size of Samples The sampling involved the collection of one week of accumulated wastes from the selected businesses. The sample sizes varied from 2.4 to 5782 kg. The report recommends that number of
CCME Recommended Waste Characterization Methodology
32532 – Final Report – 30 April 1999 11 SENES Consultants Limited
samples and size of these samples should be determined taking into account the study’s resource constraints (time and money). 2.2.3.3 Material Categories The waste categories used for sorting the wastes were essentially the same as those used in the residential study. 2.2.3.4 Data Analysis and Reporting The study outlines the following data analysis and reporting procedures:
Estimation of the average generation rate of total waste per employee over the study period, for each of the commercial groups;
Assess the relationship between waste generation and employment by regression analysis where sample size permits;
Analyze Statistics Canada employment data and the municipality’s planning data to generate an estimate of the total number of people employed in the commercial groupings for which waste generation estimates have been obtained;
Multiply the total municipal employment figure by the employee waste generation rate for each SIC group to estimate the quantity of waste generated in a specific time period by each of the commercial activities; and,
Estimate the total waste generation of the commercial sector (or part thereof) by adding together the waste estimates for the individual groups.
2.2.4 The California Integrated Waste Management Board Method The CIWB uniform waste characterization method for collecting data on the waste stream has been incorporated into draft regulations developed by the Board. The Board may require a jurisdiction that does not meet California’s waste diversion goals to conduct a waste characterization study using this methodology. The CIWMB method addresses the characterization of wastes to be disposed only. There is no requirement in California to collect information on waste that is diverted from disposal. 2.2.4.1 Waste Characterization Approach This CIWMB allows the user to select the waste characterization approach that best fits its requirements from one of the following:
CCME Recommended Waste Characterization Methodology
32532 – Final Report – 30 April 1999 12 SENES Consultants Limited
Landfill sampling;
Waste generator sampling;
Use of default data from the CIWMB’s database;
Use of existing data; and,
Combination of approaches where appropriate. The method also states that a jurisdiction may use a materials flow data collection approach when attempting to characterize a specific component of the waste stream. The jurisdiction is required to provide a rationale for the approach selected for its study. 2.2.4.2 Sample Selection The CIWMB method stipulates that for landfill studies, samples should be chosen randomly. This involves random selection of the vehicles to be sampled as well as random selection of the sample from each vehicle. The latter is to be achieved through the use of the grid method or the cone and quarter method described in the ASTM D5231-92 “Standard Test Method for Determination of the Composition of Unprocessed Municipal Solid Waste”. For generator studies, the method recommends that the sector be divided into strata based on criteria affecting waste generation patterns. The method recommends use of the “80/20” rule where the sub-population to be sample is stratified into the 20% of generators that produce 80% of the waste in that sector. Eighty percent of the samples would then be obtained from the 20% that generate 80% of the waste, with the other 20% of samples coming from the group that generates the remaining 20%. Where stratification is not possible the method states that random selection of generators is acceptable. 2.2.4.3 Number of Samples The CIWMB method provides a look-up table for determining the minimum number of samples and the minimum weights of the samples for different waste streams (residential and non-residential), different waste characterization approaches (landfill-based and generator-based sampling) and, different levels of stratification (sector level, homogenous sub-population, diverse sub-population). Depending on these factors, the recommended number of samples varies from 25 to 50 per year distributed over a minimum of two seasons. Recommended minimum sample weights are 200 lbs. for landfill-based studies and 125 lbs. for generator-based studies.
CCME Recommended Waste Characterization Methodology
32532 – Final Report – 30 April 1999 13 SENES Consultants Limited
2.2.4.4 Material Categories The California regulation defines forty-one main material categories and a number of sub-categories. Local governments are required to collect data on the main material categories as a minimum. 2.2.4.5 Data Analysis Methods For landfill-based studies, the method recommends that the overall sector composition be assumed to be equal to the mean of the sample compositions. Thus the percentage of each material type in each sample would be added together and divided by the number of samples. For generator-based studies, the method recommends that the data from each generator is weighted based upon the importance of the generator within the sector (in terms of size, no. of employees, etc). Data from each strata would then be weighted according to the size of the strata.
CCME Recommended Waste Characterization Methodology
32532 – Final Report – 30 April 1999 14 SENES Consultants Limited
3.0 OVERALL APPROACH The purpose of this study is to develop a methodology which sets out standard procedures and protocols for measurement, waste category definition and source classifications using statistical principles for sampling and reporting. This will allow studies undertaken across Canada to produce comparable results with the precision bounds required for making decisions while allowing flexibility in the particular focus of the study. The core elements of the recommended methodology include:
Sample size determination techniques to ensure a sufficient number of samples are collected to achieve the desired level of precision;
Standardized waste categories to allow data to be combined or compared across different studies;
Randomized sample selection to minimize bias in sample collection; and,
Results reporting in terms of waste generation rates (eg. kg capita-1 d-1) for each waste type rather than percent composition. This provides more directly applicable results for planning purposes and facilitates valid comparisons of the results, across groups and jurisdictions.
The methodology focuses on the use of direct waste analysis to determine the composition of wastes that are intended for disposal. However, the methodology is equally applicable to the analysis of recyclable and organic wastes captured in diversion programs. 3.1 WASTE CHARACTERIZATION APPROACH Waste sampling can be conducted at the disposal facility (e.g. landfill) or directly from generators (e.g. dumpsters and curb-side set-outs). Depending upon the goals of the study and the availability of resources, either approach may be appropriate. The design of landfill-based sampling studies is typically simpler and more cost effective. Also, landfill-based sampling can potentially provide greater insight into the total waste going to landfill, and allow better estimation of the quantity of large and oversize items such as white goods and mattresses. On the other hand, generator-based sampling can provide valuable additional information on waste generation and diversion patterns, as it provides greater opportunity for stratification of the sector under study. Ensuring that all sources of waste and any additional diversion activities that occur prior to disposal are accounted for can be more difficult in generator-based sampling. As study resources allow, consideration should be given to developing a program that combines both approaches to take advantage of the benefits from each.
CCME Recommended Waste Characterization Methodology
32532 – Final Report – 30 April 1999 15 SENES Consultants Limited
IC&I studies need to consider a number of strata to manage variability and therefore the complexity of sampling among the various strata would be better managed by collecting samples directly from the waste generator. Again, the landfill-based sampling for IC&I is possible, but the high variability expected from this sector will require a large number of samples to be collected to achieve a reasonable level of precision. 3.2 SAMPLE SELECTION Any random selection process can be used to select the routes provided the process ensures an equally likely chance of selecting any one route and the selections are done without replacement. Use of a random number table is helpful in this process. Dividing the sector under investigation into sub-groups or strata with similar waste generation characteristics helps to reduce the variability in waste composition and provides additional information for use in the design of effective diversion programs. It is recommended that the residential sector should be broken down into a minimum of two strata: single-family dwellings and multi-family dwellings. Stratification by community type is also recommended; urban, suburban and rural divisions are expected to be sufficient and depending upon the goal of the study and the nature of the community all three may not be necessary. Should the investigator wish to examine other strata, such as high, middle and low income levels, they can also be incorporated into the study. To allow for these types of studies to be successful, municipalities are encouraged to map their waste flows and develop monitoring programs. Waste flow data tracked in a standardized fashion will improve the ability of a program to collect information that is specific to the groups of interest (strata). The stratification of the IC&I sector is more complex and a system such as the Standard Industrial Classification (SIC) or other similar organizational/classification systems are typically used. Reasonable success can be expected by dividing Commercial operations into Office, Retail and Other. Similarly, the Institutional operations could be split at a minimum, into medical and non-medical. The Industrial sector presents the greatest challenge because of its diversity. 3.3 NUMBER OF SAMPLES The number of samples to be collected should be determined based on the level of precision that is desired in the results. The other input in the determination of the number of samples is the variability of the results between samples. Where the variability may not be well known, estimates of the variability can be used. In Section 4, methods for determining the required number of samples are discussed.
CCME Recommended Waste Characterization Methodology
32532 – Final Report – 30 April 1999 16 SENES Consultants Limited
3.4 WASTE CATEGORIES One of the primary objectives of this methodology is to allow for information to be gathered to guide packaging diversion programs and initiatives. The waste categories have been recommended with this general objective in mind and based on the input of industry sector representatives. The waste stream has been categorized into groups of items that are relatively easy to recognize (to facilitate accurate sorting) and to the extent possible, the number of categories has been minimized to reduce the level of effort and cost involved in conducting the study. The stakeholder consultation program undertaken indicated that a flexible methodology, which is capable of addressing the local study objectives, is required. The methodology therefore allows for the combination and splitting of the standard material categories as found necessary. However, the methodology requires that when more detailed sub-categories are used this should be done in such a way so that it is possible to aggregate back to the standard material categories. 3.5 DATA ANALYSIS AND REPORTING Data analysis and reporting requirements are defined to establish an organized method to ensure the large amount of data collected in the study undergoes valid analysis and consistent reporting. Study results are calculated and reported in terms of waste generation rates (eg. kg capita-1 d-1) for each waste type rather than percent composition. This provides more directly applicable results for planning purposes and facilitates valid comparisons of the results, across groups and jurisdictions. Knowing the overall composition of the waste is of interest however, diversion initiatives are often specific to a single material. The planning of these initiatives will depend on the generation rates (eg. kg capita-1 d-1) to determine if sufficient quantities are produced for a practical and economically viable program to be established. Comparison of waste generation rates (eg. kg capita-1 d-1), as opposed to percent compositions, provides better understanding of similarities and differences across the compared results, whether they represent different jurisdictions or time-periods. Waste generation rates will allow comparisons on a per-capita and time-period basis for each component of the waste. Where some components may be found to be generated at different rates, components with similar generation rates are easily identified. If percent compositions are compared, however, a change in one component affects the reported percentage composition of all components. Therefore, similarities are more difficult to identify using percentage compositions.
CCME Recommended Waste Characterization Methodology
32532 – Final Report – 30 April 1999 17 SENES Consultants Limited
4.0 STUDY DESIGN Study design is an important component in any waste composition study. The objectives of the study and the precision requirements are defined so that a focussed and efficient design can be accomplished within the available budget. This section describes the general components of a study design and provides guidance for studies that can be developed based on a simplified statistical sampling design. The approach is applicable to a wide range of waste composition studies from infrequent or small surveys of simple scenarios through to large-scale comprehensive studies. However, reduced cost and increased precision may be realized, especially in the case of large studies, through the use of more rigorous and formal statistical designs that take into account site-specific considerations. Below, study design considerations are defined and briefly discussed. Forms, which summarize the study design considerations into instruction sheets, are attached at the end of the chapter. 4.1 DEFINITION OF STUDY GOALS AND SCOPE The goals of the study should be determined through discussion with stakeholders and users of the study results. The way in which the results will be used should be examined, to gather the necessary details for designing the study. The following should be defined in this process:
Waste generator sectors to be studied (residential or IC&I);
Sub-populations to be compared;
Waste streams of interest;
Detail desired for division of waste streams; and,
Precision of results. 4.2 RECOGNITION OF IMPLEMENTATION LIMITATIONS In all studies there will be physical, timing and budgetary limitations. These limitations should be documented for consideration during the design process so that the best possible study can be developed within these limits. 4.3 PRELIMINARY DATA COLLECTION In order to plan the study it is recommended that records are collected from several sources.
CCME Recommended Waste Characterization Methodology
32532 – Final Report – 30 April 1999 18 SENES Consultants Limited
Landfill delivery records should provide information on the areas serviced by the landfill and the number of deliveries and weights of waste received from the various communities and by generator type. Waste pick-up route plans should be collected from the municipality and/or hauler in the study area. This information should provide information on the number and types of homes or businesses included on each pick-up route. Where detailed data is available, random pre-selection of routes for sampling can be undertaken. Depending on the other strata selected for the study, other possible data sources include census data, municipal planning, and municipal taxation records. To include strata for income levels, municipal taxation records could be used to determine housing values. It is common to use housing values as a surrogate for income levels, which are generally privately held. Census data may also provide sufficient detail on average income levels for the purposes of this study. Municipal planning records combined with census data and SIC codes will provide the most probable sources of information for planning the strata within the IC&I sector. Alternate systems of classifying the IC&I organizations may exist within the local municipal planning or taxation records. It is important to know the number of residents or employees in each sector (i.e. the population) so that waste generation rates (eg. kg capita-1 d-1) can be determined at the sector level. These can be often be independently determined from information such as Census data (regional or enumeration area, tax rolls, or regional planning files). Alternative approaches are to investigate the truck routes by asking the driver or physically surveying the truck route for the sampled loads. The serviced population in the sector can be estimated by multiplying the population serviced in the sampled homes. 4.4 STUDY PLANNING 4.4.1 Landfill-Based Sampling Programs Landfill studies are based on randomly selected trucks for direct waste sampling. These designs work best when the trucks contain wastes from readily definable sectors of interest and records exist on the number of trucks and the weights delivered for each sector. The total number of residents or employees in the sector should also be known. The ideal sampling approach under these conditions is to randomly select the trucks for each sector from a list of the trucks or routes. The total number of trucks for the sector and the total waste weight are known for the sector and waste generation rates (eg. kg capita-1 d-1) are known for the entire sector.
CCME Recommended Waste Characterization Methodology
32532 – Final Report – 30 April 1999 19 SENES Consultants Limited
Trucks may contain wastes from multiple sectors such as mixed commercial/residential but, it is necessary to estimate individual sectors. In this case, the trucks should be classified into “pure” sector trucks and “mixed sector” trucks. The population percentage falling into each “pure” sector must be estimated so that the “pure” composition results can be used to estimate the sector generation rate (eg. kg capita-1 d-1). Alternatively, the “pure” sector results can be reported as average composition. A concern here is that the sector waste in the “mixed” loads is systematically different from the wastes in the “pure” loads. Landfill sampling is robust for all-sector composition studies. 4.4.2 Generator-Based Sampling Programs Generator studies enable detailed studies of waste composition since the waste is collected directly from the generator. Generators are selected from specified categories and often the number of residents or employees are known precisely for each sample. These approaches can require many samples since, potentially, several sectors can be identified and sampled. Furthermore, there can be substantial variability between samples compared to the natural averaging/mixing of wastes for truck-loads arriving at the landfills. The generator-based sampling designs however can provide much higher precision than landfill sampling designs when there is substantial variation between sectors or precise estimates are required from a specific sector. 4.4.3 Study Area and Timing Study locations should be selected that are appropriate for the urban, suburban and rural strata to be studied. Minor modifications to the methodology may be required to accommodate study areas which have their wastes delivered to a transfer station prior to transport to the landfill. The study duration will depend on the number of strata that are selected in the final study design, the number of samples sorted within each stratum and the staffing available to sort. It is estimated that two staff can sort approximately three samples of 90-135 kg in a day. BC Environment (1991) recommended similar time requirements in its procedural manual for composition analysis. It should be noted that additional staff would be required to perform other tasks as part of the study, at the same time. Staffing requirements are discussed further in the sections below. Consideration should be given to biweekly and monthly collection schedules before defining the sampling duration.
CCME Recommended Waste Characterization Methodology
32532 – Final Report – 30 April 1999 20 SENES Consultants Limited
4.4.4 Seasonality Seasonal comparisons should involve a minimum of two study periods. It is recommended that these are scheduled for summer and late fall to maximize the time interval between study periods. Seasonal variations are expected in not only yard wastes, but also in beverage containers. If project resources are available for additional study periods, spring and possibly winter should be considered. However, complications are to be expected with any study periods planned for winter. By examining the seasonal variations of the wastes generated, better extrapolations of the results can be made to time periods outside the study period. The generation rates (eg. kg capita-1 d-1) calculated will be based on the period of study. Annual generation rates, however, are most commonly reported and used for planning. 4.4.5 Precision Requirements Precision is equivalent to the reproducibility of a calculated result. It is expressed in terms of the uncertainty range around a calculated value. For clarification, note that a measurement is considered to be accurate when the true value is within the precision range of the measurement. To plan the waste characterization study, the desired level of precision should be defined and then examined in terms of available budget and resources. Specifically, this means the investigator should define the range of uncertainty that will be acceptable in the results. Depending of the planned use of the study results, a specific level of detail may be required. For example, the investigator may need to know the composition of certain waste components within +/-50%. Variation in the composition of waste exists between different samples from a given sector due to variations in behaviour and characteristics of generators. The variation can be quantified through measurements of multiple samples and is usually expressed in terms of the estimated mean and uncertainty bounds on the mean (i.e confidence intervals). The number of samples can be determined such that the uncertainty bounds meet the precision objectives of the survey but some prior knowledge, or estimate, of the variability present in the samples is necessary. This information on the variability can come from literature surveys, pilot studies, previous waste composition studies, of waste composition completed in other jurisdictions. The number of samples required to achieve a precision objective can be calculated in an iterative process, using the following equation,
CCME Recommended Waste Characterization Methodology
32532 – Final Report – 30 April 1999 21 SENES Consultants Limited
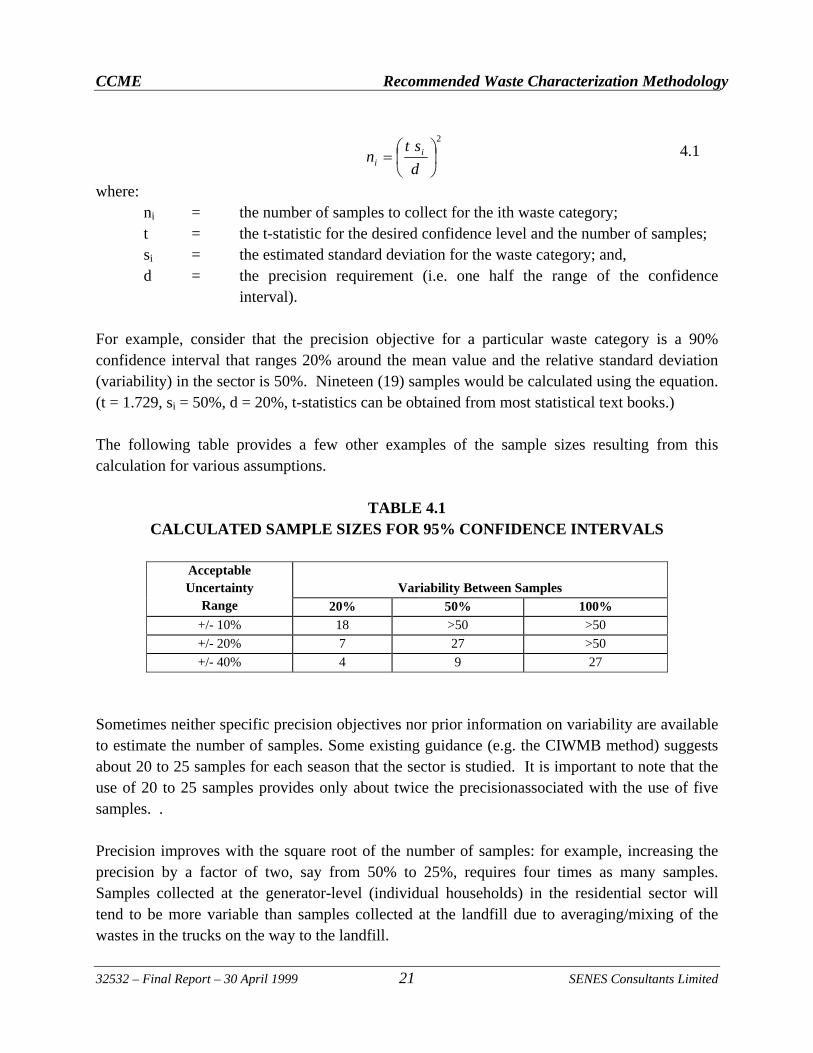
where: ni = the number of samples to collect for the ith waste category; t = the t-statistic for the desired confidence level and the number of samples; si = the estimated standard deviation for the waste category; and, d = the precision requirement (i.e. one half the range of the confidence
interval). For example, consider that the precision objective for a particular waste category is a 90% confidence interval that ranges 20% around the mean value and the relative standard deviation (variability) in the sector is 50%. Nineteen (19) samples would be calculated using the equation. (t = 1.729, si = 50%, d = 20%, t-statistics can be obtained from most statistical text books.) The following table provides a few other examples of the sample sizes resulting from this calculation for various assumptions.
TABLE 4.1 CALCULATED SAMPLE SIZES FOR 95% CONFIDENCE INTERVALS
Acceptable Uncertainty
Range
Variability Between Samples
20% 50% 100% +/- 10% 18 >50 >50
+/- 20% 7 27 >50
+/- 40% 4 9 27
Sometimes neither specific precision objectives nor prior information on variability are available to estimate the number of samples. Some existing guidance (e.g. the CIWMB method) suggests about 20 to 25 samples for each season that the sector is studied. It is important to note that the use of 20 to 25 samples provides only about twice the precisionassociated with the use of five samples. . Precision improves with the square root of the number of samples: for example, increasing the precision by a factor of two, say from 50% to 25%, requires four times as many samples. Samples collected at the generator-level (individual households) in the residential sector will tend to be more variable than samples collected at the landfill due to averaging/mixing of the wastes in the trucks on the way to the landfill.
4.12
d
stn i
i
CCME Recommended Waste Characterization Methodology
32532 – Final Report – 30 April 1999 22 SENES Consultants Limited
Precision objectives are unlikely to be met for all waste categories due to the high variability for some categories: estimates of the number of samples should be reviewed relative to study cost and objectives before conducting the survey. Study areas that have a diverse mix of waste generators will require more strata to create homogeneous groups for sampling. In these studies, the total number of samples collected will be greater. For example, at a given level of precision, a small community, where all residences fall under one strata, will require fewer samples in total for the study than would be required for a study area that had several strata. Study budgets may limit the number of samples that can be sorted, before precision objectives are met. Especially where a defined limit is set on the number of samples based on budget, the precision of the results should be considered. This assessment will provide information on the usefulness of the results under the sampling restrictions. 4.4.6 Sample Weight Increasing the amount sampled, increases the precision of the results, however, the benefits of increasing the amount sampled, diminishes substantially beyond a certain point. Research by Klee and Carruth 1970, and by Britton 1972 suggest optimal weight for sampling is between 90 and 135 kg for municipal solid waste. This was reported in characterization studies to be approximately equivalent to the weekly wastes from eight households (RMOC 1991, CSR 1994). Klee 1993, determined a relationship for estimating the optimal sample weight for waste streams with small particle sizes. The relationship showed that for increasing particle sizes, larger sample weights were required. It follows that with waste streams such as the IC&I sector, which may contain large items, larger sample weights would be required to achieve a given precision. Recognizing that it is easier to sample a given volume rather than a specific weight, a standard sample volume should be estimated based on the target weight. For residential studies, a target weight of 90 – 135 kg is recommended. For IC&I studies, the weight of waste sampled should be based on the quantity generated over a specific time period, such as one week. For large quantity waste generators, samples can be sampled within that time period.
CCME Recommended Waste Characterization Methodology
32532 – Final Report – 30 April 1999 23 SENES Consultants Limited
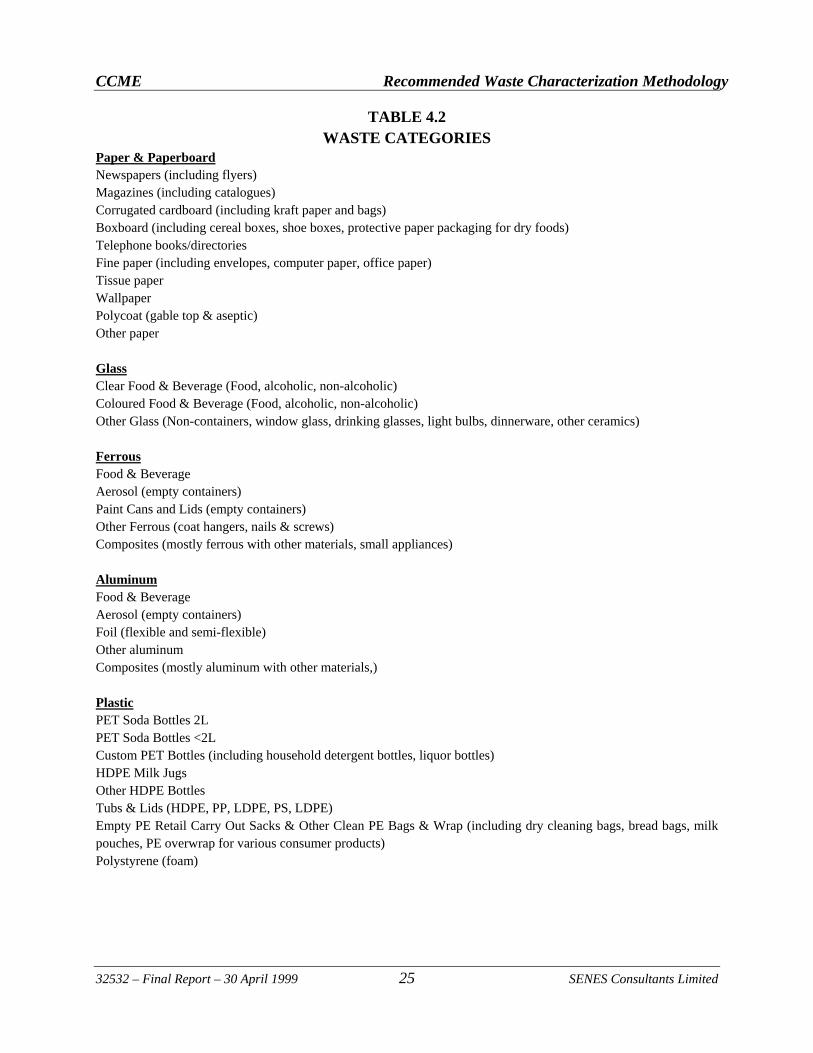
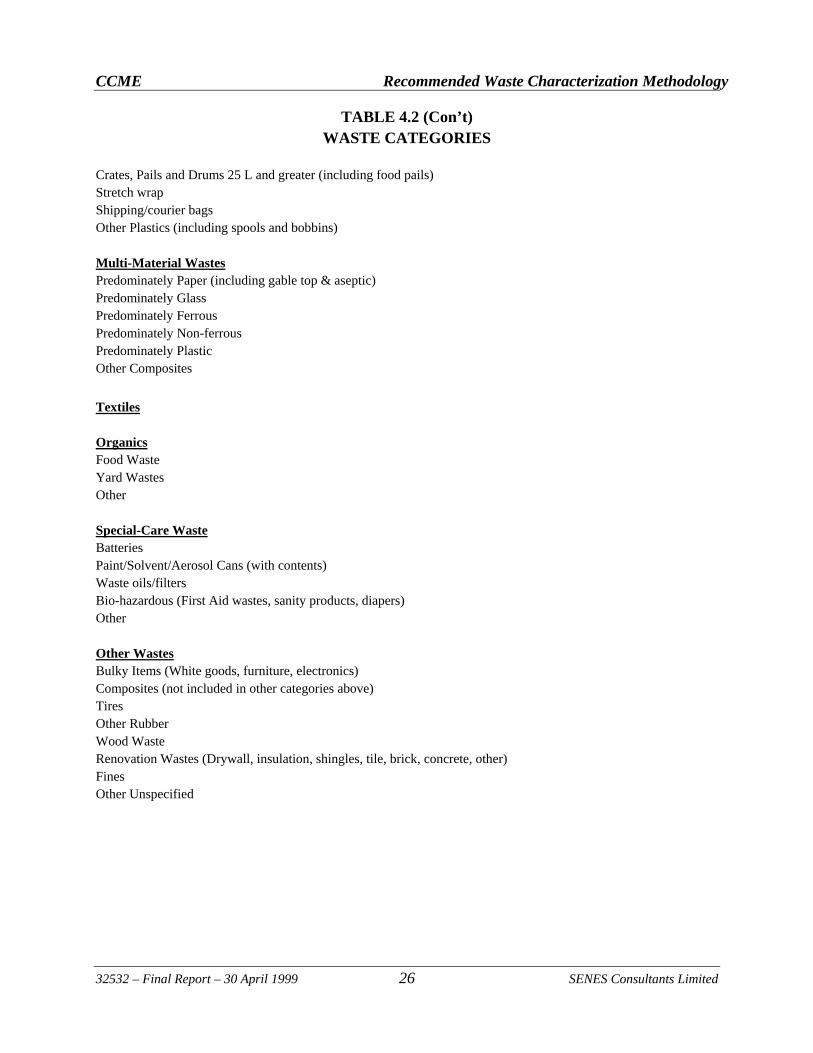
4.4.7 Stratification of Study Population Strata definitions should include single-family and multi-family dwellings for residential studies. For IC&I studies, SIC groupings should be defined stratify the sampling. Any other strata of interest, based on the goals and scope of the study, should be defined. The strategy behind creating strata is to create homogeneous groups from which to sample so that the variability is better controlled. Therefore, the groupings created in this planning stage should attempt to consolidate waste generators that are expected to have similar waste compositions. 4.4.8 Waste Categories The waste categories defined in Table 4.2 should be reviewed and additional detailed categories may be added. If an investigator develops a new material classification, it should be composed of material subtypes that can be separated and added back into standard material types. Also, more detailed subtypes should be able to be combined into an existing standard subtype. If a detailed material is a significant part of the waste stream being sampled, a separate subtype should be developed for it that can later be included under a standard subtype. Below are brief comments that describe the development of the waste categories. Paper & paperboard is a large category that covers numerous products and materials types. As such several detailed categories are included under paper & paperboard. These categories have been developed in consultation with Paper & Paperboard Packaging Environmental Council (PPEC) and based on the definition used by the Institute of Scrap Recycling Industries (ISRI). General colour categories are selected for glass, due to the difficulties with sorting glass by product based categories if the glass is broken. Consumers Glass provided guidance on the selection of categories. Input on the Ferrous and Aluminum categories were provided by the Steel Can Recycling Council and Alcan, respectively. The plastic categories were developed and recommended by the Canadian Plastics Industry Association. The remaining main categories and sub-categories were developed to provide a reasonable break-down of the remaining wastes. The categories were based on a review of categories used
CCME Recommended Waste Characterization Methodology
32532 – Final Report – 30 April 1999 24 SENES Consultants Limited
in other studies and on the premise that the number of categories should be kept to a minimum unless specific goals in the study require greater detail. Recognizing these waste categories during the waste sort may not be easy. Worker training is recommended to ensure that the materials are properly identified and separated. For assistance in identifying the waste categories and developing of a training program, the above noted industries and associations could be contacted. Contact information for these associations is provided in Appendix B.
CCME Recommended Waste Characterization Methodology
32532 – Final Report – 30 April 1999 25 SENES Consultants Limited
TABLE 4.2 WASTE CATEGORIES
Paper & Paperboard Newspapers (including flyers) Magazines (including catalogues) Corrugated cardboard (including kraft paper and bags) Boxboard (including cereal boxes, shoe boxes, protective paper packaging for dry foods) Telephone books/directories Fine paper (including envelopes, computer paper, office paper) Tissue paper Wallpaper Polycoat (gable top & aseptic) Other paper Glass Clear Food & Beverage (Food, alcoholic, non-alcoholic) Coloured Food & Beverage (Food, alcoholic, non-alcoholic) Other Glass (Non-containers, window glass, drinking glasses, light bulbs, dinnerware, other ceramics) Ferrous Food & Beverage Aerosol (empty containers) Paint Cans and Lids (empty containers) Other Ferrous (coat hangers, nails & screws) Composites (mostly ferrous with other materials, small appliances) Aluminum Food & Beverage Aerosol (empty containers) Foil (flexible and semi-flexible) Other aluminum Composites (mostly aluminum with other materials,) Plastic PET Soda Bottles 2L PET Soda Bottles <2L Custom PET Bottles (including household detergent bottles, liquor bottles) HDPE Milk Jugs Other HDPE Bottles Tubs & Lids (HDPE, PP, LDPE, PS, LDPE) Empty PE Retail Carry Out Sacks & Other Clean PE Bags & Wrap (including dry cleaning bags, bread bags, milk pouches, PE overwrap for various consumer products) Polystyrene (foam)
CCME Recommended Waste Characterization Methodology
32532 – Final Report – 30 April 1999 26 SENES Consultants Limited
TABLE 4.2 (Con’t) WASTE CATEGORIES
Crates, Pails and Drums 25 L and greater (including food pails) Stretch wrap Shipping/courier bags Other Plastics (including spools and bobbins) Multi-Material Wastes Predominately Paper (including gable top & aseptic) Predominately Glass Predominately Ferrous Predominately Non-ferrous Predominately Plastic Other Composites
Textiles Organics Food Waste Yard Wastes Other Special-Care Waste Batteries Paint/Solvent/Aerosol Cans (with contents) Waste oils/filters Bio-hazardous (First Aid wastes, sanity products, diapers) Other Other Wastes Bulky Items (White goods, furniture, electronics) Composites (not included in other categories above) Tires Other Rubber Wood Waste Renovation Wastes (Drywall, insulation, shingles, tile, brick, concrete, other) Fines Other Unspecified
27
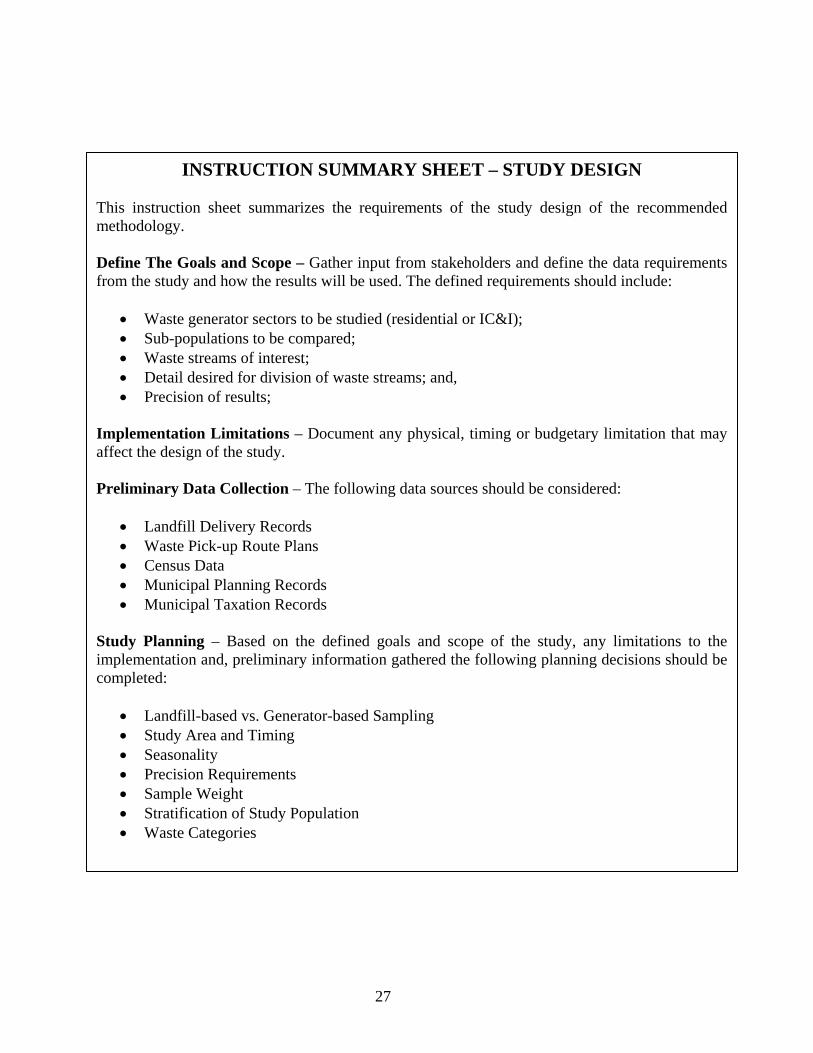
INSTRUCTION SUMMARY SHEET – STUDY DESIGN This instruction sheet summarizes the requirements of the study design of the recommended methodology. Define The Goals and Scope – Gather input from stakeholders and define the data requirements from the study and how the results will be used. The defined requirements should include:
Waste generator sectors to be studied (residential or IC&I); Sub-populations to be compared; Waste streams of interest; Detail desired for division of waste streams; and, Precision of results;
Implementation Limitations – Document any physical, timing or budgetary limitation that may affect the design of the study. Preliminary Data Collection – The following data sources should be considered:
Landfill Delivery Records Waste Pick-up Route Plans Census Data Municipal Planning Records Municipal Taxation Records
Study Planning – Based on the defined goals and scope of the study, any limitations to the implementation and, preliminary information gathered the following planning decisions should be completed:
Landfill-based vs. Generator-based Sampling Study Area and Timing Seasonality Precision Requirements Sample Weight Stratification of Study Population Waste Categories
CCME Recommended Waste Characterization Methodology
32532 – Final Report – 30 April 1999 28 SENES Consultants Limited
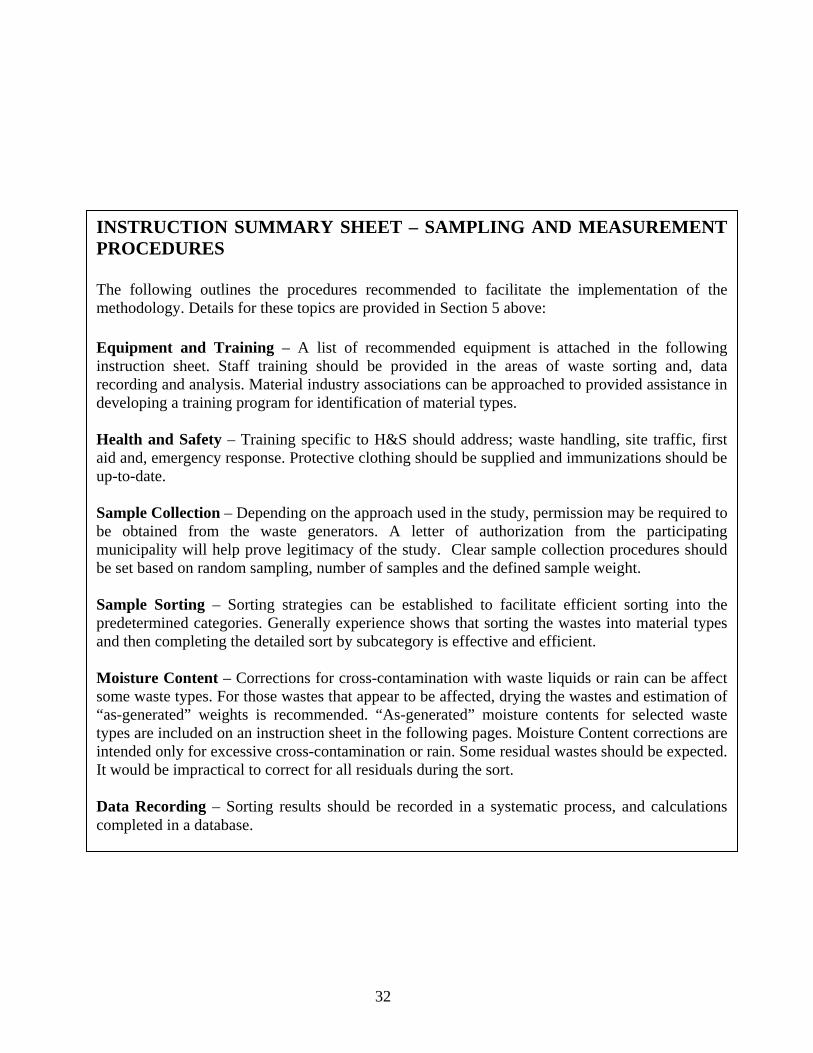
5.0 SAMPLING AND MEASUREMENT PROCEDURES The following sections provide guidance on the procedures that should be prepared to facilitate the implementation of the methodology. 5.1 EQUIPMENT AND TRAINING A detailed list of recommended equipment, adopted from the BC Environment Manual (1991) is provided in an Instruction Summary Sheet toward the end of this chapter. Staff training on the separation of waste into the selected categories will be required. Material sector industries and associations were contacted in the development of the material categories. The associations listed in section 4 should be contacted for assistance in the development of training programs for the identification of the material types. Instructions should also be provided on data recording and analysis to ensure proper handling of the data. Sections 6 provides guidance in this area. 5.2 HEALTH AND SAFETY Workers will be exposed to numerous hazards during a waste composition study. The following summarizes the issues that should be addressed in the Health and Safety procedure: Waste Sorting – Opening bags, liquids, hazardous wastes, sharps, biological wastes; Protective clothing should be supplied and relevant immunizations should be verified to be up-to-date. Site Traffic – Trucks, line of sight and blind spots. First-Aid – It is recommended to have at least one staff on duty that is trained in first aid. Emergency Response – Contact agencies and numbers. 5.3 PERMISSION FOR SAMPLE COLLECTION In landfill-based studies any permission requirements would be relatively simple as they would be co-ordinated with landfill management officials. The local privacy requirements and waste management restrictions would dictate the controls that would needed to be integrated into the study design. Generator-based studies should include a more involved permission program. The IC&I studies inherently have a significant amount of interaction with the generator to gather information on
CCME Recommended Waste Characterization Methodology
32532 – Final Report – 30 April 1999 29 SENES Consultants Limited
waste generation, waste management, number of employees, etc. During the initial communications with the generators, it is necessary to gain permission to sample their wastes. An information sheet on the purpose of the study, and a letter of authorization from the local municipality, that recommends industry support, should be provided to the generators. Residential studies that are generator-based should also include permission or at least notification of the sampled households. Where interaction with each household would require an excessive amount of time, it may be sufficient to simply notify the households with an information sheet on the purpose of the study, and include a letter of authorization for the local municipality. It may be advisable to include a phone number on the information sheet that could be used by residents that wished not to be involved in the study. 5.4 SAMPLE COLLECTION For studies conducted at the landfill and where waste pick-up route information enables identification of the strata for each delivery, records can be maintained on the deliveries and the various strata. This will allow total weights within each stratum to be determined. If possible, the delivery route should be confirmed with the driver at the scale-house to verify the wastes were collected as described in the route planning data. Variations should be noted. Landfill-based studies that do not include stratification require only simple random selection of any of the regular deliveries that meet the scope of the study. Generator-based studies involve the collection of samples that are either all of the wastes from the selected generator or a sample of the generated wastes. Depending on the amount of waste generated, the amount of waste sampled would range from all the generated waste up to a sample of approximately 90-135 kg for residential wastes. As discussed in section 4.4, IC&I wastes should involve larger samples. Where local conditions and logistics allow, the generator-based study should be designed to collect samples from a number of generators in the same strata before selecting a sample for sorting. This would only be done where combining wastes from different generators will not adversely affect the ability to investigate all the goals of the study. This mixing of the waste will average-out some of the variability that would be encountered from a single or small number of households. Consequently the overall precision of the results will improve. 5.5 SAMPLE SORTING When a load of waste is designated for sampling, the loaded vehicle should be weighed. The driver should then be directed to the sorting area. Wastes from the vehicle should be dumped on
CCME Recommended Waste Characterization Methodology
32532 – Final Report – 30 April 1999 30 SENES Consultants Limited
the ground near the sorting area. The driver and vehicle should then be directed to return to the scale to collect a tare weight. The difference between the loaded vehicle weight and the tare weight is the total weight of the waste. The load of wastes should be mixed thoroughly by a backhoe. As oversized items become apparent in the wastes, these items should be removed from the waste pile, weighed and recorded in terms of the waste category and the weight. These weights will be used in proportion to the total load weight to determine their contribution to the waste composition. Any items that cannot be easily scooped by the backhoe due the item’s size or shape should be considered an oversized item. For example, items such as furniture or piping should be removed and tracked so that they are not missed by the scooping action. Once the waste pile is mixed and the oversized items are removed, a sample should be collected from the waste pile. The sample should be approximately 90-135 kg. The collected sample should be sorted into the waste categories designated in Table 4.2 or the revised waste categories defined in the definition of the study goals and scope. The general recommended approach for sorting the waste materials is to divide the wastes into the major categories and then subdivide the categories into the detailed subcategories. 5.6 MOISTURE CONTENT It is recommended that the weights recorded during the sorting program include the natural moisture contents of the disposed materials. Correction for cross-contamination of wastes with waste liquids or rainwater is required to properly record the weight of the waste components. Moisture correction is achieved through a process of drying a sample of the wet materials to determine the dry weight and then adding back the weight of the moisture that is expected to be found in wastes in an “as-disposed” condition. After the sorting, weighing and recording process, the material categories should be inspected for signs of cross-contamination with waste liquids or rainwater. Paper for example may be highly susceptible to weight errors due to moisture contamination. If rain water or cross-contamination from a waste component is believed to have substantially increased the weight of another material components, a representative sample of the wet material should be collected and sent for drying. It is expected that some liquids or other residuals may be left in containers or other packaging. These residuals are generally ignored, and considered an acceptable error of the process. It would be impractical to clean all waste items and remove any residual moisture before weighing.
CCME Recommended Waste Characterization Methodology
32532 – Final Report – 30 April 1999 31 SENES Consultants Limited
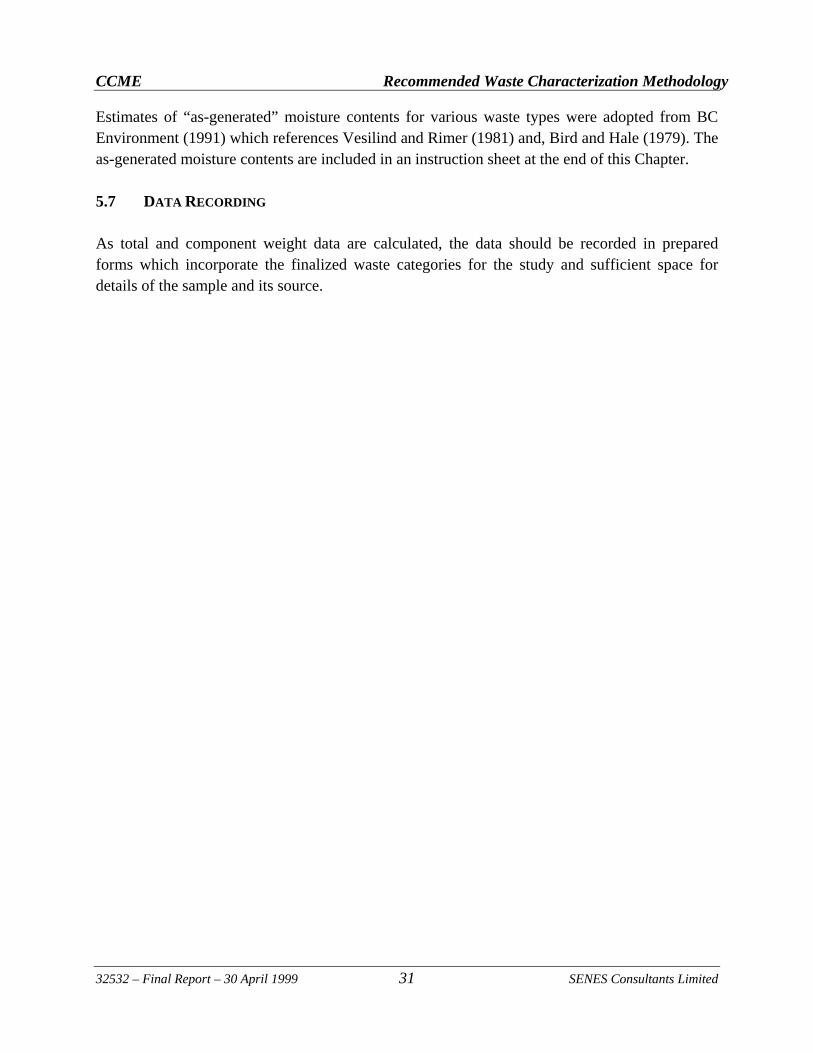
Estimates of “as-generated” moisture contents for various waste types were adopted from BC Environment (1991) which references Vesilind and Rimer (1981) and, Bird and Hale (1979). The as-generated moisture contents are included in an instruction sheet at the end of this Chapter. 5.7 DATA RECORDING As total and component weight data are calculated, the data should be recorded in prepared forms which incorporate the finalized waste categories for the study and sufficient space for details of the sample and its source.
32
INSTRUCTION SUMMARY SHEET – SAMPLING AND MEASUREMENT PROCEDURES The following outlines the procedures recommended to facilitate the implementation of the methodology. Details for these topics are provided in Section 5 above: Equipment and Training – A list of recommended equipment is attached in the following instruction sheet. Staff training should be provided in the areas of waste sorting and, data recording and analysis. Material industry associations can be approached to provided assistance in developing a training program for identification of material types. Health and Safety – Training specific to H&S should address; waste handling, site traffic, first aid and, emergency response. Protective clothing should be supplied and immunizations should be up-to-date. Sample Collection – Depending on the approach used in the study, permission may be required to be obtained from the waste generators. A letter of authorization from the participating municipality will help prove legitimacy of the study. Clear sample collection procedures should be set based on random sampling, number of samples and the defined sample weight. Sample Sorting – Sorting strategies can be established to facilitate efficient sorting into the predetermined categories. Generally experience shows that sorting the wastes into material types and then completing the detailed sort by subcategory is effective and efficient. Moisture Content – Corrections for cross-contamination with waste liquids or rain can be affect some waste types. For those wastes that appear to be affected, drying the wastes and estimation of “as-generated” weights is recommended. “As-generated” moisture contents for selected waste types are included on an instruction sheet in the following pages. Moisture Content corrections are intended only for excessive cross-contamination or rain. Some residual wastes should be expected. It would be impractical to correct for all residuals during the sort. Data Recording – Sorting results should be recorded in a systematic process, and calculations completed in a database.
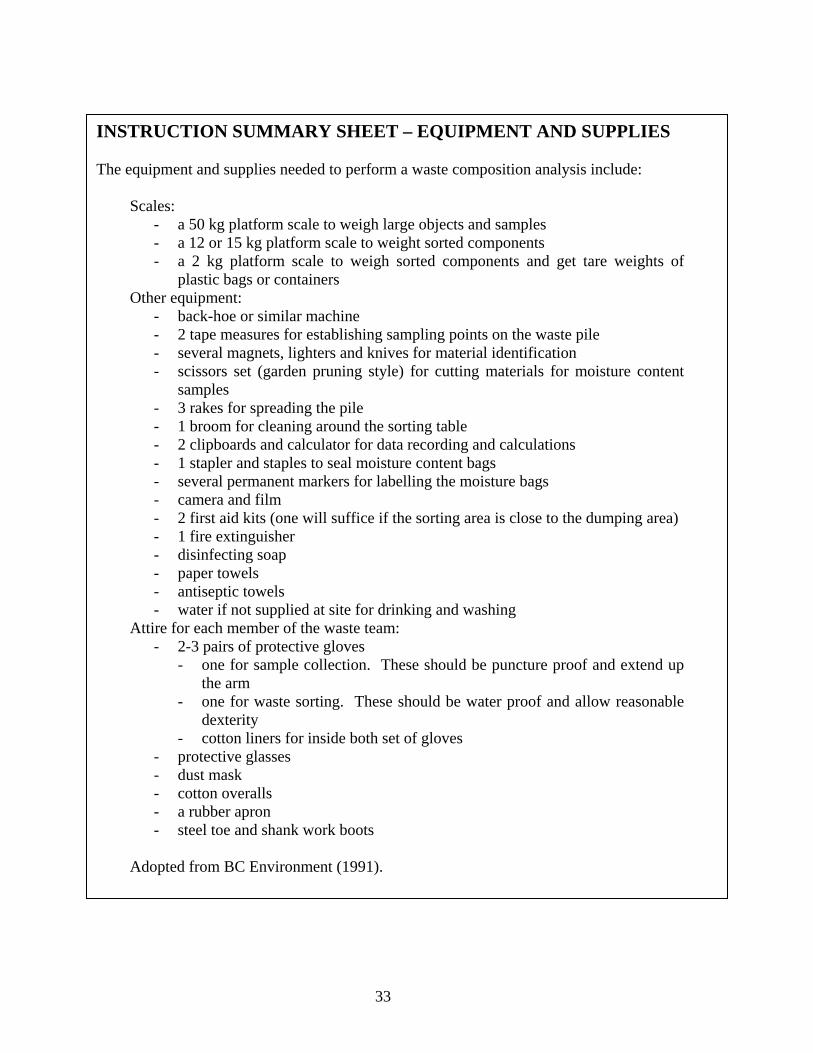
33
INSTRUCTION SUMMARY SHEET – EQUIPMENT AND SUPPLIES The equipment and supplies needed to perform a waste composition analysis include:
Scales: - a 50 kg platform scale to weigh large objects and samples - a 12 or 15 kg platform scale to weight sorted components - a 2 kg platform scale to weigh sorted components and get tare weights of
plastic bags or containers Other equipment:
- back-hoe or similar machine - 2 tape measures for establishing sampling points on the waste pile - several magnets, lighters and knives for material identification - scissors set (garden pruning style) for cutting materials for moisture content
samples - 3 rakes for spreading the pile - 1 broom for cleaning around the sorting table - 2 clipboards and calculator for data recording and calculations - 1 stapler and staples to seal moisture content bags - several permanent markers for labelling the moisture bags - camera and film - 2 first aid kits (one will suffice if the sorting area is close to the dumping area) - 1 fire extinguisher - disinfecting soap - paper towels - antiseptic towels - water if not supplied at site for drinking and washing
Attire for each member of the waste team: - 2-3 pairs of protective gloves
- one for sample collection. These should be puncture proof and extend up the arm
- one for waste sorting. These should be water proof and allow reasonable dexterity
- cotton liners for inside both set of gloves - protective glasses - dust mask - cotton overalls - a rubber apron - steel toe and shank work boots
Adopted from BC Environment (1991).
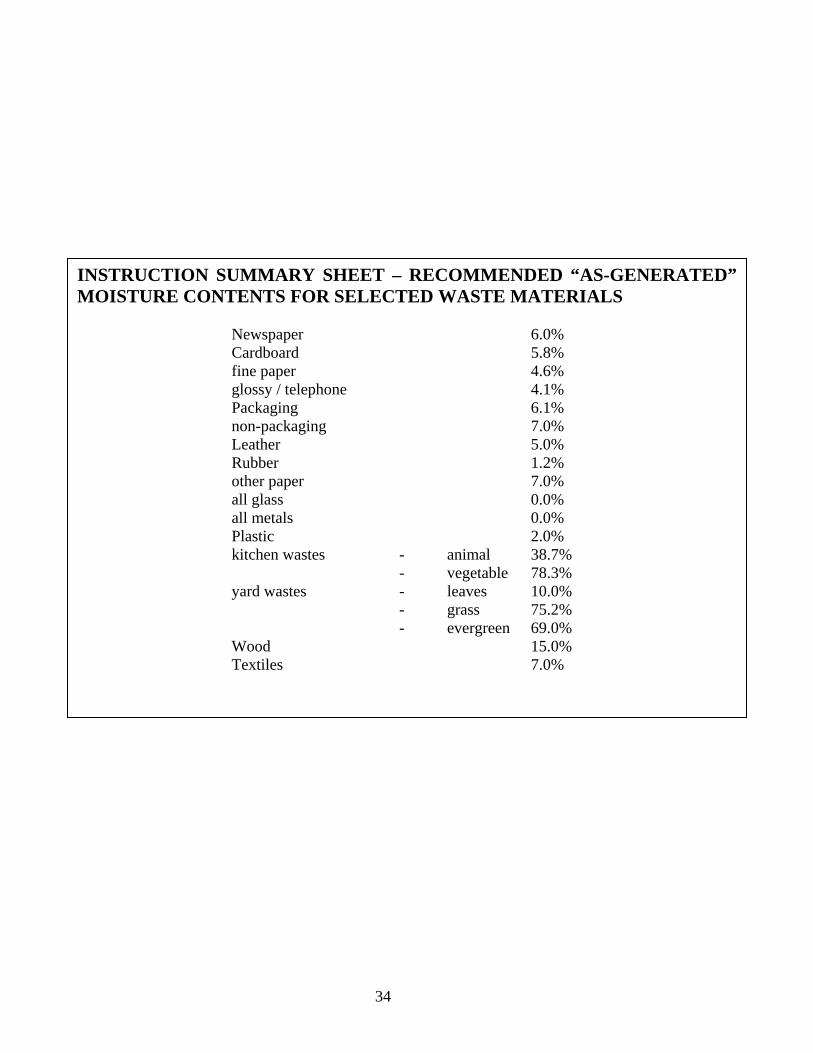
34
INSTRUCTION SUMMARY SHEET – RECOMMENDED “AS-GENERATED” MOISTURE CONTENTS FOR SELECTED WASTE MATERIALS
Newspaper 6.0% Cardboard 5.8% fine paper 4.6% glossy / telephone 4.1% Packaging 6.1% non-packaging 7.0% Leather 5.0% Rubber 1.2% other paper 7.0% all glass 0.0% all metals 0.0% Plastic 2.0% kitchen wastes - animal
- vegetable 38.7% 78.3%
yard wastes - leaves - grass - evergreen
10.0% 75.2% 69.0%
Wood 15.0% Textiles 7.0%
CCME Recommended Waste Characterization Methodology
32532 – Final Report – 30 April 1999 35 SENES Consultants Limited
6.0 DATA ANALYSIS AND REPORTING A large amount of data is collected and calculated during a waste characterization study and this data should be managed and presented in a planned method. A basic principle is that waste generation rates (eg. kg capita-1 d-1) should be calculated as early as practical and that an indication of the precision of the measurement should be provided, such as confidence intervals about the mean values. The data should be compiled within an electronic database. The preferred choice is a database as opposed to a spreadsheet due to inherent advantages of the database. 6.1 RAW RESULTS The database should include the raw results for each measured sample along with the identifying information. Zero’s should be explicitly entered when no waste in a specific category was found and qualifiers describing the data should be entered; particularly, the moisture content basis for paper and paperboard products. Weights for the oversize items should be recorded in the database along with the total truckload sample. Each raw result file should be identified with the date, sector, truck/generator information and staff information. Information on the number of residents or employees responsible for generating the waste should be entered into the raw data files (i.e. generator-based studies) if available. The software is then programmed to estimate the waste generation rates (eg. kg capita-1 d-1) for each category. Details of these calculations are provided in Appendix C. 6.2 AVERAGES FOR SECTOR AND SEASON Sector and seasonal data should be summarized to provide measures of the average (mean) values and variability resulting in the study. Where seasonal investigations have been completed, annual generation rates (eg. kg capita-1 y-1) can be determined. The details of these calculations are provided in Appendix C. The sector, seasonal and annual results will create the building blocks necessary to extrapolate the results to study to other locations of interest. By collecting data about the strata in a new community, the generation rates from the study community can be applied to estimate the waste quantities generated in the new community.
CCME Recommended Waste Characterization Methodology
32532 – Final Report – 30 April 1999 36 SENES Consultants Limited
6.3 REPORTING The results of the waste composition study should be presented in a format that meets the objective of the study. It is important to report both the average (mean) value and the variability so that data users and decision-makers can consider the uncertainty in the estimated values when planning future studies or programs. The reporting should include supporting information describing the study area and significant findings about differences between seasons, differences between sectors and changes that have occurred over time. Included should be summary statistics on the number of samples sorted, the variability between samples and the effort required to sort the samples. This information is useful for planning further updates and for planning studies in other jurisdictions. In the reporting of the results, there should be a discussion on the uncertainty in the estimate so that future studies can benefit from the experience gained.
CCME Recommended Waste Characterization Methodology
32532 – Final Report – 30 April 1999 37 SENES Consultants Limited
7.0 RECOMENDED LOCATIONS FOR PILOT DEMONSTRATIONS To demonstrate the utility of the methodology, the NTFP has asked that recommendations on locations for pilot demonstrations be developed. Ideally these locations would include communities with different demographics (urban and rural) and if possible different diversion programs in place (e.g. curb-side vs. drop-off depots). To identify communities where pilot demonstrations can be undertaken, discussions were held with a number of government and industry groups that have or are planning to undertake waste characterization studies. A summary of the discussions with each of these groups is presented below:
CSR: Corporations Supporting Recycling (CSR) have over the years undertaken over 50 waste characterization studies in Ontario. CSR was approached to provide guidance on the identification of communities where pilot projects could be undertaken. CSR has indicated that they would consider participating in pilot projects at one or more of the following three urban and two rural locations: - The Town of Markham, where the results of the pilots can be compared with those of
previous waste characterization studies; - The City of Barrie which has also undertaken a number of waste characterization
studies in the past; - The City of Windsor; - The Quinte Program in south western Ontario; and, - The Bluewater Recycling Association which is an association of 57 rural
municipalities in south-western Ontario.
Nova Scotia Environment who indicated that depending upon the availability of resources, pilot projects could potentially be undertaken in the Halifax Regional Municipality and the Cape Breton Regional Municipality. The Halifax Regional Municipality consists of urban, suburban and rural areas. Potential funding mechanisms could involve a partnership between federal, provincial, municipal and industry.
Ministere de l’Environnement et de la Fauane, Quebec has just put out a tender to undertake a waste characterization study for the province. The Quebec Ministry of Environment has informed the writer of this report that they have requested consultants responding to their bid to propose a methodology for undertaking waste analysis. They have indicated that they would compare the methodologies proposed by the bidders with the methodology developed in this study to determine whether an opportunity existed to undertake a pilot demonstration of the methodology as part of their program. It is
CCME Recommended Waste Characterization Methodology
32532 – Final Report – 30 April 1999 38 SENES Consultants Limited
expected that the methodology for the Quebec study will be decided upon by end of April1999.
The Manitoba Product Stewardship Corporation (MPSC), has undertaken waste characterization studies in Winnipeg and rural Manitoba in 1996 and in 1998. MPSC has indicated that depending upon the cost and level of effort involved, they would consider undertaking a pilot demonstration project in Winnipeg and a location in rural Manitoba using the methodology developed in this study. The results of the pilot could then be compared with those of the recent studies undertaken by MPSC.
Discussions with Alberta Environmental Protection indicate that they are in the process of developing a Terms of Reference for a waste characterization study. Further contact is required to discuss whether they would be willing to undertake a pilot demonstration project.
Waste characterization studies can range in cost from less than $10,000 to over $300,000. The cost for any one study depends on the scope and objectives defined. For example, each additional strata considered, and each additional study period throughout the year, increases the total cost for the study. The pilot demonstration projects can however be undertaken as relatively small projects that focus on the specifics of the methodology and how to improve the effectiveness of a study. An estimated cost has been developed for a pilot study that is believed to be the minimum necessary to validate several of the key aspects of the methodology. The pilot study would examine one strata, and involve the collection and sorting of 12 samples, each being 100 kg of residential wastes. This example assumes the study will involve the collection of wastes from the curb-side on a single day, using three rental trucks and a total of nine workers. For a study of this magnitude, it is estimated to cost on the order of $15,000, including data analysis. This estimated cost does not include the cost of equipment and facilities that may already be on-hand or provided by the municipality and its waste hauler/contractor. These extras include a sorting location, sorting bins, tables, related equipment and the ultimate disposal or processing of the sorted materials. This pilot study would allow for examination of the precision achieved relative to the number of samples collected. The waste categories would also be tested for ease of use and the practicality of the results. For examination of seasonal and inter-strata comparisons, a larger and consequently more costly study would be required.
CCME Recommended Waste Characterization Methodology
32532 – Final Report – 30 April 1999 39 SENES Consultants Limited
REFERENCES Bird and Hale Ltd. 1979. Municipal Refuse Statistics for Canadian Communities of over
100,000 (1976-1977), EPS no. 4672-1 October. British Columbia, Capital Regional District 1996. Capital Regional District, Solid Waste Stream
Analysis, Final Report. British Columbia Environment 1991. Procedural Manual for Municipal Solid Waste
Composition Analysis. November. British Columbia Environment 1990. Estimation of Waste Quantities at Landfills without Weigh
Scales. Britton, P.W. 1972. Improving Manual Solid Waste Separation Studies. Journal of the Sanitary
Engineering Division, ASCE, Vol. 93, No. SA5, October, pp. 717-730. California Integrated Waste Management Board 1996. Disposal Characterization Studies.
Preliminary Draft Regulations for Informal Public Review and Discussion Purposes Only Subject to Revision.
Communities Supporting Recycling (CSR), 1994. Markham Model Community Demonstration
Project, Draft Monitoring Protocol. June. Klee, Albert J. 1993. New Approaches to Estimation of Solid-Waste Quantity and Composition.
March/April. Klee, Albert J. and Carruth, D. 1970. Sample Weights in Solid Waste Composition Studies,
Journal of the Sanitary Engineering Division, ASCE, Vol. 96, No. SA4, Proc. Paper 4769, August, pp.945-954.
Lohani, B.N. and Ko, S.M. 1988. Optimal Sampling of Domestic Solid Waste. Journal of
Environmental Engineering, ASCE Dec., Vol. 114, No. 6, pp. 1429-1483. Manitoba Product Stewardship Corporation (MPSC) 1998. City of Winnipeg – Residential Waste
Composition Study. December. Ontario Ministry of Environment 1991. Procedures for the Assessment of Solid Waste
Residential and Commercial, Volume III of the Ontario Waste Composition Study. July.
CCME Recommended Waste Characterization Methodology
32532 – Final Report – 30 April 1999 40 SENES Consultants Limited
Proctor & Redfern Limited and, SENES Consultants Limited, 1991. Metropolitan Toronto Solid Waste Composition Study – Discussion Paper. Submitted to Metro Works Department, May.
Regional Municipality of Ottawa-Carleton (RMOC) 1997a. Solid Waste Characterization Study. Regional Municipality of Ottawa-Carleton (RMOC) 1997b. Residential Waste Characterization
Project. January. Regional Municipality of Ottawa-Carleton (RMOC) 1997c. Multi-Unit Residential Waste
Characterization Project. September. Regional Municipality of Ottawa-Carleton (RMOC) 1992. Waste Composition Study,
Description of the Waste Stream and Program Implications. December. SENES Consultants Limited and, First Consulting Group, 1992. Waste Stream Quantification
and Characterization Methodology Study – Final Report. Prepared for Environment Canada, Solid Waste Management Division, January.
Snedecor, George W. and William G. Cochran, 1980. Statistical Methods. Iowa State University
Press, Seventh Edition, ISBN 0-8138-1560-6 United States Environmental Protection Agency, 1997. Measuring Recycling – A Guide for State
and Local Governments. EPA530-R-97-011, September.
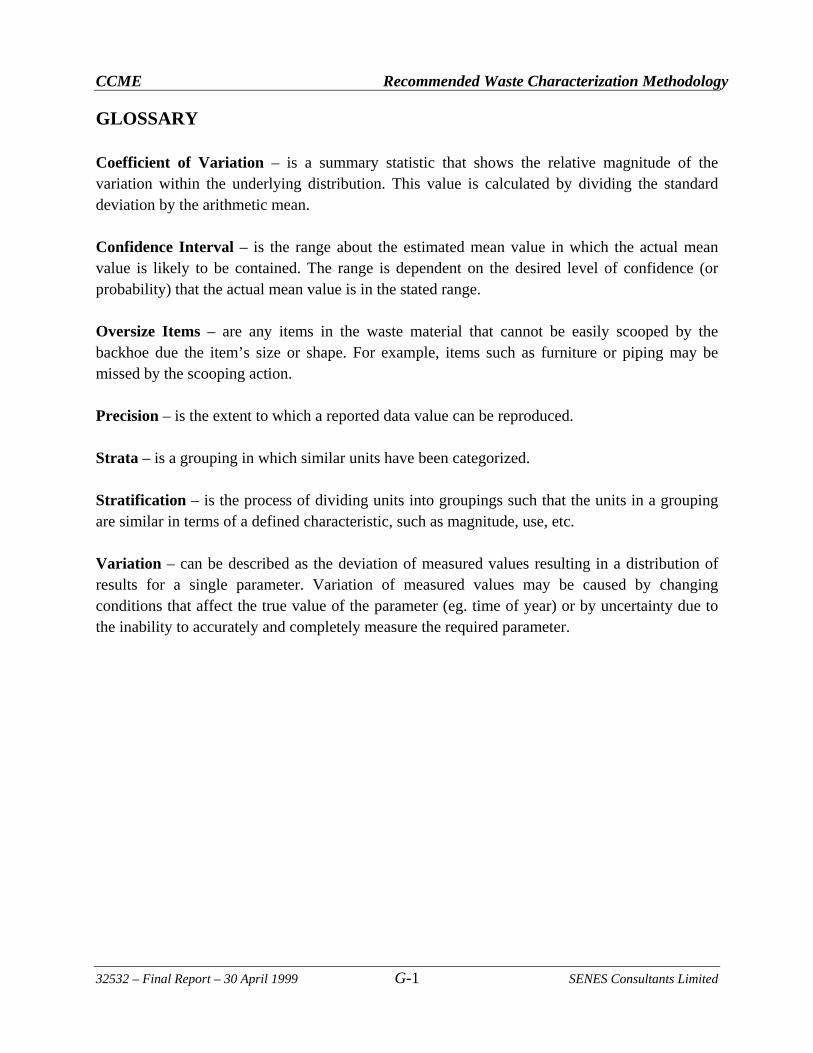
CCME Recommended Waste Characterization Methodology
32532 – Final Report – 30 April 1999 G-1 SENES Consultants Limited
GLOSSARY Coefficient of Variation – is a summary statistic that shows the relative magnitude of the variation within the underlying distribution. This value is calculated by dividing the standard deviation by the arithmetic mean. Confidence Interval – is the range about the estimated mean value in which the actual mean value is likely to be contained. The range is dependent on the desired level of confidence (or probability) that the actual mean value is in the stated range. Oversize Items – are any items in the waste material that cannot be easily scooped by the backhoe due the item’s size or shape. For example, items such as furniture or piping may be missed by the scooping action. Precision – is the extent to which a reported data value can be reproduced. Strata – is a grouping in which similar units have been categorized. Stratification – is the process of dividing units into groupings such that the units in a grouping are similar in terms of a defined characteristic, such as magnitude, use, etc. Variation – can be described as the deviation of measured values resulting in a distribution of results for a single parameter. Variation of measured values may be caused by changing conditions that affect the true value of the parameter (eg. time of year) or by uncertainty due to the inability to accurately and completely measure the required parameter.
CCME Recommended Waste Characterization Methodology
32532 – Final Report – 30 April 1999 SENES Consultants Limited
APPENDIX A
COMPARISON OF WASTE CATEGORIES USED BY REVIEWED STUDIES AND METHODOLOGIES
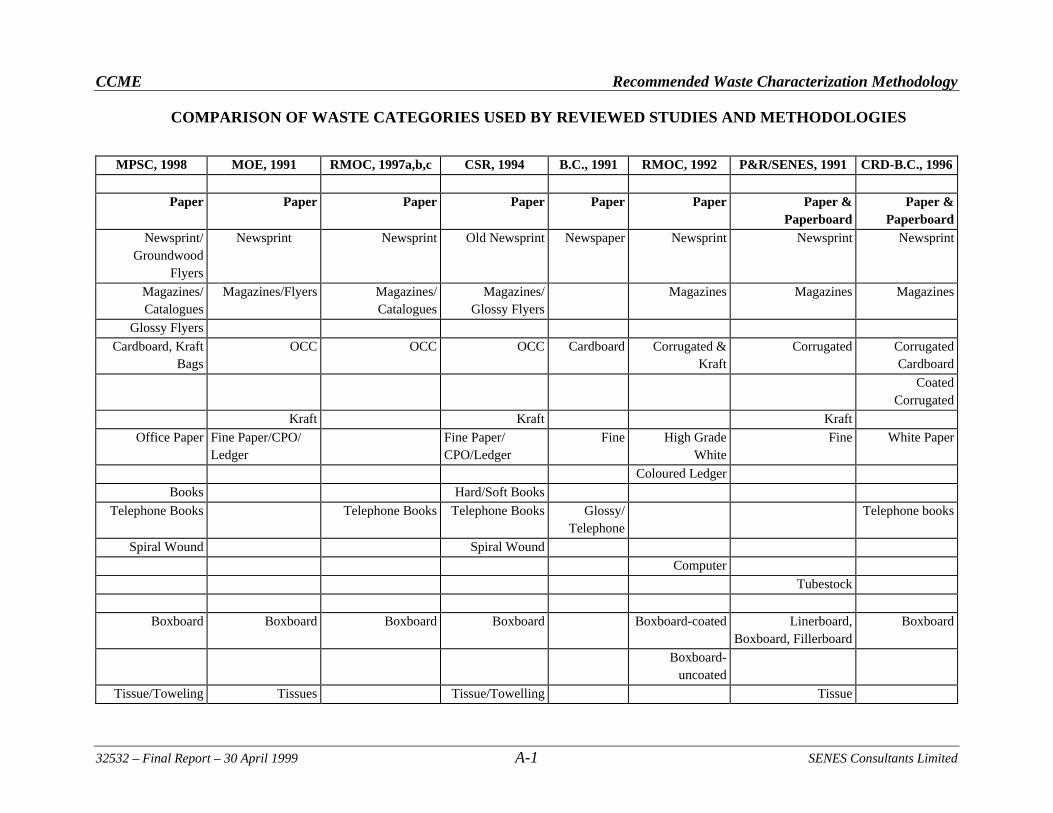
CCME Recommended Waste Characterization Methodology
32532 – Final Report – 30 April 1999 A-1 SENES Consultants Limited
COMPARISON OF WASTE CATEGORIES USED BY REVIEWED STUDIES AND METHODOLOGIES
MPSC, 1998 MOE, 1991 RMOC, 1997a,b,c CSR, 1994 B.C., 1991 RMOC, 1992 P&R/SENES, 1991 CRD-B.C., 1996
Paper Paper Paper Paper Paper Paper Paper & Paperboard
Paper & Paperboard
Newsprint/ Groundwood
Flyers
Newsprint Newsprint Old Newsprint Newspaper Newsprint Newsprint Newsprint
Magazines/ Catalogues
Magazines/Flyers Magazines/Catalogues
Magazines/Glossy Flyers
Magazines Magazines Magazines
Glossy Flyers
Cardboard, Kraft Bags
OCC OCC OCC Cardboard Corrugated & Kraft
Corrugated Corrugated Cardboard
Coated Corrugated
Kraft Kraft Kraft
Office Paper Fine Paper/CPO/ Ledger
Fine Paper/ CPO/Ledger
Fine High Grade White
Fine White Paper
Coloured Ledger
Books Hard/Soft Books
Telephone Books Telephone Books Telephone Books Glossy/ Telephone
Telephone books
Spiral Wound Spiral Wound
Computer
Tubestock
Boxboard Boxboard Boxboard Boxboard Boxboard-coated Linerboard, Boxboard, Fillerboard
Boxboard
Boxboard-uncoated
Tissue/Toweling Tissues Tissue/Towelling Tissue
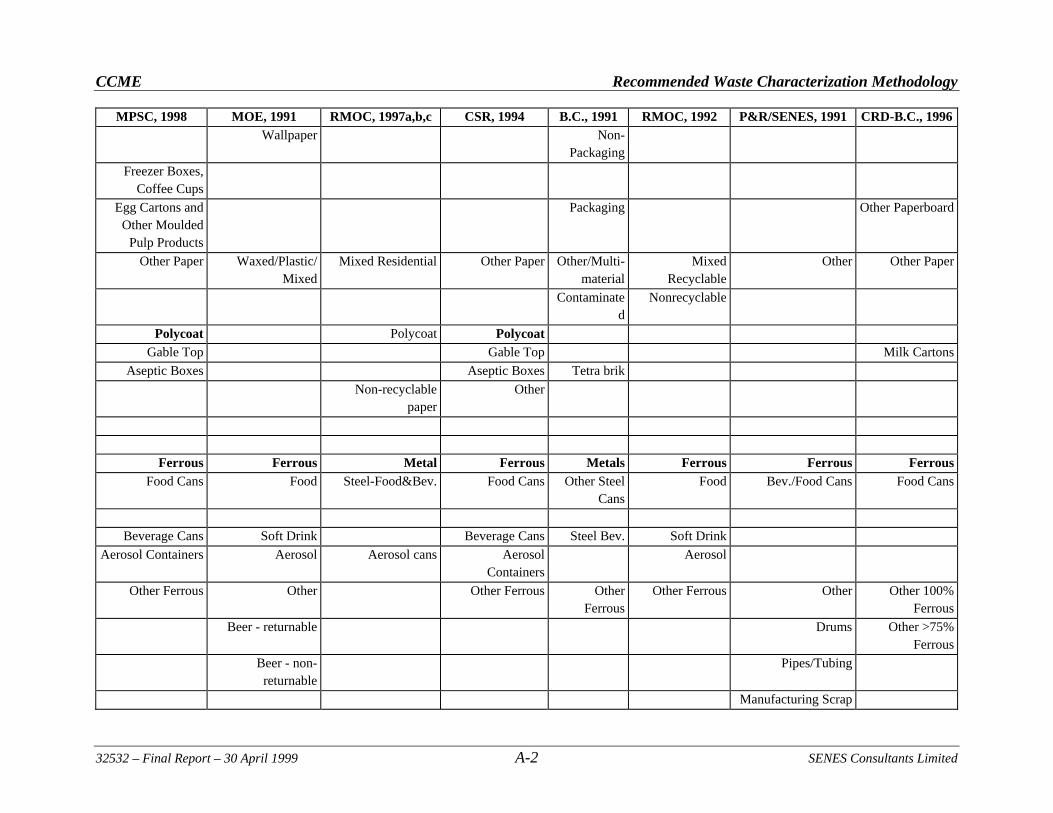
CCME Recommended Waste Characterization Methodology
32532 – Final Report – 30 April 1999 A-2 SENES Consultants Limited
MPSC, 1998 MOE, 1991 RMOC, 1997a,b,c CSR, 1994 B.C., 1991 RMOC, 1992 P&R/SENES, 1991 CRD-B.C., 1996 Wallpaper Non-
Packaging
Freezer Boxes, Coffee Cups
Egg Cartons and Other Moulded
Pulp Products
Packaging Other Paperboard
Other Paper Waxed/Plastic/ Mixed
Mixed Residential Other Paper Other/Multi-material
Mixed Recyclable
Other Other Paper
Contaminated
Nonrecyclable
Polycoat Polycoat Polycoat
Gable Top Gable Top Milk Cartons
Aseptic Boxes Aseptic Boxes Tetra brik
Non-recyclable paper
Other
Ferrous Ferrous Metal Ferrous Metals Ferrous Ferrous FerrousFood Cans Food Steel-Food&Bev. Food Cans Other Steel
Cans Food Bev./Food Cans Food Cans
Beverage Cans Soft Drink Beverage Cans Steel Bev. Soft Drink
Aerosol Containers Aerosol Aerosol cans Aerosol Containers
Aerosol
Other Ferrous Other Other Ferrous Other Ferrous
Other Ferrous Other Other 100% Ferrous
Beer - returnable Drums Other >75% Ferrous
Beer - non-returnable
Pipes/Tubing
Manufacturing Scrap
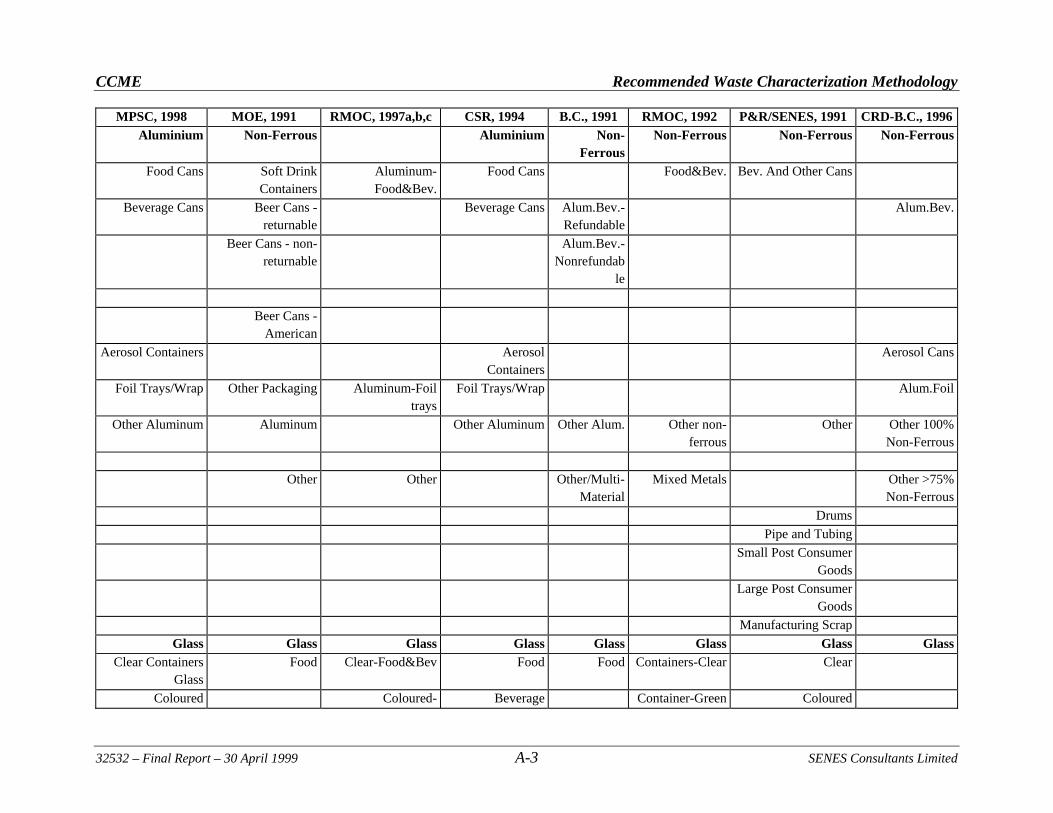
CCME Recommended Waste Characterization Methodology
32532 – Final Report – 30 April 1999 A-3 SENES Consultants Limited
MPSC, 1998 MOE, 1991 RMOC, 1997a,b,c CSR, 1994 B.C., 1991 RMOC, 1992 P&R/SENES, 1991 CRD-B.C., 1996
Aluminium Non-Ferrous Aluminium Non-Ferrous
Non-Ferrous Non-Ferrous Non-Ferrous
Food Cans Soft Drink Containers
Aluminum-Food&Bev.
Food Cans Food&Bev. Bev. And Other Cans
Beverage Cans Beer Cans - returnable
Beverage Cans Alum.Bev.-Refundable
Alum.Bev.
Beer Cans - non-returnable
Alum.Bev.-Nonrefundab
le
Beer Cans -
American
Aerosol Containers Aerosol Containers
Aerosol Cans
Foil Trays/Wrap Other Packaging Aluminum-Foil trays
Foil Trays/Wrap Alum.Foil
Other Aluminum Aluminum Other Aluminum Other Alum. Other non-ferrous
Other Other 100% Non-Ferrous
Other Other Other/Multi-
Material Mixed Metals Other >75%
Non-Ferrous
Drums
Pipe and Tubing
Small Post Consumer Goods
Large Post Consumer Goods
Manufacturing Scrap
Glass Glass Glass Glass Glass Glass Glass GlassClear Containers
Glass Food Clear-Food&Bev Food Food Containers-Clear Clear
Coloured Coloured- Beverage Container-Green Coloured
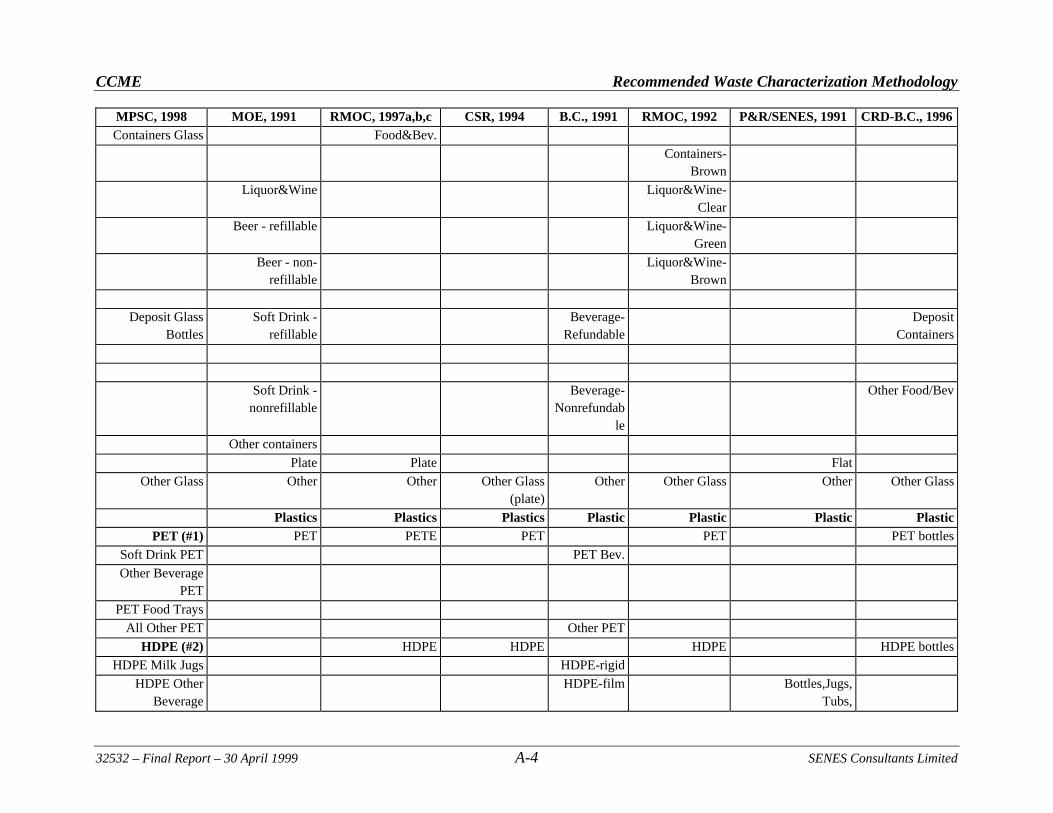
CCME Recommended Waste Characterization Methodology
32532 – Final Report – 30 April 1999 A-4 SENES Consultants Limited
MPSC, 1998 MOE, 1991 RMOC, 1997a,b,c CSR, 1994 B.C., 1991 RMOC, 1992 P&R/SENES, 1991 CRD-B.C., 1996Containers Glass Food&Bev.
Containers-Brown
Liquor&Wine Liquor&Wine-Clear
Beer - refillable Liquor&Wine-Green
Beer - non-refillable
Liquor&Wine-Brown
Deposit Glass Bottles
Soft Drink - refillable
Beverage-Refundable
Deposit Containers
Soft Drink -
nonrefillable Beverage-
Nonrefundable
Other Food/Bev
Other containers
Plate Plate Flat
Other Glass Other Other Other Glass (plate)
Other Other Glass Other Other Glass
Plastics Plastics Plastics Plastic Plastic Plastic Plastic
PET (#1) PET PETE PET PET PET bottles
Soft Drink PET PET Bev.
Other Beverage PET
PET Food Trays
All Other PET Other PET
HDPE (#2) HDPE HDPE HDPE HDPE bottles
HDPE Milk Jugs HDPE-rigid
HDPE Other Beverage
HDPE-film Bottles,Jugs,Tubs,
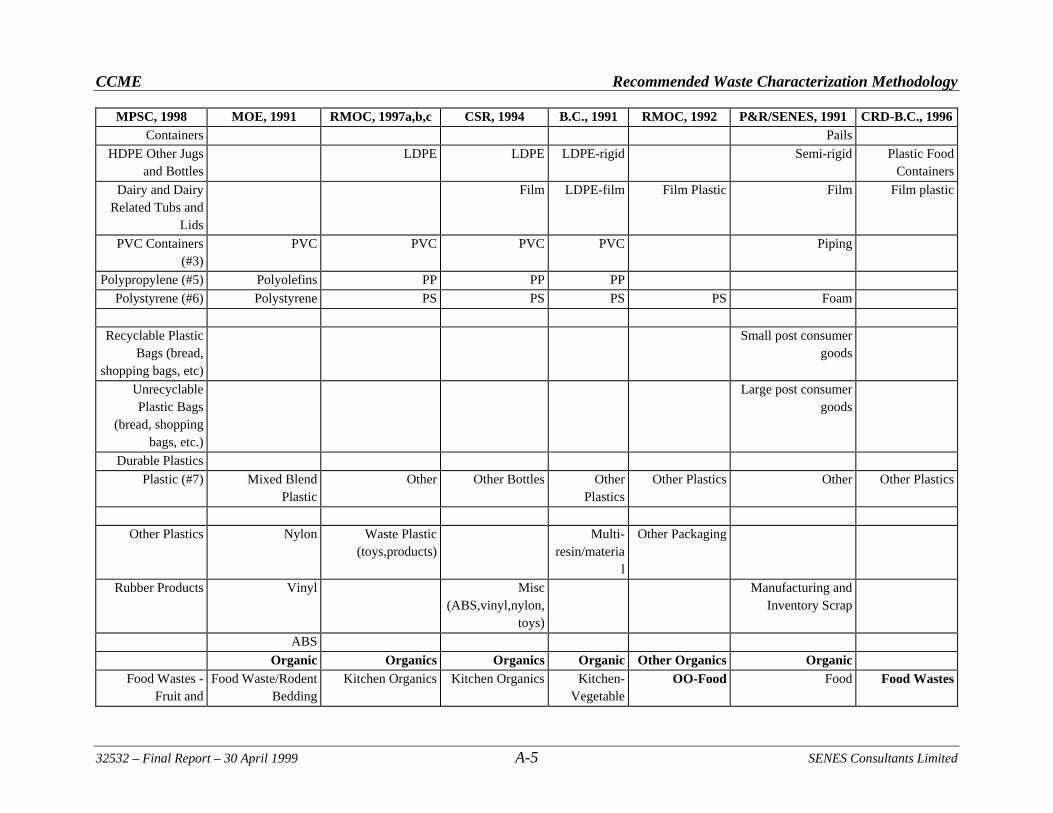
CCME Recommended Waste Characterization Methodology
32532 – Final Report – 30 April 1999 A-5 SENES Consultants Limited
MPSC, 1998 MOE, 1991 RMOC, 1997a,b,c CSR, 1994 B.C., 1991 RMOC, 1992 P&R/SENES, 1991 CRD-B.C., 1996Containers Pails
HDPE Other Jugs and Bottles
LDPE LDPE LDPE-rigid Semi-rigid Plastic Food Containers
Dairy and Dairy Related Tubs and
Lids
Film LDPE-film Film Plastic Film Film plastic
PVC Containers (#3)
PVC PVC PVC PVC Piping
Polypropylene (#5) Polyolefins PP PP PP
Polystyrene (#6) Polystyrene PS PS PS PS Foam
Recyclable Plastic
Bags (bread, shopping bags, etc)
Small post consumer goods
Unrecyclable Plastic Bags
(bread, shopping bags, etc.)
Large post consumer goods
Durable Plastics
Plastic (#7) Mixed Blend Plastic
Other Other Bottles Other Plastics
Other Plastics Other Other Plastics
Other Plastics Nylon Waste Plastic (toys,products)
Multi-resin/materia
l
Other Packaging
Rubber Products Vinyl Misc (ABS,vinyl,nylon,
toys)
Manufacturing and Inventory Scrap
ABS
Organic Organics Organics Organic Other Organics Organic
Food Wastes - Fruit and
Food Waste/Rodent Bedding
Kitchen Organics Kitchen Organics Kitchen-Vegetable
OO-Food Food Food Wastes
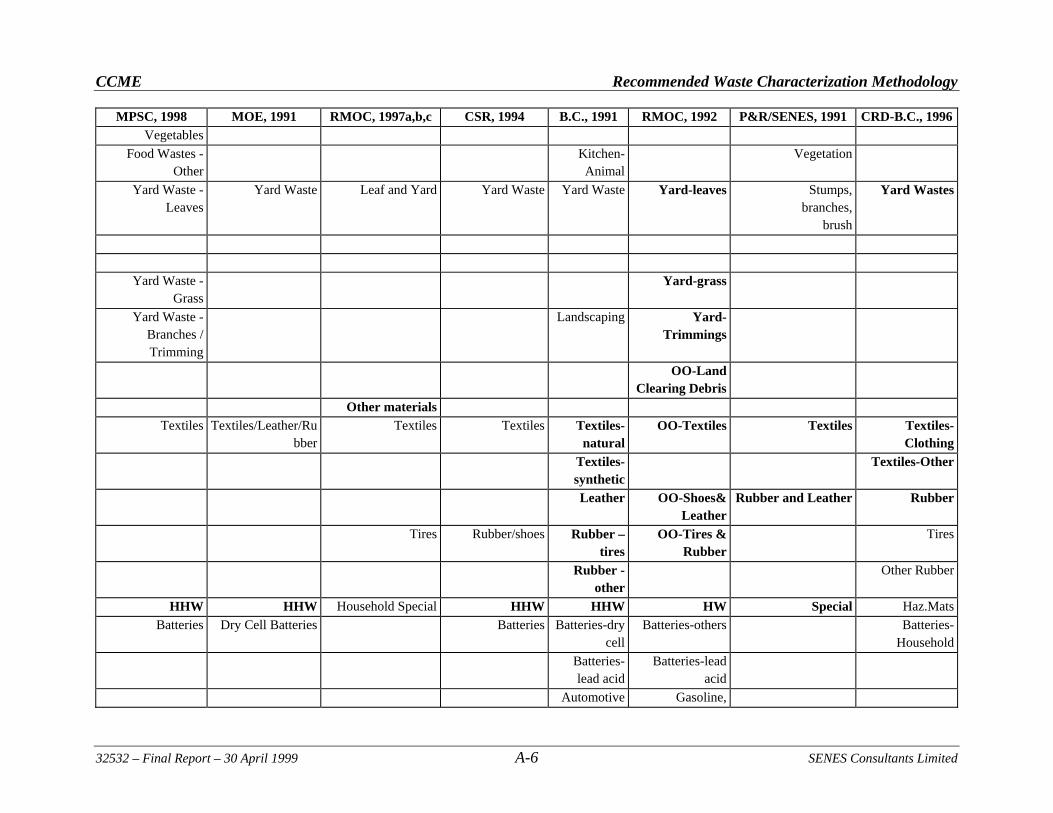
CCME Recommended Waste Characterization Methodology
32532 – Final Report – 30 April 1999 A-6 SENES Consultants Limited
MPSC, 1998 MOE, 1991 RMOC, 1997a,b,c CSR, 1994 B.C., 1991 RMOC, 1992 P&R/SENES, 1991 CRD-B.C., 1996Vegetables
Food Wastes - Other
Kitchen-Animal
Vegetation
Yard Waste - Leaves
Yard Waste Leaf and Yard Yard Waste Yard Waste Yard-leaves Stumps,branches,
brush
Yard Wastes
Yard Waste -
Grass Yard-grass
Yard Waste - Branches / Trimming
Landscaping Yard-Trimmings
OO-Land Clearing Debris
Other materials
Textiles Textiles/Leather/Rubber
Textiles Textiles Textiles-natural
OO-Textiles Textiles Textiles-Clothing
Textiles-synthetic
Textiles-Other
Leather OO-Shoes&Leather
Rubber and Leather Rubber
Tires Rubber/shoes Rubber – tires
OO-Tires & Rubber
Tires
Rubber - other
Other Rubber
HHW HHW Household Special HHW HHW HW Special Haz.Mats
Batteries Dry Cell Batteries Batteries Batteries-dry cell
Batteries-others Batteries-Household
Batteries-lead acid
Batteries-lead acid
Automotive Gasoline,
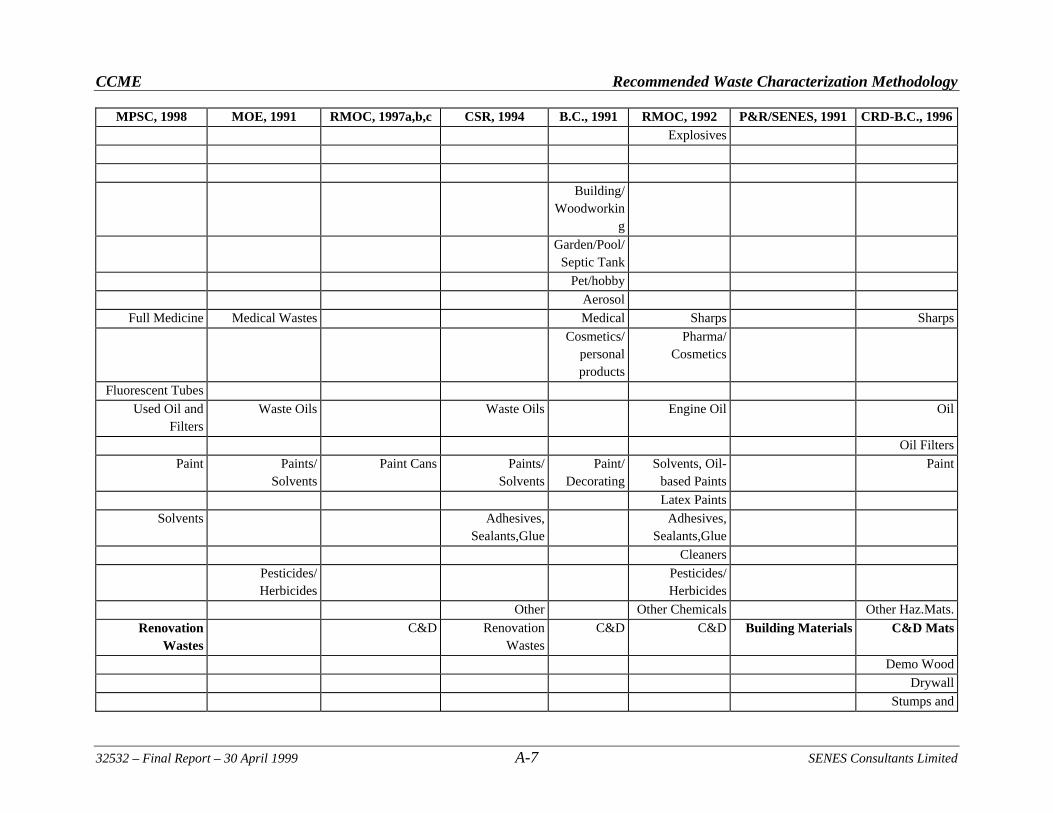
CCME Recommended Waste Characterization Methodology
32532 – Final Report – 30 April 1999 A-7 SENES Consultants Limited
MPSC, 1998 MOE, 1991 RMOC, 1997a,b,c CSR, 1994 B.C., 1991 RMOC, 1992 P&R/SENES, 1991 CRD-B.C., 1996Explosives
Building/
Woodworking
Garden/Pool/Septic Tank
Pet/hobby
Aerosol
Full Medicine Medical Wastes Medical Sharps Sharps
Cosmetics/ personal products
Pharma/Cosmetics
Fluorescent Tubes
Used Oil and Filters
Waste Oils Waste Oils Engine Oil Oil
Oil Filters
Paint Paints/ Solvents
Paint Cans Paints/Solvents
Paint/ Decorating
Solvents, Oil-based Paints
Paint
Latex Paints
Solvents Adhesives,Sealants,Glue
Adhesives,Sealants,Glue
Cleaners
Pesticides/ Herbicides
Pesticides/Herbicides
Other Other Chemicals Other Haz.Mats.
Renovation Wastes
C&D Renovation Wastes
C&D C&D Building Materials C&D Mats
Demo Wood
Drywall
Stumps and
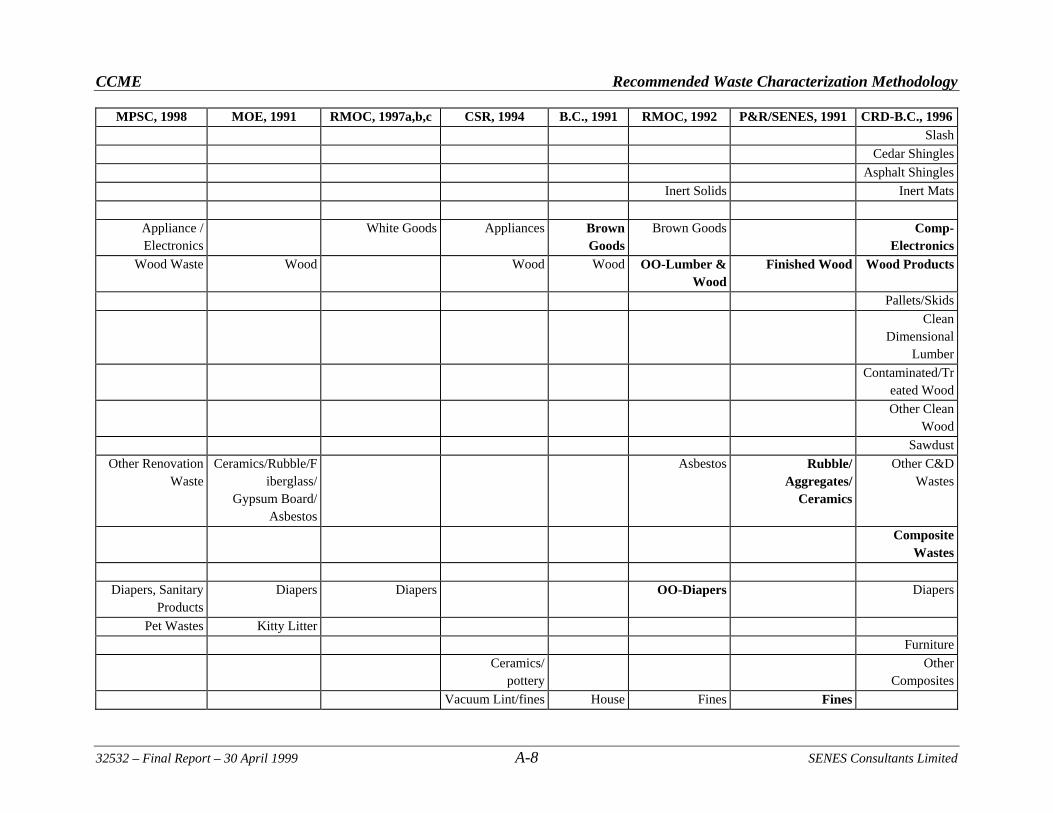
CCME Recommended Waste Characterization Methodology
32532 – Final Report – 30 April 1999 A-8 SENES Consultants Limited
MPSC, 1998 MOE, 1991 RMOC, 1997a,b,c CSR, 1994 B.C., 1991 RMOC, 1992 P&R/SENES, 1991 CRD-B.C., 1996Slash
Cedar Shingles
Asphalt Shingles
Inert Solids Inert Mats
Appliance / Electronics
White Goods Appliances Brown Goods
Brown Goods Comp-Electronics
Wood Waste Wood Wood Wood OO-Lumber & Wood
Finished Wood Wood Products
Pallets/Skids
Clean Dimensional
Lumber
Contaminated/Treated Wood
Other Clean Wood
Sawdust
Other Renovation Waste
Ceramics/Rubble/Fiberglass/
Gypsum Board/ Asbestos
Asbestos Rubble/Aggregates/
Ceramics
Other C&D Wastes
Composite Wastes
Diapers, Sanitary Products
Diapers Diapers OO-Diapers Diapers
Pet Wastes Kitty Litter
Furniture
Ceramics/pottery
Other Composites
Vacuum Lint/fines House Fines Fines
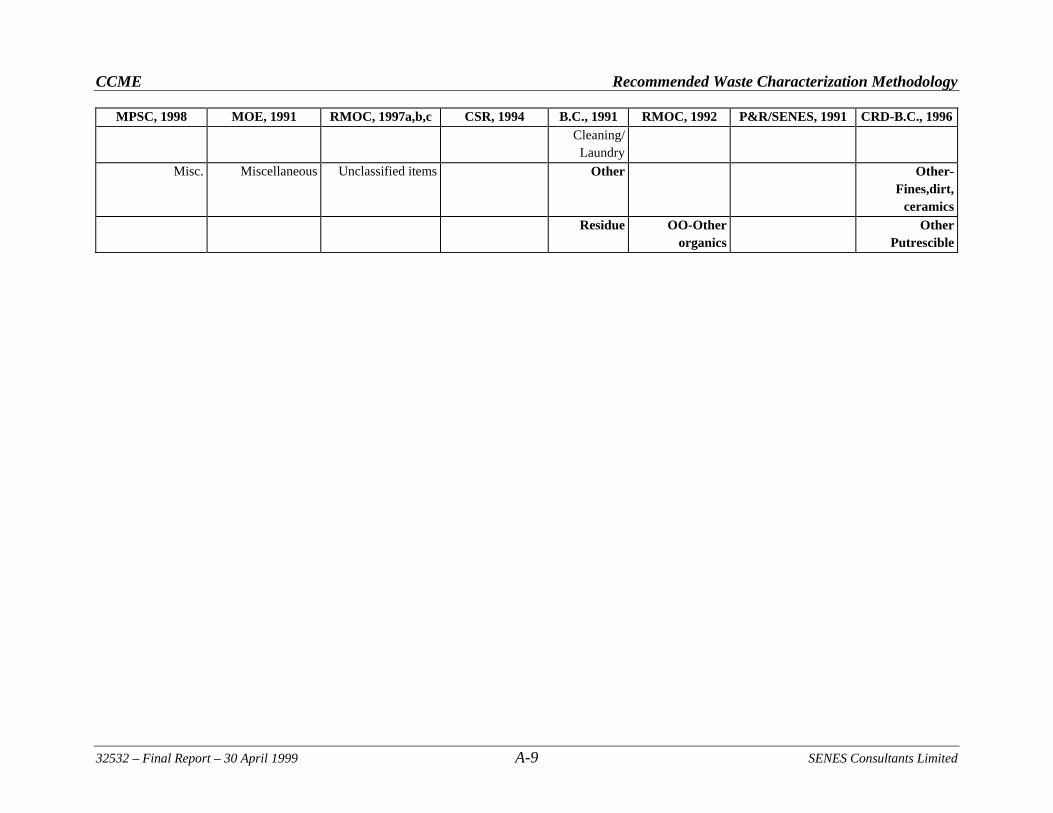
CCME Recommended Waste Characterization Methodology
32532 – Final Report – 30 April 1999 A-9 SENES Consultants Limited
MPSC, 1998 MOE, 1991 RMOC, 1997a,b,c CSR, 1994 B.C., 1991 RMOC, 1992 P&R/SENES, 1991 CRD-B.C., 1996Cleaning/ Laundry
Misc. Miscellaneous Unclassified items Other Other-Fines,dirt,
ceramics Residue OO-Other
organics Other
Putrescible
CCME Recommended Waste Characterization Methodology
32532 – Final Report – 30 April 1999 SENES Consultants Limited
APPENDIX B
CONTACT INFORMATION FOR MATERIAL INDUSTRIES AND
ASSOCIATIONS
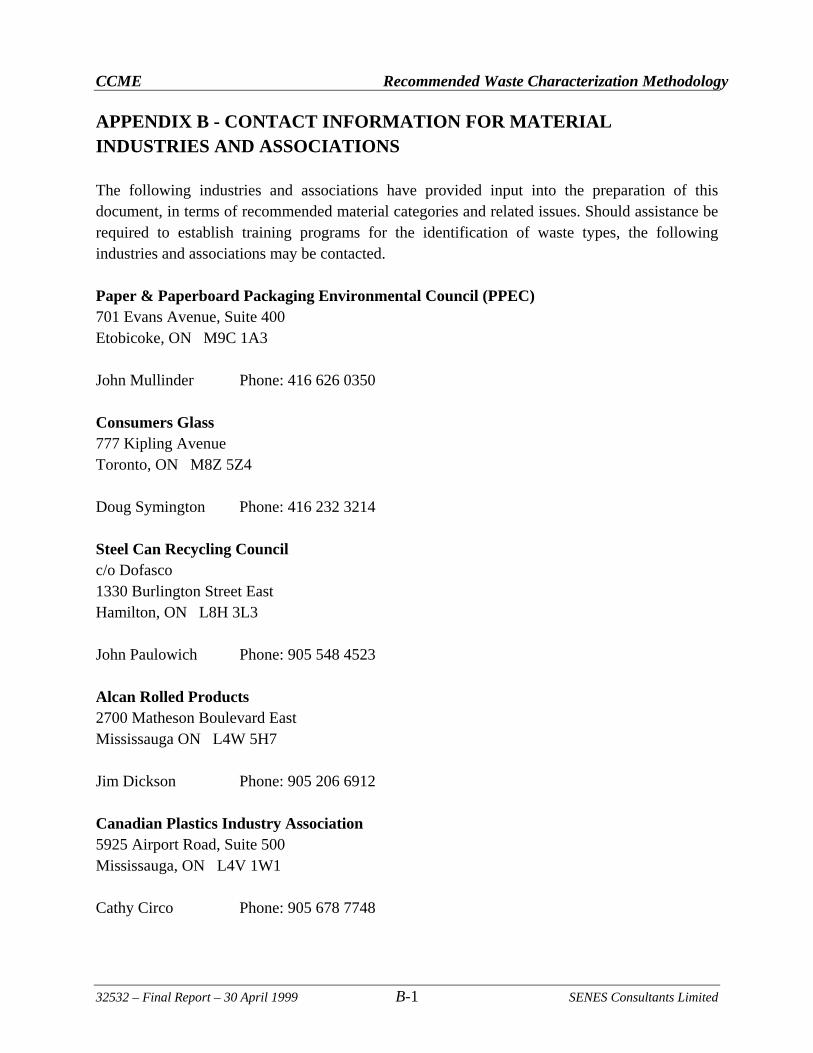
CCME Recommended Waste Characterization Methodology
32532 – Final Report – 30 April 1999 B-1 SENES Consultants Limited
APPENDIX B - CONTACT INFORMATION FOR MATERIAL INDUSTRIES AND ASSOCIATIONS The following industries and associations have provided input into the preparation of this document, in terms of recommended material categories and related issues. Should assistance be required to establish training programs for the identification of waste types, the following industries and associations may be contacted. Paper & Paperboard Packaging Environmental Council (PPEC) 701 Evans Avenue, Suite 400 Etobicoke, ON M9C 1A3 John Mullinder Phone: 416 626 0350 Consumers Glass 777 Kipling Avenue Toronto, ON M8Z 5Z4 Doug Symington Phone: 416 232 3214 Steel Can Recycling Council c/o Dofasco 1330 Burlington Street East Hamilton, ON L8H 3L3 John Paulowich Phone: 905 548 4523 Alcan Rolled Products 2700 Matheson Boulevard East Mississauga ON L4W 5H7 Jim Dickson Phone: 905 206 6912 Canadian Plastics Industry Association 5925 Airport Road, Suite 500 Mississauga, ON L4V 1W1 Cathy Circo Phone: 905 678 7748
CCME Recommended Waste Characterization Methodology
32532 – Final Report – 30 April 1999 SENES Consultants Limited
APPENDIX C
DETAILED DESCRIPTION OF STATISTICAL METHODS
CCME Recommended Waste Characterization Methodology
32532 – Final Report – 30 April 1999 C-1 SENES Consultants Limited
APPENDIX C - DETAILED DESCRIPTION OF STATISTICAL METHODS Section 6 of the report outlines the general approach for Data Analysis and Reporting. Below, details of the techniques to be used are provided. C.1 RAW DATA The collected data are recorded in a database and the following approach is used to calculate the waste generation rates (eg. kg capita-1 d-1) for each material category:
1) Calculate the total weight of the waste in each load (total load weight), before oversize items are removed. This is the weight of a single truck-load or waste bin or collected curb-side wastes for a group of households, from which a sample will be taken;
2) Calculate the sub-sample weight (total load weight less weight of oversize items) by subtracting the weight of the oversize items from the total load weight;
3) Calculate the weight of the sorted sample taken for detailed component sorting. This weight corresponds to the sample that was recommended in the methodology to be 90-135 kg. Use the actual weight whether or not it is within this recommended range;
4) Calculate the component fractions by dividing the weight of each component (material category) by the weight of the sorted sample;
5) Estimate the weight in each category in the load (total category weights) by multiplying the component fractions by the weight in the sorted sample, and then adding the weights of the oversized items within the appropriate categories;
6) Calculate the (percentage) composition for the total load by dividing the total category weights by the total load weight; and,
7) Calculate the waste generation rates (eg. kg capita-1 d-1) by category by dividing the total category weights by the number of residents or employees producing the waste for the load. This would typically be the case for generator-based studies. If possible, it is desirable to estimate generation rates for landfill samples at this stage.
C.2 AVERAGES FOR SECTOR AND SEASON Individual sample results are to be summarized to provide mean and standard deviation statistics for each sector and season. Functions to calculate the sample mean and sample standard deviation are available in most spreadsheet and database software packages. The confidence interval (standard error) about the mean should also be calculated at this time.
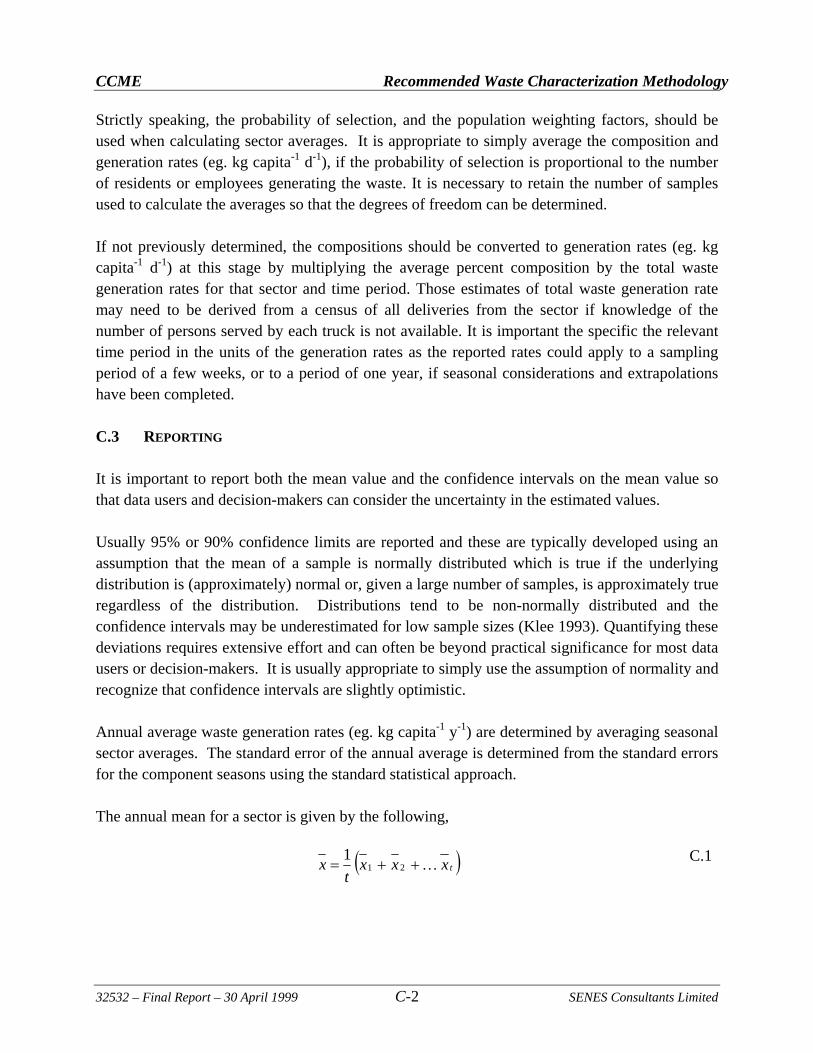
CCME Recommended Waste Characterization Methodology
32532 – Final Report – 30 April 1999 C-2 SENES Consultants Limited
Strictly speaking, the probability of selection, and the population weighting factors, should be used when calculating sector averages. It is appropriate to simply average the composition and generation rates (eg. kg capita-1 d-1), if the probability of selection is proportional to the number of residents or employees generating the waste. It is necessary to retain the number of samples used to calculate the averages so that the degrees of freedom can be determined. If not previously determined, the compositions should be converted to generation rates (eg. kg capita-1 d-1) at this stage by multiplying the average percent composition by the total waste generation rates for that sector and time period. Those estimates of total waste generation rate may need to be derived from a census of all deliveries from the sector if knowledge of the number of persons served by each truck is not available. It is important the specific the relevant time period in the units of the generation rates as the reported rates could apply to a sampling period of a few weeks, or to a period of one year, if seasonal considerations and extrapolations have been completed. C.3 REPORTING It is important to report both the mean value and the confidence intervals on the mean value so that data users and decision-makers can consider the uncertainty in the estimated values. Usually 95% or 90% confidence limits are reported and these are typically developed using an assumption that the mean of a sample is normally distributed which is true if the underlying distribution is (approximately) normal or, given a large number of samples, is approximately true regardless of the distribution. Distributions tend to be non-normally distributed and the confidence intervals may be underestimated for low sample sizes (Klee 1993). Quantifying these deviations requires extensive effort and can often be beyond practical significance for most data users or decision-makers. It is usually appropriate to simply use the assumption of normality and recognize that confidence intervals are slightly optimistic. Annual average waste generation rates (eg. kg capita-1 y-1) are determined by averaging seasonal sector averages. The standard error of the annual average is determined from the standard errors for the component seasons using the standard statistical approach. The annual mean for a sector is given by the following,
C.1 txxxt
x 211
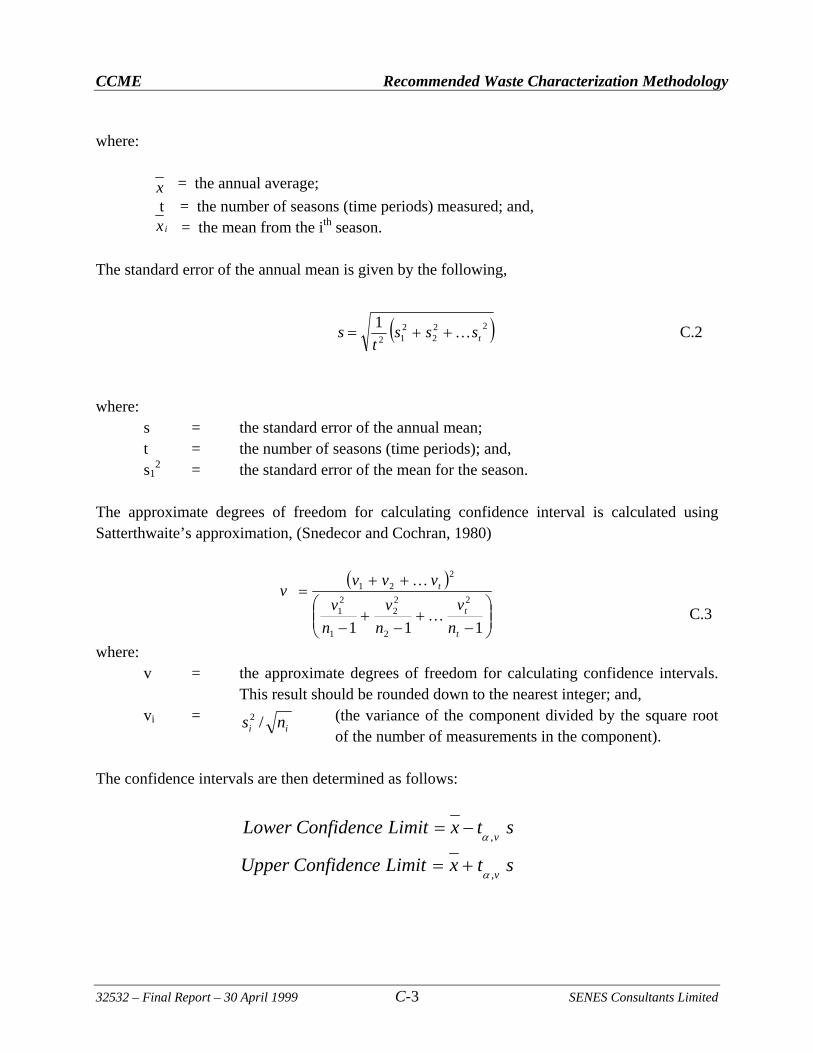
CCME Recommended Waste Characterization Methodology
32532 – Final Report – 30 April 1999 C-3 SENES Consultants Limited
ii ns /2
x
ix
where:
= the annual average;
t = the number of seasons (time periods) measured; and, = the mean from the ith season.
The standard error of the annual mean is given by the following,
where: s = the standard error of the annual mean; t = the number of seasons (time periods); and, s1
2 = the standard error of the mean for the season. The approximate degrees of freedom for calculating confidence interval is calculated using Satterthwaite’s approximation, (Snedecor and Cochran, 1980)
where: v = the approximate degrees of freedom for calculating confidence intervals.
This result should be rounded down to the nearest integer; and, vi = (the variance of the component divided by the square root
of the number of measurements in the component). The confidence intervals are then determined as follows:
stxLimitConfidenceLowerv,
stxLimitConfidenceUpperv,
C.2
C.3
111
2
2
22
1
21
221
t
t
t
n
v
n
v
n
v
vvvv
222
212
1tsss
ts
CCME Recommended Waste Characterization Methodology
32532 – Final Report – 30 April 1999 C-4 SENES Consultants Limited
The value of the t-statistic, t,v, is determined from tabulated values or calculated within the software package. The value of a function of the degrees of freedom v and the confidence level
(1-) x 100%. In many cases it is desirable to aggregate across sectors or waste categories or both. In these cases, it is often convenient to convert from the generation rates on a per person or per employee basis (eg. kg capita-1 d-1) to an overall total basis for the given time period. Equations C.1 through C.3 can be modified so that the total for the time period corresponds to the mean generation rate and the standard error for the total corresponds to the standard error for the generation rate. The equations are similar except the mean is not divided by the number of components, and the variance is not divided by the square of the number of components. The degrees of freedom are similar.