pmma-pani (acid doped) blends -...
TRANSCRIPT

71
Chapter-3
PMMA-PAni (acid doped) Blends
As already discussed in Chapter 1 (Section-1.6), the present study
highlights the optical, electrical and structural response of Poly(methyl
methacrylate) (PMMA) on blending with Polyaniline (PAni) having
doping of acids and metal salts. In the present chapter, after
discussing the properties of synthesized dodecyl benzene sulfonic acid
(DBSA) and camphor sulfonic acid (CSA) doped PAni, modifications in
the optical, electrical and structural behaviour of PMMA on blending it
with the as prepared PAni at different concentrations is presented.
Finally, the observed changes in the optical and electrical behaviour
are tried to be understood in terms of the induced structural changes
revealed through FTIR and Raman spectroscopic techniques.
3.1 ACIDS (DBSA AND CSA) DOPED POLYANILINE
Polyaniline doped with DBSA and CSA was synthesized by following
the procedure as already discussed in Chapter 2, Section-2.2. In order
to confirm the nature of as prepared PAni powders, the same were
subjected to UV-Visible absorption, FTIR and Raman spectroscopic
analysis.
Ph.D. Thesis: A.K. Tomar-2012
72
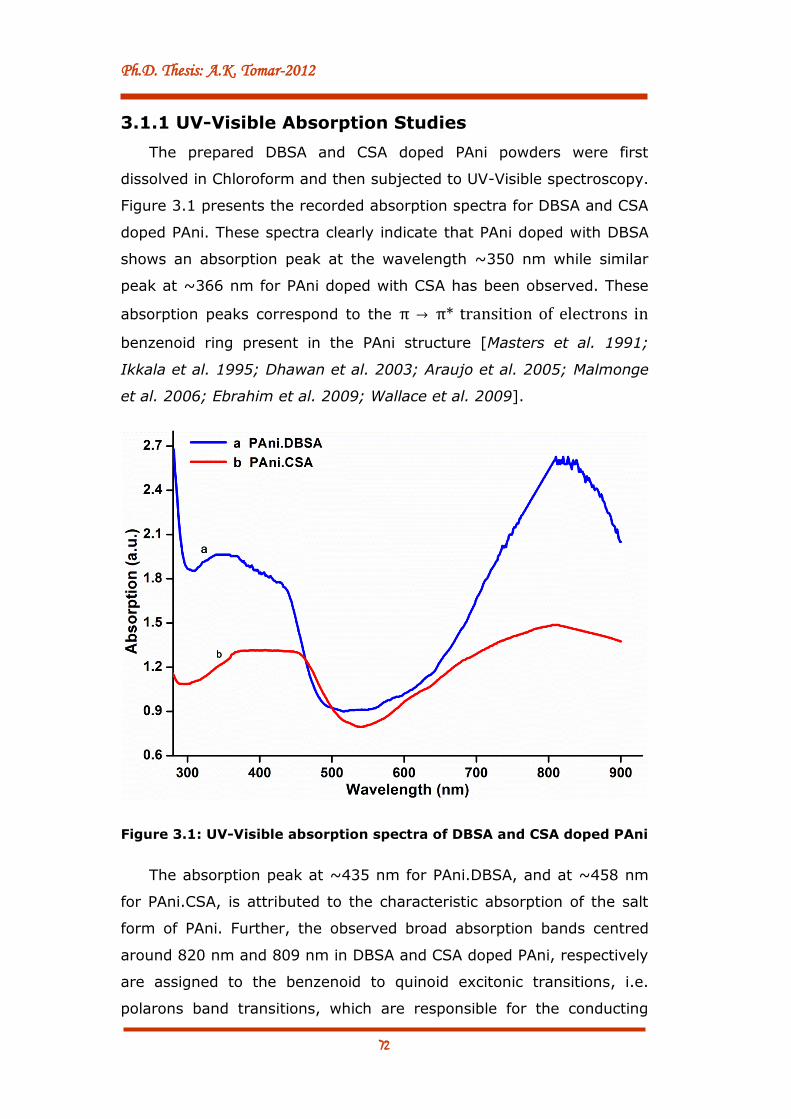
3.1.1 UV-Visible Absorption Studies
The prepared DBSA and CSA doped PAni powders were first
dissolved in Chloroform and then subjected to UV-Visible spectroscopy.
Figure 3.1 presents the recorded absorption spectra for DBSA and CSA
doped PAni. These spectra clearly indicate that PAni doped with DBSA
shows an absorption peak at the wavelength ~350 nm while similar
peak at ~366 nm for PAni doped with CSA has been observed. These
absorption peaks correspond to the π → π* transition of electrons in
benzenoid ring present in the PAni structure [Masters et al. 1991;
Ikkala et al. 1995; Dhawan et al. 2003; Araujo et al. 2005; Malmonge
et al. 2006; Ebrahim et al. 2009; Wallace et al. 2009].
Figure 3.1: UV-Visible absorption spectra of DBSA and CSA doped PAni
The absorption peak at ~435 nm for PAni.DBSA, and at ~458 nm
for PAni.CSA, is attributed to the characteristic absorption of the salt
form of PAni. Further, the observed broad absorption bands centred
around 820 nm and 809 nm in DBSA and CSA doped PAni, respectively
are assigned to the benzenoid to quinoid excitonic transitions, i.e.
polarons band transitions, which are responsible for the conducting

Chapter-3: PMMA-PAni (acid doped) Blends
73
nature of these acid doped PAni salts [Dhawan et al. 2003; Araujo et
al. 2005; Malmonge et al. 2006; Ebrahim et al. 2009; Wallace et al.
2009].
3.1.2 FTIR Spectroscopy
In order to confirm the chemical nature of synthesized PAni doped
with DBSA and CSA, the same were characterized through FTIR
spectroscopy. Figure 3.2 shows the FTIR spectra of PAni.DBSA
(spectrum ‘a’) and PAni.CSA (spectrum ‘b’).
Figure 3.2: FTIR spectra of PAni doped with (a) DBSA and (b) CSA
The broad absorption band observed at wavenumbers higher than
2000 cm–1 in these spectra is due to the absorption of free charge-
carriers in the protonated (doped) PAni, which confirms its conducting
form (emeraldine salt) [Epstein et al. 1986; Neoh et al. 1993; Ping
1996; Trchova and Stejskal 2011]. The strong peaks at 1574 and
1488 cm–1 in PAni.DBSA, and at same wavenumbers in PAni.CSA, are
due to quinoid (Q) and benzenoid (B) ring-stretching vibrations,
respectively. The absorption band at 1303 cm–1 in PAni.DBSA

Ph.D. Thesis: A.K. Tomar-2012
74
(~1307 cm-1 in PAni.CSA) corresponds to π-electron delocalization
induced in the polymer on doping [Kim et al. 1988; Cao et al. 1989,
Masters et al. 1991; Ping 1996; Bhat et al. 2002; Dhawan et al. 2003;
Malmonge et al. 2006; Trchova and Stejskal 2011]. The characteristic
bands observed at 1265 cm–1 and 1257 cm-1 for PAni doped with DBSA
and CSA, respectively correspond to C–N+• stretching vibration in the
polaron structure [Boyer et al. 2000; Ameen et al. 2008; Afjal et al.
2009, 2010; Trchova and Stejskal 2011], which again confirm the
conducting nature of PAni after doping.
The band exhibited at 1126 cm–1 in PAni.DBSA and the shoulder at
1149 cm-1 in PAni.CSA are assigned to the vibration mode of –NH+=
structure, and associated with the vibrations of the charged polymer
units Q=NH+−B or B−NH+•−B [Boyer et al. 1998; Kang et al. 1998;
Socrates 2001; Trchova and Stejskal 2011]. This indicates the
existence of positive charges on the chain and the distribution of the
dihedral (torsion) angle between the quinoid and benzenoid rings. This
band is related to the high degree of electron delocalization in PAni, as
well as to a strong interchain NH+...N hydrogen bonding [Colomban et
al. 1994; Hasik et al. 2002; Trchova and Stejskal 2011]. The
asymmetric SO3 stretching vibration in the hydrogen sulphate counter
ion (present in DBSA and CSA) can also contribute to this band. The
peak observed at 1056 cm–1 for PAni.DBSA and the band centred at
1064 cm-1 for PAni.CSA are attributed to the symmetric SO3 stretching
in the hydrogen sulphate counter ion. The band at 879 cm–1 in the
spectrum of the PAni.CSA has been attributed to the HSO4– counter
ion. The sharp bands at 817 cm–1 in PAni.DBSA and 794 cm-1 in
PAni.CSA spectra are due to the C–H out-of-plane bending vibrations
of two adjacent hydrogen atoms on a disubstituted benzene ring
[Bellamy 1962; Vien et al. 1991; Boyer et al. 1998; Kang et al. 1998;
Socrates 2001; Trchova and Stejskal 2011]. This confirms the
dominating para-coupling of constitutional units in PAni chains.
Thus, the FTIR analysis of DBSA and CSA doped PAni, as discussed
above, confirms the formation of PAni in its emeraldine salt form.
Chapter-3: PMMA-PAni (acid doped) Blends
75
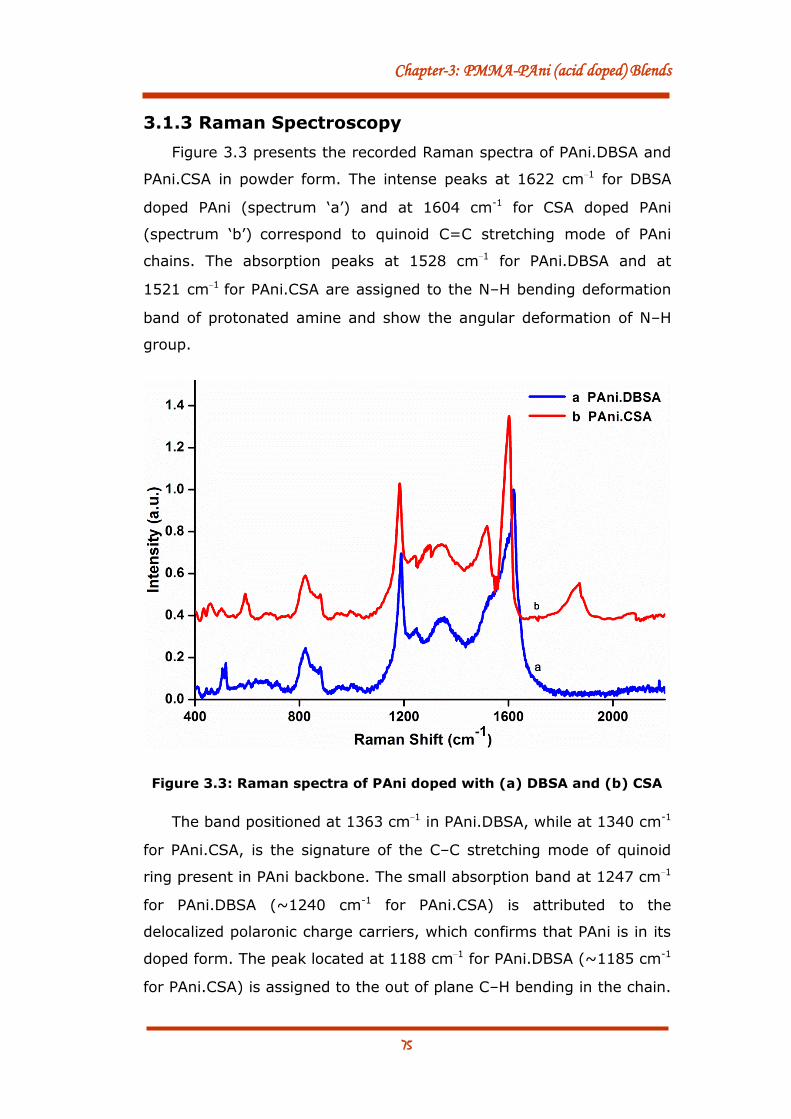
3.1.3 Raman Spectroscopy
Figure 3.3 presents the recorded Raman spectra of PAni.DBSA and
PAni.CSA in powder form. The intense peaks at 1622 cm−1 for DBSA
doped PAni (spectrum ‘a’) and at 1604 cm-1 for CSA doped PAni
(spectrum ‘b’) correspond to quinoid C=C stretching mode of PAni
chains. The absorption peaks at 1528 cm−1 for PAni.DBSA and at
1521 cm−1 for PAni.CSA are assigned to the N–H bending deformation
band of protonated amine and show the angular deformation of N–H
group.
Figure 3.3: Raman spectra of PAni doped with (a) DBSA and (b) CSA
The band positioned at 1363 cm−1 in PAni.DBSA, while at 1340 cm-1
for PAni.CSA, is the signature of the C–C stretching mode of quinoid
ring present in PAni backbone. The small absorption band at 1247 cm−1
for PAni.DBSA (~1240 cm-1 for PAni.CSA) is attributed to the
delocalized polaronic charge carriers, which confirms that PAni is in its
doped form. The peak located at 1188 cm−1 for PAni.DBSA (~1185 cm-1
for PAni.CSA) is assigned to the out of plane C–H bending in the chain.

Ph.D. Thesis: A.K. Tomar-2012
76
The peak observed at 880 cm-1 in PAni.DBSA (~882 cm-1 in PAni.CSA)
is assigned to O-C(O)-O stretching mode in the PAni chain. The peak
positioned at 589 cm-1 in PAni.CSA spectrum is assigned to the
formation of cross-linking between the PAni chains. The other small
peaks or bands are also in accordance with the characteristic nature of
doped PAni. Thus, Raman analysis of DBSA and CSA doped PAni
confirms the formation of emeraldine salt form of PAni [Ward and Mi
1999; Tagowska et al. 2004; Silva et al. 2005; Lu et al. 2009; Kumar
et al. 2010; Shakoor and Rizvi 2010; Tomar et al. 2012], in line with
FTIR analysis.
As discussed above, the presence of polaron absorption
band around 820 nm in UV-Visible spectrum, absorption at
around 1303, 1265 and 1126 cm-1 in FTIR spectrum and peak at
~1240 cm-1 in Raman spectrum of PAni.DBSA, and
corresponding peaks/bands in PAni.CSA, confirm the presence
of charge carriers (polarons in the present case) in the
synthesized PAni, which are responsible for conducting nature
of PAni.
After confirming the conducting form of DBSA and CSA doped PAni;
in the next section, the results of conductivity measurements of
synthesized PAni are presented.
3.1.4 Conductivity Measurements
For the determination of conductivity, the V-I measurements of
DBSA and CSA doped PAni (in pellet form) have been carried out using
two probe method and the results are presented in figure 3.4. This
figure clearly indicates the linear increase in current with applied
voltage and shows the Ohmic behaviour for both DBSA and CSA doped
PAni. From the V-I data, the conductivity was determined and found to
be 5.69 S/cm and 4.93 S/cm for PAni doped with DBSA and CSA,
respectively. These values of conductivity lie in the range of conductors
[Blythe 1979, 1984; Epstein 1997; Kohlman et al. 1997; Sze 2004;

Chapter-3: PMMA-PAni (acid doped) Blends
77
Jain et al. 2007]. Thus, it can be inferred that the prepared DBSA and
CSA doped PAni are conducting in nature.
Figure 3.4: V-I characteristics of DBSA and CSA doped PAni
After confirming the conducting nature of as prepared acids doped
PAni, the same were mixed with PMMA at different concentrations
(weight %) through sol-gel process and finally, free standing PMMA-
PAni composite films were prepared using solution casting method.
Such prepared films were subjected to various characterization
techniques to study the induced changes in optical, electrical and
structural properties of PMMA on blending with acids doped PAni at
different concentrations. The results are presented in the following
sections.
3.2 PMMA-PANI.DBSA BLENDS
In order to study the induced changes in optical behaviour of PMMA
after blending with DBSA doped PAni at different concentrations, the
blended films were subjected to the UV-Visible-NIR absorption
spectroscopy. The structural rearrangements caused due to
Ph.D. Thesis: A.K. Tomar-2012
78
incorporation of PAni.DBSA in PMMA were revealed through FTIR and
Raman spectroscopic techniques. To study the variation in electrical
behaviour of these blends, V-I and dielectric measurements were
carried out.
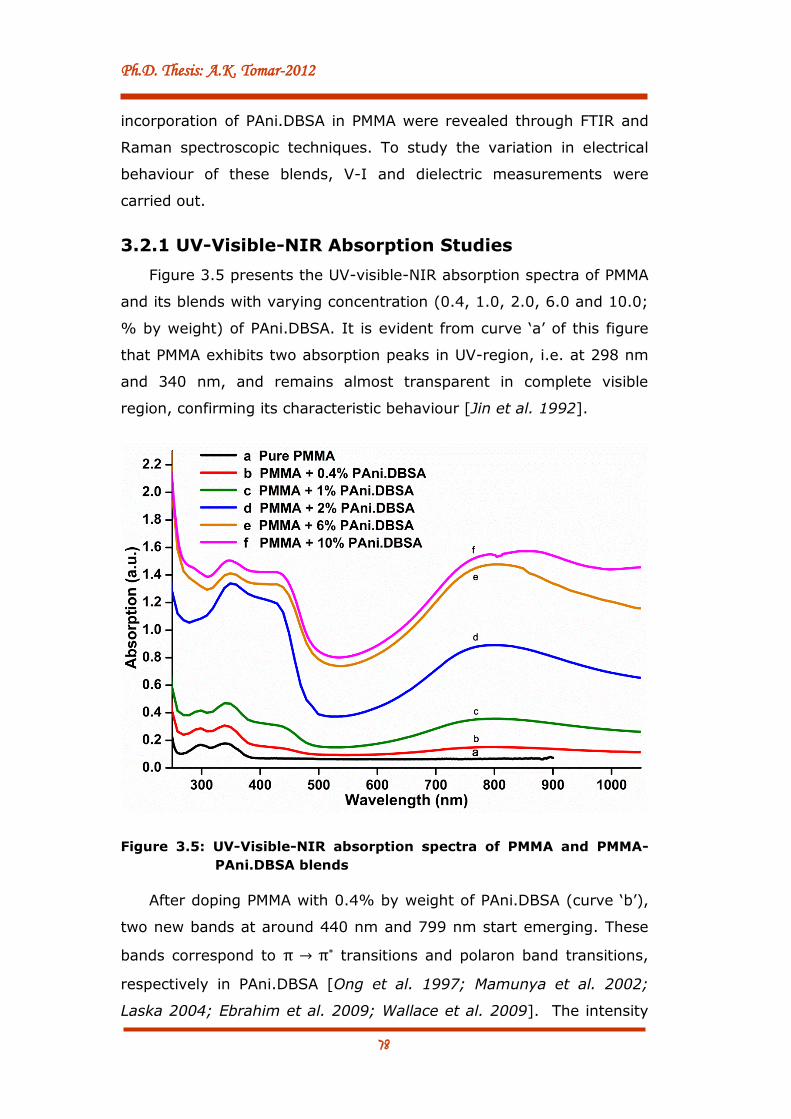
3.2.1 UV-Visible-NIR Absorption Studies
Figure 3.5 presents the UV-visible-NIR absorption spectra of PMMA
and its blends with varying concentration (0.4, 1.0, 2.0, 6.0 and 10.0;
% by weight) of PAni.DBSA. It is evident from curve ‘a’ of this figure
that PMMA exhibits two absorption peaks in UV-region, i.e. at 298 nm
and 340 nm, and remains almost transparent in complete visible
region, confirming its characteristic behaviour [Jin et al. 1992].
Figure 3.5: UV-Visible-NIR absorption spectra of PMMA and PMMA-
PAni.DBSA blends
After doping PMMA with 0.4% by weight of PAni.DBSA (curve ‘b’),
two new bands at around 440 nm and 799 nm start emerging. These
bands correspond to π → π* transitions and polaron band transitions,
respectively in PAni.DBSA [Ong et al. 1997; Mamunya et al. 2002;
Laska 2004; Ebrahim et al. 2009; Wallace et al. 2009]. The intensity
Chapter-3: PMMA-PAni (acid doped) Blends
79
of these new bands has been found to increase consistently with
increase in PAni.DBSA concentration in PMMA (curve ‘c’ to ‘f’). Further,
the merging of the observed characteristic peaks of PMMA with band at
440 nm at higher concentrations (2 weight % and above) of
PAni.DBSA indicates the formation of chemical conjugation of
PAni.DBSA particles with PMMA chains. The same is also confirmed
through FTIR and Raman spectroscopic analysis presented in the
proceeding sections.
It is also clearly observable from this figure that there is a
continuous shift in the absorption edge corresponding to PMMA
towards the longer wavelengths with increasing concentration of
PAni.DBSA in PMMA. The observed shift in absorption edge can be
explained in terms of the formation of new energy levels within the
band gap of PMMA on the addition of PAni.DBSA.
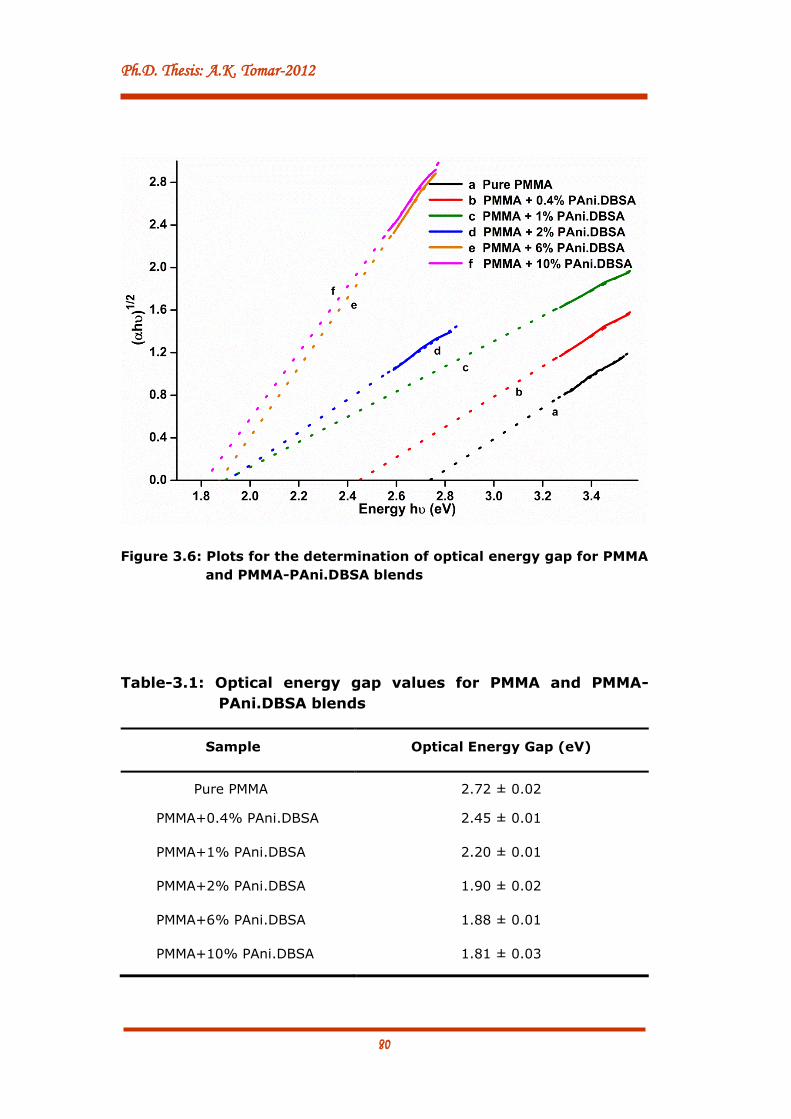
Determination of Optical Energy Gap
In order to determine the values of optical energy gap of PMMA
and its blends with varying concentration of PAni.DBSA, the values of
(αhυ)1/2 as a function of photon energy (hυ) corresponding to the
fundamental absorption edge in the respective UV-Visible absorption
spectra (figure 3.5), have been plotted in the light of Tauc’s relation
[Tauc 1974; Fink 2004; Mighad and Zidan 2006; Kumar et al. 2011].
The linear fitted lines in these plots have been extrapolated and their
intercepts on hυ axis (figure 3.6) provide the values of optical energy
gap. The values of optical energy gap, so obtained, for pure PMMA
and its blends are presented in table-3.1.
It is clearly observable from table-3.1 that the value of optical
energy gap, which comes out to be 2.72 eV for pure PMMA, has been
found to decrease continuously with increase in the concentration of
PAni.DBSA in PMMA and finally, attains a value of 1.81 eV at 10%
concentration (by weight) of PAni.DBSA in PMMA. Such a reduction in
the values of optical energy gap may be explained in terms of the
change in the structure of PMMA due to the formation of some kinds of
bonding between the embedded PAni.DBSA and PMMA chains.
Ph.D. Thesis: A.K. Tomar-2012
80
Figure 3.6: Plots for the determination of optical energy gap for PMMA
and PMMA-PAni.DBSA blends
Table-3.1: Optical energy gap values for PMMA and PMMA-
PAni.DBSA blends
Sample Optical Energy Gap (eV)
Pure PMMA 2.72 ± 0.02
PMMA+0.4% PAni.DBSA 2.45 ± 0.01
PMMA+1% PAni.DBSA 2.20 ± 0.01
PMMA+2% PAni.DBSA 1.90 ± 0.02
PMMA+6% PAni.DBSA 1.88 ± 0.01
PMMA+10% PAni.DBSA 1.81 ± 0.03
Chapter-3: PMMA-PAni (acid doped) Blends
81
This may, in turn, results in the formation of localized states
between the HOMO and LUMO bands of PMMA, which modifies their
extended electronic states, thus, contributing towards the formation of
charge transfer complexes (CTCs) [Devi et al. 2002; Mamunya et al.
2002; Laska 2004; Ebrahim et al. 2009]. These CTCs are responsible
for the feasibility of lower energy transitions leading to the observed
change in optical energy gap.
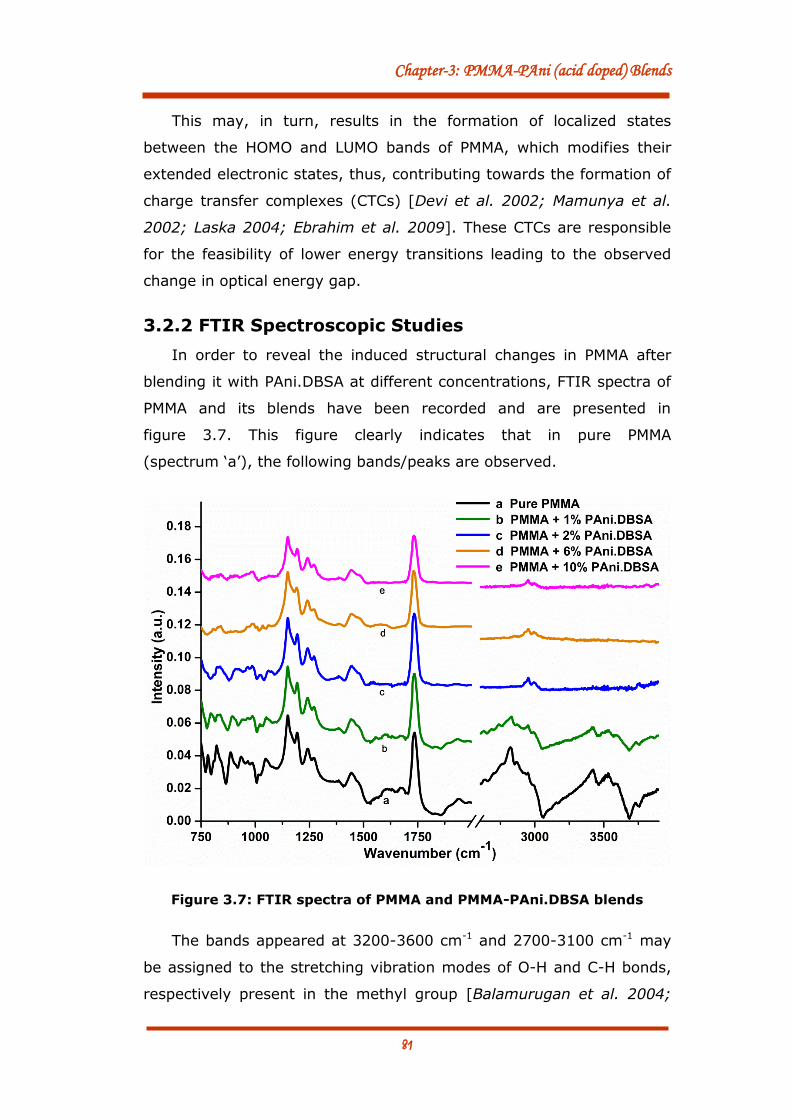
3.2.2 FTIR Spectroscopic Studies
In order to reveal the induced structural changes in PMMA after
blending it with PAni.DBSA at different concentrations, FTIR spectra of
PMMA and its blends have been recorded and are presented in
figure 3.7. This figure clearly indicates that in pure PMMA
(spectrum ‘a’), the following bands/peaks are observed.
Figure 3.7: FTIR spectra of PMMA and PMMA-PAni.DBSA blends
The bands appeared at 3200-3600 cm-1 and 2700-3100 cm-1 may
be assigned to the stretching vibration modes of O-H and C-H bonds,
respectively present in the methyl group [Balamurugan et al. 2004;
Ph.D. Thesis: A.K. Tomar-2012
82
Chao et al. 2008]. The peaks at 2954 and 2877 cm-1 are due to
asymmetric and symmetric stretching vibrations, respectively of CH3
present in methyl group. The strong peak appearing in the region
1732 cm-1 corresponds to the stretching vibrations of carbonyl
functional group (C=O) of methyl present in PMMA chains. The peak
originated at 1437 cm-1 is appearing due to asymmetric bending
vibrations of CH3 present in the chain. Broader and stronger peaks in
the region 1300-1100 cm-1 correspond to ester (C–O) stretching
vibrations. The generation of the peak at 1045 cm-1 is attributed to
–O-CH2 stretching mode. The other peaks present towards lower
wavenumber side correspond to out of plane C–H bending of the PMMA
chains. The presence of all these bands/peaks correspond to the
functional groups present in PMMA and are consistent with the earlier
reports available in the literature [Jo et al. 1989; Balamurugan et al.
2004; Saikia and Kumar 2005; Wang et al. 2006; Khan et al. 2008;
Choudhury and Misra 2010; Tomar et al. 2011].
After embedding PAni.DBSA (1% by weight) in PMMA, the recorded
spectrum ‘b’ indicates that the intensity of almost all the bands/peaks
present in pure PMMA has been reduced considerably indicating the
rearrangement of interactions in PMMA chains on adding PAni.DBSA.
As the concentration of PAni.DBSA is increased to 2% by weight
(spectrum ‘c’), the intensity of the peaks/bands at higher wavenumber
side becomes negligibly small while the decrease in the intensity of
other peaks continues [Shakoor et al. 2009]. With increase in
concentration of PAni.DBSA to 6% by weight in pure PMMA (spectrum
‘d’), only certain peaks corresponding to carbonyl group (1736 cm-1),
CH bonds (2960 cm-1), bending vibration of CH3 (1450 cm-1) and ester
(C-O) vibrations (1300-1100 cm-1) are retained, but with quite small
intensities, and the other peaks are eliminated. Finally, at 10%
concentration by weight of PAni.DBSA (spectrum ‘e’), almost similar
trend as that in spectrum ‘d’ has been noticed except for the more
reduction in the intensity of the remaining peaks.
Thus, the observed behaviour of FTIR spectra of PMMA-PAni.DBSA
blends in comparison to that for pure PMMA clearly indicates that the

Chapter-3: PMMA-PAni (acid doped) Blends
83
structural rearrangements have taken place after blending PMMA with
PAni.DBSA.
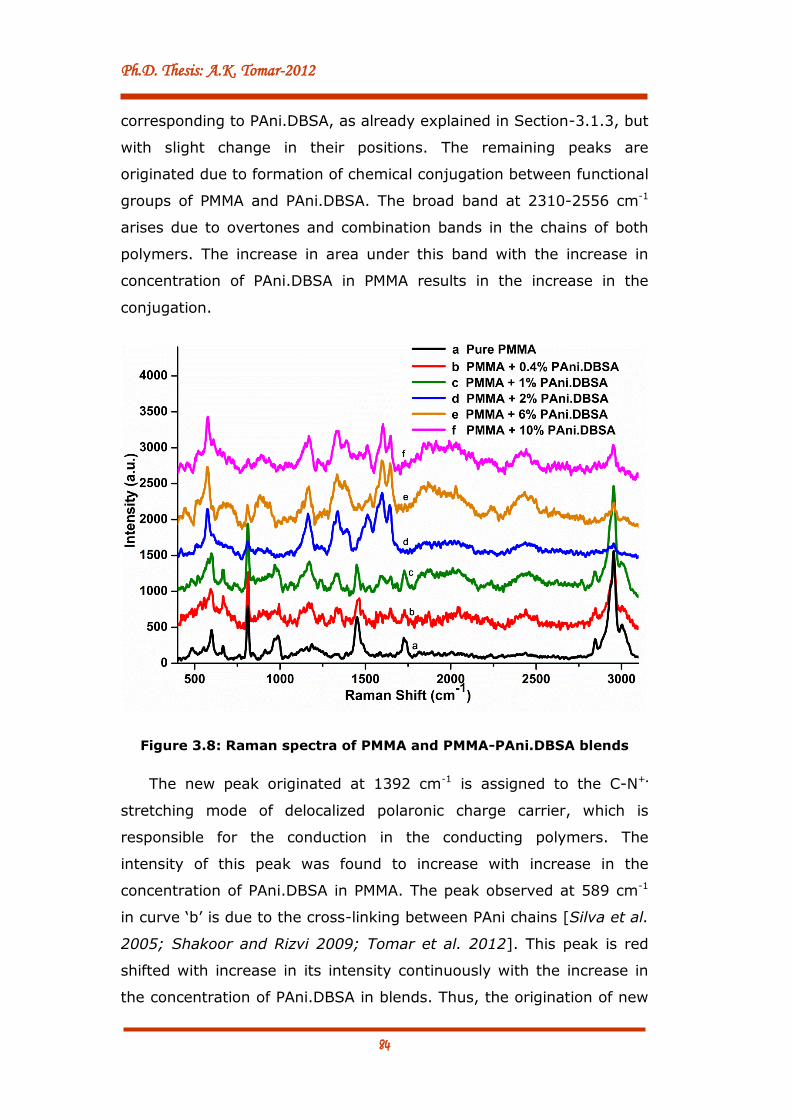
3.2.3 Raman Spectroscopic Studies
As discussed in Chapter 2, Section-2.6 that there are certain bonds
corresponding to symmetric molecules, which are not identified by
FTIR spectroscopic technique. These bonds can show their existence in
Raman spectrum of the molecule. Thus, to explain the structural
rearrangements completely, another complementary technique, i.e.
Raman spectroscopy, was introduced. Figure 3.8 shows the Raman
spectra of PMMA and its blends with varying concentration of
PAni.DBSA.
Figure 3.8 (spectrum ‘a’) clearly indicates the presence of following
peaks in pure PMMA. The peaks at 3004 cm-1 and 2842 cm-1 are
assigned to CH3 asymmetric and CH2 symmetric stretching vibrations,
respectively. These peaks are not clear and partially hidden due to the
sharp and dominating peak at 2956 cm-1, which is corresponding to
CH2 asymmetric stretching vibrations. The peak observed at 1718 cm-1
is attributed due to the C=O stretching mode of ester in carbonyl
group of PMMA. Absorption at 1455 cm-1 is due to the presence of CH2
symmetric bending vibrations. The broad band positioned at 1180 cm-1
is the signature of C-O-C stretching mode. Peaks located at 906 and
988 cm-1 are assigned to C-H in plane bending deformation. This
confirms the chemical structure of PMMA [Ward and Mi 1999;
Tagowska et al. 2004; Silva et al. 2005; Lu et al. 2009; Kumar et al.
2010; Shakoor and Rizvi 2010; Tomar et al. 2012].
On addition of 0.4% by weight of PAni.DBSA to PMMA (spectrum
‘b’), the intensity of the peaks at 3004, 2956, 2842, 1718, 1455, 988
and 814 cm-1 decreases drastically while the band at 1180 cm-1
becomes narrower. In combination of this, several new peaks are
found to emerge at 2443, 2045, 1871, 1645, 1589, 1526, 1392, 1334
and 901 cm-1. The emergence of these new peaks becomes more
prominent at higher concentration of PAni.DBSA in PMMA (curve ‘c’-‘f’).
Most of these peaks (at 1871, 1645, 1526 and 1334 cm-1) are
Ph.D. Thesis: A.K. Tomar-2012
84
corresponding to PAni.DBSA, as already explained in Section-3.1.3, but
with slight change in their positions. The remaining peaks are
originated due to formation of chemical conjugation between functional
groups of PMMA and PAni.DBSA. The broad band at 2310-2556 cm-1
arises due to overtones and combination bands in the chains of both
polymers. The increase in area under this band with the increase in
concentration of PAni.DBSA in PMMA results in the increase in the
conjugation.
Figure 3.8: Raman spectra of PMMA and PMMA-PAni.DBSA blends
The new peak originated at 1392 cm-1 is assigned to the C-N+.
stretching mode of delocalized polaronic charge carrier, which is
responsible for the conduction in the conducting polymers. The
intensity of this peak was found to increase with increase in the
concentration of PAni.DBSA in PMMA. The peak observed at 589 cm-1
in curve ‘b’ is due to the cross-linking between PAni chains [Silva et al.
2005; Shakoor and Rizvi 2009; Tomar et al. 2012]. This peak is red
shifted with increase in its intensity continuously with the increase in
the concentration of PAni.DBSA in blends. Thus, the origination of new
Chapter-3: PMMA-PAni (acid doped) Blends
85
peaks/bands corresponding to PAni.DBSA confirms its presence in
blends while the other new peaks, which were neither present in
spectrum of PMMA nor in PAni.DBSA, show the formation of new bonds
between the PMMA and PAni.DBSA chains. Further, the increase in the
intensity of peaks corresponding to these new bonds confirms the
increase in conjugation with increase in concentration of PAni.DBSA in
blends.
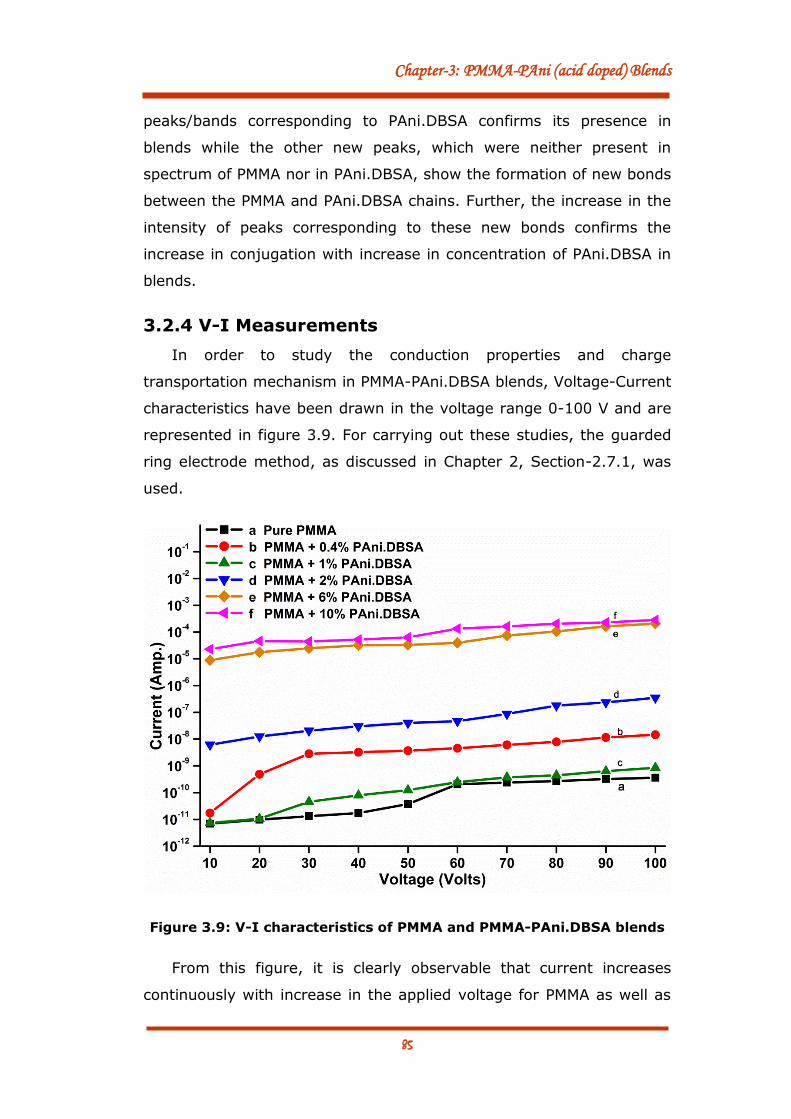
3.2.4 V-I Measurements
In order to study the conduction properties and charge
transportation mechanism in PMMA-PAni.DBSA blends, Voltage-Current
characteristics have been drawn in the voltage range 0-100 V and are
represented in figure 3.9. For carrying out these studies, the guarded
ring electrode method, as discussed in Chapter 2, Section-2.7.1, was
used.
Figure 3.9: V-I characteristics of PMMA and PMMA-PAni.DBSA blends
From this figure, it is clearly observable that current increases
continuously with increase in the applied voltage for PMMA as well as
Ph.D. Thesis: A.K. Tomar-2012
86
PMMA-PAni.DBSA blends. Further, with the addition of 0.4% by weight
of PAni.DBSA in PMMA, a sudden jump in the current is apparent in the
entire voltage range. As the concentration of PAni.DBSA is increased to
1% by weight, current decreases. This decrease in current may be
attributed to the presence of percolation threshold in this region
[Jachym 1982; Boudenne et al. 2011]. For still higher concentrations,
current again increases rapidly. This rise in the current is observed due
to increase in the conducting PAni.DBSA particles in PMMA, which
makes the hopping of charge carriers easier [Kaiser et al. 2001; Veluru
et al. 2007; Amrithesh et al. 2008].
(a) DC Conductivity
DC conductivity (σdc) of PMMA and its blends with PAni.DBSA at
varying concentration was estimated from V-I characteristics using the
following expression (also discussed in Chapter 2, Section-2.7.1)
Here, t is the thickness of sample and I as the current flowing
corresponding to applied potential V. The average value of conductivity
over the entire voltage range (0-100 V) for PMMA and PMMA-
PAni.DBSA blends are tabulated in table-3.2. It can be clearly seen
from the table that conductivity of PMMA, which was found to be
8.8⨯10-16 S/cm, increases abruptly on adding a very small amount
(0.4% by weight) of PAni.DBSA in it. This may be due to the
generation of charge transfer complexes (CTCs) inside the polymer
matrix, which inject the trapping sites in band gap and hence, are
responsible for the easy migration of charge carriers through the blend
[Jachym 1982; Devi et al. 2002; Baudenne et al. 2011]. Another factor
responsible for increase in conductivity relies on the fact that in PMMA-
PAni.DBSA blends, the conducting PAni.DBSA regions are
interconnected by insulating PMMA regions. By increasing the
concentration of PAni.DBSA, enhancement in conductivity occurs due
to electronic tunnelling through non-conducting PMMA separating
Chapter-3: PMMA-PAni (acid doped) Blends
87
mesoscopic conducting PAni.DBSA islands [Kaiser et al. 2001;
Amrithesh et al. 2008]. As the concentration of PAni.DBSA is increased
to 1% by weight, conductivity decreases. This may be due to the
presence of percolation threshold in this region [Jachym 1982;
Boudenne et al. 2011]. With further increase in PAni.DBSA content,
charge transfer complexes are increased in the blends decreasing the
barrier heights and in turn, increasing the π electron mobility owing to
increased tunnelling probability and hence, the dc conductivity. At 10%
by weight of concentration of PAni.DBSA in PMMA, a conductivity of
1.15⨯10-9 S/cm has been attained. This means that conductivity of
PMMA has been increased by about 6 orders in magnitude on addition
of 10% PAni.DBSA in PMMA.
(b) Charge Conduction Mechanism
In order to scrutinize the conduction process quantitatively, it is
indispensable to know the actual way of charge migration through
PMMA and its blends with different weight % of PAni.DBSA. The
observed variation of current with applied voltage rules out the
possibility for Ohmic and Space Charge Limited Conduction (SCLC) in
the present case. The other charge transportation mechanisms include
Fowler-Nordheim mechanism, Poole-Frenkel mechanism and Schottky-
Richardson mechanism. The Fowler-Nordheim mechanism is also not
acceptable in the present case because the observed V-I behaviour has
been found to be in contradiction to that required for the applicability
of this conduction mechanism.
To check the applicability of Poole-Frenkel or Schottky-Richardson
mechanisms, the plots between ln(I) and V1/2 have been drawn and
are represented in figure 3.10. From the figure, it is observed that
plots are almost linear with positive slope fulfilling the primary
necessity for applicability of these mechanisms [Dissado and Fothergill
1992; Blythe and Bloor 2005]. To differentiate between the two
mechanisms, the experimental values of βexp for PMMA and PMMA-
PAni.DBSA blends have been determined from the slope of the
respective plots and compared with those corresponding to Poole-
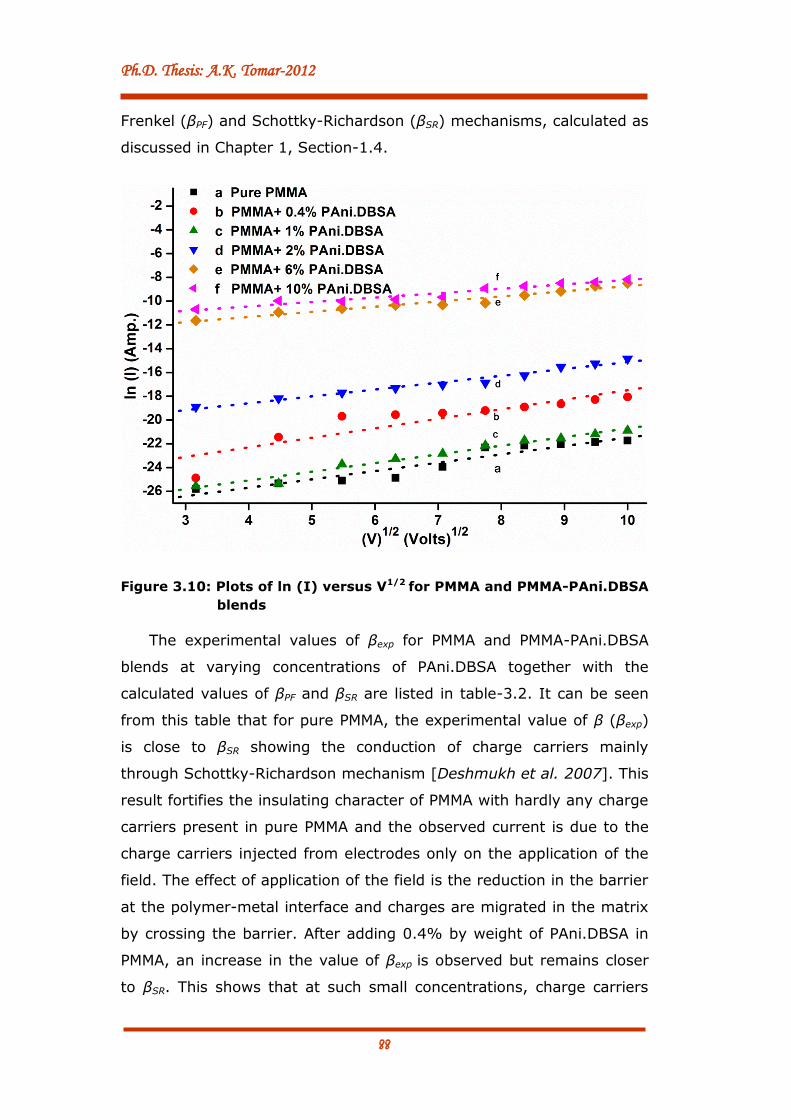
Ph.D. Thesis: A.K. Tomar-2012
88
Frenkel (βPF) and Schottky-Richardson (βSR) mechanisms, calculated as
discussed in Chapter 1, Section-1.4.
Figure 3.10: Plots of ln (I) versus V1/2 for PMMA and PMMA-PAni.DBSA
blends
The experimental values of βexp for PMMA and PMMA-PAni.DBSA
blends at varying concentrations of PAni.DBSA together with the
calculated values of βPF and βSR are listed in table-3.2. It can be seen
from this table that for pure PMMA, the experimental value of β (βexp)
is close to βSR showing the conduction of charge carriers mainly
through Schottky-Richardson mechanism [Deshmukh et al. 2007]. This
result fortifies the insulating character of PMMA with hardly any charge
carriers present in pure PMMA and the observed current is due to the
charge carriers injected from electrodes only on the application of the
field. The effect of application of the field is the reduction in the barrier
at the polymer-metal interface and charges are migrated in the matrix
by crossing the barrier. After adding 0.4% by weight of PAni.DBSA in
PMMA, an increase in the value of βexp is observed but remains closer
to βSR. This shows that at such small concentrations, charge carriers

Chapter-3: PMMA-PAni (acid doped) Blends
89
induced due to embedding of PAni.DBSA are so less in number that
these are not able to dominate in the charge conduction and the major
role is played by the injected charges only. On increasing the
concentration of PAni.DBSA in PMMA (at 1% by weight), the increase
in of the value of βexp is retained but still rests close to βSR validating
the existence of Schottky-Richardson mechanism as dominating
mechanism for charge transportation in PMMA-PAni.DBSA blends.
Table-3.2: DC conductivity and values of β for PMMA and
PMMA-PAni.DBSA blends
Sample σdc (S/cm) βPF (eV)
(⨯10-5)
(
βSR (eV)
(⨯10-5)
βexp(eV)
(⨯10-5)
Pure PMMA 8.8⨯10-16
3.7
7
1.8
9
1.53
PMMA+0.4% PAni.DBSA 5.37⨯10-14 1.96
PMMA+1% PAni.DBSA 2.16⨯10-15 2.05
PMMA+2% PAni.DBSA 7.87⨯10-11 2.03
PMMA+6% PAni.DBSA 4.60⨯10-10 2.18
PMMA+10% PAni.DBSA 1.15⨯10-9 2.37
The increase in the value of βexp may be attributed to the
generation of charge transfer complexes (CTCs) in PMMA on blending
with PAni.DBSA due to which localized charge states are produced in
the matrix. Due to the presence of these localized states, the
component related to hopping of charge carriers through the matrix
starts playing a role in conduction. At the lower concentrations of
PAni.DBSA in blends, the conducting regions remain far apart resting
the wide barrier in between and hence, hopping of the charges is
difficult. Therefore, majority of the charge carriers responsible for
conduction are injected from the electrodes retaining the Schottky-
Richardson conduction mechanism as the dominating mechanism for
the transportation of charge carriers.
As the concentration of PAni.DBSA is further increased to 2% (by
weight) and above in blends, the increase in the value of βexp
Ph.D. Thesis: A.K. Tomar-2012
90
continues. This may be due to the reason that with increasing
concentrations, the conducting islands of PAni.DBSA come closer
favouring the charges to hop from one conducting region to another
increasing the interwell hopping and hence, the conduction. For 10%
by weight of PMMA-PAni.DBSA blends, βexp lies in between βSR and βPF,
but still nearer to βSR than βPF; thus, migration of charges can be
assumed to be through both the mechanisms simultaneously yet the
Schottky-Richardson mechanism dominates over the Poole-Frenkel
mechanism.
From the above discussion, it can be concluded that the migration
of the charge carriers, which is through Schottky-Richardson
conduction mechanism for pure PMMA and its blends with lower
concentration of PAni.DBSA also includes the conduction through
Poole-Frenkel mechanism as the concentration of PAni.DBSA is
increased in PMMA-PAni.DBSA blends.
3.2.5 Dielectric Measurements
To understand the dielectric behaviour of PMMA and its blends with
varying concentration of PAni.DBSA, the various dielectric parameters,
like dielectric constant, dielectric loss and ac conductivity have been
studied as a function of frequency of the applied electric field. In the
present section, these parameters are discussed one by one.
(a) Dielectric Constant and Dielectric Loss
Figures 3.11 and 3.12 show the frequency (75 kHz–5 MHz)
dependent variation in dielectric permittivity ℇ’ and dielectric loss ℇ’’,
respectively at room temperature for PMMA and PMMA-PAni.DBSA
blends at different concentration of PAni.DBSA. As shown in figure
3.11, a decrease in the value of ℇ’ with the increase in frequency has
been observed for pure PMMA and PMMA-PAni.DBSA blends. The
pronounced nature of dielectric permittivity in low frequency region is
attributed to the interfacial polarization (arises only when the phases
with different conductivities are present) and due to the electrode
effect (originates as a result of blockage of the charge at the

Chapter-3: PMMA-PAni (acid doped) Blends
91
electrode). This may also be credited to the tendency of induced
dipoles in polymeric samples to orient themselves in the direction of
applied field, when the frequency alteration is low [Mardare 2004]. The
observed decrease in ℇ’ with increase in frequency may be due to the
contribution of orientation relaxation of dipoles and conduction of
charge carriers at higher frequency [Dyre 1988]. This can be explained
on the basis of the fact that at high frequency, field reversal becomes
so fast that dipoles are unable to orient themselves with the field and
intrawell hopping probability of charge carriers dominates.
Figure 3.11: Variation of dielectric constant with frequency for PMMA
and PMMA-PAni.DBSA blends
As also depicted from figure 3.11 that with the increase in
concentration of PAni.DBSA (curves ‘b–f’), the value of ℇ’ decreases in
complete frequency range. It is well known that the doped PAni system
contains two types of charged species, i.e. polaron/bipolaron system
and bound charges (dipoles). The polaron/bipolaron system is mobile
and free to move along the chain, while dipoles have only restricted
Ph.D. Thesis: A.K. Tomar-2012
92
mobility and account for strong polarization in the system. Thus, the
presence of conducting islands of PAni.DBSA (charged species) in
insulating PMMA matrix is responsible for the enhanced conduction of
charge carriers (polaron/bipolaron and bound charges of PAni.DBSA)
through hopping in PMMA chains [Joo et al. 1998; Pinto et al. 2000;
Gmati et al. 2008; Afjal 2010].
When the filler (PAni.DBSA) content is low, mean distance between
the PAni.DBSA clusters is sufficiently large and conduction is restricted
by the presence of the dielectric matrix. However, by increasing the
conductive phase content, metallic islands get closer and a physical
path is formed through which the current can flow percolating the
whole system [Veluru et al. 2007], thus, supporting the observed
decrease in ℇ’ as the concentration of PAni.DBSA in PMMA increases.
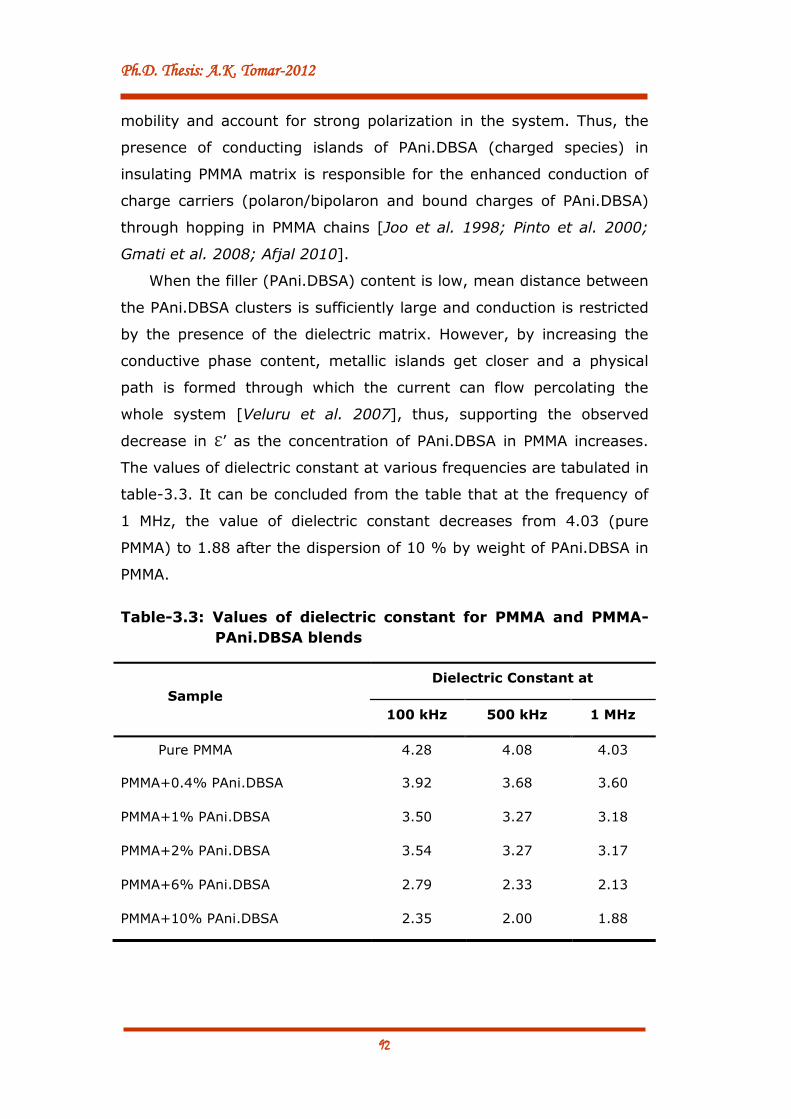
The values of dielectric constant at various frequencies are tabulated in
table-3.3. It can be concluded from the table that at the frequency of
1 MHz, the value of dielectric constant decreases from 4.03 (pure
PMMA) to 1.88 after the dispersion of 10 % by weight of PAni.DBSA in
PMMA.
Table-3.3: Values of dielectric constant for PMMA and PMMA-
PAni.DBSA blends
Sample
Dielectric Constant at
100 kHz 500 kHz 1 MHz
Pure PMMA 4.28 4.08 4.03
PMMA+0.4% PAni.DBSA 3.92 3.68 3.60
PMMA+1% PAni.DBSA 3.50 3.27 3.18
PMMA+2% PAni.DBSA 3.54 3.27 3.17
PMMA+6% PAni.DBSA 2.79 2.33 2.13
PMMA+10% PAni.DBSA 2.35 2.00 1.88
Chapter-3: PMMA-PAni (acid doped) Blends
93
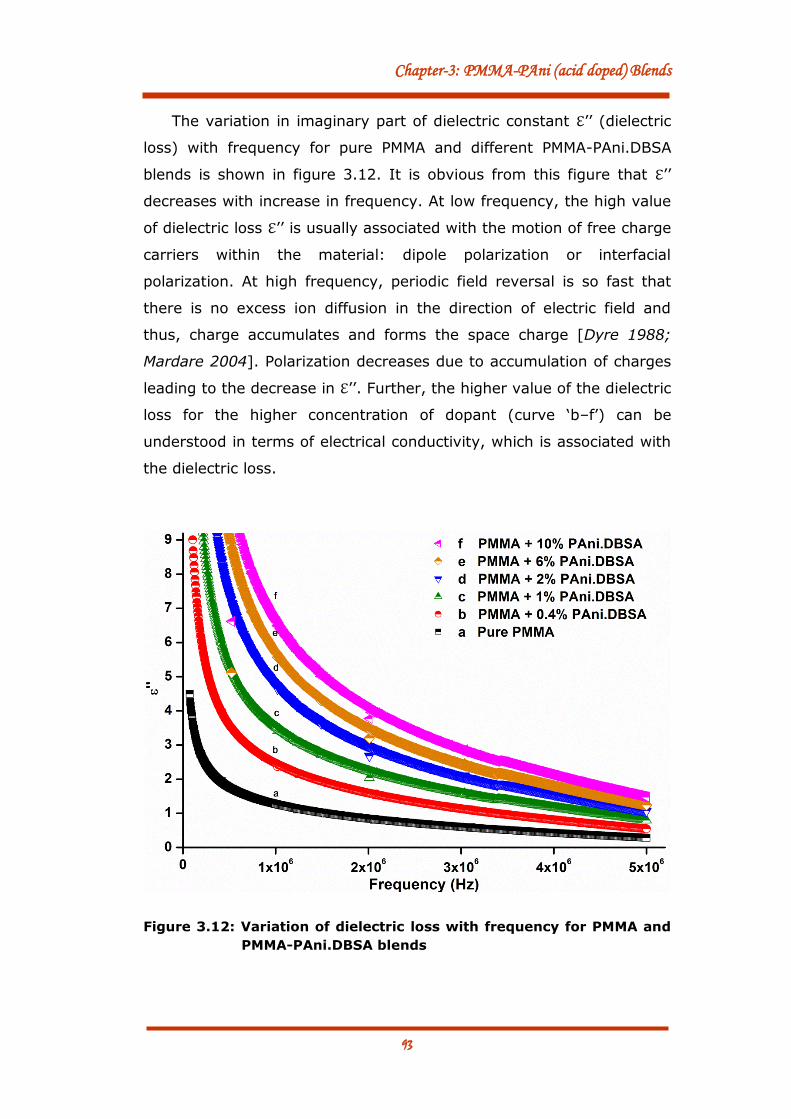
The variation in imaginary part of dielectric constant ℇ’’ (dielectric
loss) with frequency for pure PMMA and different PMMA-PAni.DBSA
blends is shown in figure 3.12. It is obvious from this figure that ℇ’’
decreases with increase in frequency. At low frequency, the high value
of dielectric loss ℇ’’ is usually associated with the motion of free charge
carriers within the material: dipole polarization or interfacial
polarization. At high frequency, periodic field reversal is so fast that
there is no excess ion diffusion in the direction of electric field and
thus, charge accumulates and forms the space charge [Dyre 1988;
Mardare 2004]. Polarization decreases due to accumulation of charges
leading to the decrease in ℇ’’. Further, the higher value of the dielectric
loss for the higher concentration of dopant (curve ‘b–f’) can be
understood in terms of electrical conductivity, which is associated with
the dielectric loss.
Figure 3.12: Variation of dielectric loss with frequency for PMMA and
PMMA-PAni.DBSA blends

Ph.D. Thesis: A.K. Tomar-2012
94
(b) AC Conductivity
Figure 3.13 represents the variation in ac conductivity (σac) for
pure PMMA and PMMA-PAni.DBSA blends. It is observable from this
figure that the value of σac increases up to 2 weight % of PAni.DBSA at
different frequencies. This is in accordance with the Random free
energy barrier (RFEB) model [Dyre 1988]. According to this model,
conductance is an increasing function of frequency in many disordered
solids, including polymers, which can be explained on the basis of any
hopping model. Thus, charge transport is through hopping from the
conductive islands of PAni.DBSA particles, which are distributed among
the insulating region of PMMA giving rise to increase in conductivity
with the increase in filler concentration.
Figure 3.13: Variation of ac conductivity with concentration of
PAni.DBSA in PMMA at different frequencies
Due to the fast reversal of applied time varying electric field,
dipoles remain polarized and the charge carriers are able to hop from
one dipolar conducting region to another, which is responsible for the
good conductivity of the PMMA-PAni.DBSA blends. As the percolation
threshold is obtained, the system changes its behaviour and ac
Chapter-3: PMMA-PAni (acid doped) Blends
95
conductivity becomes nearly uniform above percolation threshold, as
depicted from figure 3.13.
From the above discussion, it can be conferred that the
embedding of PAni.DBSA in PMMA results in the significant
changes in the optical, electrical and structural properties of
PMMA. Such a variation is found to be consistent with the
increase in concentration of PAni.DBSA in PMMA-PAni.DBSA
blends.
3.3 PMMA-PANI.CSA BLENDS
In the present section, results of the similar studies, as discussed
in Section-3.2 for PMMA-PAni.DBSA blends, have been presented for
PMMA on blending with PAni doped with another acid, i.e. CSA. For
this, same characterization tools and methods have been adopted as
those for PMMA-PAni.DBSA blends.
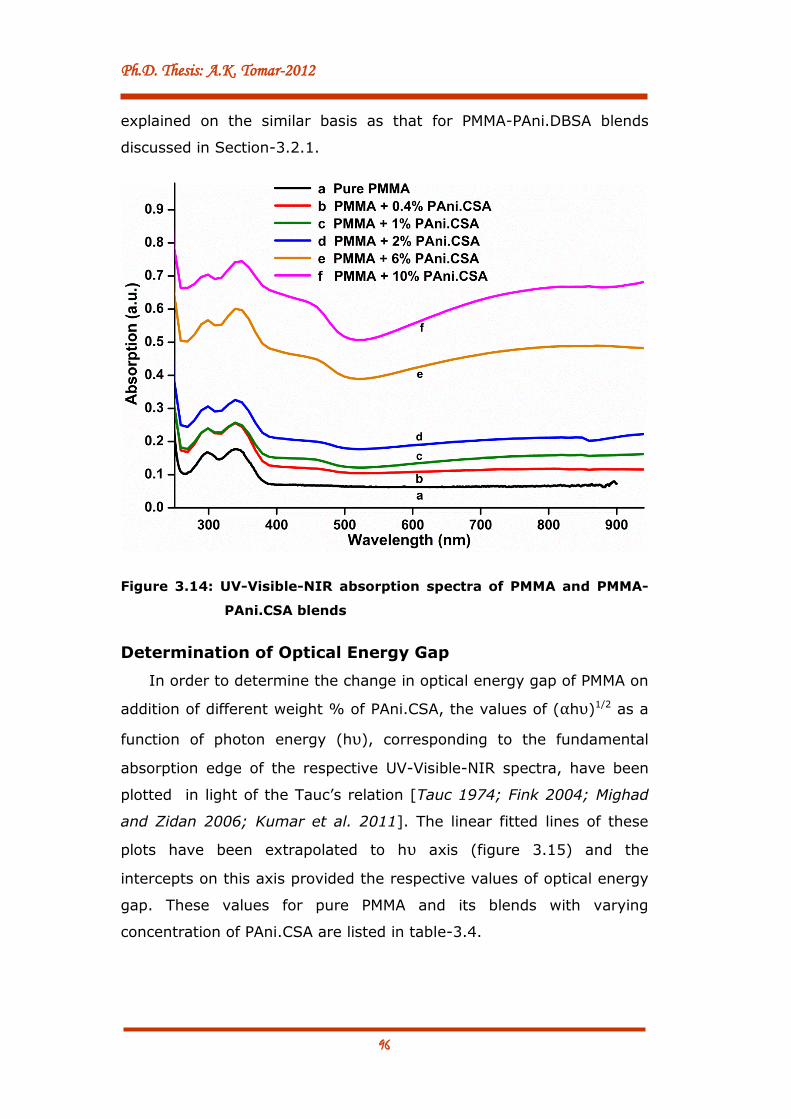
3.3.1 UV-Visible-NIR Absorption Studies
Figure 3.14 presents the UV-visible-NIR absorption spectra of
PMMA and its blends with different concentration (0.4, 1.0, 2.0, 6.0
and 10.0; % by weight) of PAni.CSA. Curve ‘a’ of this figure clearly
indicates the existence of two absorption peaks in UV-region, i.e. at
298 nm and 340 nm in PMMA, while it remains almost transparent in
complete visible region [Jin et al. 1992], as already discussed in
Section-3.2.1. On blending PMMA with PAni.CSA, two additional new
bands at around 449 nm and 829 nm become apparent at higher
concentrations (6% and 10% by weight) of PAni.CSA in PMMA. These
new bands correspond to π → π* transitions and polaron band
transitions, respectively of PAni.CSA [Ong et al. 1997; Mamunya et al.
2002; Laska 2004; Ebrahim et al. 2009; Wallace et al. 2009]. This
confirms the presence of PAni.CSA in PMMA-PAni.CSA blends.
Furthermore, a continuous shift towards the higher wavelengths in
the absorption edge corresponding to PMMA has been observed on
increasing the concentration of PAni.CSA in PMMA and may be
Ph.D. Thesis: A.K. Tomar-2012
96
explained on the similar basis as that for PMMA-PAni.DBSA blends
discussed in Section-3.2.1.
Figure 3.14: UV-Visible-NIR absorption spectra of PMMA and PMMA-
PAni.CSA blends
Determination of Optical Energy Gap
In order to determine the change in optical energy gap of PMMA on
addition of different weight % of PAni.CSA, the values of (αhυ)1/2 as a
function of photon energy (hυ), corresponding to the fundamental
absorption edge of the respective UV-Visible-NIR spectra, have been
plotted in light of the Tauc’s relation [Tauc 1974; Fink 2004; Mighad
and Zidan 2006; Kumar et al. 2011]. The linear fitted lines of these
plots have been extrapolated to hυ axis (figure 3.15) and the
intercepts on this axis provided the respective values of optical energy
gap. These values for pure PMMA and its blends with varying
concentration of PAni.CSA are listed in table-3.4.

Chapter-3: PMMA-PAni (acid doped) Blends
97
Figure 3.15: Plots to determine optical energy gap for PMMA and
PMMA-PAni.CSA blends
Table 3.4: Optical energy gap values for PMMA and PMMA-
PAni.CSA blends
Sample Optical Energy Gap (eV)
Pure PMMA 2.72 ± 0.02
PMMA+0.4% PAni.CSA 2.49 ± 0.01
PMMA+1% PAni.CSA 2.26 ± 0.01
PMMA+2% PAni.CSA 2.04 ± 0.02
PMMA+6% PAni.CSA 1.98 ± 0.01
PMMA+10% PAni.CSA 1.90 ± 0.03
Ph.D. Thesis: A.K. Tomar-2012
98
From the figure 3.15 and table-3.4, it is clear that the value of
optical energy gap, which comes out to be 2.72 eV for pure PMMA, has
been reduced continuously with increasing concentration of PAni.CSA
in PMMA and attains a value of 1.90 eV for 10% concentration by
weight of PAni.CSA. Such a reduction in the optical energy gap values
may be correlated to the induced structural rearrangements causing
generation of trap levels between HOMO and LUMO of PMMA on
blending it with different amount of PAni.CSA [Devi et al., 2002;
Mamunya et al. 2002; Laska 2004; Ebrahim et al. 2009], as already
explained in detail for PMMA-PAni.DBSA blends in Section-3.2.1.
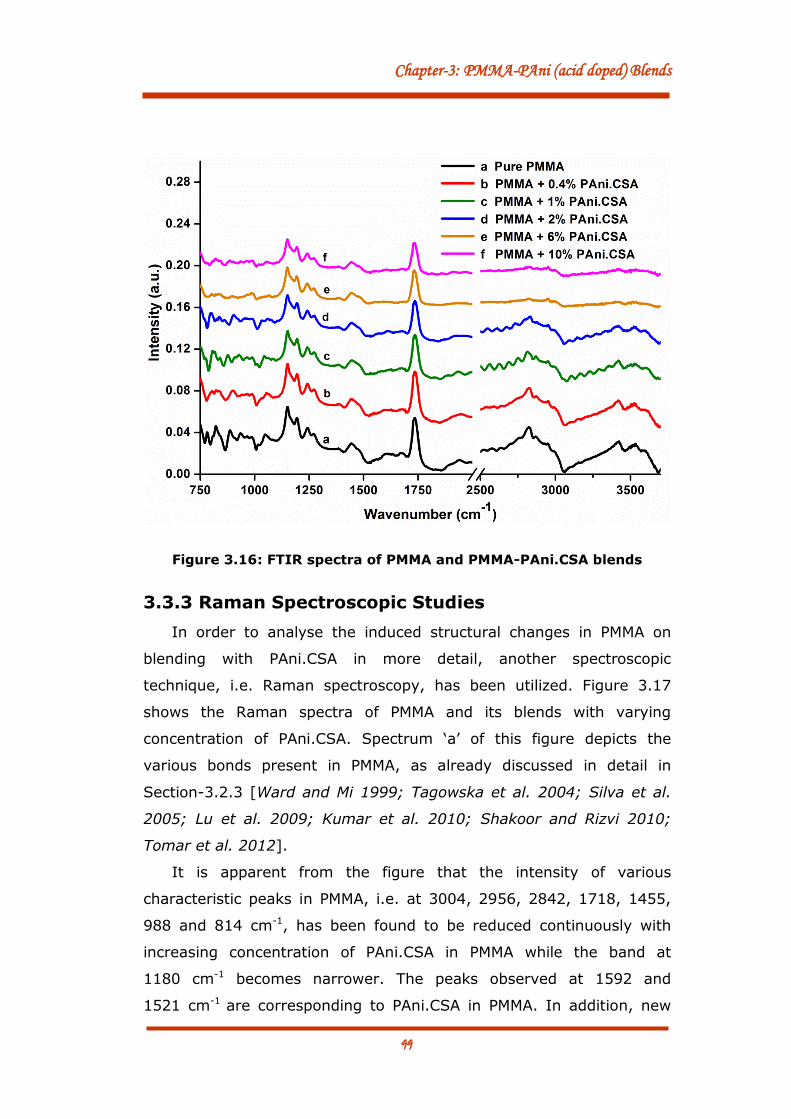
3.3.2 FTIR Spectroscopic Studies
FTIR spectroscopy has been utilized to gather the information
regarding the chemical rearrangements in PMMA on blending with
PAni.CSA at different concentrations. Figure 3.16 presents the FTIR
spectra for PMMA and different PMMA-PAni.CSA blends. Spectrum ‘a’ of
this figure shows the absorption corresponding to functional groups
present in pure PMMA, as already discussed in Section-3.2.2 [Jo et al.
1989; Balamurugan et al. 2004; Saikia and Kumar 2005; Wang et al.
2006; Chao et al. 2008; Khan et al. 2008; Shakoor et al. 2009;
Choudhury and Misra 2010; Tomar et al. 2011].
With the addition of PAni.CSA in PMMA, a continuous reduction in
the intensity of almost all the peaks with increasing concentration of
PAni.CSA in PMMA has been observed (spectra ‘b’ to ‘f’). Further,
almost complete elimination of the bands at wavenumbers above
2500 cm-1 has been observed for 6% and 10% by weight
concentration of PAni.CSA in PMMA. Such changes in the FTIR spectra
could be due to the screening produced by PAni.CSA particles within
the chains of PMMA and the formation of chemical bonding between
the functional groups of PMMA and PAni.CSA, resulting in the structural
rearrangements in PMMA chains.
Chapter-3: PMMA-PAni (acid doped) Blends
99
Figure 3.16: FTIR spectra of PMMA and PMMA-PAni.CSA blends
3.3.3 Raman Spectroscopic Studies
In order to analyse the induced structural changes in PMMA on
blending with PAni.CSA in more detail, another spectroscopic
technique, i.e. Raman spectroscopy, has been utilized. Figure 3.17
shows the Raman spectra of PMMA and its blends with varying
concentration of PAni.CSA. Spectrum ‘a’ of this figure depicts the
various bonds present in PMMA, as already discussed in detail in
Section-3.2.3 [Ward and Mi 1999; Tagowska et al. 2004; Silva et al.
2005; Lu et al. 2009; Kumar et al. 2010; Shakoor and Rizvi 2010;
Tomar et al. 2012].
It is apparent from the figure that the intensity of various
characteristic peaks in PMMA, i.e. at 3004, 2956, 2842, 1718, 1455,
988 and 814 cm-1, has been found to be reduced continuously with
increasing concentration of PAni.CSA in PMMA while the band at
1180 cm-1 becomes narrower. The peaks observed at 1592 and
1521 cm-1 are corresponding to PAni.CSA in PMMA. In addition, new

Ph.D. Thesis: A.K. Tomar-2012
100
peaks/bands at 2443, 1983, 1558 and 1045 cm-1 are observed to
emerge out due to formation of chemical conjugation of PAni.CSA with
PMMA. These new peaks are observable more clearly at higher
concentrations of PAni.CSA in PMMA (curve ‘c’-‘f’). In combination of
these changes, the presence of broad band at 2310-2556 cm-1 arises
due to overtones and combination bands in the chains of both
polymers. Further, increase in the area under this band with increasing
concentration of PAni.CSA in PMMA corroborates towards the increased
conjugation in the blends.
Figure 3.17: Raman spectra of PMMA and PMMA-PAni.CSA blends
The new peak originated at 1382 cm-1, as an effect of addition of
PAni.CSA in PMMA, may be assigned to the C-N+. stretching mode of
delocalized polaronic charge carriers. The increased intensity of this
peak is an indication towards the increased conductivity of blends with
increase in PAni.CSA content. Thus, the change in the spectrum of
pure PMMA and origination of new peaks/bands in PMMA-PAni.CSA
blends show the formation of new bonds between the PMMA and
PAni.CSA chains. Further, the increase in the intensity of peaks

Chapter-3: PMMA-PAni (acid doped) Blends
101
corresponding to these new bonds corroborates towards the increased
conjugation in PMMA-PAni.CSA blends with increase in concentration of
PAni.CSA in PMMA.
3.3.4 V-I Measurements
To determine the dc conductivity and charge conduction
mechanism in PMMA and PMMA-PAni.CSA blends, Voltage-Current
measurements were carried out in the voltage range 0-100 V and are
represented in figure 3.18. Similar trends in V-I characteristics as that
for PMMA-PAni.DBSA blends (Section-3.2.4) have been observed.
Figure 3.18: V-I characteristics of PMMA and PMMA-PAni.CSA blends
(a) DC Conductivity
DC conductivity (σdc) of PMMA-PAni.CSA blends at varying
concentration of PAni.CSA in PMMA have been determined following
the same procedure as that for PMMA-PAni.DBSA blends, discussed in
Section-3.2.4. The average values of conductivity in entire voltage
range (0-100 V) for PMMA and PMMA-PAni.CSA blends are appended in

Ph.D. Thesis: A.K. Tomar-2012
102
table-3.5. This table clearly indicates an increase in conductivity with
increasing concentration of PAni.CSA in PMMA.
The value of dc conductivity, which comes out to be
8.8⨯10-16 S/cm for pure PMMA changes to 1.97⨯10-10 S/cm, i.e. by
about 5 orders of magnitude, after embedding 10% by weight
concentration of PAni.CSA in PMMA. This may be attributed to the
formation of charge transfer complexes (CTCs) inside the polymer
matrix leading to the generation of traps in band gap [Kaiser et al.
2001; Amrithesh et al. 2008]. Due to this, interwell barrier strength
decreases and in turn, π-electron mobility through the chains increases
owing to increased tunnelling probability and finally, the dc
conductivity, as already discussed in Section-3.2.4 for PMMA-
PAni.DBSA blends.
(b) Charge Conduction Mechanism
Like that for PMMA-PAni.DBSA blends (figure 3.10), the linear
behaviour with positive slope of the plots between ln(I) and V1/2, as
presented in figure 3.19 for PMMA and PMMA-PAni.CSA blends,
endorse the applicability of Poole-Frenkel or Schottky-Richardson
mechanisms. From the slope of these plots, the values of βexp for PMMA
and PMMA-PAni.CSA blends have been determined and presented in
table-3.5 alongwith the values of β corresponding to Poole-Frenkel
(βPF) and Schottky-Richardson (βSR) mechanisms. The comparison of
the results presented in table-3.5 for PMMA-PAni.CSA blends with
those corresponding to PMMA-PAni.DBSA blends (table-3.2) clearly
indicates the similar conduction behaviour in both PMMA-PAni.DBSA
and PMMA-PAni.CSA blends. Therefore, the migration of the charge
carriers for pure PMMA and PMMA-PAni.CSA blends at lower
concentrations (upto 1% by weight) indicates the conduction through
Schottky-Richardson conduction mechanism while at higher
concentrations; the conduction mechanism may include the
contribution of Poole-Frenkel mechanism also.

Chapter-3: PMMA-PAni (acid doped) Blends
103
Figure 3.19: Plots of ln (I) versus V1/2 for PMMA and PMMA-PAni.CSA
blends.
Table-3.5: DC conductivity and values of β for PMMA and
PMMA-PAni.CSA blends
Sample σdc (S/cm) βPF (eV)
(⨯10-5)
βSR (eV)
(⨯10-5)
βexp(eV)
(⨯10-5)
Pure PMMA 8.80⨯10-16
3.7
7
1.8
9
1.53
PMMA+0.4% PAni.CSA 7.77⨯10-13 1.84
PMMA+1% PAni.CSA 2.21⨯10-12 1.92
PMMA+2% PAni.CSA 7.61⨯10-11 2.05
PMMA+6% PAni.CSA 1.78⨯10-10 2.21
PMMA+10% PAni.CSA 1.97⨯10-10 2.42

Ph.D. Thesis: A.K. Tomar-2012
104
3.3.5 Dielectric Measurements
In order to understand the dielectric behaviour of PMMA and
PMMA-PAni.CSA blends, dielectric measurements in the frequency
range 20 Hz to 1 MHz were carried out at room temperature. From the
recorded data, dielectric constant, dielectric loss and ac conductivity
have been determined as a function of frequency.
(a) Dielectric Constant and Dielectric Loss
Figure 3.20 presents the variation in dielectric constant (ℇ’) as a
function of frequency for PMMA and PMMA-PAni.CSA blends with
different concentration of PAni.CSA. It is evident from the figure that
at lower frequencies, the values of dielectric constant are quite higher
and reduce continuously with increase in frequencies. Further, a clear
cut decrease in dielectric constant with increase in the concentration of
PAni.CSA has been noticed at the same frequency. The values of
dielectric constant at different frequencies for PMMA-PAni.CSA blends
are also presented in table-3.6.
Figure 3.20: Variation of dielectric constant with frequency for PMMA
and PMMA-PAni.CSA blends

Chapter-3: PMMA-PAni (acid doped) Blends
105
Table-3.6: Values of dielectric constant for PMMA and PMMA-
PAni.CSA blends
Sample
Dielectric Constant at
100 kHz 500 kHz 1 MHz
Pure PMMA 4.57 4.19 4.06
PMMA+0.4% PAni.CSA 4.39 3.94 3.78
PMMA+1% PAni.CSA 4.13 3.53 3.31
PMMA+2% PAni.CSA 3.93 3.32 3.10
PMMA+6% PAni.CSA 2.81 2.34 2.17
PMMA+10% PAni.CSA 2.50 2.08 1.93
Figure 3.21 depicts the variation in dielectric loss (ℇ’’) with
frequency for pure PMMA and PMMA-PAni.CSA blends at varying
concentration of PAni.CSA. It is obvious from this figure that ℇ’’
decreases with increase in frequency.
Figure 3.21: Variation of dielectric loss with frequency for PMMA and
PMMA-PAni.CSA blends

Ph.D. Thesis: A.K. Tomar-2012
106
However, the values of dielectric loss at the same frequency
increase continuously with increase in concentration of PAni.CSA. The
observed behaviour of ℇ’ and ℇ’’ for PMMA-PAni.CSA blends is
consistent with that observed for PMMA-PAni.DBSA blends, as
presented in Section-3.2.5.
(b) AC Conductivity
Figure 3.22 represents the variation in ac conductivity (σac) plotted
as a function of the concentration of PAni.CSA in PMMA at different
frequencies. It is clearly observable from the figure that the value of ac
conductivity increases with increase in the concentration of PAni.CSA
for all frequencies. Moreover, increase in the conductivity is more
pronounced upto a concentration of 2% by weight of PAni.CSA in
PMMA; and at the higher concentrations, the increase is somewhat
slow and conductivity is almost uniform indicating the change in the
behaviour at the percolation threshold.
Figure 3.22: Variation of ac conductivity with concentration of
PAni.CSA in PMMA at different frequencies

Chapter-3: PMMA-PAni (acid doped) Blends
107
When the frequency of 1 MHz is attained, fast increase in the
conductivity has been observed. This may be due to the reason that in
the fast reversal of applied time varying electric field, dipoles remain
polarized and the charge carriers are able to hop from one dipolar
conducting region to another, which is responsible for the good
conductivity of the PMMA-PAni.CSA blends at higher frequencies.
From the above discussion, it is apparent that the similar trends
related to dielectric constant, dielectric loss and ac conductivity for
PMMA-PAni.CSA blends have been observed as those for PMMA-
PAni.DBSA blends. Therefore, the variation in the values of these
parameters for PMMA-PAni.CSA blends can be understood in the
similar manner as that explained in detail for PMMA-PAni.DBSA blends
(Section-3.2.5).
3.4 A RELATIVE COMPARISON
As already discussed in Section-3.2 and 3.3, in the present work, a
systematic study related to the variation in the optical, electrical and
structural properties of PMMA on blending with different concentration
of PAni.DBSA and PAni.CSA, respectively has been carried out. In this
section, a comparison of the induced changes in the properties of
PMMA, as an effect of embedding of PAni.DBSA and PAni.CSA, has
been made.
Figure 3.23 presents the variation in optical energy gap of PMMA
with increasing filler concentration of PAni.DBSA (curve ‘a’) and
PAni.CSA (curve ‘b’). It is clearly observable from the figure that there
exists a clear cut decrease in optical energy gap of PMMA with
increasing filler concentration. However, the effect is more pronounced
with about 34% reduction in optical energy gap after embedding
PAni.DBSA as compared to about 30% for PAni.CSA, at the maximum
filler concentration of 10% by weight in both cases. As far as the dc
electrical conductivity is concerned, as shown in figure 3.24, the same
is found to be increased significantly with increasing filler concentration
in PMMA by about 6 orders of magnitude for PAni.DBSA and by about

Ph.D. Thesis: A.K. Tomar-2012
108
5 orders of magnitude for PAni.CSA at same concentration of 10% by
weight.
Figure 3.23: Variation of optical energy gap versus concentration of
PAni.DBSA/PAni.CSA in PMMA
Figure 3.24: Variation in dc conductivity versus concentration of
PAni.DBSA/PAni.CSA in PMMA

Chapter-3: PMMA-PAni (acid doped) Blends
109
The more pronounced effects in optical and conductivity
behaviour of PMMA-PAni.DBSA as compared to PMMA-PAni.CSA
blends are well explained on the basis of induced structural
rearrangements, being more prominent in case of PAni.DBSA,
as revealed through FTIR and Raman spectroscopy. The above
results seem to consider PMMA-PAni.DBSA as the better
material for fabrication of electronic and opto-electronic
devices than PMMA-PAni.CSA.
Regarding dielectric behaviour of PMMA-PAni.DBSA and PMMA-
PAni.CSA composites at different filler concentrations, as shown in
table-3.7, no significant change in the values of dielectric constant, on
embedding PAni.DBSA and PAni.CSA at same concentration, has been
observed. However, the increase in dielectric loss is more pronounced
in PAni.DBSA as compared to PAni.CSA. This trend indicates PMMA-
PAni.CSA to be a better dielectric material in comparison to PMMA-
PAni.DBSA.
Table-3.7: Comparison of frequency dependant electrical
parameters for blends of PAni.DBSA/PAni.CSA with
PMMA (at 1 MHz frequency)
PAni content in
PMMA
(% by weight)
Dielectric Constant Dielectric Loss
PAni. DBSA PAni. CSA PAni. DBSA PAni. CSA
0 4.03 4.06 1.21 1.21
0.4 3.60 3.78 2.40 1.23
1 3.18 3.31 3.43 1.35
2 3.17 3.10 4.61 1.63
6 2.13 2.17 5.51 1.97
10 1.88 1.93 6.61 2.16
Ph.D. Thesis: A.K. Tomar-2012
110
From the above, it is apparent that considerable reduction
in optical energy gap, significantly large increase in
conductivity, decrease in dielectric constant and increase in
dielectric loss have been observed on blending PMMA with
PAni.DBSA/PAni.CSA with increasing concentrations.
CONCLUSION
Blending of PAni (acid doped) with PMMA produces a continuous
change in optical, electrical and structural properties of this polymer
with increasing filler concentration. About 34% reduction in optical
energy gap, by about 6 orders of magnitude enhancement in dc
conductivity and considerably large variation in dielectric parameters
have been perceived at 10% concentration by weight of the embedded
PAni.DBSA in PMMA. Similar trends, although slightly less pronounced,
in PMMA-PAni.CSA blends have been observed.

Chapter-3: PMMA-PAni (acid doped) Blends
111
REFERENCES Afzal A.B., Akhtar M.J., Nadeem M., Ahmad M., Hassan M.M., Yasin T.,
Mehmood M., “Structural and electrical properties of
polyaniline/silver nanocomposites”, J. Phys. D: Appl. Phys. 42
(2009) 015411.
Afzal A.B., Akhtar M.J., Nadeem M., Hassan M.M., “Dielectric and
impedance studies of DBSA doped polyaniline/PVC composites”,
Current Applied Physics 10 (2010) 601.
Ameen S., Ali V., Zulfequar M., Haq M.M., Husain M., “Electrical and
spectroscopic characterization of polyaniline–polyvinyl chloride
(PANI–PVC) blends doped with sodium thiosulphate”, Physica B:
Condens. Matter 403 (2008) 2861.
Amrithesh M., Aravind S., Jayalekshmi S., Jayasree R.S., “Enhanced
luminescence in Polyaniline-Poly(methyl methacrylate)
composites”, J. Alloys Comp. 449 (2008) 176.
Araujo P.L.B., Araujo E.S., Santos R.F.S. and Pacheco A.P.L., “Synthesis and
morphological characterization of PMMA/Polyaniline nanofiber
composites”, Microelect. J. 36 (2005) 1055.
Balamurugan A., Kannan S., Selvaraj V., and Rajeswari S., “Development
and Spectral Characterization of Poly(Methyl Methacrylate)
/Hydroxyapatite Composite for Biomedical Applications”, Trends
Biomater. Artif. Organs 18 (2004) 41.
Bellamy L.J., “The Infra-red Spectra of Complex Molecules”, Richard
Clay, Bungay, Suffolk (1962).
Bhat N.V., Sheshadri D.T., Phadke R.S., “Simultaneous polymerization
and crystallization of aniline”, Synth. Met. 130 (2002) 285.
Blythe A.R., “Electrical Properties of Polymers”, Cambridge University
Press, Cambridge (1979).
Blythe A.R., “Electrical Resistivity Measurements of Polymer Materials”,
Polymer Testing 4 (1984) 195.
Blythe T. and Bloor D., “Electrical Properties of Polymers”, Cambridge
University Press, New York, USA (2005).
Boudenne A., Ibos L., Candau Y., Thomas S., “Handbook of Multiphase
Polymer Systems: Vol. 1”, John Wiley & Sons Ltd., West Sussex,
United Kingdom (2011).
Boyer M.I., Quillard S., Rebourt E., Louarn G., Buisson J.P., Monkman A.,
Lefrant S., “Vibrational Analysis of Polyaniline: A Model
Compound Approach”, J. Phys. Chem. B 102 (1998) 7382.

Ph.D. Thesis: A.K. Tomar-2012
112
Boyer M.L., Quillard S., Louarn G., Froyer G., Lefrant S., “Vibrational Study
of the FeCl3-Doped Dimer of Polyaniline; A Good Model
Compound of Emeraldine Salt”, J. Phys. Chem. B 104 (2000) 8952.
Cao Y., Smith P., Heeger A.J., “Spectroscopic studies of Polyanilinein
solution and in spin cast films”, Synth. Met. 32 (1989) 263.
Chao L., Huang Y.J., Han Y.K., Tseng P.H., Hsieh T.H., Lin C.M. and Ho K.S.,
“Shearing Effects on the Conducting Polymer Blends”, Polym.
Bull. 60 (2008) 847.
Choudhury T. and Misra N.M., “Thermal stability of PMMA–clay hybrids”,
Bull. Mater. Sci. 33 (2010) 165.
Colomban P.A., Cruger A., Novak A., Regis A., “Infrared and Raman study
of polyaniline Part I. Hydrogen bonding and electronic mobility
in emeraldine salts”, J. Mol. Struct. 317 (1994) 261.
Deshmukh S.H., Burghate D.K., Akhare V.P., Deogaonkar V.S., Deshmukh
P.T. and Deshmukh M.S., “Electrical Conductivity of Polyaniline
Doped PVC–PMMA Polymer Blends”, Bull. Mater. Sci. 30 (2007) 51.
Devi C.U., Sharma A.K. and Rao V.V.R.N., “Electrical and Optical
Properties of Pure and Silver Nitrate-Doped Polyvinyl Alcohol
Films”, Mater. Lett. 56 (2002) 167.
Dhawan S.K., Singh N., Rodrigues D., “Electromagnetic shielding
behaviour of conducting Polyaniline composites”, Sci. Tech. Adv.
Mater. 4 (2003) 105.
Dissado L.A. and Fothergill J.C., “Electrical degradation and breakdown in
polymers”, Peter Peregrinus Ltd, UK (1992).
Dyre J.C., “The random free‐energy barrier model for ac conduction in
disordered solids”, J. Appl. Phys. 64 (1988) 2456.
Ebrahim S., Kashyout A.H., Soliman M., “Ac and Dc conductivities of
polyaniline/poly vinyl formal blend films”, Current Applied Physics
9 (2009) 448.
Epstein A.J., “Electrically conducting polymers: Science and
Technology”, MRS Bulletin (June 1997) 16.
Epstein A.J., Ginder J.M., Zuo F., Bigelow R.W., Woo H.S., Tanner D.B.,
Richter A.F., Huang W.S., MacDiarmid A.G., “Insulator-to-metal
transition in Polyaniline”, Synth. Met. 18 (1987) 303.
Fink D. (Ed.), “Fundamentals of Ion-Irradiated Polymers”, Springer-
Verlag, Berlin, Heidelberg (2004).
Chapter-3: PMMA-PAni (acid doped) Blends
113
Gmati F., Fattoum A., Bohli N., Mohamed A.B., “Effects of the molar mass
of the matrix on electrical properties, structure and morphology
of plasticized PANI–PMMA blends”, J. Phys.: condens. Matter 20
(2008) 125221.
Hasik M., Paluszkiewicz C., Wenda E., “Interactions between polyanilines
and platinum(IV) ions: vibrational spectroscopic studies”, Vib.
Spectrosc. 29 (2002) 191.
Ikkala O.T., Pietila l.O., Ahjopado L., Osterholm H., Passiniemi J., “On the
molecular recognition and associations between electrically
conducting polyaniline and solvents”, J. Chem. Phys. 103 (1995)
9855.
Jachym B. (Ed. E.K. Sichel), “Carbon Black Polymer Composites”, Marcel
Dekker Inc., New York (1982).
Jain S.C., Willander M., Kumar V., “Conducting Organic Materials and
Devices: Semiconductors and Semimetals, Volume 81”,
Academic Press, London, UK (2007).
Jin S., Tiefel T.H., Wolfe R., Sherwood Jr. R.C., Mottine J.J., “Optically
Transparent, Electrically Conductive Composite Medium”,
Science 255 (1992) 446.
Jo W.H., Cruz C.A., Paul D.R., “FTIR investigation of interactions in
blends of PMMA with a styrene/acrylic acid copolymer and their
analogs”, Journal of Polymer Science Part B: Polymer Physics 27
(1989) 1057.
Joo J., Long S.M., Pouget J.P., Oh E.J., MacDiarmid A.G., Epstein A.J.,
“Charge transport of the mesoscopic metallic state in partially
crystalline polyanilines”, Phys. Rev. B 57 (1998) 9567.
Kaiser A.B., “Electronic transport properties of conducting polymers
and carbon nanotubes”, Rep. Prog. Phys. 64 (2001) 1.
Kang E.T., Neoh K.G. and Tan K.L., “Polyaniline: A polymer with many
interesting intrinsic redox states”, Prog. Polym. Sci. 23 (1998)
277.
Khan M.S., Qazi R.A. and Wahid M.S., “Miscibility studies of PVC/PMMA
and PS/PMMA blends by dilute solution viscometry and FTIR”,
African Journal of Pure and Applied Chemistry 2 (2008) 041.
Kim Y.H., Foster C., Chiang J., Heeger A.J., “Photoinduced localized
charged excitations in Polyaniline”, Synth. Met. 26 (1988) 49.

Ph.D. Thesis: A.K. Tomar-2012
114
Kohlman R.S., Zibold A., Tanner D.B., Ihas G.G., Ishiguro T., Min Y.G.,
MacDiarmid A.G., Epstein A.J., “Limits for metallic conductivity in
conducting polymers”, Phys. Rev. Lett. 78 (1997) 3915.
Kumar S., Sharma A., Tripathi B., Srivastava S., Agrawal S., Singh M.,
Awasthi K., Vijay Y.K., “Enhancement of hydrogen gas
permeability in electrically aligned MWCNT-PMMA composite
membranes”, Micron 41 (2010) 909.
Kumar V., Goyal P.K., Mahendia S., Gupta R., Sharma T. and Kumar S.,
“Tuning of Refractive Index and Optical Band Gap of CR-39
Polymer by Heating”, Rad. Eff. Def. Solids 166 (2011) 109.
Laska J., “Conformations of polyaniline in polymer blends”, J. Mole.
Struc. 701 (2004) 13.
Lu Z., Wang J., Li Q., Chen L., Chen S., “Controllable synthesis of
nanosilica surface-grafted PMMA macromonomers via catalytic
chain transfer polymerization”, Eur. Poly. J. 45 (2009) 1072.
Malmonge L.F., Lopes G.D.A., Langiano S.D.C., Malmonge J.A., Cordeiro
J.M.M., Mattoso L.H.C., “A new route to obtain PVDF/PAni
conducting blends” Eur. Poly. J. 42 (2006) 3108.
Mamunya Y., Muzychenko W., Pissis P., Lebedev E., Shut M., “Percolation
phenomena in polymers containing dispersed iron”, Polym. Eng.
Sci. 42 (2002) 90.
Mardare D. and Rusu G.I., “Comparison of the Dielectric Properties For
Doped and Undoped TiO2 Thin Films”, J. Optoelectron. & Adv.
Mater. 6 (2004) 333.
Masters J.G., Sun Y., Macdiarmid A.G., Epstein A.J., “Polyaniline: allowed
oxidation states”, Synth. Met. 41 (1991) 715.
Migahed M.D. and Zidan H.M., “Influence of UV-Irradiation On The
Structure and Optical Properties of Polycarbonate Films”, Curr.
App. Phys. 6 (2006) 91.
Neoh K.G., Kang E.T., Tan K.L., “Evolution of polyaniline structure during
synthesis”, Polymer 34 (1993) 3921.
Ong C.H., Goh S.H. and Chan H.S.O., “Conductive Polyaniline/Poly(vinyl
phosphonic acid) blends”, Polym. Bull. 39 (1997) 627.
Ping Z., “In situ FTIR–attenuated total reflection spectroscopic
investigations on the base–acid transitions of polyaniline.
Base–acid transition in the emeraldine form of Polyaniline”, J.
Chem. Soc., Faraday Trans. 92 (1996) 3063.
Chapter-3: PMMA-PAni (acid doped) Blends
115
Pinto N.J., A.A. Acosta, G.P. Sinha, F.M. Aliev, “Dielectric permittivity
study on weakly doped conducting polymers based on
polyaniline and its derivatives”, Synth. Met. 113 (2000) 77.
Saikia D. and Kumar A., “Ionic transport in P(VDF-HFP)–PMMA–
LiCF3SO3–(PC+DEC)–SiO2 composite gel polymer electrolyte”,
Eur Polym J. 41 (2005) 563.
Shakoor A. and Rizvi T.Z., “Raman spectroscopy of conducting
poly(methylmethacrylate)/Polyaniline-dodecylbenzene sulfonic
acid blends”, J. Raman Spectrosc., 41 (2010) 237.
Shakoor A., Rizvi T.Z., and Anwar H., “Morphological, Thermal, and
Conductivity Studies of Poly(methyl methacrylate)/Polyaniline
Dodecylbenzenesulfonate Blends”, Polymer Science 51 (2009) 898.
Silva J.E.P.d., Temperini M.L.A. and Torresi S.I.C.d., “Characterization of
Conducting Polyaniline Blends by Resonance Raman
Spectroscopy”, J. Braz. Chem. Soc. 16 (2005) 322.
Socrates G., “Infrared and Raman Characteristic Group Frequencies”,
John Wiley, New York (2001).
Sze S.M., “Physics of Semiconductor Devices”, John Wiley and Sons
(ASIA) Pvt. Ltd., Singapur (2004).
Tagowska M., Pałys B., Jackowska K., “Polyaniline nanotubules—anion
effect on conformation and oxidation state of polyaniline
studied by Raman spectroscopy”, Synth. Met. 142 (2004) 223.
Tauc, “Amorphous and Liquid Semiconductors”, Plenum Press, (1974).
Tomar A.K., Mahendia S. and Kumar S., “Structural characterization of
PMMA blended with chemically synthesized PAni”, Advances in
Applied Science Research 2 (2011) 327.
Tomar A.K., Mahendia S., Chahal R.P., Kumar S., “Structural and dielectric
spectroscopic studies of polyaniline–poly(methyl methacrylate)
composite films”, Synth. Met. 162 (2012) 820.
Trchová M. and Stejskal J., “Polyaniline: The infrared spectroscopy of
conducting polymer nanotubes (IUPAC Technical Report)”, Pure
Appl. Chem. 83 (2011) 1803.
Veluru J.B., Satheesh K.K., Trivedi D.C., Ramakrishna M.V., Srinivasan N.T.,
“Electrical properties of electrospun fibers of PANI-PMMA
composites”, J. Engg. Fibers Febr. 2 (2007) 25.
Vien D.L., Colthup N.B., Fateley W.G., Grasselli J.G., “The Handbook of
Infrared and Raman Characteristic Frequencies of Organic
Molecules”, Academic Press, San Diego (1991).
Ph.D. Thesis: A.K. Tomar-2012
116
Wallace G.G., Spinks G.M., Maguire L.A.P.K., Teasdale P.R., “CONDUCTIVE
ELECTROACTIVE POLYMERS-Intelligent Polymer Systems” CRC
Press, Taylor & Francis Group, Boca Raton, FL (2009).
Wang H., Xu P., Meng S., Zhong W., Du W., Du Q., “Poly(methyl
methacrylate)/silica/titania ternary nanocomposites with
greatly improved thermal and ultraviolet-shielding properties”,
Polymer Degradation and Stability 91 (2006) 1455.
Ward Y. and Mi Y., “The study of miscibility and phase behaviour of
phenoxy blends using Raman spectroscopy”, Polymer 40 (1999)
2465.