pmj automec annual report 1998 · however, pmj’s higher profile has made it easier to attract new...
TRANSCRIPT

Completing the line. Worldwide.
A N N U A L R E P O R T 1 9 9 8
1The year in brief2-3President’s review4-5PMJ’s operations6-7Personnel and research anddevelopment8-15Reviews of the customer businesses16-39Financial statements
16-18Report of the board of directors19Group income statement20-21Group balance sheet22Group fund statement23Parent company income statement24-25Parent company balance sheet26Parent company fund statement27Accounting principles28-33Notes to the financial statements34Key figures35Calculation of key figures36Key figures in euro37Income statement in euro38-39Balance sheet in euro
40Proposal of the board of directors andauditor’s report41Board of directors and managementgroup42-43Shares and shareholders44News in brief45Product list and glossaryContact information
PMJ automec Corporation designs, manufactures
and sells production automation equipment to the
electronics industry. PMJ’s modular production
cells and PCB handling equipment offer flexible
solutions to the needs of customers in different
sectors of the electronics industry and boost the
competitiveness of client companies by increasing
productivity, improving the quality of products
and shortening production throughput times.
ContentsBusiness idea
PMJ makes great outlays on its personnel to ensure that they are profes-sional and motivated in the pursuit of the company’s common goals.The photo shows PMJ’s rowing team competing in Lohja’s Lake Daysrace.

1
page
January• The share capital was increased to FIM
9,378,900 through a bonus issue.
February• The company acquired a majority holding
in Global Integration Inc., an Adept integrator based in Dallas. Its name was changedto PMJ automec USA, Inc.
• PMJ automec (UK) Ltd. was acquired as aGroup company.
March• PMJ decided to apply for listing on the
OTC list maintained by HEX HelsinkiExchanges, to issue new shares and togrant share options to key personnel.
April• The share offering and sale of shares
began on April 20, 1998. The share offe-ring for institutional and retail investors wasclosed on the same day due to oversubscription. The employee offering conti-nued until April 27, 1998.
• A partnership agreement was made withthe German company Siemens ElectronicAssembly Systems.
May• The share capital was increased from
FIM 9,378,900 to FIM 12,378,900.
• The company’s shares were quoted forthe first time on HEX Helsinki Exchanges’OTC list on May 15, 1998.
June• The company received orders worth FIM
22 million.
August• Orders worth about FIM 50 million came in
from different parts of Europe and theUnited States, including the first ordersfrom companies in the consumer electronics sector, such as the DanishBang&Olufsen.
November 1998• Major additional orders totalling over FIM
10 million were placed by Osram andMotorola.
December 1998• Nokia ordered a final assembly line worth
about FIM 7 million.
• PMJ made a collaboration agreement withthe French telecommunications companyAlcatel.
Major events
94 95 96 97 98
2.5
8.0
5.24.5
11.7
25.8
51.061.7
71.2
128.1
94 95 96 97 98
1998 1997 annualchange, %
Turnover FIM million 128.1 71.2 80
International sales FIM million 105.3 48.5 117
Operating profit FIM million 11.7 4.5 160
Earnings per share FIM 1.96 0.27 626
Equity ratio, % 59.1 35.5 23.6
Capital expenditures FIM million 10.4 8.7 20
R&D expenditures FIM million 7.3 4.1 78
Personnel, average FIM million 151 97 56
Key figures
The year in brief
Operating profit 1994-1998,FIM million
Turnover 1994-1998,FIM million
Turnover by business area Turnover by market area
General business 7%
Automotive electronics 6%
Contract manufacturing 12%
General electronics 16%
Telecommunications 59%
Finland 18%
Scandinavia 25%
Europe 36%
North America 21%
Interim reports in 1999
PMJ will publish interim reports for the January - Aprilperiod on June 10th, 1999 and for the January - Augustperiod on October 7th, 1999.

2
page
2
page

3
page
grows, they will pay much more atten-
tion to upgrading the efficiency of end-
of-line production operations, some-
thing which has traditionally been per-
formed manually. This will open up even
more business prospects for us. The au-
tomated final assembly operation will
become more widespread – this will oc-
cur at a rapid pace – as will automation
in general.
One of the increasing trends we have
noted is that, now our company has
grown, our customers are placing more
orders for entire production lines instead
of individual production cells. This al-
lows us to replicate production series
and to achieve volume benefits.
The objectives PMJ has set for itself in
1999 are: increased turnover, improved
profitability and internal efficiency.
I would like thank all our shareholders
for their cooperation during the year
now ended. PMJ will, in my view, con-
tinue to grow and become even more
profitable by following its chosen mode
of operations.
Markku Jokela
In 1998, our company kept on growing
buoyantly and become even more glo-
bal. The share of turnover accounted for
by exports grew further, rising to 82%.
During the year just ended, PMJ has
made a breakthrough in continental
Europe, which was previously viewed as
a somewhat difficult market area.
Our marketing efforts in Germany
began to bear fruit, landing us new cus-
tomers and opening up new areas; our
customer companies include Miele, a
consumer electronics manufacturer, and
Vossloh-Schwabe, a residential electron-
ics company, to name but two.
In our other European market areas –
the UK and Scandinavia – we consolidat-
ed our position further by strengthening
our cooperation with customers. Conti-
nental Europe emerged as PMJ’s largest
market area. We ventured into Italy and
France for the first time this year, among
our new customers is the telecommuni-
cations company Alcatel. We will deliver
production lines to their facility at Laval
at the beginning of 1999. In order to
ensure that maintenance services are
available locally, we have already hired
the first employees for our office cur-
rently being set up in France at the begin-
ning of 1999.
In 1998, the United States became a
more important market area for PMJ,
with its share of turnover rising to 21%;
in comparison, this figure had been 7%
after six months of operations in the US
President’sreview
in 1997. PMJ automec USA Inc’s new
major customers include e.g. SCI which
is one of the largest contract manufac-
turers in the world.
At the beginning of 1998, we acquired
a majority holding in our American as-
sociated company Global Integration
Inc., to ensure the availability of local
maintenance services for our customers
in the United States. Our sales subsidiary
and the formerly associated co. were
merged together and named PMJ au-
tomec USA, Inc. During the report year,
it turned out to be necessary to reorga-
nise the operations of the US subsidiary,
and this was seen to completion at the
end of 1998, when the entire capital
stock of the subsidiary was purchased,
and its functions in areas other than the
electronics industry were sold to the
company owned by its former managing
director.
At the end of the present year, PMJ
intends to expand its operations into the
Far East.
Outlook for the future
The favourable outlook for the devel-
opment of the market makes up a good
foundation for continuing vigorous
growth. We will keep on investing in
R&D, so as to add variety to our product
range. As the degree of automation in the
production operations of our customers
Operations in 1998 were characterized by major investments in the development oftechnology and personnel. PMJ’s development drives were extremely successful. Thephoto shows PMJ automec Corporation’s president and Board of Directors.

4
page
PMJ specialises in end-of-the-line auto-
mation for the electronics industry – that
phase of the production process which is
still largely carried out manually. Front-
of-line assembly is highly automated,
and there are many companies compet-
ing for a slice of the front-of-line market.
However, the market for end-of-line as-
sembly is just taking shape, and PMJ is
an aggressive player in the development
of end-of-line automation concepts.
End-of-line assembly has remained
manual the longest because it is at this
stage of the production process where
the largest, most variously shaped and
hard-to-handle components are assem-
bled. As a result of its long-term R&D
efforts, PMJ has developed a modular
PMJ’s
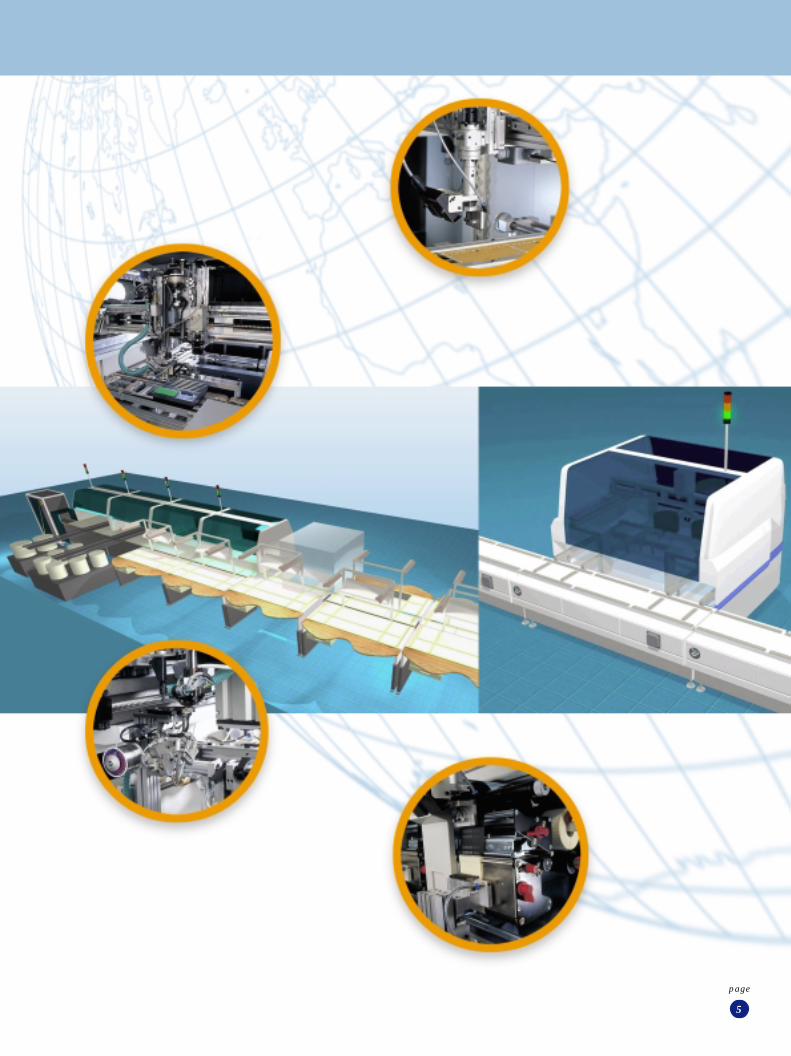
PMJ automec Corporation manufactures production automation equip-ment for the electronics industry, and is the leading company in its mar-ket niche. Its products are employed to upgrade the efficiency of itsclient companies’ production operations. In a rapidly growing market,PMJ helps its customers to stay in the race.
solution for assembling and handling
these odd-form components: the
HiSAC® (High Speed Assembly Cell)
production cell.
HiSAC® cells can be classified into the
following main types according to the
tasks they perform: assembly, soldering,
depaneling, labeling, testing, multifunc-
tion and final assembly cells. The cells
are all in-line production equipment,
which can be integrated into an auto-
matic production line with different
types of PCB han-dling devices. PMJ’s
production equipment can be modified
flexibly to suit customers’ requirements
and fitted with the applications needed
in the assembly of their products. PMJ’s
product range is complemented by PCB
handling devices, which enable the com-
pany to offer comprehensive automa-
tion solutions for customers’ production
problems.
PMJ has sought to build up a wide
customer base consisting of companies
in different industries, so as not to be-
come too dependent on individual in-
dustry sectors or customers. At present,
the customer base comprises mainly of
companies in the telecommunications,
electronics contract manufacturing, in-
formation technology, automotive elec-
tronics and residential electronics indus-
tries. Naturally enough, the rapidly
growing telecommunications industry
accounts for a major part of PMJ’s sales,
but even the two largest customer
groups in this industry combined do not
account for more than 45% of the sales
figures.
PMJ’s clientele is very international as
exports account for 82% of the turno-
ver.
The company’s production operations
are presently concentrated in Finland,
where its premises doubled after addi-
tional production space was rented in
the Lohja region.
PMJ’s operations are based on R&D
that takes its direction from customers’
needs. The outlays on R&D are consid-
erable, in view of the size of the compa-
ny. About 20% of the employees are
currently working in R&D and design.
As the installed base of automation
equipment continues to grow, mainte-
nance and other after-sales services will
account for a larger share of the compa-
ny’s operations. PMJ has separated its
after-sales service into its own unit, and
the first round-the-clock, year-long serv-
icing agreements were signed with cus-
tomers during the year just ended.
operations
5
page

6
page
During the year just ended, the PMJ
Group hired a total of over 60 new emp-
loyees, an increase of over 50% on the
previous year. The company was hoping
to hire even more people, in order to
better manage the company’s extremely
vigorous growth, but the competition
for skilled employees is fierce in this
business. However, PMJ’s higher profile
has made it easier to attract new employ-
ees. To increase the availability of per-
sonnel resources, PMJ has set up an
R&D unit at the Tampere University of
Technology, and has used alternative
recruitment media in addition to tradi-
tional print media.
All of PMJ’s employees were given the
opportunity to take part in the com-
pany’s first share option scheme, which
covered the entire Group, including its
wholly-owned subsidiaries and their
employees. PMJ views share options as a
positive means of committing personnel
to the company — employees are thus
united in their goal to increase the value
of the company.
The company also invests in its person-
nel by offering different kinds of training
to maintain and promote their level of
know-how in this rapidly-developing
field. At PMJ, development discussions
with employees lay the foundation for
training programmes; on the basis of
these discussions, each manager can
identify the training needs of his or her
organisation. Training is arranged both
for the entire organization and taking
the needs of individual employees into
account. Joint training can be arranged
for teaching the use of word processing
and spreadsheet PC software, for exam-
ple. As PMJ is now winning more for-
eign customers, it has become important
to foster the language skills of our em-
ployees at all levels of the company; this
calls for major outlays on language edu-
cation, which begins with the identifica-
tion of the learning needs of each indi-
vidual.
A target training project was begun in
1998. The project is supported by the
European Social Fund and is being or-
ganised in association with the Employ-
ment and Economic Development Cen-
tres of Western Uusimaa. Target training
aims to identify, together with the em-
ployees who are being taught, the train-
ing “events” that would further the de-
velopment of PMJ, helping it to evolve
in its rapidly-growing and increasingly
international business. Target training
will continue in 1999. Training of poten-
tial new recruits in the field of mechan-
ical assembly will also be started.
In 1998, PMJ’s personnel spent almost
800 days in training. Languages and
computer skills were the most common
subjects studied. The company estimates
that over 1000 training days will be used
in 1999; this is a high number in relation
to the size of the company. While the
European Social Fund covers part of the
expenditure, it is PMJ that covers the
majority of training costs. Both recruit-
ment and training drives aim to strength-
en PMJ’s ability to operate in a rapidly
expanding and ever more international
field.
The electronics industry is a rapidly-evolving business where success hingeson innovative R&D that pays heed tocustomers’ needs. This is why it is ofcrucial importance for PMJ’s personnelto be professional and motivated in thepursuit of our common goal: customersatisfaction.
Personnel–our most important resource
Training honescompetitiveness

7
page
During the year under review, a separate
R&D unit was set up at the Tampere
University of Technology. Four people
were working for the unit at the end of
the financial year. The company site in
Tampere furthers both PMJ’s drive to
recruit well-educated employees and the
company’s cooperative endeavours with
the university.
One of PMJ’s work ethics is to engage
in innovative R&D in association with
customers. Together with the customer,
PMJ strives to find a comprehensive
solution to each customer’s production
problems. Experience has demonstrated
that when production techniques are
being decided on, such as when a new
product is being made, the best results
can be achieved when PMJ is involved in
the process from the earliest stage possi-
ble.
Towards the end of the year, the prior-
ity area in research and development
was the development of new technology
for modular final assembly. This prod-
uct family includes the HiSAC 1500 FA
final assembly cell, the fastest and most
and development
The Group continued to invest in re-search and development. During the fi-nancial year, R&D expenditures amoun-ted to FIM 7.3 million, representing5.7% of turnover (1997: FIM 4.1 mil-lion). At present, about 20% of PMJ’semployees work in R&D and design.
versatile product of its type on the mar-
ket. It is possible to feed several different
types of components into the assembly
cell, thanks to new modular feeders and
the innovative component specific shutt-
le feeders they can be equipped with.
PMJ has applied for a patent on the
shuttle feeder. Automatic testing cells
and modular testing fixtures have also
been developed for use in a final assem-
bly line. The most challenging project
was the development of a precision as-
sembly/gluing cell that has a replication
fidelity of +/– 3 µ. The demand for this
production cell in the marketplace will
rise in step with the growth in packing
density.
The HiSAC® product family has been
developed further, and a completely new
third generation model, HiSAC® 1500,
was introduced towards the end of the
year as a part of a final assembly line.
The final assembly line was launched
in January 1999 at an exhibition in Swe-
den. It was developed especially for the
automated final assembly of mobile
phones, but it is also well suited to the
automated assembly of other sizeable
objects. The first deliveries of this prod-
uct model to customers in Sweden take
place in early 1999.
PMJ’s labeling cell was developed fur-
ther so as to better meet the needs of the
market. Thanks to its advanced camera
technology, PMJ’s labeling cell can suc-
cessfully read a label regardless of how it
is positioned, considerably reducing the
number of corrective measures that are
required and thus bringing about signif-
icant savings on production costs. The
labelling cell will become increasingly
important to PMJ’s product range, as in
future it will be increasingly important
to ascertain the authenticity of electronic
products.
In future, PMJ will make major out-
lays on R&D to ensure that the com-
pany is at the cutting edge of develop-
ment in all of its customers’ fields of
business. The company will continue its
policy of working with customers, sub-
contractors, component suppliers and
universities
Research

8
page
59%
Year 1998
The extremely vigorous growth of the
telecommunications industry world-
wide has positively affected PMJ’s oper-
ations. This customer sector developed
rapidly in 1998, with turnover rising
from FIM 32 million to FIM 76 million.
This industry share of PMJ’s turnover
rose from 45% to 59%. The greatest
growth was seen in the United States.
The telecommunications sector also
claimed a dominant share of operations
in Scandinavia. In the European market,
In the telecommunications industry, PMJ’s automationequipment is used in the assembly processes of mobilephones, digital telephone switches and base stations.
the UK’s share evolved especially well. In
Finland, the share of operations ac-
counted for by telecommunications de-
clined.
By far the largest product group in the
telecommunications sector was the
HiSAC® Odd-Form PCB Assembly Cell,
whose assembly speed and accuracy
have been upgraded to meet customers’
increasingly stringent demands. The as-
sembly cell accounted for slightly less
than half of the turnover in this sector.
The trend in sales of the depaneling cell,
which has now become a standard prod-
uct, also remained favourable. The mul-
tifunction cell, which was developed in
1997, and which can perform as many as
7 functions, became a major product in
the telecommunications sector in 1998.
The modification of products sold dur-
ing the first half of the decade continued
during this report year. Sales of PCB
devices grew, and significant gains were
made, particularly in the share of sales
accounted for by the labeling cell that
was launched during the financial year.
Outlook for thetelecommunicationssector
Telecommunications have occupied an
important position in the growth of the
electronics industry. Technological devel-
opment forges onwards, with new prod-
uct applications being launched and the
products currently on the market having
shorter life cycles than before. The tech-
nology employed in third generation (3G)
wireless telephones utilises mobile phone
systems built around base stations,
processing sound and data not only with
extreme speed, but also more cheaply than
the recently unveiled global satellite sys-
tem. Mobile phones can now get graphics
from the Internet, and, when equipped
with minicams, they can also be used to
hold video conferences. It is expected that
wireless telephones will replace wire tele-
phones, because teleoperators will be able
to offer consumers a greater number of
connections, such as access to the Internet,
and do so with improved efficiency.
Proportion of the telecommunicationsindustry in PMJ’s turnover

9
page
Telecommunications
The Nordic countries have the highest
densities of mobile phones in the world,
with over 50% of the population in
Finland now using mobile phones. The
mobile phone density in the other Nor-
dic countries is also rising fast. The need
for mobile phone networks and related
ancillary services is also growing quick-
ly. Likewise, the range of supplementary
products offered for mobile phones is
becoming larger, and the fact that their
prices are declining stimulates the de-
mand for them further. The greater vari-
ety of services available to mobile phone
users is leading to an increase in the share
of electronics supplied by companies
outside the industry, thus contributing
to the growth of the market.
PMJ’s outlook in thesector
The demand for telecommunications
sstems and devices is very brisk in PMJ’s
market areas: Europe, USA and Scan-
dinavia. PMJ will expand its operations
into the Far East towards the end of the
present year.
tomers in the telecommunications sec-
tor, PMJ has developed a testing cell for
use in final assembly, and the first of
these cells will be delivered in 1999.
Continuous and long-term R&D in as-
sociation with customers will enable
PMJ to provide even better product
ranges.
The outlook for the growth of the tele-
communications industry remains
good, generally speaking, but the pros-
pects of individual customers may vary.
PMJ has excellent opportunities in this
market, thanks to the automation con-
sultancy services, products that have
good market positions, unflagging
R&D efforts and upgraded internal
operations.
industry
PMJ’s customers in thetelecommunicationindustry
ALCATEL
ERICSSON
MOTOROLA
LK-PRODUCTS
NOKIA
PANASONIC
SALCOMP
TAC
TELLABS
PMJ’s own sales and maintenance
channel enables the company to offer
products to extensive customer base
with great efficiency. Original equip-
ment for telecommunications is in high
demand, and this fact, together with
tightening price competition, will force
PMJ’s customers to increase the level of
automation used in their production
lines and to develop solutions that rely
on a greater degree of automation. Due
to PMJ’s solid expertise in automation,
the company has often been requested to
act as a consultant, in which capacity
PMJ works together with customers to
develop the next generation of automa-
tion solutions.
The major orders received from Euro-
pean mobile phone manufacturers at the
end of the review period afford PMJ the
chance to shorten its lead times and
attain higher internal efficiency. A
new product that will be
launched by PMJ is a final
assembly cell; indeed, final
assembly is expected to
become a major prod-
uct area in the years
ahead. For cus-
10
page
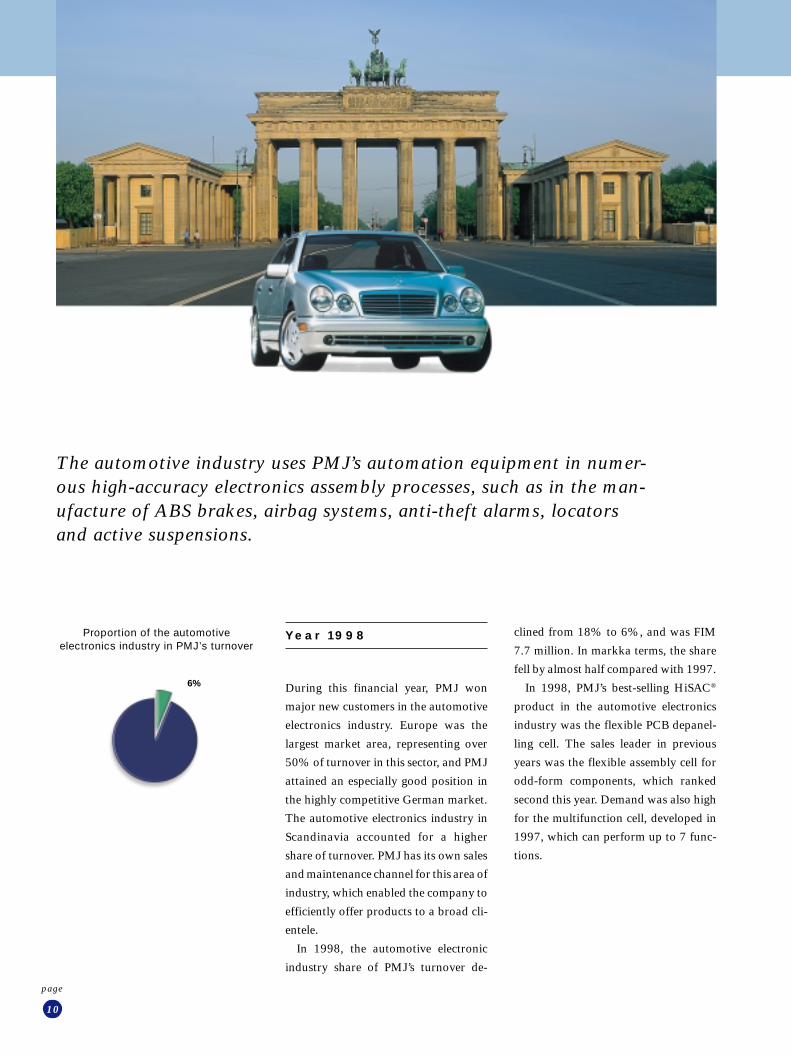
Proportion of the automotiveelectronics industry in PMJ’s turnover
During this financial year, PMJ won
major new customers in the automotive
electronics industry. Europe was the
largest market area, representing over
50% of turnover in this sector, and PMJ
attained an especially good position in
the highly competitive German market.
The automotive electronics industry in
Scandinavia accounted for a higher
share of turnover. PMJ has its own sales
and maintenance channel for this area of
industry, which enabled the company to
efficiently offer products to a broad cli-
entele.
In 1998, the automotive electronic
industry share of PMJ’s turnover de-
The automotive industry uses PMJ’s automation equipment in numer-ous high-accuracy electronics assembly processes, such as in the man-ufacture of ABS brakes, airbag systems, anti-theft alarms, locatorsand active suspensions.
clined from 18% to 6%, and was FIM
7.7 million. In markka terms, the share
fell by almost half compared with 1997.
In 1998, PMJ’s best-selling HiSAC®
product in the automotive electronics
industry was the flexible PCB depanel-
ling cell. The sales leader in previous
years was the flexible assembly cell for
odd-form components, which ranked
second this year. Demand was also high
for the multifunction cell, developed in
1997, which can perform up to 7 func-
tions.
Year 1998
6%

11
page
PMJ’s customers in theautomotive electronicsindustry
ALTHOFEN
COMBITECH ELEC-TRONICS
KIEKERT
KOSTAL
LUCAS
MERTEN
SEM
TEMIC
UKNSI
VDO
Automotive electronics
The demand for end products in the
European automotive industry grew by
7 per cent compared with the previous
year, but it is expected that demand will
decline by 2 per cent in 1999. The Euro-
pean automotive industry is experienc-
ing overcapacity at the moment, and this
is why the industry is currently becom-
ing centralised through mergers and
business combinations. The automotive
industry is seeking to form ever larger
groups, and many subfunctions of pro-
duction are being outsourced. This is
reflected in the growth of the automotive
industry's outsourcers and their oppor-
tunities to expand their operations.
It is expected that the automotive elec-
tronics market will grow by almost 10%
per year; its value in the next millennium
is forecast to be over FIM 400 billion.
The number of outsourcers will shrink,
but the remaining companies will be
larger. In order to remain competitive,
the outsourcers of the automotive elec-
tronics industry will invest heavily in
developing their production. The new
and innovative electronics applications
developed by the automotive industry
will be made available to the end-users at
an ever-faster pace. In order to respond
to tougher competition from non-Euro-
pean companies, the industry's out-
sourcers will have to increase the degree
of their automation in step with the
growing quality requirements, increas-
ing their cost-effectiveness at the same
time.
PMJ won major new customers in the
automotive electronics industry. Their
outlook in this sector is positive.
As the unit sizes in the automotive
industry grow, and the number of car
procurement channels shrinks in Eu-
rope's contracting market, PMJ can of-
fer production solutions to automotive
electronics customers outside Europe,
because PMJ has its own marketing and
service channels, through which it can
promote its HiSAC® product family.
Considering the trends in this branch of
industry, PMJ’s existing and new custom-
ers have significant investment needs.
Industry outlookPMJ's end-of-line automation solu-
tions for the electronics industry provide
our customers with the opportunity to
improve the lead times of their produc-
tion, upgrade their quality level and im-
prove productivity. PMJ's flexible prod-
ucts can be quickly modified to suit the
needs of customers.
The products that were developed
during the past years, as well as the
products now under development, make
it possible for PMJ to offer flexible auto-
mation solutions to a far more extensive
clientele than before.
industry
PMJ’s outlook in thesector

12
page
Co
urt
esy
of
Ap
ple
Co
mp
ut e
r, I
nc
. /Te
rry
He
f fe
rma
n
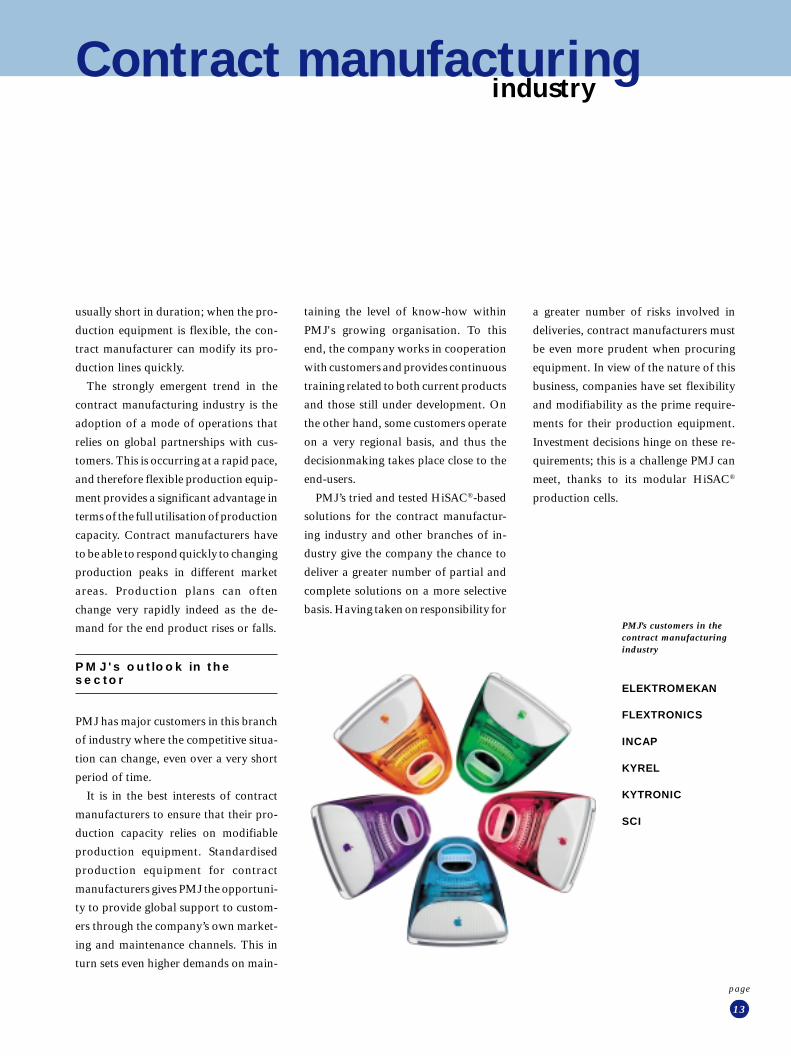
Proportion of the contract manufactur-ing industry in PMJ’s turnover
12%
The contract manufacturing industry
continued to grow strongly during this
financial year, with turnover rising from
FIM 9.2 million to FIM 15.4 million.
This customer sector accounted for 12%
of PMJ's turnover. PMJ won major new
customers during the year, e.g. SCI that
is one of the largest contract manufac-
turers in the world.
The largest market area was Europe,
whose share of the turnover in this cus-
tomer sector rose to over 40%, as
against 10% in the previous year. The
share of turnover accounted for by Fin-
land and the other Nordic countries also
grew to over 40%. Growth was especial-
ly vigorous in Finland, where turnover,
in markka terms, was twice as high as in
1997. In the American market, two of
the largest contract manufacturers in the
world became PMJ's customers, and
cooperation with these companies is ex-
pected to grow to encompass other mar-
ket areas. The modification of existing
lines also continued in the contract man-
ufacturing industry, much as in previous
years.
The most significant HiSAC® product
for the contract manufacturing industry
was the flexible PCB depanelling cell;
while the flexible assembly cell for odd-
form components, came a close second.
This cell was especially popular with
PMJ’s new customers.
The contract manufacturing industry is
continuing its vigorous growth as its
customers outsource their own business
functions.
It is expected that this branch of indus-
try will grow by 25% each year, with this
rate of growth continuing into the first
years of the next millennium. The con-
tract manufacturing industry is being
presented with ever larger subassemblies
to manufacture, and thus the procure-
ment of appropriate production equip-
ment has became a major competitive
factor. The contracts entered into in the
contract manufacturing industry are
PMJ supplies automation equipment to the contract manufacturing in-dustry for a variety of manufacturing needs, including mobile phonesand their peripheral devices, digital telephone switches and computers,as well as industrial and consumer electronics components and endproducts.
Industry outlook
Year 1998
13
page
PMJ’s customers in thecontract manufacturingindustry
ELEKTROMEKAN
FLEXTRONICS
INCAP
KYREL
KYTRONIC
SCI
Contract manufacturing
usually short in duration; when the pro-
duction equipment is flexible, the con-
tract manufacturer can modify its pro-
duction lines quickly.
The strongly emergent trend in the
contract manufacturing industry is the
adoption of a mode of operations that
relies on global partnerships with cus-
tomers. This is occurring at a rapid pace,
and therefore flexible production equip-
ment provides a significant advantage in
terms of the full utilisation of production
capacity. Contract manufacturers have
to be able to respond quickly to changing
production peaks in different market
areas. Production plans can often
change very rapidly indeed as the de-
mand for the end product rises or falls.
PMJ has major customers in this branch
of industry where the competitive situa-
tion can change, even over a very short
period of time.
It is in the best interests of contract
manufacturers to ensure that their pro-
duction capacity relies on modifiable
production equipment. Standardised
production equipment for contract
manufacturers gives PMJ the opportuni-
ty to provide global support to custom-
ers through the company’s own market-
ing and maintenance channels. This in
turn sets even higher demands on main-
taining the level of know-how within
PMJ's growing organisation. To this
end, the company works in cooperation
with customers and provides continuous
training related to both current products
and those still under development. On
the other hand, some customers operate
on a very regional basis, and thus the
decisionmaking takes place close to the
end-users.
PMJ’s tried and tested HiSAC®-based
solutions for the contract manufactur-
ing industry and other branches of in-
dustry give the company the chance to
deliver a greater number of partial and
complete solutions on a more selective
basis. Having taken on responsibility for
a greater number of risks involved in
deliveries, contract manufacturers must
be even more prudent when procuring
equipment. In view of the nature of this
business, companies have set flexibility
and modifiability as the prime require-
ments for their production equipment.
Investment decisions hinge on these re-
quirements; this is a challenge PMJ can
meet, thanks to its modular HiSAC®
production cells.
PMJ's outlook in thesector
industry

14
page
16%
Proportion of the general electronicsindustry in PMJ’s turnover
PMJ’s customers in the general electronics industry are manufacturers of con-sumer electronics, information technology, industrial electronics and residen-tial electronics. In this customer sector, PMJ delivers automation equipmentfor the assembly of heating control units, energy meters, fire detectors, light-ing controls, frequency converters and computers.
Year 1998
Sales to the general electronics industry
grew considerably in 1998.
Turnover more than doubled, rising
from FIM 8.53 million to FIM 20.5
million, and accounted for 16% of
PMJ’s turnover. The product group that
registered the best growth was residen-
tial electronics, with electronics seeing
greater use especially in lighting solu-
tions; indeed, PMJ won new major cus-
tomers in this field.
The second-highest share of turnover
in this sector was accounted for by cus-
tomers in industrial electronics.
PMJ ventured into a new business area
by winning consumer electronics cus-
tomers who want to further upgrade
their quality standards with flexible
HiSAC® production modules.
The largest share of turnover within
this industrial sector came from the Eu-
ropean market, while the combined
shares of United States and Finland
amount to slightly over 10 per cent.
In the case of individual countries,
Germany’s share of turnover was the
highest by a clear margin, thanks to the
company’s long-term marketing meas-
ures.

15
page
The product that achieved the highest
sales to customers in the general elec-
tronics industry was the flexible assem-
bly cell for odd-form components,
which was well received by all the cus-
tomer groups in the sector. The runner-
ups were PMJ’s flexible PCB depanelling
cell and pin insertion cells.
Energy conservation is an issue that is
under intense discussion in Europe.
Lighting systems based on electronically
controlled motion detection offer one
means of achieving energy savings. The
huge demand for these systems, coupled
with the factors involved in upgrading
their quality, is guiding manufacturers to
increase the degree of automation used
in end-of-line assembly. Customers in
the consumer electronics industry will
likewise make investments in quality, as
they will have to face the price competi-
tion in the market. For such companies,
automation is a good option for devel-
oping the production process, especially
in countries where labour costs are high.
The growth prospects in the IT sector are
also good, and in this sector, automation
imparts a distinct competitive advantage
by upgrading quality.
Industry outlook
General electronics
PMJ’s customers in thegeneral electronics industry
ABB
BANG & OLUFSEN
DANFOSS
ENERMET
EUROTHERM
FUJITSU
GUARDALL
HONEYWELL
KAMSTRUP
MIELE
OSRAM
SIEBE
SIEMENS NIXDORF
VOSSLOH-SCHWABE
PMJ has an extensive customer base in
the general electronics industry. The
need to make investments in the automa-
tion of production is following a growth
vector. The outlook for the further devel-
opment of the automation solutions ar-
rived at with residential electronics cus-
tomers is considered to be especially
good. The first HiSAC® solutions creat-
ed with consumer electronics customers
represented a breakthrough into this
branch of industry, affording good op-
portunities for the further expansion of
PMJ’s operations. PMJ’s long-term co-
operation with customers in industrial
electronics has also planted the seed for
further growth in this sector. With its
flexible automation solutions, PMJ will
benefit from the buoyant, global growth
of information technology.
The external functions of the electronics
industry, mainly in the US market, com-
prised part of general business in 1998.
These functions were sold outside the
Group at the end of 1998, and their loss-
making effect on the report year will not
extend to 1999.
This sector also includes PMJ’s subsid-
iary Mecra tekniikka Oy. Sixty-eight per
cent of the company’s production of fine
mechanics was sold within the Group,
and its result had a positive effect on the
Group. Mecra tekniikka’s operations
are now undergoing strong growth, fol-
lowing on the heels of the growth of PMJ
and the subsidiary’s customers outside
the Group.
PMJ’s outlook in thesector
General business
industry

16
page
Overview
The PMJ automec Group’s turnover for
the financial year was FIM 128.1 mil-
lion, up 80% on the previous year (1997:
FIM 71.2 million). The share of turnover
accounted for by exports rose to 82 per
cent, with the strongest growth being
seen in the United States. The Group’s
equity ratio shot up to 59.1% as a result
of the share issue carried out in spring
1998 and the improved level of profita-
bility.
Market trends
Turnover grew in export markets. Eu-
rope was the largest market, accounting
for 36% of turnover. The greatest
growth in turnover occurred in the Unit-
ed States; 21% of turnover, or FIM 28
million. Europe’s share also grew strong-
ly, with the company venturing into Italy
and France for the first time. Finland’s
share of the Group’s turnover declined;
however, when considered in Finnish
markka terms, turnover increased. In the
other Nordic countries, particularly
Sweden, the company increased its turn-
over by over 50%.
Report
The Group continued to invest in re-
search and development. R&D projects
continued to put HiSAC® modules into
production and developed a completely
new generation of HiSAC® products for
the automation of final assembly. Dur-
ing this financial year, R&D expendi-
tures amounted to FIM 7.3 million, rep-
resenting 5.7% of turnover (1997: FIM
4.1 million), and an R&D unit was set
up in Tampere, where 4 people were
employed at the end of the period. FIM
3.0 million in R&D expenditures were
capitalised (1997: FIM 3.6 million).
Financial result
Operating profit was FIM 11.7 million,
or 9.1% of turnover (1997: FIM 4.5
million). Profit after financial income
and expenses was FIM 10.5 million, or
8.2% of turnover (1997: FIM 2.4 mil-
lion). The increased share of production
accounted for by standard products con-
tributed to the improvement in earnings,
as did the volume benefits. The best
financial result was achieved in the sec-
ond four-month period of the financial
year, when a considerable volume of
standard products was delivered. Dur-
ing the last four months of the year, the
result was burdened by the loss-making
Research anddevelopment
operations in the United States. The
booking of several US customer projects
was pushed forward to the following
financial year, and consequently these
projects will only have an effect on earn-
ings in 1999. The largest turnover was
achieved up in the last four-month peri-
od of the year. Turnover developed ac-
cording to plan.
Share issue
During the period under review, a deci-
sion was taken to strengthen the com-
pany’s shareholder base, and thus, at the
extraordinary meeting of shareholders
that was held in January, a bonus issue
amounting to a total of FIM 6.3 million
was decided upon; the par value of
shares was reduced to FIM 3; the compa-
ny’s share series were combined, with all
shares now conferring one vote; and the
company was transformed into a public
listed company. After this reorganisa-
tion, the company’s share capital was
FIM 9,378,900 and it had 3,126,300
shares. The voting rights held by Presi-
dent Markku Jokela, the majority owner
of the company, fell from 81 per cent to
68 per cent.
At the Annual General Meeting held
in March, it was tentatively decided that,
in line with the proposal of the Board of
Directors, the company’s share capital
would be raised from its current amount
of the board directors,january 1-december 31,1998
17
page
of FIM 9,378,900 to at least FIM
11,478,900 and at most FIM 12,378,900,
by issuing a minimum of 700,000 or a
maximum of 1,000,000 of the company’s
shares having a par value of FIM 3. It was
proposed that the issue of new shares
would be carried out as a public offering
– waiving shareholders’ preem-ptive
right to subscribe shares – directed at:
• domestic and foreign institu
tional investors
• the Finnish public
• the PMJ automec Group’s per
sonnel.
The waiving of shareholders’ pre-
emptive right to subscribe shares in this
share offering is justified by the desire to
strengthen the company’s capital and
financing structure, whereby the compa-
ny will be able to satisfy the investment
requirements brought about by its
growth and to expand its shareholder
base by making its shares available for
public trading following the listing of the
shares on the stock exchange.
At the extraordinary meeting of share-
holders that was held in April, it was
decided to raise the company’s share
capital from FIM 9,378,900 to FIM
12,378,900 by carrying out a public
offering targeted at the public (institu-
tions and retail investors) and the
Group’s employees, waiving sharehold-
ers’ pre-emptive right to subscribe
shares. 1,000,000 new shares having a
par value of FIM 3 each were issued in
the public offering. The subscription
price of the shares issued for the public
was FIM 40 and the subscription price of
the shares issued for the Group’s person-
nel was FIM 36. Over 40 people took
part in the employee offering. The offer-
ing was fully subscribed on the first
subscription day. After the share offer-
ing, the voting rights held by President
Markku Jokela, the main shareholder of
the company, declined from 68 per cent
to 45 per cent.
The company’s shares were first quot-
ed on the OTC list maintained by HEX
Helsinki Exchanges on May 15, 1998.
On the first day of trading, the share
price rose from the subscription price of
FIM 40 to FIM 53. From May to No-
vember, the share price fluctuated be-
tween FIM 42 and FIM 60. In December,
the share price was FIM 120 at its high-
est, and stood at FIM 116 at the end of
the month.
Share turnover was brisk, accounting
for 43% of the shares outstanding. The
company’s market value was FIM 478
million at the end of the financial year.
Share option scheme
The extraordinary meeting of share-
holders held in April decided to give the
employees of European subsidiaries
wholly owned by the Group the oppor-
tunity to participate in the share option
scheme. In accordance with the share
option scheme, 200,000 of the com-
pany’s new shares having a par value of
FIM 3 can be subscribed, whereby the
share capital can be increased by a max-
imum of FIM 600,000. The effect of the
share options was to increase the compa-
ny’s share capital by 4.6%. The sub-
scription price under the scheme
equalled the offering price, or FIM 40
per share. The share option scheme is
distributed over three years in such a
way that 30% of the options under the
scheme can be subscribed on May 1,
2000, 30% on May 1, 2001, and the
rest, 40%, from May 1, 2002, onwards.
The subscription period of all options
ends on December 31, 2003. Eighty-five
people in all took part in the share option
scheme.
Group structure and own-ership
At the beginning of the financial year, the
Group comprised Mecra tekniikka Oy,
in which PMJ automec Corporation has
a 60% holding, PMJ automec USA, Inc.,
in which PMJ automec Corporation had
a 90% holding, and the wholly-owned
subsidiary PMJ testline Oy, which did
not engage in business operations during
the financial year. PMJ automec UK Ltd.
was acquired as a wholly-owned subsid-
iary of the Group in February. During
the financial year, changes were imple-
mented in the ownership structure of the
US company, and, in February, a major-
ity holding was acquired in Global Inte-
gration Inc., in which PMJ automec
Corporation previously had a 35% mi-
nority share. At the same time, the US
companies were merged and renamed
PMJ automec USA Inc. The parent com-
pany had a 77.8% holding in this new
company. As a result of the acquisitions
that were carried out at the end of the
year, PMJ automec Inc. became a whol-
ly-owned subsidiary of the Group, and
at the same time the functions external to
the electronics industry were sold to the
company’s previous minority sharehold-
er and managing director.

18
page
Capital expenditures
Gross capital expenditures amounted to
FIM 10.4 million during the financial
year. The largest expenditure items were
FIM 3.0 million in capitalised R&D
expenditures and FIM 2.3 million in
investments in machinery and equip-
ment. The increase in fixed assets due to
the acquisition of subsidiaries was FIM
1.8 million.
The euro and theyear 2000
The Group’s readiness for the introduc-
tion of the euro is good; the euro will not
have a significant effect on the Group’s
functions.
Preparations for the year 2000 prog-
ressed according to plan. No essential
Y2K risks have been detected in the
products sold by the company or the
computer systems used by it.
Personnel
The Group employed 151 people on
average (97 in 1997), and the parent
company 108 people on average (75 in
1997). 86% of the personnel worked in
Finland. An extensive training program-
me for existing employees was launched
during the financial year in association
with the European Social Fund (ESF).
Important events after theclosing of the books
In February, PMJ received a major order
of final assembly lines from Sweden,
raising the order book to over FIM 80
million. In order to attain even better
delivery times, the company rented pro-
duction premises measuring 3000 m2 in
Lohja, increasing the company’s premi-
ses to almost 10,000 m2, of which the
company owns slightly over 4000 m2.
Due to the further growth of the Group’s
activities, the parent company has set up
subsidiaries in Sweden and Germany,
and, this spring, it will establish a subsi-
diary in France.
Outlook for the future
At the end of the financial year, the order
book stood at FIM 45.6 million (1997:
FIM 24 million). At the end of February,
the backlog had risen to FIM 80 million.
During the financial year, new orders
worth FIM 145 million came in; by the
end of February 1999, the value of or-
ders accepted during the preceding 12
months had risen to FIM 170 million.
The company’s aggressive concentration
on export markets, and the major orders
that have come in, enabled it to continue
to apply its strategy of rapid growth. The
outlook is positive, especially in the fled-
gling automation market of the electro-
nics industry. The transfer of complete
control over the US functions into the
Group’s hands will improve the Group’s
profitability. The growth of turnover is
expected to remain buoyant, and that
the financial result will be considerably
better than in the previous financial
year.

19
page
Jan. 1 - Dec. 31, 1998 Jan. 1 - Dec. 31, 1997
Turnover 128 066 929.16 100.0 % 71 179 902.38 100,0 %
Increase (+) or decrease (-) in inventoriesof completed or unfinished products - 3 685 022.06 4 995 634.00Other operating income 541 677.17 268 743.01
Materials and servicesMaterials, equipment and supplies Purchases during the financial year 53 479 347.97 37 040 342.32 Change in inventories - 6 564 381.67 - 2 325 522.88External services 6 636 856.42 4 101 712.76
Personnel expenses 28 689 976.21 15 558 248.24Depreciation and value adjustments
Depreciation according to plan 4 536 047.50 2 994 368.43Other operating expenses 26 428 148.67 14 334 153.39Share of result of associated companies 248 390.27Total expenses 113 205 995.10 71 951 692.53
Operating profit 11 717 589.17 9.1 % 4 492 586.86 6,3%
Financial income and expensesInterests and financial income 770 690.26 127 277.66Interest expenses and other financial expenses -1 958 445.23 - 2 229 489.45
Profit before extraordinary items 10 529 834.20 8.2 % 2 390 375.07 3.4 %
Extraordinary itemsExtraordinary income 487 945.46
Profit before appropriations and taxes 11 017 779.66 8.6 % 2 390 375.07 3.4 %
AppropriationsIncrease (-) or decrease (+) in depreciation difference 13 982.53
Income taxes - 4 005 170.67 - 902 919.55Change in imputed taxes 1 290 569.84
Profit before minority interest 8 303 178.83 6.5 % 1 501 438.05 2.1 %
Minority interest - 419 489.94 - 476 138.79
Net profit 7 883 688.89 6.2 % 1 025 299.26 1.4 %
Group Income Statement

20
page
Dec. 31, 1998 Dec. 31, 1997
ASSETS
FIxed assetsIntangible assets
Incorporation expenditure 215 259.47 381 176.14R&D expenses 1 745 181.00 2 420 229.49Intangible rights 880 752.68 544 572.36Goodwill 73 666.18 143 818.42Other long-term expenses 1 932 114.23 919 607.21R&D projects in progress 4 916 313.13 3 080 562.00
9 763 286.69 7 489 965.62
Tangible assetsLand and water areas 878 200.00 878 200.00Buildings and structures 3 267 960.07 3 206 573.48Machinery and equipment 4 862 749.08 2 432 362.91
9 008 909.15 6 517 136.39
InvestmentsShares in associated companies 106 964.73Other shares and participations 125 354.00 122 354.00Goodwill 648 772.72
774 126.72 229 318.73
19 546 322.56 14 236 420.74
Variable assetsInventories
Materials and supplies 8 920 065.75 3 899 758.35Work in process 4 054 894.92 2 330 872.00Production in process 8 114 559.19 9 794 180.00Completed products and goods 3 787 986.15 350 168.00
24 877 506.01 16 374 978.35
Receivables Short-term
Sales receivables 39 239 479.08 16 292 088.97Loan receivables 22 910.00 83 910.00Other receivables 91 418.52 68 098.36Prepaid expenses and accrued income 5 211 168.67 3 283 299.57Deferred tax assets 1 996 775.72
46 561 751.99 19 727 396.90
Cash in hand and banks 20 921 592.73 3 218 986.72
Assets, total 111 907 173.29 53 557 782.71
Group Balance Sheet

21
page
Dec. 31, 1998 Dec. 31, 1997
LIABILITIES
Shareholders’ equityShare capital 12 378 900.00 3 261 300.00Share premium fund 37 055 000.00Reserve fund 3 598 252.60 9 850 852.60Translation difference - 16 756.91 690.00Retained earnings 2 732 231.32 1 954 501.36Book profit 7 883 688.89 1 025 299.26
63 631 315.90 16 092 643.22
Minority interest 1 028 590.97 650 673.66
Accumulated depreciationDepreciation difference 308 311.20
Compulsory reservesOther compulsory reserves 1 565 000.00 530 000.00
LiabilitiesLong-term
Loans from financial institutions 8 917 500.00 8 182 500.00Pension loans 3 278 362.00 3 068 600.60Other loans 2 300 000.00 2 550 000.00
14 495 862.00 13 801 100.60
Short-term
Loans from financial institutions 1 940 000.00 2 147 215.33Pension loans 631 630.00 511 433.60Advances received 2 433 375.09 5 544 140.92Accounts payable 11 243 005.73 6 471 065.39Other loans 810 247.51 2 291 042.56Accrued liabilities and prepaid income 13 823 558.53 5 210 156.23Deferred tax liabilities 304 587.56
31 186 404.42 22 175 054.03
Liabilities, total 111 907 173.29 53 557 782.71

22
page
Jan.1, –Dec.31, 1998 Jan.1, –Dec.31, 1997
FUNDING
Income funding
Net profit 7 883 688.89 1 025 299.26Depreciation 4 536 047.50 2 994 368.43Change in reserves 726 688.80 516 017.48
Income funding, total 13 146 425.19 4 535 685.17Capital gains on the sale of fixed assets 536 030.42 47 500.00Increase in long-term liabilities 3 461 589.00 13 325 751.00Share issue 39 920 000.00 3 681 552.60Translation difference -34 747.35 700.92Change in minority interest 377 917.31 486 997.16
57 407 214.57 22 078 186.85
APPLICATION OF FUNDS
Investment 10 384 658.60 8 727 933.00Decrease in long-term liabilities 2 766 827.60 3 748 708.40Dividends paid 227 590.00 492 019.17Change in net working capital 44 028 138.37 9 109 526.28
57 407 214.57 22 078 186.85
CHANGE IN NET WORKING CAPITAL
Cash in hand and banks 20 921 592.73 3 218 986.72 Short-term financial assets 46 561 751.98 19 727 396.90 Inventories 24 877 506.01 16 374 978.35 Short-term liabilities -31 186 404.41 -22 175 054.03
61 174 446.31 17 146 307.94
Net working capital on Jan. 1 17 146 307.94 8 036 781.66Net working capital on Dec. 31 61 174 446.31 17 146 307.94
44 028 138.37 9 109 526.28
Group Fund Statement

23
page
Jan. 1 - Dec. 31, 1998 Jan. 1 - Dec. 31, 1997
Turnover 123 191 529.23 100.0 % 69 472 998.65 100.0 %Increase (-) or decrease (+) in inventoriesof completed or unfinished products -3 671 033.07 5 132 178.00Other operating income 556 951.20 498 603.01
Materials and servicesMaterials, equipment and supplies Purchases during the financial year 58 122 176.63 41 119 659.33
Change in inventories -6 361 345.48 -2 332 876.25External services 11 423 486.91 4 717 713.26
Personnel expenses 20 331 802.56 12 098 802.16Depreciation and value adjustments
Depreciation according to plan 3 734 883.83 3 009 507.19Other operating expenses 20 140 053.65 13 182 289.11
Operating profit 12 686 389.26 10.3 % 3 308 684.86 4.8 %
Financial income and expensesIncome from shares in Groupcompanies 83 316.67Other interests and financial income From Group companies 131 225.06 From others 766 671.84 127 277.66Interest expenses and other financial expenses To Group companies - 79 231.72 To others -1 832 128.40 -2 188 320.84
Profit before extraordinary items,appropriations and taxes 11 756 242.71 9.5 % 1 247 641.68 1.8 %
AppropriationsIncrease (-) or decrease (+) in depreciation difference - 520 256.67 13 982.53
Income taxes -3 232 424.67 - 429 088.10
Net profit 8 003 561.37 6.5 % 832 536.11 1.2 %
Parent Company Income Statement

24
page
Dec. 31, 1998 Dec. 31, 1997
ASSETS
Fixed assetsIntangible assets
Incorporation expenditure 178 371.72 342 154.85R&D expenses 1 745 181.00 2 459 229.49Intangible rights 835 302.68 544 572.36Goodwill 73 666.18 143 818.42Other long-term expenses 1 887 570.09 919 607.21R&D projects in progress 4 916 313.13 3 080 562.00
9 636 404,80 7 489 944,33
Tangible assets Land and water areas 878 200.00 878 200,00
Buildings and structures 3 267 960.07 3 206 573.48Machinery and equipment 3 156 195.86 1 896 734.95
7 302 355.93 5 981 508.43
InvestmentsShares in Group companies 1 558 590.50 411 854.70Shares in associated companies 355 355.00Other shares and participations 119 354.00 116 354.00
1 677 944.50 883 563.70
18 616 705.23 14 355 016.46
Variable assetsInventories
Materials and supplies 8 454 071.46 3 817 905.00Work in process 4 054 894.92 2 330 872.00Production in process 5 569 886.93 10 032 139.00Completed products and goods 1 141 387.00 350 168.00
19 220 240.31 16 531 084.00
Receivables Short-term
Sales receivables 30 399 258.64 16 026 446.13Receivables from Group companies 16 561 391.31 19 096.65Receivables from associated companies 110 885.84Loan receivables 13 910.00 83 910.00Other receivables 68 098.36Prepaid expenses and accrued income 4 988 742.62 3 263 892.95
51 963 302.57 19 572 329.93
Cash in hand and banks 19 830 154.25 3 040 686.35
Assets, total 109 630 402.36 53 499 116.74
Parent Company Balance Sheet
25
page
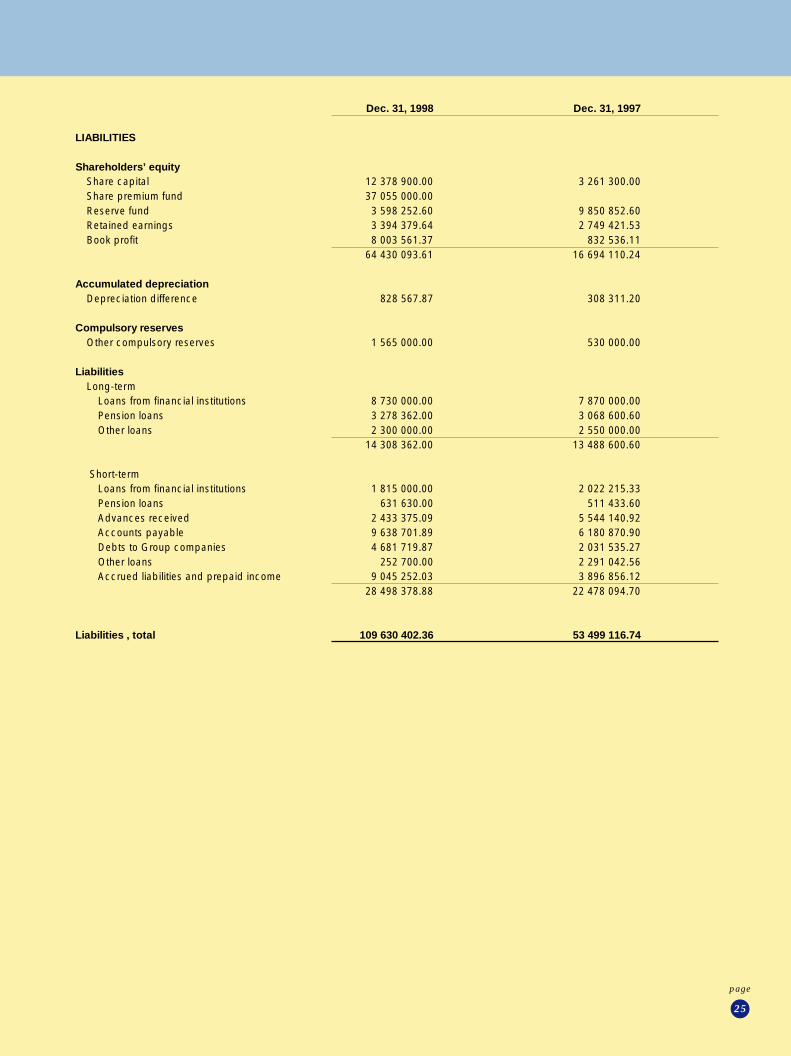
Dec. 31, 1998 Dec. 31, 1997
LIABILITIES
Shareholders’ equityShare capital 12 378 900.00 3 261 300.00Share premium fund 37 055 000.00Reserve fund 3 598 252.60 9 850 852.60Retained earnings 3 394 379.64 2 749 421.53Book profit 8 003 561.37 832 536.11
64 430 093.61 16 694 110.24
Accumulated depreciationDepreciation difference 828 567.87 308 311.20
Compulsory reservesOther compulsory reserves 1 565 000.00 530 000.00
LiabilitiesLong-term
Loans from financial institutions 8 730 000.00 7 870 000.00Pension loans 3 278 362.00 3 068 600.60Other loans 2 300 000.00 2 550 000.00
14 308 362.00 13 488 600.60
Short-termLoans from financial institutions 1 815 000.00 2 022 215.33Pension loans 631 630.00 511 433.60Advances received 2 433 375.09 5 544 140.92Accounts payable 9 638 701.89 6 180 870.90Debts to Group companies 4 681 719.87 2 031 535.27Other loans 252 700.00 2 291 042.56Accrued liabilities and prepaid income 9 045 252.03 3 896 856.12
28 498 378.88 22 478 094.70
Liabilities , total 109 630 402.36 53 499 116.74

26
page
Jan.1, –Dec.31, 1998 Jan.1, –Dec.31, 1997FUNDING
Income fundingNet profit 8 003 561.37 832 536.11Depreciation 3 734 883.83 3 009 507.19Change in reserves 2 085 256.67 -13 982.53
Income funding, total 13 823 701.87 3 828 060.77Capital gains on the sale of fixed assets 499 000.00 47 500.00Increase in long-term liabilities 3 461 589.00 13 325 751.00Share issue 39 920 000.00 3 681 552.60
57 704 290.87 20 882 864.37
APPLICATION OF FUNDS
Investment 8 495 572.62 8 833 347.11Decrease in long-term liabilities 2 641 827.60 3 623 708.40Dividends paid 187 578.00 492 019.17Change in net working capital 46 379 312.65 7 933 789.69
57 704 290.87 20 882 864.37
CHANGE IN NET WORKING CAPITAL
Cash in hand and banks 19 830 154.25 3 040 686.35Short-term financial assets 51 963 302.57 19 572 329.93Inventories 19 220 240.31 16 531 084.00Short-term liabilities -28 498 378.90 -23 008 094.70
62 515 318.23 16 136 005.58
Net working capital on Jan. 1 16 136 005.58 8 202 215.89Net working capital on Dec. 31 62 515 318.23 16 136 005.58
46 379 312.65 7 933 789.69
Parent Company Fund Statement

27
page
Accounting Principles
Principles of consolidation
The consolidated financial statements have been prepared according to the
acquisition cost method, in which the acquisition cost of subsidiaries establis-
hed by the parent company itself, intra-Group charges, receivables and liabili-
ties as well as the internal gain on the sale of items included in fixed assets
have been eliminated and the minority interest share of the net profit and
shareholders’ equity has been stated as a separate item.
The changes in voluntary reserves and depreciation difference in the Group
companies’ financial statements have been divided between the change in the
imputed deferred tax liability, which is in line with the tax rates in force, and
the net profit for the financial year in the consolidated financial statements. In
the consolidated balance sheet, accrued appropriations have been divided into
imputed deferred tax liabilities and non-restricted equity.
Turnover
Items subtracted from sales income in calculating turnover are indirect taxes,
discounts granted, the expenses of customer claims and foreign exchange
differences on sales. Sales freight charges and other sales and delivery expen-
ses, commissions on sales as well as credit losses have been treated as opera-
ting expenses in the income statement. During the past financial year, the
principle of recognizing income from projects sold to customers has been
changed such that the customer projects are credited to income on a degree of
completion basis.
Other operating income
IItems entered in Other operating income include gains on the sale of fixed
assets depreciated according to plan, grants received and other income that is
not connected with the actual sale of goods and services. Losses on the sale of
fixed assets are entered in Other expenses.
Taxes
Direct taxes were recorded on a fixed-charge basis. For the first time, and in
accordance with the new Finnish Accounting Act, the change in the imputed
deferred tax liability has been recorded in the Group’s taxes. Correspondingly,
the change in the imputed deferred tax liability allocated to previous financial
years is recorded under extraordinary items. The imputed tax assets are based
on the periodisation differences between accounting and taxation, and the
change in accounting practices had a positive effect of FIM 2.0 million on the
result for the financial year.
Transactions in foreign currency
Balance sheet receivables and liabilities denominated in foreign currency have
been valued at the average rate quoted by the Bank of Finland on the balance
sheet date. Transactions denominated in foreign currency are booked at the
exchange rate on the date of transaction. The exchange rate differences arising
from derivative contracts taken out to hedge the currency position are booked
to financial income and expenses.
Pensions and pension liability coverage
The personnel’s pension security is handled through separate pension insuran-
ce companies. The pension insurance contributions are periodised to corres-
pond to the accrual-based wages and salaries on the balance sheet date. There
is no unfunded pension liability
Leasing
Leasing payments are treated as rental expenses. Unpaid leasing instalments
are stated as a leasing liability in the Notes to the financial statements.
Fixed assets and depreciation
The balance sheet values of fixed assets are based on the original acquisition
values less the annual depreciation according to plan. The depreciation accor-
ding to plan consists of straight-line depreciation that is calculated on the basis
of the estimated economic life of the assets. The depreciation periods used are
itemized in the Notes to the financial statements. The depreciation period of
fixed asset investments acquired during the financial year begins from the first
of the month following the month when the acquisition or purchase was
made. The expenses arising from the development of the new generation of
assembly products are capitalised in R&D expenses, which are amortised over
3 to 5 years; as of 1997, the depreciation period has been 3 years.
Inventories
Inventories are stated in the balance sheet according to the fifo principle in
accordance with the expenses of purchasing or manufacturing them or their
probable market value, whichever is lower.
Compulsory reserves
Recognized expenses which are no longer estimated to generate corresponding
income are stated as expenses in the income statement and entered in accrued
liabilities and prepaid expenses in the balance sheet. Compulsory reserves
comprise the warranty and refitting reserves for goods and services sold as
well as any known possible losses on work in progress.

28
page
GROUP PARENT COMPANY1998 1997 1998 1997
TURNOVER BY MARKET AREA (FIM 1000)
Finland 18 % 22 768.0 22 664.0 20 294.3 20 957.1Other Nordic countries 25 % 31 883.2 22 265.1 31 770.8 22 265.1Europe 36 % 45 796.2 21 547.5 45 804.9 21 547.5America 21 % 27 619.5 4 703.3 25 321.5 4 703.3Total 100 % 128 066.9 71 179.9 123 191.5 69 473.0
DEPRECIATION
Non-current assets are recorded in the balance sheet at the acquisition cost minus depreciation according to plan.Depreciation according to plan has been calculated from the acquisition cost on a straight-line basis according to the estimatedeconomic life of the assets.
The depreciation periods applied and the percentages corresponding to them are:
Goodwill *) 5 years 20.0 %Goodwill II ** 10 years 10.0 %R&D expenses 3–5 years 20.0–33.3 %Intangible rights 5 years 20.0 %Other long-term expenditures 3–10 years 10.0–33.3 %Buildings and structures 25 years 4.0 %Machinery and equipment 4–7 years 25.0–14.3 %Boats 15 years 6.7 %
*) Goodwill booked on the acquisition of PMJ automec USA, Inc. (Global Integration Inc.).**) Goodwill booked on the business operations that were purchased when the company was acquired.
GROUP PARENT COMPANY1998 1997 1998 1997
DEPRECIATION BY BALANCE SHEET GROUP (FIM 1000)
Incorporation expenditure 167.7 114.3 163.8 111.5R&D expenses 1 877.9 1 844.1 1 916.9 1 937.7Intangible rights 204.3 149.7 204.3 149.7Goodwill II 70.1 70.1 70.1 70.1Goodwill 438.6Other long-term expenditures 568.6 196.7 568.6 196.7Buildings and structures 136.6 72.0 136.6 72.0Machinery and equipment 1 072.2 547.4 674.5 471.7Total 4 536.0 2 994.3 3 734.8 3 009.4
CHANGE IN COMPULSORY RESERVES (FIM 1000)Change in declared profits reservesincrease 1 035.0 1 035.0
Notes to the Financial Statements
Notes concerning the Income Statements

29
page
GROUP PARENT COMPANY1998 1997 1998 1997
SHARE AND INTEREST INCOME AND INTEREST EXPENSESIncome from holdings in other companiesFrom Group companies 83.3Income from holdings in other companies, total 83.3
Interest incomeFrom Group companies 131.2From others 413.7 127.3 412.0 127.3Interest income, total 413.7 127.3 543.2 127.3
Interest expensesTo Group companies 75.8To others 1 139.7 2 229.4 1 022.1 2 188.3Interest expenses, total 1 139.7 2 229.4 1 097.9 2 188.3
EXTRAORDINARY ITEMSExtraordinary income FIM 0.5 million is the share of the change in imputed tax assets allocated to the previous financial year.
Notes concerning the assets in the balance sheetUNAMORTISED CAPITALISED INCORPORATION EXPENDITURES
The incorporation expenditures are primarily the capitalized expenditures in connection with the incorporation of the US subsidiary.
UNAMORTISED CAPITALISED R&D EXPENSESDuring the financial year, a total of FIM 3.0 million in R&D expenses, which were accumulated during the development of the new gene-ration of assembly products, were capitalised under R&D expenses in the balance sheet. The performance, usability and peripheral de-vices of the new product family have been upgraded to meet the rapidly-changing requirements of customers.R&D has focused on all HiSAC® versions, as well as the assambly, soldering, depaneling, multifunction, and final assembly cell forodd-form components, including the development of robotic mechanics, peripheral device solutions and a control system for the cells.The R&D expenses capitalised for the 1998 financial year fulfil the preconditions set in subsection 2 of article 8 in chapter 5 of theAccounting Act.
GROUP PARENT COMPANY1998 1997 1998 1997
PREPAID EXPENSES AND ACCRUED INCOME (FIM1000)Contributions 2 055.2 1 409.9 2 055.2 1 409.9VAT receivables 2 377.1 267.2 2 377.1 267.2Income tax assets 1 064.7 1 064.7Other accured income 778.9 541.5 556.4 522.1Total 5 211.2 3 283.3 4 988.7 3 263.9
RECEIVABLES FROM GROUP COMPANIES (FIM 1000)
Sales receivables 14 834.7Loan receivables 1 726.7 19.1Total 16 561.4 19.1
RECEIVABLES FROM ASSOCIATED COMPANIES (FIM 1000)
Sales receivables 110.9 110.9Total 110.9 110.9

30
page
GROUP PARENT COMPANY1998 1997 1998 1997
CHANGES IN FIXED ASSETS (FIM 1000)
Intangible goodsAcquisition cost at start of financial year
Incorporation expenditure 533.1 271.5 491.3 271.5R&D expenses 10 364.7 7 284.1 10 481.7 7 401.1Intangible rights 991.4 769.2 991.4 769.2Goodwill II 701.5 701.5 701.5 701.5Other long-term expenses 1 242.7 705.9 1 242.7 705.9Goodwill
IncreasesIncorporation expenditure 0.0 261.6 0.0 219.8R&D expenses 3 038.6 3 080.6 3 038.6 3 080.6Intangible rights 540.5 222.2 495.0 222.2Other long-term expenses 1 581.1 536.8 1 536.6 536.8Goodwill 1 087.4
Accumulated depreciation at start of financial yearIncorporation expenditure 152.0 37.7 149.2 37.7R&D expenses 4 864.0 3 019.9 4 942.0 3 004.3Intangible rights 446.8 297.1 446.8 297.1Goodwill II 557.7 487.6 557.7 487.6Other long term expenses 323.0 126.3 323.0 126.3Goodwill
Depreciation for the periodIncorporation expenditure 165.9 114.3 163.8 111.5R&D expenses 1 877.9 1 844.1 1 916.9 1 937.7Intangible rights 204.3 149.7 204.3 149.7Goodwill II 70.1 70.1 70.1 70.1Other long-term expenses 568.6 196.7 568.6 196.7Goodwill 438.6
Carrying value at end of financial yearIncorporation expenditure 215.2 381.1 178.3 342.1R&D expenses* 6 661.4 5 500.7 6 661.4 5 539.8Intangible rights 880.8 544.6 835.3 544.6Goodwill II 73.7 143.8 73.7 143.8Other long-term expenses 1 932.2 919.7 1 887.7 919.7Goodwill 648.8
*) includes R&D expensesin process 4 916.3 3 080.6 4 916.3 3 080.6
Notes to the Financial Statements

31
page
GROUP PARENT COMPANY1998 1997 1998 1997
Tangible goodsAcquisition cost at start of financial year
Land and water areas 878.2 46.2 878.2 46.2Buildings and structures 3 297.3 801.3 3 297.3 801.3Machinery and equipment 6 366.4 5 231.0 5 725.7 4 788.3
IncreasesLand and water areas 0.0 832.0 0.0 832.0Buildings and structures 198.0 2 496.0 198.0 2 496.0Machinery and equipment 3 943.4 1 197.0 2 336.0 999.0
DecreasesMachinery and equipment 730.6 61.6 675.8 61.6
Accumulated depreciation at start of financial yearBuildings and structures 90.7 18.7 90.7 18.7Machinery and equipment 3 934.0 3 386.7 3 828.9 3 357.3
Accumulated depreciation on decreasesMachinery and equipment 291.5 53.3 273.7 53.3
Depreciation for the periodBuildings and structures 136.6 72.0 136.6 72.0Machinery and equipment 1 074.0 547.4 674.5 471.7
Carrying value at end of financial yearLand and water areas 878.2 878.2 878.2 878.2Buildings and structures 3 268.0 3 206.6 3 268.0 3 206.6Machinery and equipment 4 862.7 2 432.3 3 156.2 1 896.7
SHAREHOLDERS’ EQUITY (FIM 1000)
Changes in shareholders’ equityShare capital at start of financial year 3 261.3 2 898.3 3 261.3 2 898.3Decrease in share capital -135.0 -135.0Bonus issue 6 252.6 6 252.6Public issue 3 000.0 363.0 3 000.0 363.0Share capital at end of financial year 12 378.9 3 261.3 12 378.9 3 261.3
Share premium fund at start of financial yearDecrease in share capital 135.0 135.0Premium on share issue 36 920.0 36 920.0Share premium fund at end of financial year 37 055.0 37 055.0
Reserve fund at start of financial year 9 850.9 6 532.3 9 850.9 6 532.3Transfer to share capital -6 252.6 -6 252.6Premium on share issue 3 318.6 3 318.6Reserve fund at end of financial year 3 598.3 9 850.9 3 598.3 9 850.9
Retained earnings at start of financial year 2 979.8 2 446.5 3 581.9 3 241.4Dividend paid -227.6 -492.0 -187.6 -492.0Translation difference -36.7Net profit 7 883.7 1 025.3 8 003.6 832.5
Retained earnings at end of financial year 10 599.2 2 979.8 11 397.9 3 581.9
Notes concerning the liabilities in the balance sheet

32
page
GROUP PARENT COMPANY1998 1997 1998 1997
COMPULSORY RESERVES (FIM 1000)Declared profits reserves 1 355.0 320.0 1 355.0 320.0Warranty reserves 210.0 210.0 210.0 210.0Total 1 565.0 530.0 1 565.0 530.0
LONG-TERM LIABILITIES (FIM 1000)Long-term liabilities include items falling due in five years or more:
Loans from financial institutions 1 175.0 1 715.0 1 175.0 1 715.0Pension loans 751.8 1 022.9 751.8 1 022.9Other long-term liabilities 1 300.0 1 550.0 1 300.0 1 550.0Total 3 226.8 4 287.9 3 226.8 4 287.9
ACCRUED LIABILITIES AND PREPAID INCOME (FIM 1000)Interest periodisation 75.5 61.1 75.5 58.6Periodisation of personnel expenses 3 350.3 3 040.0 2 515.2 2 361.2VAT liability 218.5 728.7 562.8Income tax liability 2 360.5 466.0 2 143.2Provisions 1 179.6 1 179.6Other accrued liabilities and prepaid income 6 639.2 914.3 3 131.8 914.3Accrued liabilities and prepaid income, total 13 823.6 5 210.1 9 045.3 3 896.9
DEBTS TO GROUP COMPANIES (FIM 1000)Accounts payable 4 681.7 2 031.5Total 4 681.7 2 031.5
Pension loans 3 910.0 3 580.0 3 910.0 3 580.0Corporate mortgages granted 1 400.0 1 400.0 1 400.0 1 400.0Real-estate mortgages granted 1 100.0 600.0 1 100.0 600.0
Loans from financial institutions 10 545.0 9 892.2 10 545.0 9 892.2Corporate mortgages granted 7 900.0 9 300.0 7 900.0 8 600.0Real-estate mortgages granted 400.0 2 800.0 400.0 2 800.0
Other loans 2 550.0 2 800.0 2 550.0 2 800.0Real-estate mortgages granted 3 000.0 3 000.0 3 000.0 3 000.0
Given as collateralCorporate mortgages, total 9 300.0 10 700.0 9 300.0 10 000.0Real-estate mortgages, total 4 500.0 6 400.0 4 500.0 6 400.0
Unconditional guaranteesOn behalf of Group companies 500.0 1 074.6 500.0 1 074.6
Leasing commitmentsfalling due next year 64.6 154.5 23.1 54.6falling due later 86.8 323.1 21.2 48.4
In accordance with the terms of the agreement in question, the company exercised its option to redeem machinery during the leasingperiod.
GUARANTEES RESULTING FROM DERIVATIVE CONTRACTS (FIM 1000)Forward exchange contracts 12 737.0 5 217.5 12 737.0 5 217.5
Notes to the Financial Statements
COLLATERAL AND CONTINGENT LIABILITIES (FIM 1000)
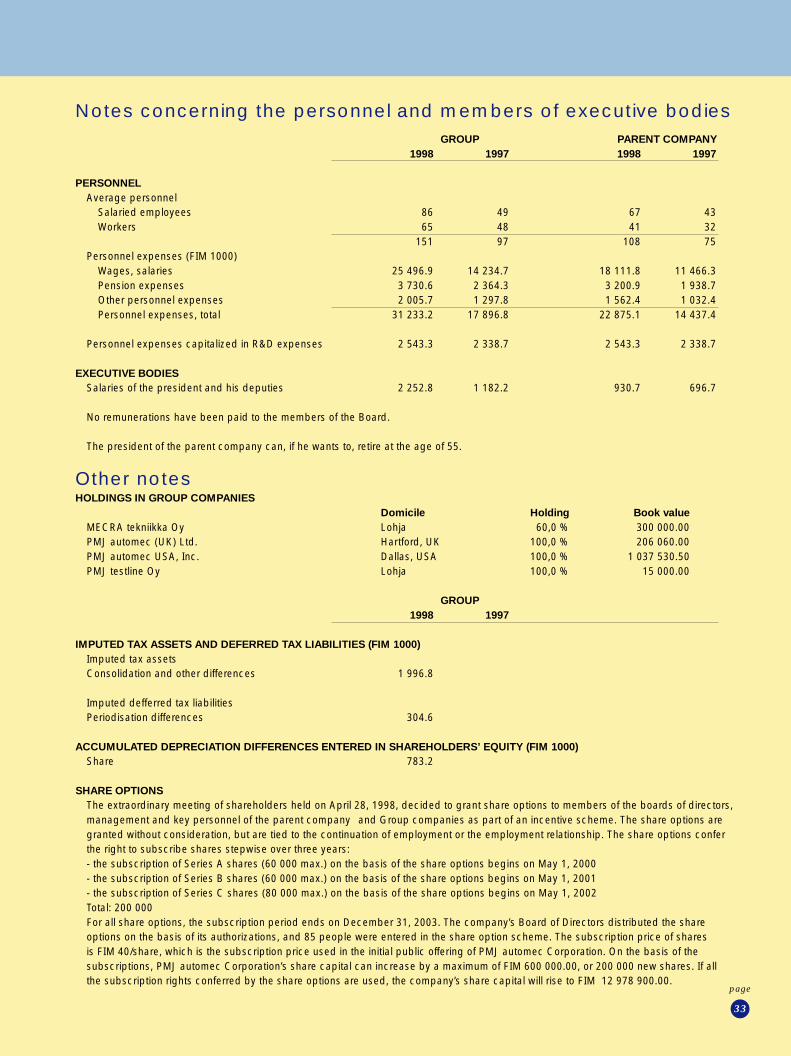
33
page
GROUP PARENT COMPANY1998 1997 1998 1997
PERSONNELAverage personnel
Salaried employees 86 49 67 43Workers 65 48 41 32
151 97 108 75Personnel expenses (FIM 1000)
Wages, salaries 25 496.9 14 234.7 18 111.8 11 466.3Pension expenses 3 730.6 2 364.3 3 200.9 1 938.7Other personnel expenses 2 005.7 1 297.8 1 562.4 1 032.4Personnel expenses, total 31 233.2 17 896.8 22 875.1 14 437.4
Personnel expenses capitalized in R&D expenses 2 543.3 2 338.7 2 543.3 2 338.7
EXECUTIVE BODIESSalaries of the president and his deputies 2 252.8 1 182.2 930.7 696.7
No remunerations have been paid to the members of the Board.
The president of the parent company can, if he wants to, retire at the age of 55.
HOLDINGS IN GROUP COMPANIESDomicile Holding Book value
MECRA tekniikka Oy Lohja 60,0 % 300 000.00PMJ automec (UK) Ltd. Hartford, UK 100,0 % 206 060.00PMJ automec USA, Inc. Dallas, USA 100,0 % 1 037 530.50PMJ testline Oy Lohja 100,0 % 15 000.00
GROUP1998 1997
IMPUTED TAX ASSETS AND DEFERRED TAX LIABILITIES (FIM 1000)Imputed tax assetsConsolidation and other differences 1 996.8
Imputed defferred tax liabilitiesPeriodisation differences 304.6
ACCUMULATED DEPRECIATION DIFFERENCES ENTERED IN SHAREHOLDERS’ EQUITY (FIM 1000)Share 783.2
SHARE OPTIONSThe extraordinary meeting of shareholders held on April 28, 1998, decided to grant share options to members of the boards of directors,management and key personnel of the parent company and Group companies as part of an incentive scheme. The share options aregranted without consideration, but are tied to the continuation of employment or the employment relationship. The share options conferthe right to subscribe shares stepwise over three years:- the subscription of Series A shares (60 000 max.) on the basis of the share options begins on May 1, 2000- the subscription of Series B shares (60 000 max.) on the basis of the share options begins on May 1, 2001- the subscription of Series C shares (80 000 max.) on the basis of the share options begins on May 1, 2002Total: 200 000For all share options, the subscription period ends on December 31, 2003. The company’s Board of Directors distributed the shareoptions on the basis of its authorizations, and 85 people were entered in the share option scheme. The subscription price of sharesis FIM 40/share, which is the subscription price used in the initial public offering of PMJ automec Corporation. On the basis of thesubscriptions, PMJ automec Corporation’s share capital can increase by a maximum of FIM 600 000.00, or 200 000 new shares. If allthe subscription rights conferred by the share options are used, the company’s share capital will rise to FIM 12 978 900.00.
Notes concerning the personnel and members of executive bodies
Other notes

34
page
1998 1997 1995–96 1994–95 1993–9412 months 12 months 14 months 12months 12 months
Turnover 128 066.9 71 179.9 61 750.2 51 043.2 25 804.1
Operating profit/loss 11 717.6 4 492.6 5 230.3 8 053.9 2 481.2% of turnover 9.1 6.3 8.5 15.8 9.6
Profit before extraordinary items, reservesand taxes 10 529.8 2 390.4 3 714.3 7 448.2 1 994.0% of turnover 8.2 3.4 6.0 14.6 7.7
Profit before reserves and taxes 11 017.8 2 390.4 3 714.3 7 488.8 2 568.2% of turnover 8.6 3.4 6.0 14.7 10.0
Return on equity (ROE), % 19.1 10.1 28.3 161.6 neg.
Return on investment (ROI), % 20.9 16.8 36.1 87.6 35.6
Equity ratio, % 59.1 35.5 40.3 26.6 13.0
Gearing ratio, % -5.5 91.1 52.9 87.6 207.0
Interest-free liabilities 28 364.8 17 755.4 13 128.0 14 790.1 9 185.7
Gross investments in fixed assets 10 384.7 8 741.9 6 065.0 2 703.1 1 681.3% of turnover 8.1 12.3 9.8 5.3 6.5
Research and development expenses 7 335.6 4 087.7 3 795.0 2 017,1 1 122.0% of turnover 5.7 5.7 6,1 4.0 4.3
Order backlog, FIM million 46.0 24.4 12.0 19.0 17.0
Personnel 151 97 80 50 40
Earnings/share, FIM/share 1.96 0.33 1.29 *) 11.44 4.72
Shareholders’ equity/share, FIM 15.17 5.04 4.36 12.60 4.22
Dividend/share, FIM 0.40 **) 0.06 0.18 1.20 -
Dividend/earnings, % 20.4 18.0 13.8 10.5 -
Dividend yield, % 0.35
Price earning ratio P/E 57.8
Adjusted average number of sharesduring the financial yea 3 775 615 3 028 800 1 664 100 490 050 422 550
Adjusted number of sharesat the end of the financial year 4 126 300 3 126 300 2 763 300 400 050 535 050
*) The profit for the financial year has been calculated on a 12-month basis.
**) The Board of Directors`proposal
Key ratios (FIM 1000)
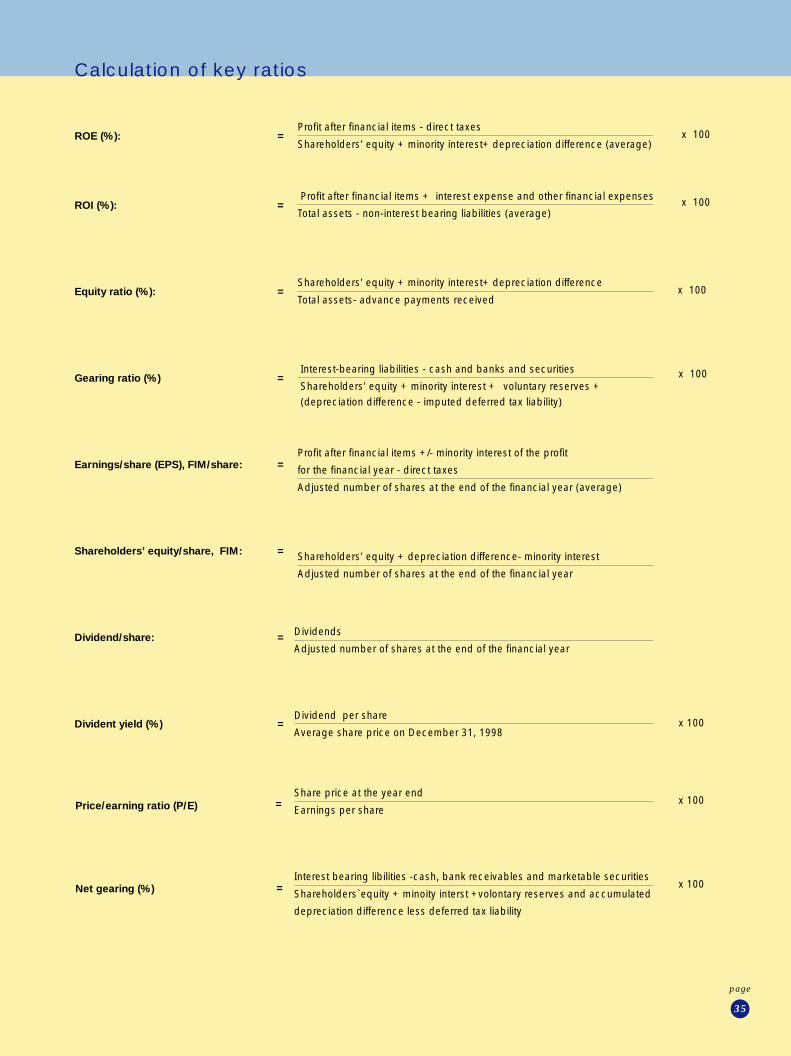
35
page
Profit after financial items - direct taxes
Shareholders’ equity + minority interest+ depreciation difference (average)
Profit after financial items + interest expense and other financial expenses
Total assets - non-interest bearing liabilities (average)
Shareholders’ equity + minority interest+ depreciation difference
Total assets- advance payments received
Interest-bearing liabilities - cash and banks and securities
Shareholders’ equity + minority interest + voluntary reserves + (depreciation difference - imputed deferred tax liability)
Profit after financial items +/- minority interest of the profit
for the financial year - direct taxes
Adjusted number of shares at the end of the financial year (average)
Shareholders’ equity + depreciation difference- minority interest
Adjusted number of shares at the end of the financial year
ROE (%): =
ROI (%): =
Equity ratio (%): =
Gearing ratio (%) =
Earnings/share (EPS), FIM/share: =
Shareholders’ equity/share, FIM: =
Dividend/share: =
Divident yield (%) =
Calculation of key ratios
Dividends
Adjusted number of shares at the end of the financial year
Dividend per sharex 100
Average share price on December 31, 1998
Price/earning ratio (P/E)Share price at the year end
x 100Earnings per share
Interest bearing libilities -cash, bank receivables and marketable securitiesx 100
Shareholders`equity + minoity interst +volontary reserves and accumulated
depreciation difference less deferred tax liability
Net gearing (%)
=
=
x 100
x 100
x 100
x 100

36
page
1998 1997 1995–96 1994–95 1993–9412 months 12 months 14 months 12 months 12 months
Turnover 21 539.3 11 971.6 10 385.6 8 584.8 4 339.9
Operating profit/loss 1 970.8 755.6 879.7 1 354.6 417.3% of turnover 9.1 6.3 8.5 15.8 9.6
Profit before extraordinary items, reservesand taxes 1 771.0 402.0 624.7 1 252.7 335.4% of turnover 8.2 3.4 6.0 14.6 7.7
Profit before reserves and taxes 1 853.1 402.0 624.7 1 259.5 431.9% of turnover 8.6 3.4 6.0 14.7 10.0
Return on equity (ROE), % 19.1 10.1 28.3 161.6 neg.
Return on investment (ROI), % 20.9 16.8 36.1 87.6 35.6
Equity ratio, % 59.1 35.5 40.3 26.6 13.0
Gearing ratio, % -5.5 91.1 52.9 87.6 207.0
Interest-free liabilities 4 770.6 2 986.2 2 208.0 2 487.5 1 544.9
Gross investments in fixed assets 1 746.6 1 470.3 1 020.1 454.6 282.8% of turnover 8.1 12.3 9.8 5.3 6.5
Research and development expenses 1 233.6 687.5 638.3 339.3 188.7% of turnover 5.7 5.7 6.1 4.0 4.3
Order backlog, million 7.6 4.1 2.0 3.2 2.9
Personnel 151 97 80 50 40
Earnings per share 0.33 0.06 0.22 *) 1.92 0.79
Shareholders’ equity/share 2.55 0.85 0.73 2.21 0.71
Dividend/share 0.07 **) 0.01 0.03 0.20 -
Dividend/earnings, % 20.4 18.0 13.8 10.5 -
Dividend yield, % 0.35
Price earning ratio, P/E 57.8
Adjusted average number of sharesduring the financial year 3 775 615 3 028 800 1 664 100 490 050 422 550
Adjusted number of sharesat the end of the financial year 4 126 300 3 126 300 2 763 300 400 050 535 050
*) The profit for the financial year has been calculated on a 12-month basis.
**) The Board of Director`s proposal
Key ratios (EUR 1000)
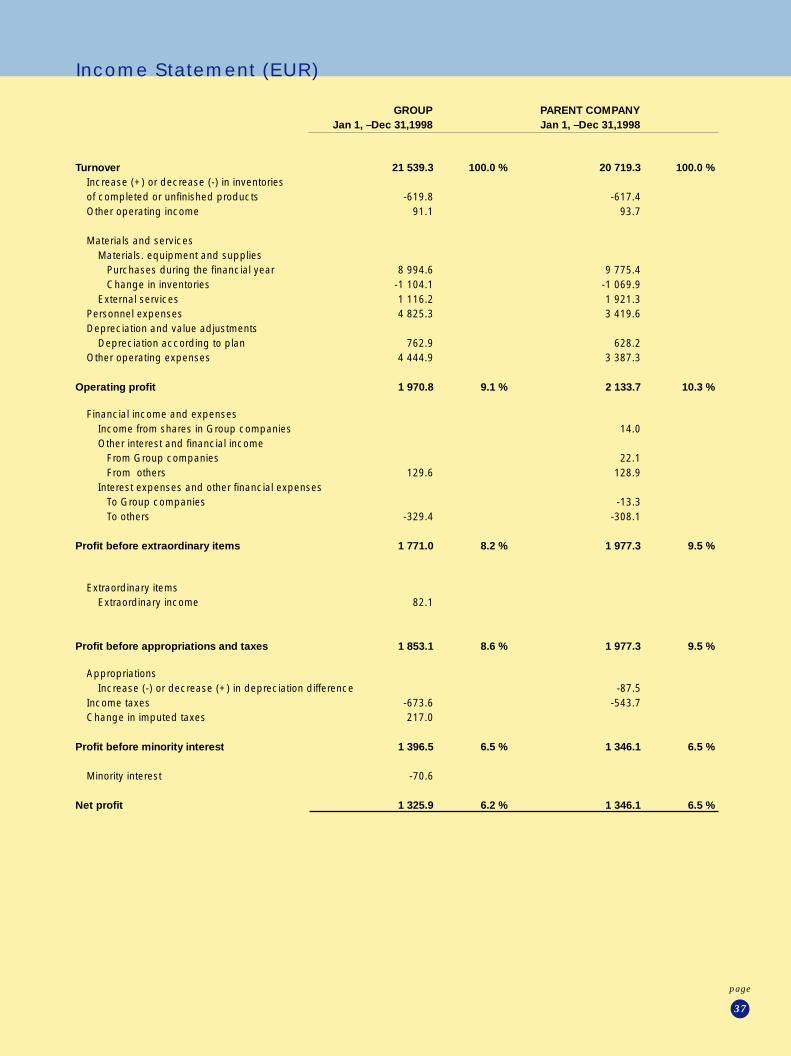
37
page
Income Statement (EUR)
Turnover 21 539.3 100.0 % 20 719.3 100.0 %Increase (+) or decrease (-) in inventoriesof completed or unfinished products -619.8 -617.4Other operating income 91.1 93.7
Materials and servicesMaterials. equipment and supplies Purchases during the financial year 8 994.6 9 775.4 Change in inventories -1 104.1 -1 069.9External services 1 116.2 1 921.3
Personnel expenses 4 825.3 3 419.6Depreciation and value adjustments
Depreciation according to plan 762.9 628.2Other operating expenses 4 444.9 3 387.3
Operating profit 1 970.8 9.1 % 2 133.7 10.3 %
Financial income and expensesIncome from shares in Group companies 14.0Other interest and financial income From Group companies 22.1 From others 129.6 128.9Interest expenses and other financial expenses To Group companies -13.3 To others -329.4 -308.1
Profit before extraordinary items 1 771.0 8.2 % 1 977.3 9.5 %
Extraordinary itemsExtraordinary income 82.1
Profit before appropriations and taxes 1 853.1 8.6 % 1 977.3 9.5 %
AppropriationsIncrease (-) or decrease (+) in depreciation difference -87.5
Income taxes -673.6 -543.7Change in imputed taxes 217.0
Profit before minority interest 1 396.5 6.5 % 1 346.1 6.5 %
Minority interest -70.6
Net profit 1 325.9 6.2 % 1 346.1 6.5 %
GROUP PARENT COMPANYJan 1, –Dec 31,1998 Jan 1, –Dec 31,1998

38
page
GROUP PARENT COMPANYDec.31, 1998 Dec.31, 1998
ASSETSFixed assets
Intangible assetsIncorporation expenditure 36.2 30.0R&D expenses 293.5 293.5Intangible rights 148.1 140.5Goodwill 12.4 12.4Other long-term expenses 325.0 317.4R&D projects in progress 826.9 826.9
1 642. 1 1 620. 7
Tangible assets Land and water areas 147.7 147.7 Buildings and structures 549.6 549.6Machinery and equipment 817.9 530.9
1 515.2 1 228.2Investments
Shares in Group companies 262.1Other shares and participations 21.1 20.1Goodwill 109.1
130.2 282.2
3 287.5 3 131.1
Variable assets Inventories
Materials and supplies 1 500.2 1 421.9Work in process 682.0 682.0Production in process 1 364.8 936.8Completed products and goods 637.1 191.9
4 184.1 3 232.6
ReceivablesShort-term
Sales receivables 6 599.6 5 112.8Receivables from Group companies 2 785.4Loan receivables 3.8 2.3Other receivables 15.4Prepaid expenses and accrued income 876,5 839,1Deferred tax assets 335.8
7831.1 8 739.6
Cash in hand and banks 3 518.7 3 335.2
Assets, total 18 821.4 18 438.5
Balance Sheet (EUR)

39
page
GROUP PARENT COMPANYDec.31, 1998 Dec.31, 1998
LIABILITIESShareholders’ equity
Share capital 2 082.0 2 082.0Share premium fund 6 232.2 6 232.2Reserve fund 605.2 605.2Translation difference -2.8Retained earnings 459.5 570.9Book profit 1 325.9 1 346.1
10 702.0 10 836.4
Minority interest 173.0
Accumulated depreciationDepreciation difference 139.3
Compulsory reservesOther compulsory reserves 263.2 263.2
LiabilitiesLong-term
Loans from financial institutions 1 499.8 1 468.3Pension loans 551.4 551.4Other loans 386.8 386.8
2 438.0 2 406.5Short-term
Loans from financial institutions 326.3 305.3Pension loans 106.2 106.2Advances received 409.3 409.3Accounts payable 1 890.9 1 621.1Debts to Group companies 787.4Other loans 136.3 42.5Accrued liabilities and prepaid income 2 325.0 1 521.3Deferred tax liabilities 51.2
5 245.2 4 793.1
Liabilities , total 18 821.4 18 438.5

40
page
Virkkala, March 9,1999
Heikki Kiesi Jarmo Kanervo
Turo Levänen Markku Jokela
The Group’s non-restricted and distributable shareholders’ equity 9 637 564.43 mk
The Parent company’s non-restricted equity 11 219 569.29 mkof which the net profit is: 8 003 561.37 mk
PMJ automec Corporation’s Board of Directors proposes that the earnings be disposed of asfollows:
- a dividend of FIM 0.40 be paid per share: 1 650 520.00 mk- and retained in non-restricted equity: 9 569 049.29 mk
11 219 569.29 mk
Proposal for the distribution of profits
To the shareholders of PMJ automec Corporation:
We have examined the accounting records, consolidated financial statements and administration of PMJ automec Corporation for thefinancial year January 1–December 31, 1998. The financial statements prepared by the Board of Directors and the President include thereport of the Board of Directors as well as the consolidated and parent company income statement, balance sheet and notes to thefinancial statements. Based on our audit, we express an opinion on these financial statements and the company’s administration.
The audit has been conducted in accordance with generally accepted auditing standards. The accounting records as well as theaccounting policy, content and format of the financial statements have accordingly been examined to a sufficient extent to ascertain thatthe financial statements do not contain material errors or deficiencies. The purpose of our audit of the company’s administration has beento determine whether the Board of Directors and the President have complied with the rules and regulations of the Finnish Companies Act.
In our opinion, the financial statements have been prepared in accordance with the Finnish Accounting Act and the other rules andregulations concerning the preparation of financial statements in Finland. The financial statements give a fair and true view, as defined inthe Accounting Act, of both the consolidated and parent company result of operations as well as of the financial position. The financialstatements including the consolidated financial statements can be adopted and the Board of Directors and the President of the parentcompany can be discharged from liability for the financial year audited by us. The proposal of the Board of Directors for dealing with theearnings is in compliance with the Finnish Companies Act.
Helsinki, March 11, 1999
SVH Pricewaterhouse Coopers OyAuthorised Public Accountants
Esko SaarinenAuthorised Public Accountant
Auditors’ report
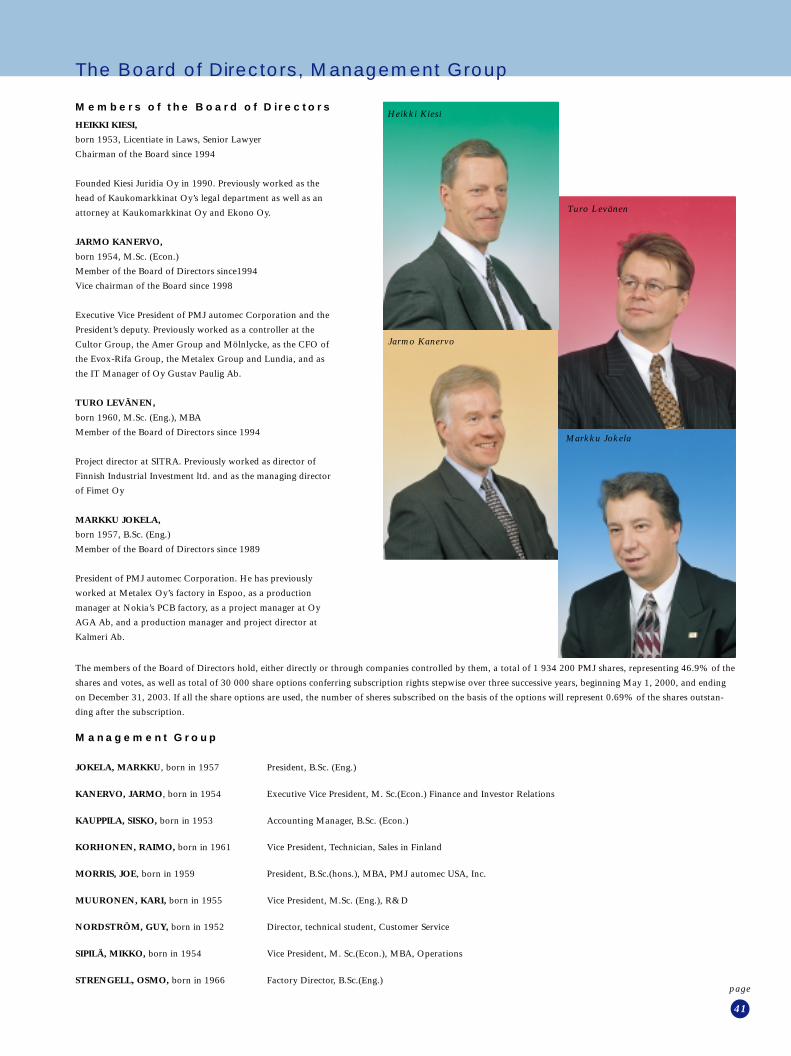
41
page
Heikki Kiesi
Jarmo Kanervo
Turo Levänen
Markku Jokela
Members of the Board of Directors
HEIKKI KIESI,
born 1953, Licentiate in Laws, Senior Lawyer
Chairman of the Board since 1994
Founded Kiesi Juridia Oy in 1990. Previously worked as the
head of Kaukomarkkinat Oy’s legal department as well as an
attorney at Kaukomarkkinat Oy and Ekono Oy.
JARMO KANERVO,
born 1954, M.Sc. (Econ.)
Member of the Board of Directors since1994
Vice chairman of the Board since 1998
Executive Vice President of PMJ automec Corporation and the
President’s deputy. Previously worked as a controller at the
Cultor Group, the Amer Group and Mölnlycke, as the CFO of
the Evox-Rifa Group, the Metalex Group and Lundia, and as
the IT Manager of Oy Gustav Paulig Ab.
TURO LEVÄNEN,
born 1960, M.Sc. (Eng.), MBA
Member of the Board of Directors since 1994
Project director at SITRA. Previously worked as director of
Finnish Industrial Investment ltd. and as the managing director
of Fimet Oy
MARKKU JOKELA,
born 1957, B.Sc. (Eng.)
Member of the Board of Directors since 1989
President of PMJ automec Corporation. He has previously
worked at Metalex Oy’s factory in Espoo, as a production
manager at Nokia’s PCB factory, as a project manager at Oy
AGA Ab, and a production manager and project director at
Kalmeri Ab.
Management Group
JOKELA, MARKKU, born in 1957 President, B.Sc. (Eng.)
KANERVO, JARMO, born in 1954 Executive Vice President, M. Sc.(Econ.) Finance and Investor Relations
KAUPPILA, SISKO, born in 1953 Accounting Manager, B.Sc. (Econ.)
KORHONEN, RAIMO, born in 1961 Vice President, Technician, Sales in Finland
MORRIS, JOE, born in 1959 President, B.Sc.(hons.), MBA, PMJ automec USA, Inc.
MUURONEN, KARI, born in 1955 Vice President, M.Sc. (Eng.), R&D
NORDSTRÖM, GUY, born in 1952 Director, technical student, Customer Service
SIPILÄ, MIKKO, born in 1954 Vice President, M. Sc.(Econ.), MBA, Operations
STRENGELL, OSMO, born in 1966 Factory Director, B.Sc.(Eng.)
The Board of Directors, Management Group
The members of the Board of Directors hold, either directly or through companies controlled by them, a total of 1 934 200 PMJ shares, representing 46.9% of the
shares and votes, as well as total of 30 000 share options conferring subscription rights stepwise over three successive years, beginning May 1, 2000, and ending
on December 31, 2003. If all the share options are used, the number of sheres subscribed on the basis of the options will represent 0.69% of the shares outstan-
ding after the subscription.

42
page
5/98 8/98 12/98
700
600
500
400
300
200
100
0
120
100
80
60
40
20
0
5/98 6/98 7/98 9/98 9/98 10/98 11/98 12/98
Shares and share capital
PMJ automec Corporation has floated a total of 4,126,300 shares having a
par value of FIM 3 each, all of which confer one vote at a general meeting of
shareholders.
According to the Articles of Association, the company’s share capital shall
be a minimum of FIM 9 million and a maximum of FIM 36 million, within
which limits the share capital can be raised or lowered without amending the
Articles of Association. The company’s share capital, which has been fully
paid in and is recorded in the trade register, amounted to FIM 12,378,900 on
December 31, 1998. The company’s shares have been transferred to the book-
entry system.
Quotation of the shares
PMJ automec Corporation’s shares have been available for public trading
since May 15, 1998, and at present they are quoted on the I-list of HEX
Helsinki Exchanges.
The board of directors’ authorization toincrease the share capital
The Board of Directors of PMJ automec Corporation is not authorized to
increase the share capital.
Sharesholders
At the end of 1998, the company had 771 registered shareholders. A total of
41,613 PMJ shares were in foreign ownership, representing 1.01% of the
shares, and in addition there were 387,200 shares, or 9.38%, in the nominee
register.
The members of the company’s Board of Directors owned, either directly
or through companies controlled by them, a total of 1,934,200 PMJ shares,
representing 46.9% of all the voting rights.
Trend in share prices and share turnover
The company’s shares were first quoted on the OTC list maintained by HEX
Helsinki Exchanges on May 15, 1998. On the first day of trading, the share
price rose from the subscription price of FIM 40 to FIM 53. From May to
November, the share price fluctuated between FIM 42 and FIM 60. In De-
cember, the share price was FIM 120 at its highest, and stood at FIM 116 at
the end of the month. Share turnover was brisk, accounting for 1 774 355
pieces or 43% of the shares outstanding. The company’s market value was
FIM 478 million at the end of the financial year.
Share price development
Development of total turnover(in thousands)
Shares and Shareholders
During the financial year, the share price was FIM 42.00 at its lowest and
FIM 120.70 at it highest. The average share price during the review period
was FIM 57.83.

43
page
Type of shareholders Shares, No. %
Corporations 201 080 4.87 %Financial and insurance institutions 661 750 16.04 %Public organisations 74 900 1.82 %Non-profit organisations 120 900 2.93 %Householdes 2 584 957 62.65 %Foreign 428 813 10.39 %Pending list 53 900 1.30 %
Total 4 126 300 100.00 %
PRINCIPAL SHAREHOLDERS ON 31 DECEMBER 1998
Owners Shares, No. % of shares
Jokela, Markku 1 851 350 44.86 %Trust Fund Leonia Share 163 550 3.96 %Evli-Select Trust Fund 90 000 2.18 %Korhonen, Raimo 87 000 2.11 %FIM Forte Trust Fund 83 400 2.02 %The Finnish National Fund for Research and Development 66 000 1.60 %Jokela, Pirjo 66 000 1.60 %Jokela, Joni 66 000 1.60 %Evli Nordic Small Co.Trust Fund 64 000 1.55 %Trust Fund Evli Mix 50 300 1.22 %Nominee-registered 387 200 9.38 %Others 1 151 500 27.92 %
Total 4 126 300 100.00 %
OWNERSHIP STRUCTURE ON 31 DECEMBER 1998
Shareholders, Shares-/voting rights,Number of shares No. % No. %
1 - 9 999 731 94.80 % 541 950 13.13 %10 000–19 999 16 2.08 % 211 150 5.12 %20 000–29 999 9 1.17 % 201 900 4.89 %30 000–59 999 5 0.65 % 212 200 5.14 %60 000–89 999 6 0.78 % 432 400 10.48 %90 000– 4 0.52 % 2 472 800 59.94 %Pending list 53 900 1.30 %
Total 771 100.00 % 4 126 300 100.00 %
Public organisations 1,82%Foreign 10,39%Non-profit organisations 2,93%Pending list 1,30 %Financial and insuranceinstitutions 16,04%Corporations 4,87%Householdes 62,65%
OWNERSHIP STRUCTURE ON 31 DECEMBER 1998
44
page
News in brief
March 26, 1998 PMJ’s Annual GeneralMeeting
PMJ automec Corporation has decided to apply for listing on the OTC list
maintained by the Helsinki Exchanges. In order to expand its ownership base,
the company will carry out a rights issue and give share options to its key
employees. The issue and the share options will be decided on at an extraor-
dinary meeting of shareholders that will be convened separately. The com-
pany’s financial statements were adopted at the Annual General Meeting.
April 8, 1998 PMJ’s extraordinary meetingof shareholders
From April 20 to 27, 1998, PMJ automec Corporation will carry out a share
issue and offering with the aim of listing the company on the OTC list of the
Helsinki Exchanges. The shares will be offered to institutional investors, the
public and the Group’s own employees.
April 20, 1998 PMJ ’s share issue andoffering is suspended
At 15:15 on Monday, April 20, 1998, PMJ automec Corporation has decide-
to suspend the share issue and offering for institutional investors and retail
investors due to oversubscription resulting from large demand. The share
issue began today, Monday, April 20, 1998.
April 21, 1998 Cooperation agreementbetween Siemens and PMJ
The German company Siemens Electronic Assembly Systems and PMJ auto-
mec Corporation made agreement on the marketing and delivers of automa-
ted assembly equipment for odd-form components.
April 29, 1998 Final decision on PMJ’sshare issue and offering, and approvingthe subscription commitments
PMJ automec Corporation took its final decision on the share issue and offer-
ing. The total of 1,100,000 shares offered were oversubscribed almost eight-
fold during the offering. The subscription price of the shares was FIM 40.
Some 230 investors took part in the first Finnish share subscription to be held
over the Internet; the share issue and offering were open for six hours before
being closed due to oversubscription.
May 15, 1998 Market-making agreementbetween PMJ, the banking company EvliOyj, and HEX Helsinki Exchanges
PMJ automec Corporation, Evli Oy and Hex Oy have this day signed a mar-
ket-making agreement dealing with the listing of the company’s shares on the
OTC list in accordance with Article 10 of Chapter 3 of the OTC and broker’s
list regulations.
May 14, 1998 The increase of PMJ’s sharecapital is recorded in the trade register
The increase of PMJ automec Corporation’s share capital from FIM 9.378.900
to FIM 12.378.900 has been fully paid in and recorded in the trade register
on May 14, 1998. The company now has 4,126,300 shares, all of which con-
fer one vote. The new shares issued during the rights issue and the old shares
sold during the offering were recorded in the book-entry accounts of the par-
ticipating investors on May 14, 1998. The quoting of the shares on the OTC
list of the Helsinki Exchanges will begin tomorrow, May 15, 1998.
June 11, 1998 PMJ’s Interim Report,January 1 - April 30, 1998
The turnover of the PMJ automec Group doubled in January-April 1998
compared to the previous period, and amounted to FIM 33.8 million (1997:
FIM 14.7 million). In addition, operating profit during the review period
grew significantly and was FIM 1.8 million (1997: -1.5 million), which repre-
sents 5.4% of turnover. Profit before extraordinary items was FIM 1.2 milli-
on (FIM -2.4 million), which is 3.7% of turnover. Turnover is expected to
continue growing strongly.
July 6, 1998 PMJ hits a record high in June
PMJ automec Corporation has landed purchase orders worth of FIM 22
million during the month of June. Almost without an exception, the deliveries
will be made abroad, such as to Italy, which is a new territory for the compa-
ny. In addition, the company has won major orders, including an order from
ABB in Sweden.
August 25, 1998 PMJ had a strong summerseason
PMJ automec Corporation has won orders worth around FIM 50 million
during the summer. These orders were placed by numerous customers repre-
senting different industries in Europe and the USA, including customers from
the consumer electronics industry, with which PMJ has not previously done
business with. Among these companies is the Danish Bang&Olufsen. During
the last 12 months, PMJ has landed new orders to the tune of approximately
FIM 140 million.
October 8, 1998 PMJ’s Interim Report,January 1 - August 31, 1998
PMJ automec Corporation’s turnover grew by 138% during the period from
January 1 to August 31, 1998, and was FIM 74.8 million (1997: FIM 31.5
million). Profit before extraordinary items also grew noticeably during the
review period, amounting to FIM 7.7 million (1997: -3.3 million), represen-
ting 10.3% of turnover. The company has continued to grow in all of its main
market areas. The result is expected to develop favourably during the last
four months of the year, too.
November 26, 1998 PMJ wins more ordersfrom Osram and Motorola
PMJ automec Corporation has received more orders both from Motorola and
Osram. These orders are valued at a total of over FIM 10 million and strengt-
hen PMJ’s relationship with its customers.
December 3, 1998
PMJ lands an order for a final assembly line from Nokia
PMJ automec Corporation has won a purchase order from Nokia. This order,
which is worth approximately FIM 7 million, comprises the installation of a
final assembly line at a Nokia factory in early spring 1999. This is the first
final assembly line to be delivered that includes many of the automatic as-
sembly cells which were developed by PMJ during 1998 and are the fastest,
most flexible final assembly cells on the market.
December 7, 1998 PMJ collaborates withAlcatel France to supply productionequipment
PMJ automec Corporation has signed a significant collaboration agreement
with the French telecommunications company Alcatel. PMJ will deliver two
automated production lines to the Alcatel factory in Laval, France. This is
PMJ’s first delivery to the French market.

Product list and glossary
Contact informationPMJ automec CorporationMaksjoentie 11FIN-08700 VirkkalaTel. +358-19-388122Fax: +358-19-388130
PMJ automec Deutschland GmbHMerkurstrasse 60D-67663 Kaiserslautern, GermanyTel. +49-631-534 0327Fax: +49-631-534 0348
PMJ automec Sweden ABBOX 36S-150 21 Mölnbo, SwedenTel. +46-158-367 10Fax: +46-158-605 12
PMJ automec (UK) Ltd.Whitehall, 75 School LaneHartford, Cheshire CW8 1PF, UKTel. +44-1606-781 465Fax: +44-1606-742 03
PMJ automec USA, Inc.2550 114th Str. 170Grand Prairie, TX 75050, USATel. +1-972-660 1151Fax: +1-972-660 1106
www.pmjautomec.com
PMJ’s automation and PCB handlingequipment for end-of-line automation ofelectronics manufacture
HiSAC®-products:
• Depanelling cells
• Final assembly cells
• Labeling cells
• Multifunction cells
• Odd-form PCB assembly cells
• Pin insertion cells
• Soft beam® soldering cells
• Soldering cells
• Test cells
PCB handling equipment:
• Conveyors
• Destackers
• Flip units
• LIFO/FIFO Buffers
• Magazine loaders/line unloaders
• Overhead conveyors
• Turn units
• Walk trough conveyors
Hisac (High Speed Assembly Cell)=
PMJ’s registered product name
In-line production cell =
Production equipment that can be connected to form an integral part of
the production line
Soldering cell =
A piece of equipment that is used in electronics manufacture to solder
components to a PCB
Depaneling cell =
A piece of equipment that is used in electronics manufacture whereby
PCBs are cut free from their panels. The types of depaneling cells are
• Bottom router = the depaneling is done from underneath the PCB
• Top router = the depanelling is done from above the PCB
Assembly cell =
A piece of equipment used in electronics manufacture whereby compo-
nents are assembled on a PCB
Final assembly cell =
A piece of equipment, especially developed for production of mobile
phones, that is used for assembly of (mobile phone) parts to make an end
product
Modular production cell =
A production cell consisting of independent modules, e.g. PMJ’s HiSAC®
module
Module =
An independent part of a production cell
Multifunction cell =
A piece of equipment used in the electronics manufacture where several
different tasks (up to 7) can be performed in the same call
PCB handling equipment =
Equipment that has been developed for transporting and handling PCBs
between cells, for example, a conveyor, a magazine loader/line unloader, a
destacker and a flip unit.
Labeling cell =
A piece of equipment that is used to place a label on a PCB. The label
makes it easier to indentify and to trace the product.
Test fixture =
A part of a test cell
Test cell =
A piece of equipment used in the electronics manufacture to verify the
faultlessness of the manufactured product.

Completing the line
PMJ automec CorporationMaksjoentie 11FIN-08700 VirkkalaTel. +358-19-388 122Fax: +358-19-388 130www.pmjautomec.com