pleurisy in pigs - ahdb porkpork.ahdb.org.uk/media/2689/pleurisy_project.pdf · pleurisy in pigs:...
TRANSCRIPT

© 2009 BPEX. All Rights Reserved.
Pleurisy in Pigs:
Associated risk factors and impact on health, welfare
and performance
A study commissioned by BPEX and undertaken by:
Department of Veterinary Medicine, University of Cambridge HJ Jaeger, TJ McKinley, GP Pearce, AW Tucker, JLN Wood
Veterinary Laboratories Agency S Done, B Strugnell, S Williamson, N Woodger
Bowes of Norfolk Ltd J Burling
BQP Ltd H. Habernoll
Yorkwold PigPro Ltd J Dewhirst
Report prepared 28 March 2009: AW Tucker, TJ McKinley, HJ Jaeger.

© 2009 BPEX. All Rights Reserved.
Contents 1. Summary and aims 3
2. Objectives 5
3. Introduction and literature review 6
4. Retrospective case‐control study of risk factors for pleurisy 11
5. Prospective study of health, welfare and economic impacts of pleurisy 20
6. Necropsy investigation of production units with a consistent pleurisy problem at slaughter 36
7. Knowledge transfer: practical guidance on pleurisy for BPEX 61
8. References 64
9. Annexes 66
Annex 1: Retrospective case‐control study of risk factors for pleurisy 66
Annex 2: Prospective study of health, welfare and economic impacts of pleurisy 68
Annex 3. Necropsy study 73
This document is prepared for information purposes only. No responsibility is taken by BPEX for any inaccuracies or omissions it may contain.

Summary 3
© 2009 BPEX. All Rights Reserved.
1. Summary This project set out to generate evidence based approaches to the investigation and control of pleurisy in the UK pig population. The introduction of the British Pig Health Scheme and systematic monitoring of pathology in slaughter pigs has highlighted the prevalence of pleurisy. Data from BPHS up to 2006 indicated that 68% of all batches monitored were affected by pleurisy to some degree and 14% of all individual pigs monitored showed signs of pleurisy. However, while much work has been published on risk factors for respiratory disease in general, little has been published on the infectious and non‐infectious factors that underlie this condition. Even less has been published on the economic consequences of pleurisy for the producer and processor. The core aims of this project were: a. To determine the relative importance of on‐farm risk factors for pleurisy thereby informing new
preventive strategies. b. To quantify the impact of pleurisy on:
• Production costs before and after processing. • Objective measures of health and welfare during production.
c. To assess the relative importance of the current known causal agents of pleurisy in the UK. d. To provide this information in a format suitable for knowledge transfer to producers, veterinarians,
and processors. Taking each of these aims in turn, our key findings in relation to on‐farm risk or protective factors came from a carefully designed case control study of UK finisher units with consistently high or low pleurisy prevalence according to BPHS data. We found that managemental risk factors for pleurisy included production system type (especially farrow‐to‐finish systems), incomplete application or absence of all‐in all‐out production flow, and repeated mixing or moving of pigs between weaning and slaughter. Some managemental practices were protective and these included cleaning and disinfection of finisher accommodation between batches, and the allowance of down‐time between batches for grower and finisher batches. Sourcing from a higher number of breeders by batch finishers in multi‐site operations was a key risk factor in our prospective study. We found that pleurisy affected units were more likely to have experienced consistently raised mortality in post‐weaning pigs, to have showed respiratory symptoms in pigs through the post‐weaning period, to have reported disease due to Actinobacillus pleuropneumoniae, and finally to have experienced wasting associated disease during 2007. The important role of infectious disease was supported by strong associations between batches that had seroconverted (been exposed) to A. pleuropneumoniae, swine influenza, porcine reproductive respiratory syndrome virus (PRRSV), and Mycoplasma hyopneumoniae. We found clear indications of the substantial economic impact of pleurisy (and associated respiratory diseases that were likely underlying the pleurisy). We showed that a simple measure of total pleurisy prevalence for a subset of 50 pigs was as informative as either a more complex calculation of a pleurisy index that measured both prevalence and severity, or an assessment of pleurisy using Meat Hygiene Service data collected for the entire batch (up to 5000 pigs). Through an extensive prospective survey of 80 batches of slaughter pigs (approximately 95,000 pigs) we found increasing pleurisy prevalence was associated with reduced carcase weight (measured after any trimming) and increased age at slaughter. Similarly, daily weight gain, calculated by 2 methods, was also adversely affected. Costs to the producer, for a typical 10% pleurisy prevalence at batch level were found to be in the order of 226p/pig (based on stated assumptions) – based on reduced carcase weight and increased age at slaughter. We found that post‐weaning mortality rates on units with a long term consistent pleurisy problem were on average

Summary 4
© 2009 BPEX. All Rights Reserved.
3.3% greater than for unaffected units. This alone, has a significant impact on costs of production even though it may not be a direct consequence of pleurisy associated disease. A substantial economic impact of pleurisy was also found at the processing stage which was largely driven by the necessary reduction in line speed, and associated staff costs, to permit adequate inspection and trimming. A representative batch with 10% pleurisy prevalence was estimated to result in additional processing costs of 29p/pig (based on assumptions). Efforts to characterise relationships between pleurisy at slaughter and objective on‐farm measures of health and welfare were limited to the observed relationships were frustrated by problems with the data collected in our prospective study. We found this on‐farm data to be highly variable with a very strong integrator‐specific influence. However, this should not diminish the useful information that we identified in our retrospective analysis (Part 1). The third aspect of the project was to characterise the prevailing infectious agents involved in pig pleurisy in England and Wales and to optimize the approach to on‐farm investigation of raised pleurisy prevalence. This work emphasized the strong link between pleurisy and underlying pneumonia and identified the traditional bacterial contributors to respiratory disease. However, we found strong evidence that viral infections such as PRRSV and especially PCV2 were underpinning pleurisy. Useful information on appropriate minimum ages (>9 weeks), ante mortem clinical findings (respiratory signs, lethargy, conjunctivitis), and group sizes of necropsy pigs (>6) was found in order to optimize the chances of a successful diagnostic outcome. In conclusion, this work has provided clear messages on the managemental factors that can reduce or exacerbate pleurisy. The substantial cost of pleurisy and associated disease both to producers and processors has been highlighted, and recommendations for optimized investigation and diagnosis of farm‐specific causes were developed. Together, this provides sufficient preliminary knowledge for producers to calculate the economic impact of disease on their own units, to plan investigations of their own infectious and non‐infectious factors, and to implement protective management practices that are most suited to their specific circumstances. These key messages have been set out in Section 7 as knowledge transfer notes.

Objectives 5
© 2009 BPEX. All Rights Reserved.
2. Objectives
The objectives of this project were: a) To undertake an on‐farm case control study of pleurisy, across the UK production base, using the
British Pig Health Scheme (BPHS) database together with a questionnaire based survey.
b) To undertake a prospective on‐farm and in‐abattoir study, in collaboration with 3 integrated
producer‐processors in order to: i) Identify risk factors for pleurisy at the batch level, with emphasis on markers of health,
environment, and welfare. ii) To analyse the economic impact of pleurisy for on‐farm performance and abattoir
processing
c) To undertake a necropsy‐based investigation of respiratory infectious agents on pleurisy affected Units: i) To characterise the pathology of pleurisy ii) To identify associations between the presence of pleurisy and other co‐existing
pathology in pigs iii) To identify any associations between active pleurisy and ante‐mortem clinical
observations in order to assist vets in selecting appropriate pigs for sacrifice / investigation.
iv) To identify associations between pleurisy and infectious agents. v) To identify the ante‐mortem features of pigs that, at necropsy, were more likely to
yield pleurisy affected pigs and diagnoses of respiratory disease.
d) To produce practical guidance on pleurisy for BPEX and the industry on: i) Evidence based data on the impact of pleurisy on performance, health and welfare at the
level of production unit and abattoir. ii) Interpretation of BPHS pleurisy scores. iii) Design of pleurisy control programs based on the risk factors for its occurrence, and factors
linked to reduced prevalence.

Introduction 6
© 2009 BPEX. All Rights Reserved.
3. Introduction and literature review The importance of pleurisy: Carcasses from affected animals typically require ‘pleural stripping’, removal of the inflamed pleural membrane from the thoracic cavity and, in more severe cases, extensive trimming of the chest wall is necessary. The immediately apparent cost has been one of time spent trimming affected areas, lost deadweight, and compromised carcass grading for the processor. The pathology presents in its mildest form at post mortem inspection as localised visceral pleurisy on the surface of the lung, notably between lung lobes. Infection may extend to involve the parietal pleura (the lining of the chest cavity) where it may also be localised, or become generalised. During the acute stage of pleurisy a fibrinous exudate is visible on pleural surfaces. Over time, healing occurs and the fibrin is transformed to collagenous fibrous tissue. In mild pleurisy this may leave a roughened lung surface with fibrous tags. In more severe cases, fibrous adhesions form between pleural surfaces. These adhesions can be so firm and extensive that lung tissue is left behind in the chest cavity during evisceration. By the time pigs are sent to slaughter pleurisy lesions are less likely to be active and even pigs subsequently showing severe pleurisy at post mortem present normally at ante mortem examination; they do not appear to be ill thriven and show few if any clinical signs of disease. Thus by slaughter, the earlier effects of pleurisy and its causative agents on growth rate and feed conversion efficiency may not be apparent. So, while the economic consequences for chronic pleurisy (where there are fibrous adhesions) of trimming time and lost deadweight for the processor can, in theory, be calculated the costs to the farmer have to date not been adequately quantified. Recent data has surfaced to indicate that there may be associations between pleurisy and food safety. A correlation was shown between the prevalence of pleural stripping and the level of contamination of the chest cavity by Campylobacter spp. (Hurd et al., 2008). This was proposed to reflect escape of aspirated water from lungs that were damaged during evisceration of pigs with pleural adhesions The high prevalence of pleurisy in the UK slaughter pig population is only just becoming clear – thanks to the advent of the British Pig Health Scheme (BPHS) abattoir pathology monitoring scheme set up by BPEX and co‐funded by the Industry and DEFRA. Data for the year ending September 20061 showed that pleurisy affected approximately 68% of all monitored batches (3674) of slaughter pigs. Furthermore, 42% and 11% of these batches recorded a prevalence of pleurisy in excess of 5% and 20% within batch, respectively (see Figure 1). The data trigger questions. How does the UK data for pleurisy prevalence compare with other European States? What are the known causes and what, if any, are the known risk factors and protective factors linked with pleurisy? How much is pleurisy costing the producer in the rearing phase and the processor in the post‐slaughter phase? Importantly, what is the intervention point at which investment in control and prevention steps becomes cost effective? How does the UK data for pleurisy prevalence compare with other European States? A preliminary analysis of existing BPHS data indicates a pleurisy prevalence of around 14% of all pigs slaughtered. Few comparisons of pleurisy prevalence have been reported in the last twenty years and, of these, care must be taken in interpretation due to difference in methods of analysis. Data from the 1970s and 1980s was reviewed by Hartley (1988) when prevalences ranged from 3.8% in Australia, through 11% in Canada, 14% in Belgium, to 16% in one UK study (Hartley et al., 1988c). A relatively recent Danish study reported
1 Data supplied by BPEX.

Introduction 7
© 2009 BPEX. All Rights Reserved.
an overall mean apparent prevalence at pig level of 26% at slaughter (Cleveland‐Nielsen et al., 2002). However, prevalence at herd level is higher and a recently published study from the UK reported pleurisy in 76% of farms studied (Amory et al 2007), while a Belgian study found that 92% of 150 farrow‐to‐finish units had some level of pleurisy (Maes et al., 2001). An opportunity exists to generate and publish benchmark data on rolling national and regional trends in pleurisy prevalence, against which producers can match the benefit of their control programs.
Distribution of slaughter pig batches by prevalence of severe pleurisy (n=3674 batches)
0.00
5.0010.00
15.0020.00
25.0030.00
35.00
zero >0 - 5 >5 - 10 > 10 - 20 >20
prevalence of of affected pigs within batch
perc
enta
ge o
f bat
ches
Figure 1: Distribution of slaughter‐pig batch by prevalence of severe pleurisy (BPHS data collected in the year ending September 2006).
What are the known infectious causes of pleurisy in pigs? Pleurisy, presenting as a pathological lesion in the abattoir, is the result of disease caused by infectious agents. The identity, level and combination of infectious agents on a unit and within an individual pig, together with environmental and immunity factors, influences the severity of disease within a group of pigs and in individual pigs. Pleurisy may be present alone, or in combination with pericarditis or pneumonia or both. Pleurisy may also present as a component of polyserositis alongside pericarditis, arthritis, peritonitis, and meningitis. An analysis of 4800 Danish slaughter pigs (Enoe et al., 2002) found strong associations between chronic pleurisy (CP) and serum antibody titres to Mycoplasma hyopneumoniae (MH), Actinobacillus pleuropneumoniae (APP), Pasteurella multocida (PM), Haemophilus parasuis (HPS) and swine influenza (SI). Other agents such as Mycoplasma hyorrhinis have also been implicated (Falk and Lium, 1991). What are the known risk factors linked with pleurisy? Consideration of the causal factors in chronic pleurisy, as a component of respiratory disease, is complicated. Many causal factors for respiratory disease, including pleurisy, have been proposed and argued but care must be taken in analysis for potential risk factors because of the potential for confounding associations. The key factors can broadly be considered as follows ((Maes et al., 2001) and reviewed by Sorensen 2006):
• Infection: o Factors in air‐borne or physical transmission between herds (e.g. density of herds,
movements of pigs between herds). o Factors involved in transmission between pigs within a herd (e.g. infection dynamics of
pathogens, immunity of individuals, mixing of age groups). o Interactions between pathogens (e.g. PRRSV and MH).

Introduction 8
© 2009 BPEX. All Rights Reserved.
• Pig numbers and density within production unit: although infection dynamics are enhanced by large group sizes, herd size per se does not always correlate with increased disease prevalence.
• Climate and air pollution: Significant correlations were described between cold air temperature and pleurisy lesions at subsequent slaughter in Ireland (Goodall et al., 1993). Draughts through slatted floors and pen barriers are also implicated (Scheepens 1996). The role of pollutants such as ammonia and particulate dust is also accepted (Donham, 1991).
• Enteritis: There is some evidence that pigs with an earlier history of enteritis, such as transmissible gastroenteritis and rotavirus, were more prone to respiratory disease (Marois et al., 1989; Svensmark et al., 1989). However, some diseases such as post weaning multisystemic wasting syndrome (PMWS) present with combined respiratory and enteric signs.
• Gender: Prevalence and extent of lung pathology including pleurisy is greater in castrated males than females (Kruijf and Welling, 1988). A number of factors (stress, growth rate etc) could explain this.
• Genetics: Various studies have identified breed and sire specific differences in susceptibility to respiratory disease (Lundeheim and Tafvelin, 1986; Caruso and Jeska, 1990). These are likely to represent effects at the level of the local innate immune response.
• Ante mortem effects: Likelihood of APP‐associated pleuropneumonia lesions was greatly enhanced when pigs were lairaged for >24 hours (Christensen et al 1986), however other studies have failed to demonstrate an association between prolonged lairage and pleurisy (Hartley et al., 1988a). However, the recent demonstration of a role for stress hormones, such as noradrenaline, in enhancing virulence of bacteria (Cogan et al., 2007) emphasises the potential role of stress in enhancing disease.
What specific evidence is there for risk factors in pleurisy? Stark (2000) described a basic organisation of risk factors for respiratory disease in pigs (Stark, 2000) and this was applied by Cleveland‐Nielsen et al (2002) in their analysis of chronic pleurisy in 540,000 slaughter pigs. Risk factors included herd health status, particularly non‐SPF status and infection with Mycoplasma and APP serotype 2, mingling of pigs of different ages and pig density within the surrounding 5km radius. Enoe (2002) described an association between APP serotypes 2 and 6 and MH with chronic pleurisy, as well as complex relationships with atrophic rhinitis, APP serotype 7 and swine influenza. Cleveland‐Nielsen also identified the use of all‐in all‐out systems and the use of 100% dry feeding as being protective against pleurisy. Working in Belgium, Maes et al (2001) found that increased regional density of pig herds, poor biosecurity and increased airspace stocking density were important risk factors. A seasonal effect was also found with greater prevalence and severity noted in late winter, and early spring respectively. How much is pleurisy costing the producer in the rearing and finishing phase? Several Danish studies dating back to the 1980s have assessed the effects of pleurisy on production losses. These indicated delays of roughly 8‐12 days to slaughter (Christensen 1986 reviewed in Christensen 1999). These were confirmed in a UK study that found an approximate 8 day delay to slaughter where pleurisy was associated with clinical respiratory disease – but prior to disease outbreak there was no apparent association between subclinical chronic pleurisy and days to slaughter (Hartley et al., 1988b). Other studies have, variously, found evidence of a significant reduction in growth rate linked to chronic pleurisy (Paisley et al., 1993) while others have not (Le Foll 1988).

Introduction 9
© 2009 BPEX. All Rights Reserved.
A recent NADIS (National Animal Disease Information Service) report2 described post‐weaning mortality of up to 8% for as long as 4 weeks in acute outbreaks of Glasser’s Disease (caused by Haemophilus parasuis and characterized by polyserositis including pleurisy) and reduced growth by 50g/day in the long term for chronically affected pigs, such as those showing pleurisy at slaughter. Industry standard values (Pig World, September 2006) proposed a 1% change in mortality to be worth 50p per pig slaughtered and a 50g/day change in growth rate to be worth £1.05 at slaughter. Assuming pre‐outbreak mortality rates of 2% rising to 8% the disease might cost £3 per pig slaughtered. In addition, Figure 1 shows that it is not uncommon for pleurisy prevalence to extend to 20% of pigs within a batch equating, at £1.05 per 50g/day lost weight gain, to a cost of £21.00 across a batch of 100 pigs (21 pence per pig). Therefore costs associated with mortality and reduced growth approximate to £3.21 per pig. However, to this sum must be added the costs of reduced feed conversion efficiency (FCE) (a change in FCE of 0.1 will cost £1.40 per pig, assuming feed costs of £140/tonne, Pig World September 2006) plus medication and additional labour costs associated with treatment and hospitalization. So, in summary, H. parasuis‐associated pleurisy could be costing the producer up to £5.00 per pig. Finally, the impact of pleurisy on welfare may result in indirect economic consequences for the producer (through farm assurance schemes etc). There is widespread agreement that disease significantly impairs animal welfare (Broom, 1988; Algers, 2004) and respiratory disease in particular has been demonstrated to be a major cause of suffering in pigs (Amory & Pearce, 1998). Indicators of ill‐health are routinely included in farm assurance scheme assessments (Main et al, 2007) yet it is still unclear how the magnitude of disease pathology such as pleurisy at slaughter relates to on‐farm assessments of signs of disease and welfare status. For example, a relationship has been shown between the prevalence of tail biting lesions and pleurisy at slaughter, with the proposal that tail infections might enable haematogenous access of pathogens to the pleural tissues (Kritas and Morrison, 2007). The present study will help to clarify any relationships between objective measures of welfare, signs of disease and post‐mortem pathology. The need for focused UK evaluation of the cost to production (and welfare impact) from pleurisy under current production conditions is emphasized by the inconclusive and sparse nature of the current literature. Such data are essential in building advice for producers seeking to identify a level of pleurisy at which intervention is justified. How much is pleurisy costing the processor? The economic impact of high prevalence of pleurisy is no more obvious than at processing. Line speeds must be reduced and personnel allocated to allow for pleural stripping and more extensive trimming, seized material must be disposed of as Category 2 Animal By‐Product instead of sale as pet food, and carcass weights and grades are compromised. Evaluation of these costs will provide further evidence upon which to base a tolerance level above which intervention at the farm level becomes economically justified. When does intervention become cost effective? Determining the point at which intervention becomes economically justifiable requires basic data on the cost of pleurisy through lost performance on‐farm and during processing. Against this is required information, specific to UK systems, on the protective factors associated with low pleurisy prevalence; and importantly, the price at which they may be purchased. The availability of these data will enable the
2 Acute Glassers Disease. M White. NADIS Pig Health. Dec 2006. See www.nadis.org.uk

Introduction 10
© 2009 BPEX. All Rights Reserved.
development, for knowledge transfer to the industry, of a straightforward means to assess intervention levels and tools specific to local conditions (e.g. local health status, building design etc). Conclusion A targeted and UK‐specific study of causal agents and risk factors for pleurisy in pig is overdue. The information flowing from this study will underpin improved understanding of the impact of pleurisy on health, welfare and productivity on‐farm and in processing, and will enable guidance on the cost‐benefits of disease control. The study will exploit the large and growing retrospective BPHS database but will rely also on longitudinal prospective studies of batches of pigs progressing from weaning through slaughter to processing. The key questions of causation, risk factors, impact on health, welfare and performance, and cost‐benefit of intervention will be addressed.

11
© 2009 BPEX. All Rights Reserved.
4. Retrospective case‐control study of risk factors for pleurisy
Objectives:
a) To identify production unit level risk and protective factors for a persistently high or low prevalence of pleurisy. Such factors could be useful in developing improved preventive strategies.
b) To identify other on‐farm associations with persistently high prevalence of pleurisy that might have economic impact. Such associations will assist producers in calculating potential benefits of intervention strategies.
Methods: 1. Selection of target units: Collated data on abattoir pathology arising from the British Pig Health
Scheme (BPHS) was supplied by BPEX. Units were selected based upon their historic BPHS data records.
a. Definition of case and control unit: i. Case: A unit with at least 50 pigs assessed on at least 3 occasions in the 24
month period up to end of September 2008. The mean prevalence of pleurisy (combining type 1 and type 2) must be ≥10%.
ii. Control: A unit with at least 50 pigs assessed on at least 3 occasions in the 24 month period up to end of September 2008. The mean prevalence of pleurisy (combining type 1 and type 2) must be <5%.
2. Questionnaire design and use: The project group (VLA, University of Cambridge, representatives
of the integrated pig production companies and their vets) agreed the content of the questionnaire, based on the variable listed in Tables 9.1.1. and 9.1.2. (Annex 1). Questions included potential predictor variables but also other variables that might be associated and indicate economic impact of pleurisy. The questionnaire was tested at 3 units before final adjustments and despatch.
a. Questionnaire despatch: A total of 242 questionnaires were posted to producers (121 to control units and 121 to case units). Where possible, producers’ private vets were notified. Sample size calculations indicated that data would be needed from 105 case units and 105 control units to detect the significant (p<0.05) effect of a risk factor found in 20% of the control units that had an odds ratio of 2.5, with a study power of 80%.
b. Follow‐up and acquisition of data: A total of 123 completed questionnaires were received. Of these 2 were unusable (wrong slap mark), 51 represented case units and 70 represented control units.
c. Data was stored in Microsoft Access before transfer to Microsoft Excel for final tidying prior to statistical analysis.
d. All statistical analysis was conducted in the R statistical language (R Core Development Team 2008).

12
© 2009 BPEX. All Rights Reserved.
3. Statistical analysis: The questionnaire was stratified into a series of categories, representing different characteristics of a herd. These were: general farm information (including production type), mortality and productivity, health status, herd environment and herd management. In order to explore the data in a systematic manner we stratified the variables into two main groups: those that corresponded to farm management characteristics (heuristically speaking: those things that the farmer could change independently of the disease status of the farm), and disease associated factors (those factors that were dependent on the disease status of the farm). Firstly the data set was cleaned up. Overall there were 124 respondent farms from the original 242 targeted: 51 cases, 70 controls, and 3 producers reported cessation of business. Hence the overall effective response rate for the questionnaire was 50%. It was necessary to re‐categorise some of the categorical variables to ensure that there were >5 observations in any level of the factor, and also to aid interpretation. Variables having large numbers of missing values (>100) were removed at the outset, as were those categorical variables that had <5 samples in a group and could not be easily re‐categorised. Within each group of variables (e.g. management characteristics and disease associated characteristics) we screened the data by applying a simple logistic regression model to each variable in turn, using a likelihood ratio test (LRT) to look for associations. Any variable with a corresponding p‐value of <0.15 was then made available for a final multiple regression analysis. However, the extent and distribution of missing values in the data set precluded the development of a sensible multiple regression model, since model choice procedures require competing models to be fitted to the same data set, and in order to do this we would have had to cut out too many observations or variables to make a valid comparison. Instead we have reported the results from a series of simple logistic regression models, fitted to each explanatory variable in turn, and have corrected for multiple comparisons using a Bonferroni correction. To assess the predictive capacity of each variable we can calculate the area under the Receiver Operating Characteristic (ROC) curve (AUC). This gives a measure of how good the model is at correctly predicting the outcome variable (case or control). The AUC ranges between 0.5—1, with a value of 0.5 indicating no discriminatory power and a value of 1 indicating perfect discriminatory power.
Results: Independent univariable logistic regression analysis for management variables: The results are shown in Table 4.1. and 4.2. The variables highlighted in red correspond to those that are statistically significant at the 5% level after correction and those in blue correspond to those that are statistically significant before correction.

13
© 2009 BPEX. All Rights Reserved.
Table 4.1. Results of independent logistic regression models fitted to each management variable in turn, showing raw and adjusted p‐values from likelihood ratio tests (LRT), the area under the ROC curve (AUC), and number of non‐missing observations (N) for the variable in question.
Variable LRT p-value LRT (Bonferroni) AUC N
Herd management – growers 0.00 0.00 0.75 112Shared air 0.00 0.00 0.68 121# moves 0.00 0.00 0.73 119Production type 0.00 0.00 0.72 121Herd management – finishers 0.00 0.00 0.71 117Clean between batches – finishers 0.00 0.00 0.69 84Partial slatted – weaners 0.00 0.01 0.65 80# sources 0.00 0.01 0.70 116Downtime – growers 0.00 0.01 0.77 81Herd management – weaners 0.00 0.01 0.75 77Feed origin – growers 0.00 0.02 0.67 104Disinfect between batches – finishers 0.00 0.02 0.69 84# mixes 0.00 0.03 0.66 120Downtime – finishers 0.00 0.05 0.72 82Feed origin – finishers 0.00 0.06 0.65 108Downtime – weaners 0.00 0.12 0.74 63Total # finisher places 0.00 0.12 0.58 118Clean between batches – growers 0.00 0.16 0.61 84Feed type – growers 0.01 0.23 0.65 108Feed origin – weaners 0.01 0.40 0.61 66Bedding – weaners 0.01 0.43 0.64 80Disinfect between batches – growers 0.01 0.48 0.62 83Feed type – finishers 0.02 0.88 0.63 113Slatted – weaners 0.02 0.90 0.63 80Partial slatted – finishers 0.02 1.00 0.59 121Assisted ventilation 0.05 2.00 0.58 121Frequency of feed – finishers 0.06 2.41 0.57 110Bedding – finishers 0.09 3.52 0.57 121Slatted – finishers 0.10 4.04 0.57 121Straw yards – finishers 0.11 4.51 0.57 121Pen with indoor run – weaners 0.16 6.36 0.57 80Single or mixed acc. - weaners 0.16 6.49 0.58 80Pen with kennel and indoor run – finishers 0.24 9.76 0.55 121Single or mixed acc. - finishers 0.30 12.20 0.55 121Pen with kennel and indoor run – weaners 0.39 16.01 0.55 80Max. # shared air 0.55 22.38 0.53 113Pen with kennel and outdoor run – finishers 0.60 24.67 0.51 121Sex separation 0.73 29.89 0.51 121Straw yards – weaners 0.82 33.58 0.51 80Pen with indoor run – finishers 0.86 35.34 0.51 121Pen with kennel and outdoor run – weaners 0.87 35.76 0.51 80

14
© 2009 BPEX. All Rights Reserved.
Table 4.2. Results of independent logistic regression models fitted to each management variable in turn, showing odds ratios (OR) and 95% confidence intervals for the variables shown to be significant at the 5% level (see Table 4.1.). Continuous (or discrete) variables are shown with a dash in the “Levels” column, with the OR corresponding to the OR per unit increase; for the categorical variables the OR is relative to the referent level, which is always shown first.
Variable Levels OR Low CI Upp. CIHerd management – growers AIAO - - -Herd management – growers By room 5.14 1.61 17.29Herd management – growers None 9.09 3.63 24.50Shared air False - - -Shared air True 6.52 2.76 16.59# moves (per move) - 2.22 1.52 3.38Production type FarrowtoF - - -Production type WeantoF 0.10 0.03 0.28Production type GrowtF 0.45 0.18 1.10Herd management – finishers AIAO - - -Herd management – finishers By room 2.39 0.43 11.98Herd management – finishers None 6.60 2.88 15.90Clean between batches – finishers False - - -Clean between batches – finishers True 0.10 0.03 0.32Partial slatted – weaners False - - -Partial slatted – weaners True 21.36 3.75 404.63# sources 0 - - -# sources <=3 0.18 0.07 0.41# sources >3 0.69 0.13 3.96Downtime – growers (per day) - 0.85 0.75 0.93Herd management – weaners AIAO - - -Herd management – weaners By room 7.11 2.29 24.15Herd management – weaners None 9.84 2.56 44.70Feed origin – growers Homemix - - -Feed origin – growers Purchased 0.22 0.09 0.52Disinfect between batches – finishers False - - -Disinfect between batches – finishers True 0.19 0.07 0.49# mixes (per additional time pigs are mixed) - 2.24 1.39 3.80Downtime – finishers (per additional day) - 0.88 0.79 0.96
Independent univariable logistic regression analysis for health variables: The results are shown in Table 4.3. and 4.4. The variables highlighted in red correspond to those that are statistically significant at the 5% level after correction and those in blue correspond to those that are statistically significant before correction.

15
© 2009 BPEX. All Rights Reserved.
Table 4.3. Results of independent logistic regression models fitted to each management variable in turn, showing raw and adjusted p‐values from likelihood ratio tests (LRT), the area under the ROC curve (AUC), and number of non‐missing observations (N) for the variable in question.
Variable LRT p-value LRT (Bonferroni) AUC N
Mortality – 07 0.00 0.00 0.81 117APP 0.00 0.00 0.73 92Mortality – 08 0.00 0.00 0.78 114Mortality – 06 0.00 0.00 0.71 111Dyspnoea – old – 07 0.00 0.00 0.68 121Dyspnoea – old – 08 0.00 0.01 0.67 121Cough – old – 07 0.00 0.03 0.64 121# group meds 0.00 0.04 0.68 117Cough – old – 08 0.00 0.04 0.64 121Dyspnoea – young – 07 0.00 0.05 0.68 80SD – young – 07 0.00 0.09 0.66 80# ind. Meds 0.00 0.09 0.69 119Reason for group med 0.00 0.11 0.68 66Sneeze – old – 08 0.00 0.14 0.61 121Waste – young – 08 0.00 0.16 0.66 79Dyspnoea – young – 08 0.01 0.23 0.65 80Sneeze – young – 07 0.01 0.40 0.65 80Reason ind. Med 0.01 0.53 0.66 83Sneeze – old – 07 0.01 0.55 0.60 121PRRS 0.01 0.57 0.62 101Sneeze – young – 07 0.02 0.69 0.64 80SD – young – 08 0.02 0.73 0.63 80# EP shots 0.03 1.40 0.57 96Glaessers 0.04 1.56 0.60 94Cough – young – 08 0.04 1.68 0.61 80Waste – young – 07 0.04 1.79 0.61 80EP 0.05 2.04 0.59 105Cough – young – 07 0.06 2.55 0.60 80Waste – old – 08 0.07 2.72 0.58 121Waste – old – 07 0.10 4.18 0.57 121PDNS – 07 0.11 4.31 0.56 121Meningitis – 08 0.20 8.33 0.56 121Scour – young – 08 0.32 13.15 0.55 80Scour – old – 08 0.48 19.48 0.53 121SD – old – 08 0.48 19.65 0.52 120PDNS – 08 0.50 20.68 0.53 121PMWS 0.51 20.73 0.52 115Scour – young – 07 0.75 30.62 0.52 80Meningitis – 07 0.81 33.06 0.51 121SD – old – 08 0.83 34.07 0.51 121Scour – old – 07 0.85 34.98 0.51 121

16
© 2009 BPEX. All Rights Reserved.
Table 4.4. Results of independent logistic regression models fitted to each management variable in turn, showing odds ratios (OR) and 95% confidence intervals for the variables shown to be significant at the 5% level (see Table 4.3.). Continuous (or discrete) variables are shown with a dash in the “Levels” column, with the OR corresponding to the OR per unit increase; for the categorical variables the OR is relative to the referent level, which is always shown first.
Variable Levels OR Low CI Upp. CI
Mortality – 07 (per 1% increase) - 1.53 1.30 1.86APP No - - -APP Yes 8.75 3.43 24.51Mortality – 08 (per 1% increase) - 1.32 1.15 1.57Mortality – 06 (per 1% increase) - 1.28 1.14 1.47Dyspnoea – old – 07 Absent - - -Dyspnoea – old – 07 Present 4.76 2.21 10.70Dyspnoea – old – 08 Absent - - -Dyspnoea – old – 08 Present 4.09 1.93 8.97Cough – old – 07 Absent - - -Cough – old – 07 Present 4.45 1.84 12.04# group meds 0 - - -# group meds 1-2 3.65 1.45 10.15# group meds >=3 9.60 2.68 39.75Cough – old – 08 Absent - - -Cough – old – 08 Present 4.03 1.72 10.38Dyspnoea – young – 07 Absent - - -Dyspnoea – young – 07 Present 4.89 1.86 13.57
Discussion This part of the project undertook to identify risk or protective management and health factors correlated with pleurisy using a retrospective case‐control approach. A total of 121 finisher units were included in the study (51 cases, 70 controls). Case units (see definition above) had experienced consistently high (>10% prevalence) levels of pleurisy in the preceding 24 month period, while control units had consistently experienced low levels of pleurisy. The opportunities for multivariable logistic regression analysis were restricted by the tendency of questionnaire respondents not to complete all questions which resulted in large number of incomplete data sets. Management associated variables: The failure to implement strict AIAO was a highly significant risk factor for grower (OR=9.09), finisher (6.6) and weaner (9.84) stages of production. This definition of strict AIAO included AIAO by unit or building while AIAO by pen was not considered to be strict AIAO. AIAO by room was considered to be somewhere in between. Allied to this finding, the co‐existence of pigs, whose ages differ by 1 month or more, in the same airspace was found to be a strong risk factor (OR = 6.52). The application of strict AIAO and avoidance of co‐mingling of pigs of different ages were found to be protective factors against chronic pleurisy in Denmark (Cleveland‐Nielsen, 2002). Both these factors have a key role in restricting the transmission dynamics of infectious disease.

17
© 2009 BPEX. All Rights Reserved.
Repeated mixing of pigs (after the mixing of weaning or arrival in the finisher unit) and repeated moving of pigs (after the moving of pigs at weaning or arrival on the unit, but distinct from mixing) were both significant risk factors (mixing OR = 2.22; moving OR = 2.24). While mixing of pigs equates to co‐mingling (see above) and forms a major route for transmission of infectious disease from infected to susceptible populations, the role of moving alone (in the absence of mixing) is more complex. It could be hypothesized that repeated movement of pigs is perhaps correlated to certain production types (such as FF systems). Partially slatted weaner accommodation gave an OR of 21.36 as a risk factor but the confidence interval was large (3.75 – 404.63) – possibly due to a fairly even distribution of cases and controls for those pigs that were housed in partially slatted systems (the standard error increases as the proportions get close to 0.5). In any case we must be cautious when interpreting this OR since it is a multiplicative effect and will probably be biased by the large standard error. The basic type of production system in operation showed a strong relationship to pleurisy. Compared to farrow‐to‐finish operations, grow‐to‐finish (GF) but especially wean‐to‐finish (WF) systems were protective (GF OR = 0.45; WF OR = 0.1). FF units present a continuously present population of pigs, strict AIAO production is essentially impossible, and pigs typically must progress through a closely located set of buildings. On the other hand, WF and GF units are more suited to strict AIAO, in spite of the fact that their population usually involves the mixing of pigs from different breeding sources. The observed additional protective effect of WF units over GF units is worthy of further investigation. Of potential importance might be the residual colostrally derived passive immunity at mixing during population in WF units. Population (and mixing of sources) on GF units takes place after the decline of passive immunity with, perhaps, a consequential increase in the effective susceptible population. Alternatively, it might be hypothesized that if pleurisy is initiated soon after mixing then pigs on WF units have a longer period until slaughter during which lesions might resolve. The implementation of cleaning between finisher batches (protective OR = 0.1), disinfection between finisher batches (protective OR = 0.19) and provision of finisher accommodation down time for growers (protective OR = 0.85) and finishers (protective OR=0.88) were all significantly protective practices. Although believed to be relevant elements of good biosecurity practice, this is much needed evidence to put emphasis on these practices. Sourcing of piglets from up to 3 different breeders for WF and GF operations was protective (protective OR=0.18) relative to zero sourcing as operated in FF systems. The sourcing of piglets from more than 3 breeding units reduced this protective effect (protective OR = 0.69). Increasing the number of sources might be expected to increase the likelihood for introduction of disease by one source to which the other sources are susceptible. The use of purchased grower feed versus home mixed feed was found to be protective (OR = 0.22). The absence of associations relating to feed at finisher stage or weaner stage suggests that this finding is artefactual or correlated to other factors such as production type but this could not be ascertained in the current project. Health associated variables: Associations were sought between case or control units and variables that described the respiratory and general health of the units. The variables emerging as strong risk factors were mortality, coughing in older pigs, known positive status for A. pleuropneumoniae (APP) associated disease, dyspnoea in older and younger pigs and increasing amounts of group level medication. Other risk factors that were not

18
© 2009 BPEX. All Rights Reserved.
statistically significant after adjustment, but nonetheless interesting were wasting in younger pigs, sneezing, increasing levels of individual medication, and known positive status for porcine reproductive and respiratory syndrome (PRRS). Increased mortality was consistently and strongly associated with case units in each of the 3 years for which data was requested. Figure 4.1. shows the distribution of mortality rates between the case and control groups from 2006—2008. The average median mortality (averaged across the three years) is 3.3% higher in case units than in control units (95% CI: 2.0‐‐‐4.6%). This association is worthy of further investigation but is, on one hand a indication that pleurisy is a disease of generally lower health status units and, on the other, an indication of the economic consequences associated with units where pleurisy is a consistent problem. Using the industry standard (Pig World, September 2006) each 1% increase in mortality rate is estimated to cost the producer £0.50 per pig ultimately slaughtered in that group. Presence of coughing and dyspnoea was also strongly associated with case units for pleurisy compared to those units where these signs were absent (e.g. OR =4.45 when older pigs seen coughing in 2007 and OR=4.03 in 2008). However, these clinical observations are not specific for pleurisy and may indicate other respiratory diseases. Most previous research has indicated a link between pleurisy prevalence and prevalence of pneumonia (Elbers, Tielen, et al , 1992), but more recent work has questioned this (Maes, Deluyker, et al 2001). This relationship is investigated further in Part 3 of this project. The presence of APP associated disease as a risk factor for pleurisy (OR= 8.75) is supported by previous Danish work (Cleveland‐Nielsen, 2002) although our experimental design restricted the ability to gather further information on APP status (such as serotype or prevalence of disease on unit). The number of group medications in current use in finisher pigs was a risk factor (OR=3.6 for 1‐2 medications, 9.6 for >=3 medications). This observation emphasized the tendency of pleurisy to occur on units of generally lower health status, and was another indication of the additional cost of production for these units, but it was not possible to conclude that these additional medications were a direct consequence of pleurisy. It is worth considering as well some of the more marginal findings. In particular, wasting has a weak positive association with pleurisy in both younger and older pigs in 2007. Although not statistically significant in this study, this is certainly an area worth further investigation. Wasting may be the end result of a number of different disease processes on pig units but, in recent years, has been associated frequently with porcine circovirus type 2 associated diseases (PCVAD). The absence of any association with wasting in older or younger pigs in 2008 coincides with the BPEX‐supported mass PCV2 vaccination program across England and Wales in 2008. The relationship between PCVAD and pleurisy is investigated further in Part 3 of this project.

19
© 2009 BPEX. All Rights Reserved.
Figure 4.1. – Mortality distributions for 2006—2008.

Prospective study of the impacts of pleurisy 20
© 2009 BPEX. All Rights Reserved.
5. Prospective on‐farm and in‐abattoir study of health, welfare and economic impacts of pleurisy
This section of the project used a prospective approach to investigate associations between the prevalence and severity of pleurisy and associated impacts on health and welfare on‐farm and on economic consequences at the abattoir. Objectives
a. To characterise pleurisy prevalence and severity in 80 batches of slaughter‐pigs drawn from 3 different vertically integrated pig production companies.
b. To identify associations between pleurisy prevalence / severity and associated production and processing variables that might be consequential, contributory, or otherwise correlated. These variables include health, welfare, environmental, and performance factors.
c. To identify the cost impact of pleurisy where variables are identified that show association with pleurisy and for which an economic impact can be estimated.
Methods 1. Selection of batches of slaughter pigs for study: A total of 80 batches of finisher pigs were targeted for study. These were distributed across 3 different production companies as indicated in Table 5.1. Batch selection was semi‐randomised in that batches were selected for inclusion in the study on the basis that they were predicted to be delivering pigs for slaughter on predetermined dates (on which project veterinarians would be available for abattoir pathology data collection). Batches were not selected on the basis of known or suspected susceptibility to pleurisy.
Integrator Number of batches contributed 1: Bowes of Norfolk Ltd 30 2: BQP Ltd 35 3: Yorkwold PigPro Ltd 15
2. Variables recorded:
a. On‐farm diary (see Table 9.2.1.): A weekly record of listed clinical signs, completed by the stockman and recording age of pigs at first observation and number of weeks signs noted. To account for integrator differences in the age at start of observation period, only data for the period 12‐22 weeks of age was included for analysis.
b. On‐farm veterinary visit with environmental data collection (see Table 9.2.2): A project veterinarian visited each batch at approximately 14‐16 weeks of age. Data collected included environmental data ( including but not limited to building number, type, stocking density, airspace per pig, air quality), clinical observations of 100 pigs (including indicators of health and welfare such as coughing, sneezing, lethargy, tail bite injury, fight marks, bursitis), and serological data derived from the results of analysis of 10 blood samples (porcine reproductive and respiratory syndrome virus (PRRSV), Actinobacillus pleuropneumoniae (APP APxIV antigen), M. hyopneumoniae (Mhyo) and

Prospective study of the impacts of pleurisy 21
© 2009 BPEX. All Rights Reserved.
swine influenza virus (SIV). Serological testing was undertaken at Sci‐Tech Laboratories, Shropshire, UK.
c. Abattoir pathology assessment (see Table 9.2.3.): A project veterinarian was present at the slaughter of one consignment from each of the 80 batches in the study. Each batch was typically slaughter over a number of consignments but no attempt was made to pre‐select which consignment would be assessed (e.g. always first consignment, last or middle). Instead, the consignment assessed depended upon the availability of the project veterinarian and was therefore effectively semi‐randomised. For a given consignment, 50 pigs were scored according to the standard British Pig Health Scheme (BPHS) assessment protocol with the following adapted assessment for pleurisy:
i. Pleurisy type: Plucks were assessed for pleurisy presence or absence and scored as 0 for no pleurisy, 1 for visceral pleurisy (lobe‐to‐lobe adhesion), and 2 for parietal pleurisy.
ii. Pleurisy extent: where type 2 pleurisy was present the extent was estimated into the following categories, taking the dorsal (rib‐cage facing) area of both lungs as a single unit: 100% (between 51‐100% of dorsal lung of area pleuritic), 50% ( between 26‐50% of dorsal lung pleuritic); 25% (between 13‐25% of dorsal lung area pleuritic) ; 12.5% (between 1% and 12.5% of dorsal lung area pleuritic).
iii. Pleurisy‐associated tissue remaining in carcase: The presence of lung tissue remaining in the carcase was recorded as an indication of severe adhesion.
iv. Individual carcase weight and P2 back fat depth: This data was recorded for the assessed pigs from batches B1‐B30 to permit limited investigation of relationships between pleurisy and these parameters on an individual pig basis, in addition to the batch level basis.
v. Time in lairage: The waiting time in lairage between arrival and killing was recorded for the consignment undergoing pathology assessment (see Table 9.2.5 below).
vi. Distance travelled to abattoir from production unit: This information was recorded for the consignment undergoing pathology assessment (see Table 9.2.5 below).
d. End of batch performance and health data from farm (see table 9.2.4 ): This data on batch level production performance and health was supplied when all pigs in that batch had been slaughtered.
i. Performance data: included batch size, mortality, slaughter window period, age at slaughter, average deadweight, daily weight gain for defined period, average lifetime daily weight gain. Note that many of these variables were calculated separately for each of the 3 integrators to account for the different management systems and time periods of recording (refer to Table 9.2.4).
ii. Health observations: Veterinary notes were used to identify number and reasons for group or individual medications, and specific disease issues affecting the batch (PMWS, PDNS, pneumonia, Glaesser’s Disease and so on).

Prospective study of the impacts of pleurisy 22
© 2009 BPEX. All Rights Reserved.
e. End of batch abattoir data (see Table 9.2.5): Information was collated for variance of individual carcase weights and P2 back‐fat depths for all members of each batch, pleurisy associated carcase trimming prevalence was determined from Meat Hygiene Service (MHS) Collection and Communication of Inspection Results (CCIR) data for each batch, and respiratory disease associated lung and pluck trimming prevalence was determined from CCIR data – again for each batch.
3. Information for economic impact assessments at processing: Basic and indicative information was sought form processors on the impact of pleurisy affected pigs on processing line speed, abattoir personnel requirements, Meat Hygiene Inspection requirements, and the costs of disposal of carcase / offal trimmings.
4. Data analysis
a. Characterisation of pleurisy prevalence and severity: i. Distribution of batches by prevalence of pleurisy at abattoir assessment ii. Distribution of batches by pleurisy severity at abattoir assessment using a
pleurisy index that incorporates prevalence and extent of lesions: ‐ A pleurisy index was calculated for each batch. Pigs within the
assessed consignment were each allocated a pleurisy score: 0: no pleurisy 1: visceral pleurisy (scored as 1) 2: parietal pleurisy (scored as 2) with <12.5% extent (i.e. ¼ of 1 lung). 3: parietal pleurisy with 25‐50% extent over lungs. 4: parietal pleurisy with 75‐100% extent over lungs.
‐ An index was then calculated for the consignment in which Index = average score for those pigs scoring >0 x the proportion of pigs in consignment scoring >0. The index was then taken to represent the entire batch from which the assessed consignment had been derived.
iii. Comparison of pleurisy measures for prevalence and severity (from abattoir assessment of a single consignment) and batch level MHS CCIR data as indicators of batch level pleurisy. This step was done to determine whether a consignment level assessment of pleurisy prevalence or severity was representative of batch level pleurisy as indicated by the MHS CCIR data. The 2 measures of pleurisy at consignment level (prevalence of all pleurisy, pleurisy index (PI), and prevalence of lung tissue remaining in carcase) were compared with MHS CCIR derived data reflecting pleurisy at batch level, specifically respiratory disease associated pluck and lung disposal prevalence, and pleurisy associated carcase trimming prevalence.
b. Correlations between pleurisy prevalence / severity and performance associated
variables in production and processing stages. For these analyses, the pleurisy measure was taken as the predictor variable and the performance variable as the dependent variable.
i. Performance variables at individual pig level:

Prospective study of the impacts of pleurisy 23
© 2009 BPEX. All Rights Reserved.
Correlations were sought between individual pig pleurisy scores and carcase weight or P2 back‐fat depths (using the data subset collected for batches B1‐B30).
ii. Processing variables at batch level: Correlations were sought between pleurisy prevalence / severity and indicators of performance at processing level (carcase weight variance within batch, P2 variance within batch).
iii. Production performance variables at batch level: Correlations were sought between pleurisy prevalence / severity and performance indicators at batch level (as listed in Table 9.2.4, including number slaughtered, mean slaughter weight, age at slaughter, daily weight gain, average lifetime daily weight gain (based on deadweight after trimming), and food consumed).
c. Correlations between pleurisy prevalence / severity and environmental, health, and welfare associated variables during production. For these analyses, the pleurisy measure was taken as the dependent variable and the production variable as the predictor variable.
d. Estimation of economic impacts of pleurisy:
i. Economic impacts of pleurisy during the production stage: Where correlations were identified between pleurisy and on‐farm performance factors, attempts were made to allocate economic consequences based on published literature.
ii. Economic impacts of pleurisy at the processing stage: Indicative costs were estimated for a single producer and processor using the following information – prevalence of pleurisy in the pigs, necessary reduction in line speed, staffing consequences of pleurisy and reduced line speed, trimming prevalence (carcase and offal), and cost of disposal of trimmed meat.
Results and discussion Characterisation of pleurisy prevalence and severity: In order to characterise the extent of pleurisy within batches we derived two measures – the first was a simple measure of pleurisy prevalence, such that individual pigs were classified as either having pleurisy (visceral or parietal) or not. The prevalence was then just the number of pleurisy affected pigs in a batch divided by the number of pigs assessed in that batch. An alternative is to build in some explicit index of “severity”, such as that described above. Figure 5.1. shows the distribution of the two types of measure across all 80 batches. It can be seen that the distributions look very similar, though the use of the index smoothed out the distribution in some sense.

Prospective study of the impacts of pleurisy 24
© 2009 BPEX. All Rights Reserved.
Figure 5.1. Distributions of batches by different measures of pleurisy extent
Figure 5.2. Pleurisy prevalence against severity index

Prospective study of the impacts of pleurisy 25
© 2009 BPEX. All Rights Reserved.
Table 5.1. Pearson correlations for the linear association between pleurisy extent and MHS CCIR data, including 95% confidence intervals.
Comparison Correlation Low CI Upp. CI p-valuePrevalence vs. pluck condemnation 0.67 0.50 0.78 0.00Prevalence vs. offal condemnation 0.69 0.54 0.80 0.00Prevalence vs. carcass condemnation 0.75 0.62 0.84 0.00Prevalence vs. lairage -0.15 -0.39 0.10 0.22Severity index vs. pluck condemnation 0.66 0.49 0.78 0.00Severity index vs. offal condemnation 0.67 0.51 0.79 0.00Severity index vs. carcass condemnation 0.76 0.64 0.85 0.00Severity index vs. lairage -0.15 -0.38 0.10 0.23
It can be seen from Figure 5.2. that the prevalence and severity index were highly linearly related. This might be expected from the definition of the index, but it was useful to know that there were not unforeseen things happening in the data (e.g. batches with large amounts of non‐severe pleurisy). Table 5.1. gives correlation coefficients along with 95% confidence intervals and p‐values for the different pleurisy extent measures against the Meat Hygiene Service CCIR data as well as against time spent by the assessed group in lairage. It can be seen that there was strong evidence for a linear relationship between increasing pleurisy extent (as measured on 50 pigs from a single consignment) and the carcass and offal trimming measures that were required (and measured at batch level), though there seems little or no effect of lairage time . Comparative plots are given in Figure 5.3., which further back this up (though there are a few outlying points of note).
Figure 5.3. MHS CCIR data against pleurisy and severity index

Prospective study of the impacts of pleurisy 26
© 2009 BPEX. All Rights Reserved.
So there was reasonable evidence that there is a direct relationship between pleurisy prevalence as measured for the 50 pig sample and the overall batch level indication of pleurisy as recorded in terms of trimming prevalence by the MHS, but that there was perhaps little extra to be gained by using a severity measure as defined above compared to a direct measure of pleurisy prevalence alone. We show later that pigs affected by either type of pleurisy (visceral or parietal) show a reduction in mean weight yield, and so for the purposes of further comparison in this section we chose to use a simple measure of combined (type 1 and type 2) pleurisy prevalence instead of using the severity index or stratifying by pleurisy type. Correlations between pleurisy prevalence / severity and performance associated variables in production and processing stages: Performance studies at individual pig level: Using detailed abattoir data collected from the Bowes subset of the study, in which individual pig carcase and P2 parameters could be assigned to individual pleurisy scores, we could explore the effect of pleurisy on performance variables at the individual pig level. Overall we had data on 1366 pigs across 29 batches, of which 35 had visceral and 109 had parietal pleurisy. The two main performance variables we were interested in were post‐trimming carcase weight (kg) and the P2 back fat depth (mm). Figure 5.4. shows the distributions of weight and back fat against pleurisy prevalence and index. It can be seen that pigs affected with pleurisy had lighter carcase weights than those without pleurisy, and this is true for the severity index also (though there is not a strong trend in the plot other than if a pig has or does not have pleurisy). It is important to note that carcase weights were recorded after trimming, and reductions in carcase weight will reflect trimming (for whatever reason) in addition to any changes in growth rate of the animal. Nevertheless this does measure the real outcome for the producer since payment is calculated on this weight.

Prospective study of the impacts of pleurisy 27
© 2009 BPEX. All Rights Reserved.
Figure 5.4. Distributions of slaughter weight and backfat against pleurisy prevalence and severity index
There was little evidence to suggest pleurisy is associated with a change in P2 back fat depth. Table 5.2. gives the mean and 95% confidence intervals for the relative change in slaughter weight and P2 back fat depth for pigs affected with pleurisy against those unaffected. These values have been calculated using a multiple regression model adjusted for the fact that there is a different overall mean weight in each batch by using a zero‐mean batch‐level random effect. We assumed the weight and P2 back fat depth are normally distributed. Although statistically significant for parietal pleurisy, there was nonetheless a trend for lower slaughter weights in those pigs that were affected by pleurisy than those without; in fact on average pigs with parietal pleurisy were 1.4kg lighter after trimming and processing. This trend was also seen when using the severity index, however here the main effect was whether a pig had any type of pleurisy, rather than the severity of the pleurisy. The effect on P2 back fat depth seemed negligible, which was further backed up by the confidence intervals in Table 5.2.

Prospective study of the impacts of pleurisy 28
© 2009 BPEX. All Rights Reserved.
These results appear to show that recording and calculation of a pleurisy severity index was not significantly more informative than recording and analyzing simple total pleurisy prevalence. This is useful information for producers and vets when planning their own investigations. For the remainder of this analysis we concentrate on the overall prevalence of pleurisy in the batch as our response variable, without stratifying between visceral and parietal or any further measures of severity. Therefore we can explore the relationship between pleurisy prevalence and batch‐level production factors.
Table 5.2. Means and 95% confidence intervals for the effect on post‐trimming carcase weight and P2 back fat depth in individual pigs affected by pleurisy
Mean Low CI Upp. CIOverall average 78.24 76.84 79.64Visceral -1.15 -3.26 0.97Parietal -1.42 -2.70 -0.15
Overall average 11.68 11.18 12.19Visceral -0.07 -0.87 0.73Parietal 0.14 -0.34 0.62
Weight (kg)
Backfat (mm)
Performance studies at batch level: The three main performance factors of interest were average slaughter (carcase) weight after trimming (kg), the daily weight gain (DWG) (g/day) and the age at slaughter (d). The first has an obvious economic effect, amounting to a direct reduction in saleable product. The second and third measures correspond to the amount of time taken to process the animals through the production system. The slower the pigs grow then the longer they take to get to slaughter and the less efficient the production system becomes. The daily weight gain measure was calculated by each of the 3 integrators and was specific to that integrator because each considered growth over a different window of the pigs’ lives. These values are referred to as ‘raw DWG’ below. To permit some degree of cross‐integrator comparison we included an empirical calculation of average lifetime daily weight gain (ALDWG) at batch level that was derived from average carcase weight after slaughter (divided by 0.74 as a ‘killing out’ percentage) with 1.1kg subtracted as birth weight, and the total divided by the average age at slaughter. This value is referred to as ‘adjusted DWG’ below. Due to the nature of the study design, where samples were taken from three integrators, it is necessary to adjust for an integrator‐level effect. Unfortunately the size of the data set precluded the addition of further batch level effects, but in order to be conservative here we have calculated the means and 95% confidence intervals for the effect of pleurisy prevalence on these production variables, using an integrator‐level random effect and different variance components for each integrator. Table 5.3. gives means and 95% confidence intervals for the change in production variable per percentage increase from the adjusted model. It can be seen that increasing levels of pleurisy result in increasing slaughter age, a decrease in slaughter weight and increases in both the raw and adjusted daily weight gain measures. Note that the CI for the raw DWG measure is more variable than for the adjusted measure due to the fact that the raw measure is calculated slightly differently for the three integrators. However, the batch level random effects and variance components should adjust for this in the model, and so it is still a useful comparison.

Prospective study of the impacts of pleurisy 29
© 2009 BPEX. All Rights Reserved.
Table 5.3. Means and 95% confidence intervals for the change in production variable per percentage increase in pleurisy
Mean Low CI Upp. CI p-valueSlaughter weight (kg) -0.07 -0.14 0.00 0.04Daily weight gain (raw - g/day) -2.48 -4.15 -0.82 0.00Daily weight gain (adj - g/day) -1.55 -2.46 -0.64 0.00Slaughter age (days) 0.26 0.09 0.44 0.00
These values form the basis for calculations on the economic impact of pleurisy associated disease, given below.
Correlations between pleurisy prevalence and health, environmental and welfare associated variables during production: We also collected a series of environmental, health, and welfare associated variables during the production period at the batch level. Initially we considered associations between presence of antibodies against swine influenza, A. pleuropneumoniae (APP), PRRSV, M. hyopneumoniae, and M. hyorhinis (based on serological evidence) and pleurisy prevalence (Figure 5.5.). The odds ratios are presented in terms of per 10% increase in serological prevalence (10 blood samples were collected per batch).These were generated from a series of univariable logistic regression models with a fixed integrator effect to reflect the fact that there were systematically different herd management characteristics for each integrator. Note that we use a fixed rather than random effect here, since there are systematic differences between the operating characteristics of the integrators. These models fitted reasonably to the data, though there was some evidence of over‐dispersion, which can be adjusted for by using a quasi‐binomial model. Figure 5.5. shows the ORs from the binomial and quasi‐binomial model fits.
Figure 5.5. Comparative plots for ORs and 95% confidence intervals for the association between pleurisy and serological evidence for selected infectious agents.
The second component of the analysis considered health observation variables collected during the growing and finishing period. Variables that reflected clinically apparent disease on the farm were recorded on a weekly basis by the batch production managers. It was hypothesised that consistently

Prospective study of the impacts of pleurisy 30
© 2009 BPEX. All Rights Reserved.
high levels of clinical signs, over a period of weeks, could be an indicator of pleurisy in the batch. Only 67 out of the 80 batches were analysed, these being units that started recording at 12 weeks into the production cycle through to 22 weeks. The remainder recorded data over a shorter window and were excluded. The number of weeks that each clinical sign was recorded in the batch was then regressed against pleurisy prevalence, using logistic regression again with an integrator fixed effect. The resulting OR plots are shown in Figure 5.6. It can be seen that there is little evidence for associations once the integrator effect has been accounted for.
Figure 5.6. Odds ratios and 95% confidence intervals for the association between clinical signs of disease and pleurisy, based on weekly production diary data collected by unit managers. The ORs are per additional week that the clinical sign was observed (between weeks 12—22 of the production cycle). The left‐hand side plots allow for binomial errors and the right‐hand side plots allow for quasi‐binomial errors.
The observed absence of statistically significant associations was not unexpected – data was recorded on each unit by a different person and each person varied in motivation, assessment of clinical disease, and probably in other relevant ways.

Prospective study of the impacts of pleurisy 31
© 2009 BPEX. All Rights Reserved.
The final element of this analysis was to seek relationships between pleurisy and environmental, health and welfare observations made during the veterinary assessment visit when the pigs were aged 14‐16 weeks. The results in this section need to be treated with care. The data were highly variable, and although trends were detected, the assumptions of the underlying model (e.g. binomial error terms) were often violated ‐ though this was mediated to a great extent by fitting a multivariable model. To make our estimates more conservative, and to account for some of the over‐dispersion, a quasi‐binomial error term was used. As an exploratory screening process we fitted a series of logistic regression models, using an integrator fixed effect. The data were cleaned up in the same way as in part 1 of the study, and Table 5.4. shows the results from a series of logistic regression models, which include a fixed effect for integrator. In the unadjusted analysis we can see that total batch size and number of source units are important risk factors, as are vaccination status (some vs. none), production type (AIAO vs. none) and ventilation type (assisted vs. natural ventilation). Table 5.5. gives ORs and 95% confidence intervals for each of the most statistically significant variables, with the ORs for the total batch size and number of source units reflecting the odds ratio per additional pig and source unit respectively. The referent level for each categorical variable is highlighted as before with dashes, and the ORs represent the OR relative to the referent level. It can be seen that using a quasibinomial error term does not alter the estimate of the mean OR, rather it adjusts the standard errors and hence the length of the confidence intervals. When this is done only the number of source units remains statistically significant after adjustment. However, of particular interest is the effect of AIAO versus no AIAO. It was shown in part 1 (case‐control study) that AIAO systems seemed to be associated with lower pleurisy levels. However here we found the opposite effect. Exploring further we find that dropping the integrator effect results in highly insignificant LRTs for production type and total batch size; the number of sources, ventilation type and vaccination status remain important with or without the integrator effect. We conclude that the results for production type and total batch size are probably being driven by a few batches in one of the integrator systems. In any case we refer back to the caveat with this section that the data are highly variable and do not adhere to the assumptions underlying the model, leading to poor model fits. Many alternative transformations of the data, and link functions were tried and failed to address the problem, and it is probably indicative of the fact that there are other factors that need to also be included in the model. Of course it may also simply be that the variability is naturally very large, in which case much larger samples would be needed to elicit the level of detail required. To explore the former scenario, a multiple logistic regression model was developed. By far the most important variable in terms of the amount of deviance explained was the integrator, and so the baseline model was specified as one that included an integrator fixed‐effect. Any variables with less than 75 complete observations were removed to try to maximise power. The remaining variables were then screened by including each variable in turn to this baseline model and likelihood ratio tests used to test for the statistical significance. Any variable with a p‐value of <0.15 was made available to the multiple regression model. This left 15 variables (excluding integrator) to be passed to a manual stepwise routine. Due to missing values in some variables, we conducted the stepwise routine initially to just variables that were fully observed (12/15), and then checked the final model against those variables that had missing values afterwards, updating the model and data if necessary. The protocol followed was that each variable was added to the baseline model on its own, and the most highly statistically significant variable according to LRTs was chosen. This was then added to the baseline
Prospective study of the impacts of pleurisy 32
© 2009 BPEX. All Rights Reserved.
model. The effect of dropping each variable from the baseline model was then checked and any removed that had an LRT p‐value of >0.05. The process was then repeated until no further additions or deletions were statistically significant. The regression diagnostics were checked for the final model using residual plots, Cook’s distance and other influence measures such as dffit and dfbeta measures. There were two highly influential observations that were deleted from the data set, and the final model was fitted to 75 observations. A summary of the model output is given in Table 5.6. This time the model fits better, so the combination of variables helps to explain much of the excess variance. Some over‐dispersion still remains, and so the 95% confidence intervals for the odds ratios from using a quasibinomial error term are also shown, with the effect again being to widen the intervals. The number of source premises remains an important risk factor, and interestingly so does the presence of hospitalised pigs, which is perhaps acting as an indicator of the health status of the farm and likely reflects increased levels of respiratory disease. The source effect concurs with the finding in Part 1 that increasing number of sources from which a batch is sourced could be detrimental. This finding is logical on the basis of infections dynamics since the opportunity for susceptible pigs to meet infected and pathogen shedding pigs is enhanced. The prevalence of sneezing and the number of pigs per drinker seemed to be marginal protective effects, which were both counterintuitive and could not be explained from a biological point of view. Although the findings from this section are interesting, there are some issues with the study design that make interpretation difficult, in particular the lack of randomisation and the fact that there were very strong integrator effects. Adjustment terms for the latter were included in the model, but the data were more variable than expected. In contrast, the retrospective case/control study did not encounter these issues, and although underpowered due to the poor response rate, is a much more robust data set.

Prospective study of the impacts of pleurisy 33
© 2009 BPEX. All Rights Reserved.
Table 5.4. Results of independent logistic regression models fitted to each variable in turn, showing raw and adjusted p‐values from likelihood ratio tests (LRT) and number of non‐missing observations (N) for the variable in question. A fixed integrator effect was included, and both binomial and quasibinomial error distributions were used, the latter to account for overdispersion in the data.
Variable LRT p-value LRT (Bonferroni) LRT p-value LRT (Bonferroni) n# nsources 0.00 0.00 0.00 0.03 78Total # pigs in batch 0.00 0.00 0.00 0.08 80Vaccination status 0.00 0.00 0.02 0.62 80AIAO/None 0.00 0.05 0.07 2.12 80Ventilation 0.00 0.05 0.07 2.22 80# pigs per drinker 0.01 0.19 0.12 3.75 79>1 source building 0.01 0.37 0.15 4.68 80Prevalence fighting injury 0.01 0.43 0.15 4.91 80Kennelled housing 0.02 0.57 0.20 6.54 73Drinker 0.02 0.65 0.24 7.55 71Building types 0.02 0.68 0.19 6.22 80# buildings 0.05 1.68 0.27 8.59 80Qualitative dust score 0.07 2.19 0.41 13.09 77# hospitalised pigs 0.08 2.56 0.32 10.22 80Prevalence bursitis 0.13 4.22 0.40 12.65 80Prevalence sneezing 0.14 4.59 0.40 12.94 80Quantitative dust score 0.18 5.87 0.42 13.51 65Qualitative air score 0.19 6.23 0.59 19.01 80Minimum flow rate 0.24 7.69 0.51 16.22 75Prevalence coughing 0.25 8.04 0.51 16.44 80Prevalence scouring 0.36 11.54 0.60 19.26 80PCV2 vaccine 0.46 14.82 0.68 21.62 80Scrape through 0.53 16.86 0.72 23.01 80>1 week between repopulation 0.67 21.34 0.81 25.80 80Flooring 0.69 22.11 0.82 26.23 78Stocking density 0.78 24.97 0.87 27.93 77# EP1 shot 0.79 25.22 0.88 28.12 80
QuasibinomialBinomial
Table 5.5. Odds ratios and 95% confidence intervals for the most statistically significant variables from Table 5.4.
Variable Level Mean Low CI Upp. CI Low CI Upp. CI# nsources - 1.16 1.10 1.22 1.07 1.26Total # pigs in batch - 1.00 1.00 1.00 1.00 1.00Vaccination status False - - - - -
True 2.68 1.63 4.40 1.15 6.23AIAO/None False - - - - -
True 1.63 1.18 2.24 0.95 2.80Ventilation Assisted - - - - -
Natural 0.47 0.29 0.78 0.20 1.12
QuasibinomialBinomial

Prospective study of the impacts of pleurisy 34
© 2009 BPEX. All Rights Reserved.
Table 5.6. Summary output from a multiple regression model fitted to prospective risk factor data
Level OR Low CI Upp. CI p-value Low CI Upp. CI p-valuePresence of hospitalised pigs False - - - - - - -
True 2.03 1.51 2.72 0.00 1.33 3.09 0.00# source units - 1.24 1.16 1.34 0.00 1.12 1.38 0.00Prevalence of sneezing - 0.92 0.86 0.98 0.01 0.84 1.00 0.06# pigs per drinker - 0.99 0.98 1.00 0.00 0.98 1.00 0.03
QuasibinomialBinomial
Estimation of economic impacts of pleurisy: Economic impacts of pleurisy during the production stage:
Analysis of performance parameters indicated significant correlations between pleurisy prevalence and age at slaughter, daily weight gain within integrator, lifetime average daily weight gain, and slaughter weight. In addition, post‐weaning mortality was correlated with pleurisy (see Section 4, Retrospective Study). Using published data (BPEX 2007 Pig Cost of Production in Selected Countries) it is possible to allocate indicative costs to these parameters. Caution should be exercised in summing these apparently separate cost calculations because some of them are based on shared assumptions and consequences. The impact of pleurisy associated disease was calculated based on published cost implications of reduced average daily gain but it should be noted that this published figure relates to live weight and cannot take post‐slaughter trimming into account. Mortality: An average 3.3% increase in post‐weaning mortality was found for case units compared to control units in Part 1 of this project. BPEX data indicates that a 1% change in post‐weaning mortality equates to 40p per slaughtered pig. This indicates that case units (defined as pleurisy prevalence consistently at 10% or greater) suffer an additional cost 132p/pig on average, just though increased mortality. Average lifetime daily weight gain: The model predicted that average daily weight gain could be reduced by between 155‐248g/day) assuming a pleurisy prevalence of 100% within a group. The higher value was based on DWG information supplied integrators; the lower value was based on the estimated average lifetime daily weight gain. This equates to 1.55 – 2.48g/ day of lost daily gain for each 1% increase in pleurisy prevalence. For a batch of 1000 pigs with 10% pleurisy prevalence (taking the recent BPEX figure of 50p for every 50g/day reduction in daily live weight gain), this equates to a cost of 15‐25p per pig. Slaughter weight: The model predicted that average slaughter weight (after trimming) at batch level could be reduced by between 0.4 and 13kg (mean 7kg) assuming a pleurisy prevalence of 100%, equating to 0.07kg/pig for each 1% increase in pleurisy prevalence at batch level. For a batch of 1000 pigs with 10% pleurisy prevalence, and taking a March 2009 DAPP pig meat price of 138p/kg, this equates to lost income of 96p/pig. Slaughter age: The model predicted that slaughter age would be increased by between 9 and 43 days (mean 26 days) assuming a pleurisy prevalence of 100%, equating to an increase in age of 0.26 days for each 1% increase in pleurisy prevalence. Additional feed consumption can be taken as a rough indication

Prospective study of the impacts of pleurisy 35
© 2009 BPEX. All Rights Reserved.
of the cost of increased age at slaughter. Assuming that a finisher pig will consume 2.5kg feed/day purchased at £200/tonne (feed cost is 50p/day/pig) then for a batch of 1000 pigs with a 10% prevalence of pleurisy, an average increase in days to slaughter of 2.6 days equates to 130p/pig in increased feed costs. An alternative presentation of this effect is that each 1% increase in prevalence of pleurisy equates to an increase of 0.65kg of feed consumed. Note that average lifetime daily weight gain (ADWG) is derived from slaughter weight and slaughter age so an overall cost estimate should consider either ADWG implications or the sum of slaughter age and slaughter weight implications, but not all three. Economic impacts of pleurisy at the processing stage:
Batch B28 was studied (represented by Necropsy group N7 in Part 3). The batch, of 1191 pigs had a pleurisy prevalence of 9.9% based on carcase trimming prevalence and 14% based on assessment of abattoir pathology. Inclusion of the supply unit in Part 3 indicated a consistent pleurisy prevalence of >10% over the previous 24 months. Reduction in line speed: Timing for processing of a typical consignment showed a reduction in line speed of 8.5% (265 pigs/hr to 243 pigs/hr). Extrapolated across the entire batch this meant a total killing time extended from 271 minutes to 296 minutes (25 minutes extra). Staff costs associated with reduced line speed and pleurisy: These comprised of overtime costs for all line staff due to reduced line speed, an additional slaughter man at the trimming stand, and additional MHS inspection time:
• Line staff: 49 workers at £6.50/ hr at 1.5x pay for overtime for 25 minutes = £199. • Slaughter‐man on additional trimming duties: 296 minutes at £7.20/hr = £35 • MHS costs: assuming a team of Official Veterinarian (OV; £35/hr) and 5 inspectors (£27/hr), 25
minutes at £4.25/minute = £106.25. Total staff costs were therefore estimated at £340 for the 25 minute extension. Disposal costs: The cost of disposal was estimated from the prevalence of carcase (specifically pleural strips and ribcage trims) and offal trimming at batch level (determined from MHS CCIR data), an estimation of weight per trim (lungs and plucks at 1kg/item, carcase trim at 1.6kg per item (assumes 10% of pleurisy associated trimming was rib cage trim and 90% was pleural strip), and the price/tonne for disposal. This amounted to £14 for the batch. In total, these additional pleurisy associated costs amounted to £355 for the batch, or 29.8p per pig. The cost was strongly dependent upon the necessary reduction in line speed, which was in turn dictated by the prevalence of pleurisy in the consignment.

Necropsy‐based investigation of pleurisy 36
© 2009 BPEX. All Rights Reserved.
6. Necropsy‐based investigation of production units with a consistent pleurisy problem at slaughter
The aim of this part of the project was to provide information to assist BPEX members and veterinarians in identifying the best way to follow up a high BPHS pleurisy score. For example, are there factors to consider in selection of optimum animals for necropsy investigation? Are certain diagnostic investigations likely to be more valuable than others?
Objectives: a) To characterise more accurately the pathology of pleurisy on units with consistently high
prevalence.
b) To determine if there are associations between pleurisy and other gross or histopathologic pathology in affected pigs.
c) To determine if there are associations between pleurisy and selected infectious agents.
d) To determine if there are associations between pleurisy and ante‐mortem clinical observations in order to assist vets in selecting appropriate pigs for sacrifice / investigation.
e) To identify the ante‐mortem features of pigs that, when necropsied, were more likely to result in a causal diagnosis of respiratory disease being reached. This is an attempt to assist on‐farm selection of the most appropriate animals for sacrifice and investigation of respiratory disease in general.
Methods: 1. Selection of target units:
Units (12 in total) were selected based upon the following criteria: • Agreement with the definition of ‘case’ unit according the Part 1 of the project (≥10%
prevalence of pleurisy on at least 3 occasions in the 2 year period ending September 2008).
• Close proximity to Bury St Edmunds or Thirsk VLA centres for delivery of necropsy pigs.
• Agreement of private vet and producer to participate. 2. Selection of necropsy pigs (79 in total across all units) by veterinarian:
a. Pigs (6‐9 per unit) were selected by a veterinarian and identified.
• The 3 youngest pigs showing signs of dyspnoea.
• A further 3 or more pigs (usually to maximum of 9 in total), of older ages, also showing dyspnoea if possible.
• Where dyspnoeic pigs could not be found then pigs with other respiratory signs were selected.
3. Recording of clinical history, vaccination and medication prior to necropsy. 4. Gross pathology, histopathology, and diagnostic investigation (see Table 5.1):
All pigs were delivered to VLA veterinary investigation centres at Bury St Edmunds or Thirsk for necropsy investigation. Pigs were subject to ante mortem assessment, then euthanased, and

Necropsy‐based investigation of pleurisy 37
© 2009 BPEX. All Rights Reserved.
subjected to gross necropsy. Samples were collected for histopathology and for detection of bacterial and viral pathogens by culture, PCR, histopathology, and immunohistochemistry according to standard VLA operating procedures. Data collection forms for on‐farm selection, gross necropsy, and histological assessment are given in Annex 3.
Table 6.1: Variables reported in necropsy investigation.
Variable group Variable parameters Identification Necropsy and Pig ID N1‐N14, Pig1‐9 VLA ref Standard VLA ref Necropsy group N1‐N14 Slap mark Alphanumeric Pleurisy status
Overall pleurisy status for pig None, active, resolved
Clinical history VLA Body condition (assessed at VLA) Normal, poor Age Weeks Sex M, F Body weight Kg Lethargy (on farm) True, false Sneeze (on farm) True, false Cough (on farm) True, false Dyspnoea (on farm) True, false Combined respiratory signs (on farm) True, false Conjunctivitis (on farm) True, false Faeces: consistency Normal , abnormal Medication Recent medication (in last 5‐7d) Yes, no, don’t know Vaccination EP vaccinated Yes, no, don’t know PCV2 vaccinated Yes, no, don’t know PRRSV vaccinated Yes, no, don’t know Gross pathology Pleural abscessation) True, false EPscore (proportion of anteroventral
lung consolidation) 1‐55% (continuous scale)
EP severity (from EP score)
None, mild, moderate, severe
Caudal consolidation (of lung) True, false Firm lung True, false Pulmonary Oedema True, false Pulmonary Necrosis True, false Pulmonary Abscessation True, false Pericarditis True, false Peritonitis True, false Arthritis True, false Gastric Ulceration True, false

Necropsy‐based investigation of pleurisy 38
© 2009 BPEX. All Rights Reserved.
Variable group Variable parameters Tracheobronchial lymph node
enlargement
Other lymph node enlargement True, false Colitis Absent, present Nephritis (white foci on / in cortex) True, false Histopathology
Pneumonia ‐ stage Acute (onset in last 5‐7d); chronic (>7d)
Pneumonia – location
Broncho, broncho‐interstit., interstit.
Bacteriology of lung P. multocida True, false A. pleuropneumoniae True, false S. suis True, false H. parasuis True, false A. pyogenes True, false Mycoplasma in lung M. hyopneumoniae in lung by PCR True, false M. hyorhinis in lung by PCR True, false M. hyopn assoc. pneumonia True, false M. hyorhinis assoc. pneumonia True, false Virology PRRSV viraemia (PCR on serum) True, false PCV2 assoc pneumonia True, false Lymphoid PCV2 assoc disease True, false Swine influenza virus in lung (isolation) True, false Achievement of respiratory diagnosis
Finding of lung or pleural pathology in association with an explanatory infectious agent.
True, false
Some of the variables described in Table 6.1 were derived by distillation of more extensive raw data as follows: a) Pleurisy status (none, active or resolved): Pleurisy status was determined by combining gross necropsy data and histopathological data to take into account the lower sensitivity of gross observations (early or mild lesions might only be detectable by histopathology), and to account for the possibility that the histopathological sample might not, due to sampling or processing error, have been representative of the gross pathology (see Table 5.2). Gross pleurisy was assessed as being either fibrinous or fibrous, with lesions size recorded as localised or extensive. For analysis these were distilled down to presence or absence with presence described as fibrinous or fibrous. Histopathological pleurisy was described according to stage (none, acute, sub‐acute, chronic‐active, chronic) and severity (none, mild, moderate, severe). For analysis these were distilled down to presence or absence of pleurisy and histological stage. See Annex 3 for details of data collection.

Necropsy‐based investigation of pleurisy 39
© 2009 BPEX. All Rights Reserved.
Table 6.2. Determination of pleurisy status by combination of gross and histopathological data.
Gross Histological
none fibrinous fibrous
None none active resolved Acute active active active Subacute active active active Chronic‐active active active active Chronic resolved active resolved
b) EP (enzootic pneumonia) severity score: an assessment of gross lung consolidation as an indication
of low‐grade pneumonia in the antero‐ventral regions of lung. The raw EP scores (Goodwin method) at gross necropsy were categorised as ‐ none = 0%; mild=1‐9%; moderate=10‐29%; severe=30‐55%.
c) Histopathological assessment of pneumonia: Raw data was condensed to give the following summaries (see Annex 3 for data collection):
i. Pneumonia stage: None, acute, chronic Derived from a severity score (none, mild, mod., severe) – condensed down to present or absent), together with a stage score (acute, subacute, chronic‐active, chronic) ‐ condensed to none, acute (acute signs present irrespective of presence or absence of chronic lesions), chronic (acute signs absent).
ii. Pneumonia location (broncho‐, broncho‐interstitial, interstitial). d) Mycoplasma hyopneumoniae associated pneumonia: the presence of cuffing pneumonia by
histopathology plus detection of M. hyopneumoniae by IHC OR PCR. e) Mycoplasma hyorhinis associated pneumonia: presence of cuffing pneumonia by histopathology
plus M. hyorhinis by PCR (IHC not available). f) PCV2 associated pneumonia: based on histopathology of pneumonia with interstitial component
together with positive and significant PCV2 IHC staining. g) Lymphoid PCV2 associated disease: based on lymphoid histopathology of PCV2 inclusion bodies,
giant cells, lymphoid depletion of follicles, and PCV2 specific IHC staining. h) Respiratory diagnosis: Detection of lung or pleural pathology in association with an explanatory
infectious agent. Diagnoses could be bacterial or viral. PRRSV viraemia was only considered as an explanatory infectious agent for this definition where pneumonia included an interstitial element.
5. Analysis of data: Analysis was restricted to descriptive assessment of the associations between
necropsy findings and pleurisy. Full statistical analysis was not possible due to the small sample population and large range of variables considered for each sample. Each objective was considered in turn.
Results:

Necropsy‐based investigation of pleurisy 40
© 2009 BPEX. All Rights Reserved.
1. To characterise more accurately the pathology of pleurisy on units with consistently high prevalence. Pleurisy pathology was determined at gross and histopathological levels. Gross signs of pleurisy at necropsy were categorised by the presence of fibrinous or fibrous lesions on the lung surface. The presence of fibrin (a solid but friable exudate on the lung surface) was considered to be evidence of a recent or ongoing and active pleurisy. Fibrous lesions, much more difficult to break down by fingers, develop as part of the healing process after the fibrinous stage and were considered to be evidence of a resolving or resolved pleurisy. The extent of gross pleurisy lesions was recorded for future use but, due to an excess of data, this latter information was not included in the current analysis. Microscopic pathology of the pleural surface was done by histopathological examination of haemotoxylin and eosin stained sections of lung. Each section was examined in a systematic manner for evidence of ongoing or resolving pleurisy. The presence or absence of factors including fibrin, haemorrhage, inflammatory cells, vasculitis, and collagen was assessed in order to give a standardised assessment of each section. Information from gross necropsy was combined with the results of histopathological assessment (stage, severity, and extent) to yield an overall assessment of pleurisy in terms of absence, active pleurisy and resolved pleurisy (see methods). Evidence of active or resolved pleurisy was found in each of the 12 necropsy groups (see Table 6.3). The number of pigs with any pleurisy lesions ranged from 2‐6 per group. Active pleurisy was found in between 1‐4 pigs/group and resolved pleurisy was found in between 0 ‐5 pigs/group. Distribution of pigs categorised by group and pleurisy as none, active, and resolved pleurisy is shown in Figure 6.1 and Table 6.3.

Necropsy‐based investigation of pleurisy 41
© 2009 BPEX. All Rights Reserved.
Table 6.3: Summary of key pleurisy, aetiological, pathological, and historical features of the 12 necropsy batches (note N12 +N13 not done). Organism/condition Method N1 N2 N3 N4 N5 N6 N7 N8 N9 N10 N11 N14 No. pigs 9 7 9 6 6 6 6 6 6 6 6 6 Pleurisy status None gross and histology 4 2 7 0 1 1 0 4 1 0 0 3 Active gross and histology 4 2 2 2 3 2 3 1 2 1 2 1 Resolved gross and histology 1 3 0 4 2 3 3 1 3 5 4 2 Bacteria (isolated from lung/pleura) P. multocida culture 6 0 0 0 1 1 1 1 1 1 1 0 A. pleuropneumoniae culture 1 2 0 0 0 1 0 1 0 0 0 1 S. suis* culture 1 (st4) 0 1 (st8) 1 (st15) 1 (st?) 0 1 (st22) 1 st2) 2(st7+3) 0 0 1 (st?) H. parasuis culture 0 0 0 0 0 0 1 1 1 0 0 0 A. pyogenes culture 1 0 0 0 1 0 1 1 0 0 4 1 E. rhusiopathiae (joint) culture 0 0 0 0 0 2 0 0 0 0 0 0 M. hyopneumoniae PCR 1 0 0 1 0 3 0 1 2 1 0 0 M. hyorhinis PCR 5 4 5 0 2 0 1 3 2 4 2 3 Histological
stage Acute pneumonia histology 2 0 4 1 2 0 1 1 2 2 1 1 Chronic pneumonia histology 4 5 5 5 4 6 5 4 4 3 5 4
location Broncho‐ histology 1 1 6 0 0 0 4 2 1 0 3 3 Broncho‐interstitial histology 4 4 1 5 5 6 2 3 5 4 3 2 Interstitial histology 1 0 1 1 1 0 0 0 0 1 0 0
aetio M. hyopn. pneumonia histology+ IHC/PCR 0 2 1 3 0 3 0 1 1 1 0 0 M. hyorh. pneumonia histology+ PCR 4 2 1 0 0 0 1 3 2 2 2 0 PCV2 pneumonia histology+IHC 4 0 1 1 0 0 0 3 4 2 2 2 Lymphoid PCVAD histology+IHC 4 0 0 3 0 0 0 0 3 1 0 2 Virology PRRSV viraemia PCR 3 2 0 1 0 1 5 2 3 1 2 3 Influenza isolation 0 0 1 0 0 0 0 0 0 0 0 0 Vaccination EP y y y y y y y y no y no y PCV2 y no no y y y y y y y y y PRRSV no no no no no y y no no no no y
* serotype of S. suis is indicated in parentheses.

Necropsy‐based investigation of pleurisy 42
Fig. 6.1. Distribution of pigs (n=79) by necropsy group and categorisation according to findings of no, active, or resolved pleurisy lesions. The y‐axis legend should read ‘% pigs in group’.
2. To determine if there are associations between pleurisy and other gross or histopathologic pathology in affected pigs. Associations were sought between pleurisy and pneumonia as indicated by other lung pathology (gross and histopathological), and between pleurisy and a range of other gross pathological findings. Relationship between pleurisy and pneumonia: Enzootic pneumonia (EP)‐like lesions were categorised such that pigs were considered to have no (19 pigs), mild (13), moderate (27) or severe (13) EP‐like lesions and an apparent relationship was noted between the presence of active pleurisy and severe EP‐like lesions (Figure 6.2). Associations between EP‐like lesions and resolved pleurisy were less apparent. The presence or absence of caudal lung lobe consolidation was recorded as an additional indication of more severe EP‐like lesions. Figure 6.3 indicates that again an association was present between the presence of active pleurisy and more severe EP‐like lesions (as indicated by caudal lobe consolidation). Lungs were assessed for relative firmness on palpation as an indication possible interstitial pneumonia. Firmness of lungs on palpation was recorded for only 9 pigs but all of these cases were associated with pleurisy (see Figure 6.4).

Necropsy‐based investigation of pleurisy 43
Figure 6.2. Distribution of gross EP‐like lesions among pigs with no, active, or resolved pleurisy.
Figure 6.3. Distribution of caudal lung lobe consilidation among pigs with no, active, or resolved pleurisy.
These gross observations were supported by a striking relationship between pleurisy and the presence of pneumonia at histological level. In summary, 8 pigs showed no microscopic pneumonia, 17 pigs showed acute microscopic pneumonia, and 54 pigs showed chronic pneumonia. Of the 56 pigs found to have pleurisy (active or resolved) only 2% had no microscopic evidence of pneumonia, and all of the pigs with active pleurisy had microscopic evidence of pneumonia. Pigs affected by pleurisy were much more likely to show chronic, than acute, pneumonia (Figure 6.5).

Necropsy‐based investigation of pleurisy 44
Figure 6.4. Distribution of lungs that were firm on palpation among pigs with no, active, or resolved pleurisy.
Figure 6.5. Histological stage of pnuemonia (none, acute, chronic) according to pleurisy presence (active or resolved) or absence.
Relationships were also sought between pleurisy and the location of microscopic pneumonia (categorised at none, bronchopneumonia, brocho‐interstitial, or interstitial pneumonia). In summary, 71 of the 79 pigs studied had evidence of pneumonia at microscopic level, 21 of these 71 pigs showed bronchopneumonia (B), 45 showed broncho‐interstitial (BI)pneumonia, and 5 showed interstitial (I) pneumonia. Pigs affected by pleurisy were much more likely to show broncho‐interstitial pneumonia compared to pigs unaffected by pleurisy (Figure 6.6). However, it should be noted that BI was by far

Necropsy‐based investigation of pleurisy 45
the most prevalent location for pneumonia, so care should be taken in interpretation of this observation.
Figure 6.6. Histological location of pnuemonia (none, bronchopneumonia, broncho‐interstitial, and interstitial pneumonia) according to pleurisy presence (active or resolved) or absence.
Relationship between pneumonia nd other gross pathology: During gross necropsy, the presence of absence of pericarditis, peritonitis, gastric ulceration, lymph node enlargement, colitis, loose faeces, and nephritis was assessed. A relationship was noted between the presence of active pleurisy and pericarditis and peritonitis. Pericarditis was found in 19 of the 79 pigs studied and, notably, it was only recorded in pigs that were subsequently shown t o have pleurisy. Pericarditis was noted in a slightly greater proportion of pigs with actve pleurisy than with resolved pleurisy (see figure 6.7). Peritonitis was recorded for 23 of the 79 pigs studied. While 36% of pleurisy affected pigs showed peritonitis, only 13% of pigs without pleurisy were affected. Peritonitis was noted in a greater proportion of pigs with actve pleurisy than with resolved pleurisy (see figure 6.8). Gastric ulceration (GU) was recorded in 19 of the 79 study pigs. On a percentage basis, 17% of pigs without pleurisy showed GU, while 27% of pigs with any pleurisy showed GU (Figure 6.9). The association appeared to be stronger for pigs with active pleurisy (32% of this group affected). Lymph node enlargement was assessed at necropsy. Tracheobronchial lymph node (TBLN) enlargement was recorded separately to that of other lymph nodes (OLN). In total, of the 79 study pigs, 51 showed TBLN enlargement and 43 showed OLN enlargement. Proportionately more pigs showed TBLN and OLN enlargement in the group with any pleurisy compared to pigs with no pleurisy (see Figure 6.10). However, this association between lymh node enlargement and pleurisy was most marked for the group showing resolved pleurisy (proportion of resolved pleurisy group with enlarged TBLN=65%, OLN=42%; proportions for no pleurisy group were TBLN=17%, OLN=22).

Necropsy‐based investigation of pleurisy 46
Figure 6.7. Distribution of pigs with pericarditis according to pleurisy presence (active or resolved) or absence.
Figure 6.8. Distribution of peritonitis lesions according to pleurisy presence (active or resolved) or absence.

Necropsy‐based investigation of pleurisy 47
Figure 6.9. Distribution of lesions of gastric ulceration according to pleurisy presence (active or resolved) or absence.
Figure 6.10. Distribution of recorded enlargement of tracheobronchial and other lymph nodes according to pleurisy presence (active or resolved) or absence.
Colitis was recorded in 14, and loose faeces in 29, of the 79 study pigs. There was a tendency for these disorders (especially loose faeces)to be more commonly found in the group with no pleurisy (Figure 6.11). This may have reflected the fact that all study pigs were selected because of apparent illness and, given that the unaffected group did not have pleurisy there were likely to have been other reasons for their ill health (enteric disease being one possible reason).

Necropsy‐based investigation of pleurisy 48
Figure 6.11. Distribution of recorded signs of colitis and loose faeces in study pigs according to pleurisy presence (active or resolved) or absence.
Finally, the gross finding of nephritis was recorded for study pigs as indicated by the presence of white foci on or in the renal cortex. In total only 12 of the 79 study pigs showed gross nephritis and there was a tendency for a greater proportion of pigs to be affected by nephritis in the group with pleurisy (18%) than the group without pleurisy (9%) (Figure 6.12). However, due to the small sample population showing nephritis, this finding should be interpreted with caution.
Figure 6.12. Distribution of recorded signs of colitis and loose faeces in study pigs according to pleurisy presence (active or resolved) or absence.

Necropsy‐based investigation of pleurisy 49
3. To determine if there are associations between pleurisy and selected infectious agents.
Extensive investigations were undertaken to identify bacterial and viral agents associated with pleurisy in the study pigs. A summary of findings at group level is presented in Table 6.3. The table includes pathogens believed to be of respiratory importance, but which may have been isolated from non‐respiratory sites. The relatively sparse isolation of infectious agents and small number of groups made statistical analysis inappropriate. Briefly, of the 12 study groups, P. multocida was isolated by culture from 8/12, A. pleuropneumonia from 5/12, S. suis from 8/12, H. parasuis from 3/12, A. pyogenes from 6/12, E. rhusiopathiae from 1. Testing for mycoplasmas by PCR revealed M. hyopneumoniae in 6/12 groups and M. hyorhinis in 10/12 groups. As an additional tool, histologic evidence of cuffing pneumonia together with detection of mycoplasma by immunohistochemistry (IHC) or PCR was classified as M. hyopneumoniae‐associated pneumonia (found in 7/12; 6 of these 7 had used a vaccine against M. hyopneumoniae) or M.hyorhinis‐associated pneumonia (found in 8/12 groups). PCV2‐associated pneumonia (determined by histological evidence of pneumonia with an interstitial element plus PCV2 detection by IHC) was reported in 8/12 groups with no apparent relationship to PCV2 vaccination. Lymphoid PCV2‐associated disease (where there was evidence of lymphoid depletion, giant cells, histiocytic infiltration together with PCV2 detection by IHC) was detected in 5/12 groups with no apparent relationship to PCV2 vaccination. No clear relationship between pleurisy and these infectious agents could be determined at batch level.
Assessment, at individual level, of the relative association between infectious agents and the presence of active, resolved or no pleurisy indicated some marked trends (see Figure 6.13) although, due to the low frequency of isolations for the majority of infectious agents, statistical analysis was not done.
Figure 6.13. Distribution of isolated infectious agents, expressed as proportion of pleurisy group that were affected (no pleurisy, active pleurisy and resolved pleurisy).

Necropsy‐based investigation of pleurisy 50
Infectious agents were identified in 66 of the 79 pigs studied. Of these 66 pigs, the number of infectious agents identified per pig varied from 1 to 6.
Figure 6.14. Distribution of isolated infectious agents, expressed as proportion of all isolates of a given pathogen, according to pleurisy group (no, active or resolved pleurisy).
Apparent relationships with pleurisy were noted for the following infectious agents (the actual numbers and percentages are given in Figs 6.13 and 6.14): Isolation of P. multocida was more frequent in pleurisy affected pigs (especially those with active pleurisy) versus unaffected pigs. A. pleuropneumoniae was only isolated from pleurisy affected pigs, although only 5 isolates were found in total. A. pyogenes was only isolated from pluerisy affected pigs (only 8 isolates). There were only 9 cases of M. hyopneumoniae detectd by PCR but the great majority of these came from pigs with pleurisy. Considering mycoplasma associated pneumonia more specifically, a strong relationship was observed for both M. hyopneumoniae‐associated pneumonia, and M. hyorhinis‐associated pneumonia, and pleurisy. For the former pathogen, 100% of cases came from pigs with pleurisy and for the latter, 76% of cases came from pigs with pleurisy. However, for M.hyorhinis‐associated pneumonia the association in terms of prevalence within the pleurisy groups was less marked though still apparent for the active pleurisy group. In terms of viral infections, PRRS viraemia was strongly related to pleurisy (83% of isolates came from pleurisy affected pigs). There indications of strong relationships between circoviral diseases and pleurisy. PCV2‐associated pneumonia was strongly associated with pleurisy, in particular with active pleurisy (89% of all PCV2 pneumonia cases had pleurisy, 53% were from actve pleurisy cases). Pleurisy was also strongly associated with lymphoid PCV2 associated disease (100% of cases (13 in total) arose from pleurisy affected pigs). Little or no apparent pleurisy association was found for a number of infectious agents. For example, S. suis (8 isolates), and H. parauis (3 isolates). The frequency of detection of M. hyorhinis per se (rather than M. hyorhinis‐associated penumonia) was high in both pleurisy affected and unaffected groups. Swine influenza virus was isolated only from 1 pig and was not considered in the analysis. Salmonella enterica Typhimurium was isolated from a total of 5 pigs representing 4 necropsy groups but no association could be made with pleurisy.

Necropsy‐based investigation of pleurisy 51
4. Determination of associations between pleurisy and ante‐mortem clinical observations.
Relationships between ante mortem clinical observations and post mortem detection of pleurisy could be useful tools in the selection of the most appropriate pigs for necropsy investigation. Relationships were sought between the prevalence of pleurisy at post mortem and the prevalence of differences in body condition (normal or poor), age at necropsy, sex, and the findings of lethargy, sneezing, coughing, dyspnoea, and conjunctivitis before sacrifice.
Figure 6.15. Relationship between body condition (poor or normal) at ante mortem examination and pleurisy (none, active, resolved) at post mortem.
No clear relationship was found between body condition and pleurisy (Figure 6.15). However, an association was noted with age at necropsy. Of the 11 pigs aged <9 weeks at necropsy only 1 was found to have pleurisy (active) (Figure 6.16). Eighty two percent of the group (10 pigs) aged <9weeks
Figure 6.16. Relationship between age at necropsy and pleurisy (none, active, resolved) at post mortem.

Necropsy‐based investigation of pleurisy 52
showed no evidence of pleurisy at necropsy. However, as the age at necropsy increased from 9‐15 weeks through to >16 weeks, the relative proportion of pigs with any or resolved pleurisy lesions increased such that that, at 9‐15 weeks of age 75% of the pigs had pleurisy, and 91% of pigs aged >16 weeks were found to have pleurisy.
An apparent relationship was found between sex and detection of pleurisy (Figure 6.17). Forty seven (60%) of the 79 study pigs were male and 32 (40%) were female. Sex distribution in the no pleurisy group and resolved pleurisy groups were each approximately 50%. However, 76% of all pigs with active pleurisy were male.
Figure 6.17. Relationship between age at necropsy and pleurisy (none, active, resolved) at post mortem.
Ante mortem clinical observations for presence of lethargy, coughing, sneezing, dyspnoea and conjunctivitis were recorded for 61 of the 79 study pigs. In addition, the number of pigs showing any respiratory signs (i.e. one or more of either coughing or sneezing or dyspnoea) was recorded. Twenty five of the recorded pigs showed lethargy, 24 showed coughing, 12 showed sneezing, 34 showed dyspnoea, 49 showed any respiratory sign, and 9 pigs showed conjunctivitis. Associations between the observed clinical sign and pleurisy were noted for all of these observations but none appeared to be highly discriminatory (see Figure 6.18).
A simple analysis of sex distribution for respiratory signs and lethargy indicated that while similar proportions of males and females showed any respiratory signs (79% and 81% respectively), distribution of sex for lethargy was more uneven (46% of males, versus 31% of females).

Necropsy‐based investigation of pleurisy 53
Figure 6.18. The frequency of ante mortem clinical observations according to subsequent pleurisy status (none, active, resolved).
5. Identification of ante‐mortem features of pigs that, when necropsied, were more likely to result in a causal diagnosis of respiratory disease being reached.
The 79 study pigs were categorised according to whether or not a final diagnostic outcome for respiratory disease was achieved (i.e. pathology was found in conjunction with an infectious agent whose presence might explain that pathology). This diagnostic outcome for respiratory disease, rather than for pleurisy, was selected because of the apparent interaction between the pathology of pneumonia and pleurisy and likely often shared underlying infectious causes. An analysis of the relationship between pleurisy groups and ultimate respiratory diagnosis showed that pigs with either active or resolved pleurisy were both more likely to reach a respiratory diagnosis compared to pigs with no pleurisy (Figure 6.19, 77% for pigs with pleurisy, 48% for pigs without pleurisy).
Fig 6.19. Relationship between pleurisy group and achievement of respiratory diagnosis.

Necropsy‐based investigation of pleurisy 54
Associations were sought between ante mortem clinical findings (age, sex, body condition, lethargy, any respiratory signs, and recent medication) and achievement of respiratory diagnosis.
Age at necropsy appeared to be strongly associated with diagnostic outcome (Figure 6.20). For pigs aged <9 weeks only 36% of necropsied animals yielded a respiratory diagnosis. This was in comparison to 71% and 64% of pigs necropsied at 9‐15 weeks and >16 weeks respectively.
The sex of pigs appeared to be associated to diagnostic outcome (Figure 6.21). Of 47 male pigs submitted for necropsy, a respiratory diagnosis was achieved in 77% of them. In comparison, a respiratory diagnosis was reached in 56% of female pigs (32 submitted).
The likelihood of achieving a respiratory diagnosis appeared to be greater for pigs that were in normal, compared to poor, body condition at necropsy (Figure 6.22; 73% versus 60% respectively). There was a similar tendency of more frequent respiratory diagnosis for pigs that showed ante mortem respiratory signs versus those that did not (Figure 6.23, 65% for pigs with respiratory signs compared to 50% for pigs with no respiratory signs).
Figure 6. 20. Relationship between age at necropsy and proportion of cases for which a respiratory diagnosis was reached.

Necropsy‐based investigation of pleurisy 55
Figure 6.21. Relationship between sex and proportion of cases for which a respiratory diagnosis was reached.
The observation of lethargy at antemortem showed no apparent association to subsequent respiratory diagnosis (64% for cases showing lethargy reached a respiratory diagnosis versus 61% for cases that showed no lethargy). Finally, a comparison of pigs which had documented evidence of recent medication (within the week preceeding necropsy) with those had no documented evidence of recent medication revealed no striking difference in the proportion of cases that reached a respiratory diagnosis.
Figure 6.22. Relationship between body condition and proportion of cases for which a respiratory diagnosis was reached.
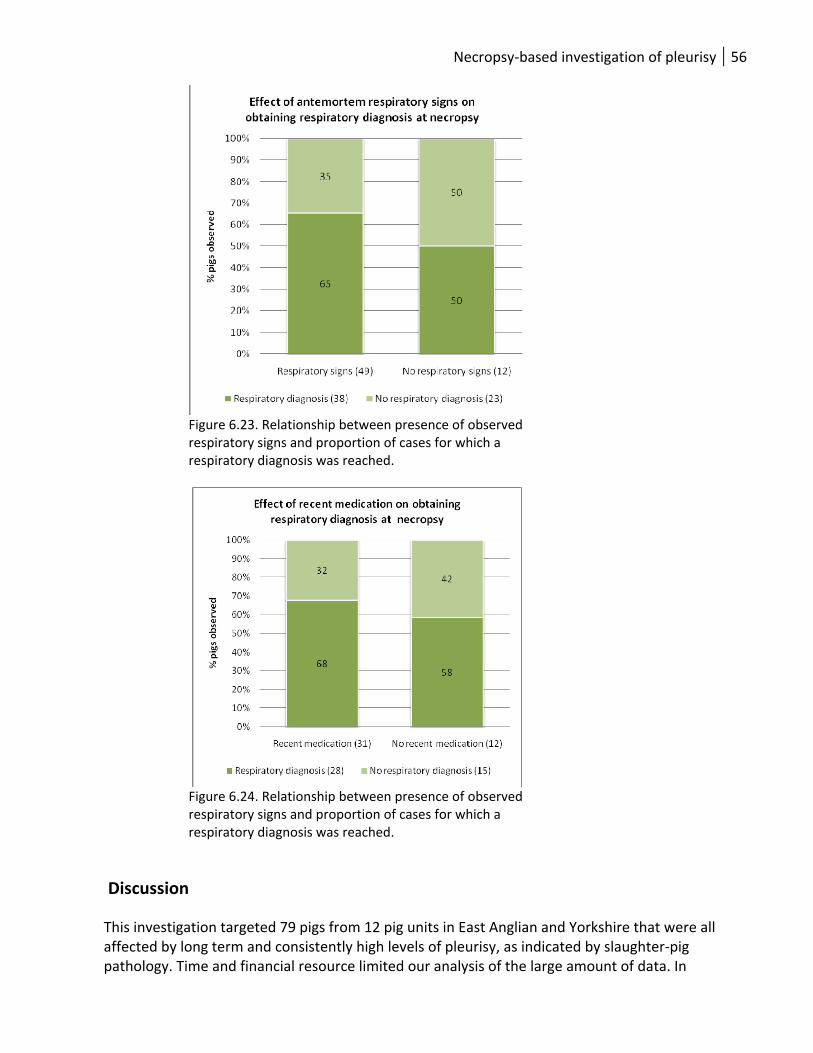
Necropsy‐based investigation of pleurisy 56
Figure 6.23. Relationship between presence of observed respiratory signs and proportion of cases for which a respiratory diagnosis was reached.
Figure 6.24. Relationship between presence of observed respiratory signs and proportion of cases for which a respiratory diagnosis was reached.
Discussion This investigation targeted 79 pigs from 12 pig units in East Anglian and Yorkshire that were all affected by long term and consistently high levels of pleurisy, as indicated by slaughter‐pig pathology. Time and financial resource limited our analysis of the large amount of data. In

Necropsy‐based investigation of pleurisy 57
particular, the small population size and large number of variables meant that full statistical analysis was not feasible. A valuable resource of background farm and pig information, ante mortem clinical signs, post mortem findings (gross and microscopic), archived blood and tissue samples, and an extensive data set of information on isolated bacterial ad pathogens was generated. Our initial analysis was from the perspective of pleurisy and the likely associations with above data. However, the resource offers great potential for future studies focused on different aspects of the pathology found in these pigs (for example, pneumonia, pericarditis, or peritonitis). Interesting observations emerged from this study that could be of value to pig producers and veterinarians in planning diagnostic investigations of pleurisy. Our study showed that a group size of at least 6 pigs should be considered when planning necropsy investigations. Given that this study targeted units with a consistent pleurisy prevalence of 10% or greater at slaughter then it might proposed that, where pleurisy prevalence is lower than this, even greater group sizes are selected for necropsy. Pathology of pleurisy and relationship with other pathology: Pleurisy was categorized into 2 forms, active or resolved, based on a combination of gross and histological findings. This allowed for increased sensitivity of detection. This approach allowed for the detection of early or low grade but active pleurisy that was not visible at gross level, and allowed for the detection of pleurisy that, while apparently resolving at gross level, had active elements according to microscopic examination. The discrimination of pleurisy into active and resolving categories was considered to be important because those pigs with active pleurisy might be more informative in terms of associated pathology and infectious agents. Our data showed clear relationships between the two recognized origins of pleurisy – underlying pneumonia or polyserositis. Although not all pigs with pneumonia (assessed at both gross and microscopic levels) had pleurisy, almost all pigs with pleurisy had some degree of pneumonia. Furthermore, pigs with active pleurisy were more likely to have ongoing severe EP‐like lesions (Fig 6.2.), including caudal lung lobe consolidation, than pigs with no pleurisy or pigs with resolved pleurisy lesions. Although not all pigs with pneumonia presented with pleurisy, those that did showed a marked tendency for chronic (versus acute) broncho‐interstitial pneumonia (Figs 6.5, 6.6). We found evidence for marked lymph node enlargement in pleurisy affected groups, especially pigs with resolved (longer standing pleurisy) and this likely reflects underlying long term pneumonia. Taken together, these findings emphasise the likely progression of pleurisy from longer standing underlying pneumonia and highlight the importance of all those risk factors that are already known to impact on pneumonic disease in pigs. Pleurisy is also described as a serositis (inflammation of the serosal , or mesothelial, membranes that line the pleural, peritoneal, pericardial, synovial, and meningeal space). Polyserositis (where multiple serosal membranes are inflamed) can arise following blood‐borne spread of infectious agents, and this is considered to be an alternative route, in addition to progression from underlying pneumonia, for the initiation of pleurisy. Our study identified a number of pigs with polyserositis – pericarditis and / or peritonitis but always in conjunction with pleurisy. However, the evidence from this study indicated that pleurisy was almost always a consequence of chronic, typically broncho‐interstitial, pneumonia.

Necropsy‐based investigation of pleurisy 58
Gastric ulceration appeared to be particularly associated with active pleurisy and suggests that these pigs were more likely to be inappetant, and consequently to suffer reduced growth. Reasons for inappetance might include pleuritic pain or inappetance associated with systemic disease or toxaemia from ongoing respiratory disease. There was a tendency for colitis and looseness of faeces to be found in the group of pigs unaffected by pleurisy and this emphasizes the fact that all pigs in this study were selected on the basis of ill‐health with apparent respiratory disease at ante mortem. However, some of these apparent clinical signs of respiratory disease may not be specific – for example lethargy, while others such as dyspnoea might be explained by other factors such underlying discomfort. So, the study design might have selected for increased incidence of other diseases in the group unaffected by pleurisy. Relationships between pleurisy and infectious agents: Consideration of the relative importance of different infectious agents in pleurisy was hampered by the small sample population and low frequency of isolations for specific infectious agents. In addition, the close relationship between pneumonia and pleurisy must be borne in mind when considering the relative importance of these infectious agents. There was enormous scope for more detailed analysis of the collected data but time and resource restricted us to preliminary work seeking simple relationships between pleurisy and single, but not combined, infections. We identified the expected relationships between pleurisy and secondary invading bacteria such as P. multocida and A. pyogenes – organisms that are well recognized as significant super‐infections in respiratory disease. This emphasized the very close relationship between pleurisy and pneumonic disease, as opposed to pleurisy of a systemic origin. Our finding of a strong association between isolation of A. pleuropneumoniae (APP) and pleurisy was also of no surprise given the body of literature on this relationship. A surprisingly low number of isolations of APP were made (5) and it is important to note that these isolates arose on five separate units, emphasizing the difficulty of isolating this pathogen and the need for group sizes of at least 6 pigs. Detection of APP by tonsil swabbing of greater numbers of live pigs might be considered an alternative approach to investigation but necropsy has the advantage that the pathologic lesion can be cultured and the possibility of confusion over non‐pathogenic APP strains resident in the upper respiratory tract can thereby be avoided. There were clear relationships between mycoplasmas and pleurisy. This relationship was studied at 2 levels: by the presence of mycoplasmas in lung tissue (by PCR), and by the presence of mycoplasma‐associated pneumonia (determined by identification of the pathogen in lung using IHC or PCR, together with histological evidence of typical cuffing pneumonia). Overall, M. hyorhinis was much more prevalent than M. hyopneumoniae in the study group when considering detection only. While the presence of M. hyopneumoniae did appear to be over –represented in pleurisy affected versus unaffected pigs, this was not the case for M. hyorhinis and equal proportions of pleurisy affected and unaffected pigs yielded this organism. However, all (100%) cases of M. hyopneumoniae‐associated pneumonia, and 76% of M. hyorhinis‐associated pneumonia came from pigs with some degree of pleurisy. In summary, despite widespread vaccination against M. hyopneumoniae, we found evidence for a role in pleurisy. Table 6.2 indicates that of 7/12 necropsy groups in which M. hyopneumoniae‐associated pneumonia was found, 6 had a specific vaccination program, emphasizing that vaccination cannot completely eliminate disease. The role of M. hyorhinis is more complex but a preliminary analysis of infectious agents analysed by gross and histological signs of pneumonia (see Annex 3) indicated an important role for this organism in pneumonia.

Necropsy‐based investigation of pleurisy 59
Underlying viral disease was closely related to pleurisy in this study. PRRSV viraemia was detected in roughly 35% of all pleurisy affected pigs but only in 17% of pigs with no pleurisy. On the other hand, 83% of PRRSV isolates came from pleurisy affected pigs. A similar relationship was found for the PCV2‐associated diseases (PCVAD) that we studied. Both PCV2‐associated pneumonia and lymphoid PCVAD (as an indicator of post weaning multisystemic wasting syndrome) were almost exclusively found in pleurisy affected pigs (89% of PCV2‐associated pneumonias, 100% of lymphoid PCVADs). We hypothesised that PRRSV and PCV2 are 2 examples of immunomodulatory viruses that can either trigger or enhance underlying pneumonia which subsequently progresses to include pleurisy. We noted an apparent absence of any relationship between S. suis isolation and pleurisy. Only 8 isolates of S. suis were obtained and these were derived from 7 different units and represented serotypes 2, 3, 4, 7, 8, 15, 22, and non‐typeable). A preliminary analysis of gross and histological pneumonia indicated a strong association with acute pneumonia (see Annex 3) relative to chronic pneumonia. Our observation that pleurisy was typically associated with chronic, rather than acute, pneumonia might underlie this observed absence of association between S. suis and pleurisy. The observation must be treated with caution given the low number of isolates of S. suis (8). A surprisingly low number of isolates of H. parasuis were obtained in this study. Of the 3 isolates found, one was from a pig with no pleurisy, one from a pig with active, and one from a pig with resolved pleurisy. All 3 isolates came from pneumonia lesions (2 acute, 1 chronic). H. parasuis is recognised primarily as the causal agent of the polyserositis of Glaesser’s Disease (GD), although there are increasing reports of a role in bronchopneumonia. GD is an acute multisystemic disease of pigs between typically 1 and 4 months of age on high health multisite production systems with a history of mixed sources. However, it has traditionally (if empirically) been associated with pleurisy at slaughter. The data indicates that H. parasuis plays a less important role in pleurisy (in the absence of GD) than previously believed. The present study design might have selected against GD cases, since these would typically be acutely sick but recently thriving, pigs that might not have shown respiratory signs. In addition, there was no recent history of GD on any of the necropsy study supply units. Finally, H. parasuis isolates in the UK are broadly sensitive to antibiotics and it is possible that recent medication might have hampered isolation of this pathogen. Ante mortem signs were assessed as potential indicators of pleurisy but also as indicators of likely subsequent success in reaching a respiratory diagnosis. A preliminary analysis indicated that active and resolved pleurisy cases were equally likely to reach a respiratory diagnosis. However, there was a strong age effect for pleurisy and the success of respiratory diagnosis. Pleurisy was very infrequent in pigs aged <9 weeks but the proportion of affected pigs increased dramatically above this age. Male pigs were notably over‐represented in the active pleurisy group, but not the resolved pleurisy group. Furthermore, male pigs appeared more likely to result in respiratory diagnosis than female pigs. Further analysis of data might address whether this finding is a true reflection of male predisposition to disease or to an increased tendency of male pigs to be selected based on more overt ante mortem findings. Selection of pigs for necropsy investigation based on ante mortem clinical signs such as coughing sneezing, dyspnoea, lethargy, conjunctivitis, did help to identify pleurisy affected pigs but, as expected, these signs were not specific for pleurisy Finally, the study found little impact of recent medication history on the likelihood of reaching a respiratory diagnosis. This observation should be interpreted with caution since medication history may not have been reliable and, in addition, it should be noted that only a proportion of diagnoses have a bacterial causal agent. Viral infections are unlikely to be affected by recent medication.

Necropsy‐based investigation of pleurisy 60
In conclusion, this study focused on units with a prolonged and high prevalence of pleurisy in slaughter pigs. The study identified the need to study necropsy pigs as a batch of not less than 6 pigs in order to optimize chances of identifying pleurisy and isolating infectious agents. It identified a very close relationship between pleurisy and the presence of gross or microscopic chronic pneumonia. Typical, often secondary, bacterial agents were isolated from pleurisy cases but there was striking evidence of an underlying role for mycoplasmal and viral infections such as PCV2 and PRRSV.

Knowledge transfer 61
7. Knowledge transfer: practical guidance on pleurisy for BPEX Knowledge emerging from Part 1: Retrospective case‐control study (see
section 4). Management factors were found to have a key role in differentiating units that had a consistent pleurisy problem from those that consistently did not.
• The following management practices (some of which are likely linked) were found to be risk factors for consistently high pleurisy prevalence:
o The use of farrow‐to‐finish (FF) production systems compared to off‐site rearing. For these off site rearing systems, grow‐to‐finish (GF) production systems were worse than wean‐to‐finish (WF) systems. The overall order of risk fell from FF to GF to WF.
o Failure or inability to implement strict all in all out (AIAO) management at unit or building level. Operating AIAO by room or by pen was equivalent to continuous flow. In addition, permitting pigs that differ in age by more than 1 month to share the same air space.
o Repeated mixing of pigs after weaning on FF units or population on GF and WF units. o Repeated moving of pigs (even without mixing).
• The following practices were found to be protective (associated with consistently low pleurisy
prevalence: o Cleaning finisher accommodation between batches o Disinfecting finisher accommodation between batches o Permitting downtime for grower and finisher accommodation between batches.
Other significant differences were found between these 2 groups of units:
• Pleurisy affected units experienced a greater (by 3.3%) average post‐weaning mortality than control units. Industry guidelines indicate that each 1% increase in post‐weaning mortality reduces the value of slaughtered pigs by £0.50.
• Pleurisy affected units were more likely to have observed respiratory signs such as coughing and dyspnoea in older (>30kg) and younger (30Kg and under) pigs.
• Pleurisy affected units were more likely to have experiences APP associated disease. • Pleurisy affected units were marginally more likely to have experienced wasting in older and
younger pigs during 2007. This part of the project was unable to ascertain the cause of this wasting but the absence of any link with wasting in 2008 and the implementation of mass PCV2 vaccination around that time suggests a possible role for PCV2.

Knowledge transfer 62
Knowledge emerging from Part 2: Prospective study (see Section 5) The prospective study of pleurisy generated knowledge in 2 main areas, impacts on production performance and pleurisy‐associated health, welfare and environmental risk factors.
• The use of MHS CCIR trimming data provides a valuable tool to understand the prevalence and reasons for trimming at batch level, especially where BPHS data is unavailable.
• Estimates of the impact of pleurisy on production performance: o Mortality: Herds with pleurisy prevalence running at >10% at slaughter experienced
post‐weaning mortality rates around 3.3% higher than unaffected units, equating to an additional cost of £1.32/per pig ultimately marketed
o Average daily lifetime weight gain: This parameter assessed the average daily growth of pigs at batch level, using the final average deadweight after trimming and the average age at slaughter for each of the 80 batches under study. The model indicated a reduction of between 1.55 – 2.5 g/day for each 1% increase in pleurisy prevalence. Taking an example prevalence of 10% and recent BPEX estimates on cost of production (increasing ADG by 50g/day saves 50p/pig), this equates to a cost of between 15.5 ‐ 25p/pig.
o Alternatively, the economic impact can be estimated by considering the impact of pleurisy on slaughter age and slaughter weight:
Each 1% increase in pleurisy prevalence at batch level resulted in a 0.07kg average fall in deadweight per pig. For batch with 10% prevalence and taking a recent DAPP pig meat price of 138p/kg this equates to 96p/pig.
Each 1% increase in pleurisy prevalence at batch level resulted in a 0.26 day increase in average slaughter age. One way of translating this to a cost is on the basis of additional food consumption for the extra days – assuming a finisher pigs consumes 2.5kg feed/day then this equates to an additional feed requirement of 0.65kg/pig/ 1% pleurisy. IN the case of a batch of pigs with 10% prevalence of pleurisy (2.6 day extension to finishing) consuming feed purchased at £200/tonne, this equates to a cost of 130p/pig.
Total economic impact from pleurisy associated disease, assuming a prevalence of 10%, could reach 226p/pig according to these figures (not including veterinary costs).
• Estimates of the impact of pleurisy on processing costs: A substantial economic impact of pleurisy was also found at the processing stage which was largely driven by the necessary reduction in line speed, and associated staff costs, to permit adequate inspection and trimming. Costs of disposal of trimmed material formed a smaller cost contribution. A representative batch with 10% pleurisy prevalence was estimated to result in additional processing costs of 29p/pig based on an 8.5% reduction in line‐speed.
• Health, welfare and environmental factors related to pleurisy in integrated production systems: o Relationships to health: Strong correlations were found between pleurisy prevalence
and exposure to the following infectious agents (measured by serological testing): A. pleuropneumoniae, PRRSV, M. hyopneumoniae, and swine influenza. No correlation was found for M. hyorhinis.
o Sourcing and mixing pigs from multiple breeding herds was found to be a significant risk factor for pleurisy however, this finding should be interpreted with caution due to concerns over the high level of variability of the raw data.

Knowledge transfer 63
Knowledge emerging from Part 3: Necropsy study (see section 6)
Advice arising from the necropsy part of the project falls into 3 main areas: • New information on how to plan an investigation into raised pleurisy scores in slaughter pigs:
o Pleurisy occurs in close association with pneumonia and a wide range of pathogens can underlie, or contribute to, disease.
o Post mortem investigations offer a powerful tool for investigation of the pleurisy – around 68% of post‐mortems resulted in diagnosis of the underlying causes.
o The chances of successful investigations increase when more animals are submitted for necropsy. For units with around 10% prevalence of pleurisy, a minimum of 6 pigs were needed to be certain of finding pleurisy and to optimize chances of identifying more fastidious organisms such as APP.
o When selecting pigs for necropsy investigation of pleurisy: Avoid pigs less than 9 weeks old even if they show respiratory signs; Pigs of between 9 and 16 weeks gave the best chances for a diagnosis in our
study. Male pigs appear to be slightly more likely to result in a successful diagnosis.
Select pigs based on clinical signs such as coughing, sneezing, dyspnoea, lethargy, or conjunctivitis.
Avoid wasted pigs – the likelihood of reaching a diagnosis is lower and the pleurisy or respiratory disease may be less recent. Any pathogens isolated may not be the primary cause but just represent secondary infection.
Try to avoid selecting hospital pigs or other pigs that have received recent or more historic medication as this will likely reduce the chances of identifying important secondary bacterial infections.
• Information that assists in managing an outbreak of pleurisy: o Gastric ulceration is more likely to occur in pigs with pleurisy (and pneumonia). This
can result in reduced feed intake so, where batch‐level medication is under way, consider avoiding in‐feed treatments in favour of in‐water or injectable treatments.
• Background farm information that will be useful in a pleurisy investigation and in development of a control plan:
o Consider the PRRS status of the growing pigs, whether this has changed recently, and how well it is controlled. PRRS appears to predispose pigs to pleurisy.
o Consider how well PCV2 is controlled on the unit. PCV2 associated pneumonia and PMWS both appear to be factors in pleurisy.
o Review M. hyopneumoniae vaccination control and consider investigations to identify M. hyorhinis associated pneumonia on the unit. Both these factors contributed to pleurisy.

References 64
8. References Algers, B (2004) Injury and Disease. In Global Conference on Animal Welfare: an OIE Initiative. Feb
2004, Paris, France Amory, J.R. & Pearce, G.P. (1998) Effect of environmental conditions and husbandry system on signs of
injury and disease in grower‐finisher pigs. Proc 15th Int Pig Vet Soc Congr 2;103. Amory, J. R., Mackenezie, A. M., Eckersall, P.D., Stear, M.J., Pearce, G.P. (2007) Influence of rearing
conditions and respiratory disease on haptoglobin levels in the pig at slaughter. Research in Veterinary Science doi:10.1016/j.rvsc.2007.01.012
Broom, D. M. 1988: Relationship between welfare and disease susceptibility in farm animals. In: Animal Disease ‐a Welfare Problem, ed. T. E. Gibson, BVA Animal Welfare Foundation. London: 22‐29.
Caruso JP, EL Jeska (1990). Phagocytic functions of pulmonary alveolar macrophages in genetically selected lean and obese swine and effects of exogenous linolenic acid upon cell function. Vet Immunol Immunopathol. 24: 27‐36.
Christensen G (1986). Referenced in Christensen G, V Sorensen, J Mousing: Diseases of the respiratory system. In: Diseases of Swine. Eds. Straw B, S D’allaire, W Mengeling, D Taylor. 8th edition. 1999. Blackwell Science. Oxford.
Christensen G, V Sorensen, J Mousing: Diseases of the respiratory system. In: Diseases of Swine. Eds. Straw B, S D’allaire, W Mengeling, D Taylor. 8th edition. 1999. Blackwell Science. Oxford.
Cleveland‐Nielsen, A., Nielsen, E.O. and Ersboll, A.K., 2002. Chronic pleuritis in Danish slaughter pig herds. Prev Vet Med 55, 121‐35.
Cogan, T.A., Thomas, A.O., Rees, L.E., Taylor, A.H., Jepson, M.A., Williams, P.H., Ketley, J. and Humphrey, T.J., 2007. Norepinephrine increases the pathogenic potential of Campylobacter jejuni. Gut 56, 1060‐5.
Donham, K.J., 1991. Association of environmental air contaminants with disease and productivity in swine. Am J Vet Res 52, 1723‐30.
Enoe, C., Mousing, J., Schirmer, A.L. and Willeberg, P., 2002. Infectious and rearing‐system related risk factors for chronic pleuritis in slaughter pigs. Prev Vet Med 54, 337‐49.
Falk, K. and Lium, B.M., 1991. An abattoir survey of pneumonia and pleuritis in slaughter weight swine from 9 selected herds. III. Serological findings and their relationship to pathomorphological and microbiological findings. Acta Vet Scand 32, 79‐88.
Goodall, E.A., Menzies, F.D., McLoughlin, E.M. and McIlroy, S.G., 1993. Prevalence of pleurisy and pneumonia in pigs in Northern Ireland (1969‐1989). Vet Rec 132, 11‐4.
Hartley, P.E., Done, S.H., Wilesmith, J.W. and Bradley, R., 1988a. A study to investigate lairage time and acute pleurisy in pigs. Vet Rec 122, 564.
Hartley, P.E., Wilesmith, J.W. and Bradley, R., 1988b. The influence of pleural lesions in the pig at slaughter on the duration of the fattening period: an on‐farm study. Vet Rec 123, 208.
Hartley, P.E., Wilesmith, J.W. and Bradley, R., 1988c. Prevalence of pleurisy in pigs at slaughter. Vet Rec 123, 173‐5.
Hurd, H.S., Brudvig, J., Dickson, J., Mirceta, J., Polovinski, M., Matthews, N. and Griffith, R., 2008. Swine health impact on carcass contamination and human foodborne risk. Public Health Rep 123, 343‐51.
Kritas, S.K. and Morrison, R.B., 2007. Relationships between tail biting in pigs and disease lesions and condemnations at slaughter. Vet Rec 160, 149‐52.

References 65
Maes, D.G., Deluyker, H., Verdonck, M., Castryck, F., Miry, C., Vrijens, B., Ducatelle, R. and De Kruif, A., 2001. Non‐infectious factors associated with macroscopic and microscopic lung lesions in slaughter pigs from farrow‐to‐finish herds. Vet Rec 148, 41‐6.
Marois, P., Difranco, E., Boulay, G. and Assaf, R., 1989. Enzootic pneumonia in feeder pigs: Association with transmissible gastroenteritis virus infection. Can Vet J 30, 328‐330.
Paisley, L.G., Vraa‐Andersen, L., Dybkjaer, L., Moller, K., Christensen, G., Mousing, J. and Agger, J.F., 1993. An epidemiologic and economic study of respiratory diseases in two conventional Danish swine herds. I: Prevalence of respiratory lesions at slaughter and their effects on growth. Acta Vet Scand 34, 319‐29.
Stark, K.D., 2000. Epidemiological investigation of the influence of environmental risk factors on respiratory diseases in swine‐‐a literature review. Vet J 159, 37‐56.
Svensmark, B., Nielsen, K., Willeberg, P. and Jorsal, S.E., 1989. Epidemiological studies of piglet diarrhoea in intensively managed Danish sow herds. II. Post‐weaning diarrhoea. Acta Vet Scand 30, 55‐62.

Annexes 66
9. Annexes Annex 1: Retrospective case‐control study of risk factors for pleurisy Table 9.1.1. Outline of variables included in retrospective case‐control study: Production unit type, key indicators of general management, and health observations.
Table 9.1.2. Outline of variables included in retrospective case‐control study: Accommodation and feeding systems.
Variable factor
Variable sub‐factor Type of variable
Production unit type (and number of sources where applicable)
Farrow‐finish / wean‐finsh / grow‐finish
Predictor
Number of finisher places Predictor Distance to next pig unit Predictor Years’ experience of senior stockman Predictor CPD of stockmen Predictor Depop.‐repopulation of farrow‐finisher Predictor Post‐weaning mortality 2008, 2007, 2006 Association Mortality recording system type Computer / other Association Vet health plan in place on unit Association Farmer observations on disease (main effect: none, few, many; where an age effect requested this is 7‐30Kg and >30kg; data requested for 2008 +2007)
Scours (by age) Predictor
Sneezing (by age) Predictor Coughing (by age) Predictor Dyspnoea (by age) Predictor Meningitis Predictor Wasting (by age) Predictor Sudden deaths (by age) Predictor PDNS Predictor Other Farmer knowledge of specific disease status (believed present, confirmed by vet, believed absent, not known)
PRRS (porcine reproductive and respiratory syndrome)
Predictor
APP (A. pleuropneumoniae) Predictor HPS (H. parasuis) Predictor EP (enzootic pneumonia) Predictor PMWS (post‐weaning multisystemic
wasting syndrome). Predictor
Vaccination of finisher pigs Absence of any vaccination Association EP (one or 2 shot regime) Association PCV2 Association PRRS Association HPS Association Ileitis Association Other Association Medication: routine at group level Product Predictor Duration Predictor In feed or water Predictor Reason Predictor Medication: individual treatments: Number in past week Predictor Reason Predictor

Annexes 67
Variable factor Variable sub‐factor Type of variable Accommodation (for pigs <30kg and 30kg‐slaughter) Mixed or single type Predictor Fully slatted Predictor Part slatted Predictor Yards Predictor Bedding Predictor Pen with in/outdoor run Predictor Pen with kennel and in/outdoor run Predictor Outdoor +/‐ paddock Predictor Other Predictor Assisted ventilation Predictor Number of moves in housing after arrival/weaning 0 upwards Predictor Number of mixes after arrival/weaning 0 upwards Predictor Segregation of gilts and boars during finishing Yes / no Predictor Operation of an all‐in all‐out systems (for <30kg, 30‐50kg, >50kg; where done then specify down‐time and whether cleaned and disinfected)
By pen / by room / by building / by unit / by paddock
Predictor
Presence of pigs of >1 month age difference in same airspace.
Yes / no Predictor
Maximum number of pigs in same airspace number Predictor Feed origin Purchased / home mixed Predictor Feed type Pellet / wet / meal Predictor Feed access Ad lib. / rtestricted Predictor

Annexes 68
Annex 2: Prospective on‐farm and in‐abattoir study of health, welfare and economic impacts of pleurisy
Table 9.2.1. Predictor variables measured during rearing phase (12‐22 weeks of age) by herdsmen (on‐farm diary) for each batch
Variable factor Clinical signs (age at onset and duration) 1 Coughing: age when ‘any’ 1st reported 2 Coughing: no. weeks that ‘any’ reported 3 Sneezing: age when ‘any’ 1st reported 4 Sneezing: no. weeks that ‘any’ reported 5 Dyspnoea: age when ‘any’ 1st reported 6 Dyspnoea: no. weeks that ‘any’ reported 7 Scouring: age when ‘any’ 1st reported 8 Scouring: no. weeks that ‘any’ reported 9 Lameness: age when ‘any’ 1st reported 10 Lameness: no. weeks that ‘any’ reported 11 Wasting: age when ‘any’ 1st reported 12 Wasting: no.weeks that ‘any’ reported 13 Meningitis: age when ‘any’ 1st reported 14 Meningitis: no.weeks that ‘any’ reported 15 Tailbiting: age when ‘any’ 1st reported 16 Tailbiting: no.weeks that ‘any’ reported 17 PDNS: age when ‘any’ 1st reported 18 PDNS: no.weeks that ‘any’ reported Temperature stress 19 Temp. <0/>30C: Age when 1st reported 20 Temp. <0/>30C: no.weeks that event reported

Annexes 69
Table 9.2.2. Predictor variables measured during veterinary visit at 14‐18 wks age
Variable factor 1 Number of pigs in batch 2 Age at date of inspection Sources 3 Number of sources supplying pigs to unit 4 Are there mixed sources in same building? 5 Was population of unit completed in <7 days? Buildings and environment 6 Number of buildings on unit 7 Are all buildings same type or mixed? 8 Where buildings all same type: what type (1‐5)1 9 Where buildings all same type: airspace /pig (m3/pig)2 10 Where buildings all same type: stocking density (pigs/m2) 11 Where buildings all same type: max. no. pigs/pen 12 What is the maximum stocking density on the unit (pig/m2) 13 Do pigs have access to a kennel (all/some/none) 14 Flooring type (straw / slatted / outdoor / mixed) 15 Ventilation (assisted / natural / mixed) 16 Is AIAO operated (defined as by building or unit) 17 Drinker type (bowl / nipple / mixed) 18 Minimum flow rate recorded on unit (l/min) 19 Number of pigs per drinker 20 Qualitative air quality (humidity/NH3) score across unit (0, 1, 2)3 21 Qualitative dust assessment score across unit across unit (0, 1, 2)4 22 Quantitative dust collection (g/7d in petri dish) 23 Feed type (pellet / wet / meal / mixed) 24 Is a hospital pen present Clinical assessment (prevalence per pig based on 100 pigs) 25 Coughing (number heard during 5 minute period) 26 Sneezing (number heard during 5 minute period) 27 Dyspnoea 28 Wasting 29 Lameness 30 Scouring 31 Dull / lethargic Welfare assessment (prevalence per 100 pigs) 32 Bursitis 33 Fighting marks 34 Tail biting and other vices Vaccines administered to finisher pigs 35 Any vaccines (vaccination status negative if no vaccines given) 36 EP 1‐shot 37 EP 2‐shot 38 PCV2 39 PRRSV 40 Glasser’s Disease Serological testing (no. positive /10 blood samples collected) 41 Actinobacillus pleuropnuemoniae (APXIV ELISA) 42 PRRSV (IDEXX ELISA)

Annexes 70
Variable factor 42 Mycoplasma hyopneumoniae (IDEXX ELISA) 43 Mycoplasma hyorhinis (VLA ELISA) 44 Swine influenza (CIV test ELISA)
Notes:
1. Building types listed as 1, 2a, 2b, 3, 4a, 4b, 5: Type: 1=Straw yards, 2a= Traditional pens without low cover, 2b=Traditional with low cover / ceiling, 3=Flat decks, 4a=Other adapted building good ventilation, 4b=Other adapted building poor ventilation.
2. Airspace per pig: where pens or associated runs open to outdoors then airspace is recorded at 10m3/pig.
3. Qualitative air assessment: 0=fresh air, 1=noticeable gases, 2=uncomfortable level of gases in air
4. Qualitative dust assessment: 0=no or minimal dust on surfaces, 1=obvious dust on surfaces and in air, 2= Thick layer of dust on surfaces, air visibility reduced
Table 9.2.3. Predictor and dependent variables measured during abattoir pathology assessment of 50 pigs per batch.
Notes:
1. EP score per pig was derived using the standard 55 point system: The disease causes a typical purple consolidation of specific, dependent, parts of the lung. Lung scores can range from 0 to 55 with each score rounded up to the nearest 5.
2. Pleuropneumonia is recorded in the spreadsheet as acute (PPA) or chronic (PPC): It is proposed that a total combined prevalence is calculated for PPA+PPC. Note that pleuropneumonia, when present, must by definition include pleurisy; but not all pleurisy will
Variable factor Type of variable Gross pathological findings 1 Pleurisy type (1 or 2) Dependent 2 Pleurisy extent (100,50, 25, 12.5%) Dependent 3 Pleurisy tissue remaining in carcase Dependent 4 Enzootic pneumonia (EP) (mean score for consignment)1 Association 5 Pericarditis (PC) (prevalence for consignment) Association 6 Peritonitis (PT) (prevalence for consignment) Association 7 Milk spot (MS) liver (prevalence for consignment) Association 8 Papular dermatitis (PD) (prevalence for consignment) Association 9 Tail bite (prevalence for consignment) Association 10 Pleuropneumonia (prevalence acute+chronic combined)2 Association 11 Viral type pneumonia (prevalence for consignment) Association 12 Lung abscess (prevalence for consignment) Association 13 Pyaemia (prevalence for consignment) Association 14 Bursitis (prevalence for consignment) Association

Annexes 71
be associated with pleuropneumonia (in which both the pleura and underlying lung are diseased).
Table 9.2.4. Performance parameters and retrospective health data recorded at end of batch
1. Interval between first and final slaughter consignment: An extended period of slaughter might
indicate a tendency for variable growth rates. However, it will also be influenced by batch size.
Variable factor Type of variable Performance factors Month of end of batch (last pigs slaughtered) Predictor Interval between 1st and final slaughter consignment (days)1 Dependent Mortality % (grow‐finish: Bowes)2 Dependent Mortality % (wean‐finish: BQP) Dependent Mortality % (mixed: Yorkwold) Dependent Age at entry to finishing system (weeks)3 Predictor Average age at slaughter (days) Dependent Average slaughter weight (Kg) (after evisceration and trimming) Dependent Average lifetime daily weight gain (ALDWG)4 Dependent Average daily weight gain (11 weeks to slaughter: Bowes)5 Dependent Average daily weight gain (4 weeks to slaughter: BQP) Dependent Average daily weight gain (mixed age to slaughter: Yorkwold) Dependent Feed consumption per pig (11 weeks to slaughter: Bowes) (Kg/pig)6 Dependent Feed consumption per pig (4 weeks to slaughter: BQP) (Kg/pig) Dependent Feed consumption per pig (mixed age to slaughter: Yorkwold) Dependent Number of group medications administered Dependent Reason for group medication (combi+resp, combi‐resp) Dependent Individual medications recorded for batch (yes/no) Dependent Number of individual treatments per batch Dependent Reason for individual treatment (combi+resp, combi‐resp) Dependent Retrospective health / disease data (recorded in vet’s notes ) Post‐weaning multisystemic wasting syndrome (PMWS) Predictor Porcine‐dermatitis nephropathy syndrome (PDNS) Predictor Pneumonia Predictor Glaesser’s Disease (Haemophilus parasuis (HPS)) Predictor Actinobacillus pleuropneumoniae (APP) Predictor Porcine reproductive and respiratory syndrome (PRRS) Predictor Swine influenza SI) Predictor Atrophic rhinitis (SR) Predictor Meningitis Predictor Scours Predictor Salmonellosis Predictor Proliferative ileitis (PI) Predictor Swine dysentery (SD) Predictor

Annexes 72
2. Mortality %: These were investigated for each integrator WF (BQP), GF (Bowes), mixed (Yorkwold) because each integrator recordined mortality over a different period. For Bowes and BQP this is quite standard (and integrator specific correlations should be detectable) but was highly variable for Yorkwold.
3. Date of entry to finishing: A strong integrator effect here since each operated a different system.
4. Average lifetime daily weight gain: calculated by estimating liveweight at slaughter (carcase weight divided by 0.74 to allow for guts etc), minus 1.1Kg (typical weight of newborn piglet), divided by average age at slaughter. This provides a very approximate level comparison across the integrators, but is based ultimately on deadweight after trimming of carcase.
5. Daily weight gain (DWG): calculated by integrator because each is recording a different period of the pigs’ life and growth is not linear with age.
6. Feed consumption per pig: Calculated by integrator (see point 2 and 5 above).
Table 9.2.5. Variable parameters pertaining to slaughter and processing.
1. Distance travelled to abattoir: Bowes and BQP used one abattoir each, but Yorkwold typically
slaughtered consignments from each batch at 2‐3 different abattoirs. 2. Time spent in lairage: This value relates only to the consignment of pigs that underwent
pathology assessment (Table 9.2.3).
Variable Type of variable Environmental data Distance travelled to abattoir1 Predictor Time spent waiting in lairage prior to slaughter2 Predictor Carcase and offal traits Distribution of individual carcase weights Dependent Distribution of individual P2 values Dependent Prevalence of pleurisy associated offal seizure (plucks only) Dependent Prevalence of pleurisy associated offal seizure (plucks and lungs) Dependent Prevalence of pleurisy associated carcase trimming and seizure Dependent

Annexes 73
Annex 3. Necropsy study

Annexes 74
Annex 3.1 On farm selection of pigs for post-mortem examination for Cambridge BPEX Pleurisy Study Vet inspecting pigs …………………………………… Pig unit …………………………………………… Date …………………………….. Cambridge Pleurisy Project Questionnaire completed yet?......... Summary of current health observations on unit (if a batch AIAO system then only complete relevant stage): Pre-wean Wean (7- 30kg) Grower (30-50kg) Finisher (50kg+)
Pig id (pls mark
pig)
Age (weeks)
Body condition
(G,M,P,VP)
Lethargy Sneeze Cough Dyspnoea Conjunctivitis Rectal temp.
Other (describe)
1
2
3
4
5
6
7
8
9

Annexes 75
2.2. Recording of gross lung lesions at necropsy
Lung Lesion Recording VLA Submission no. Pig …… EP score …… Pig …… EP score ……

Annexes 76
3.3 Gross necropsy recording forms
BPEX Pleurisy Study: Necropsy Findings
(Adapted from PLOM study, Investigation of High Mortality in Finishing Pigs) Please fill in the following information and complete all relevant questions. The VLA Ref No. should be recorded in the box provided at the bottom of each sheet and in the top right hand corner of each sheet the submission and
VLA references should be stamped.
VLA Ref No:_______________________________________________________
Pleurisy study Reference: _____________________________________________
Date: _____________________________________________________________
VIO: _____________________________________________________________
PIG ID Age (weeks) Sex Weight (kg) Condition* Preservation**
1 good moderate poor very poor
live freshly dead Autolysis: mild moderate severe
2 good moderate poor very poor
live freshly dead Autolysis: mild moderate severe
3 good moderate poor very poor
live freshly dead Autolysis: mild moderate severe

Annexes 77
CONJUNCTIVA:
Please tick all that apply
Pig 1 Pig 2 Pig 3
Conjuntivitis Present Absent
Undetermined*
Present Absent
Undetermined*
Present Absent
Undetermined*
Tear staining Present Absent
Undetermined*
Present Absent
Undetermined*
Present Absent
Undetermined*
CONCLUSION / DIAGNOSIS
unremarkable
unremarkable
unremarkable
*due to post mortem change
SKIN: Pig 1 Pig 2 Pig 3
DESCRIPTION:
Please tick all that apply:
Appearance:
reddened pale
yellow hairy
purple/blue
reddened pale
yellow hairy
purple/blue
reddened pale yellow hairy purple/blue
Tail: docked bitten
necrosis
docked bitten
necrosis
docked bitten necrosis
Legs: abrasion bursitis
lower limb oedema
abrasion bursitis
lower limb oedema
abrasion bursitis lower limb oedema
Focal lesions: present absent
PDNS-like
present absent
PDNS-like
present absent PDNS-like
Other (please specify)
CONCLUSION / DIAGNOSIS
unremarkable unremarkable unremarkable

Annexes 78
RESPIRATORY SYSTEM:
Please give lesion type and distribution using the following codes:-
F = focal, M = multi focal, E = locally extensive, D = diffuse, U=unremarkable.
If lesions are present that are not described by these headings, please enter a quick description and relevant codes into the ‘Other’ box.
State lesion type:- C=Congestion, H=Haemorrhage, N=Necrosis, O=Oedema, A=Abscesation
Upper respiratory tract:
Type: Pig 1 Pig 2 Pig 3
pharynx / larynx C H N O A
Other (specify) ________
C H N O A
Other (specify) ________
C H N O A
Other (specify) ________
trachea / bronchi C H N
Other (specify) ________
C H N
Other (specify) ________
C H N
Other (specify) ________
Distribution: Pig 1 Pig 2 Pig 3
pharynx / larynx C H N O A
Other (specify) ________
C H N O A
Other (specify) ________
C H N O A
Other (specify) ________
trachea / bronchi C H N
Other (specify) ________
C H N
Other (specify) ________
C H N
Other (specify) ________
Tracheal/bronchial contents:
(please tick)
none froth
mucus blood
mucopurulent
none froth
mucus blood
mucopurulent
none froth
mucus blood
mucopurulent

Annexes 79
Lungs: Please fill in Lesion Table as before:- F = focal, M = multi focal, E = locally extensive, D = diffuse, U=unremarkable Cranial lung tissues = cranial, middle and intermediate lobes Caudal lung tissue = caudal lobes State lesion type:- C=Consolidation, H=Haemorrhage, N=Necrosis, A=Abscesation, O=Oedema, R=Congestion
Pig 1 Pig 2 Pig 3
Cranial lung tissues C H N A
O R
C H N A
O R
C H N A
O R
If consolidation present, please tick proportion of caudal lung tissue affected:
0% <26% 26%-50% >50%
firm interlobular oedema (mild)
(marked) red/purple grey/pink
0% <26% 26%-50% >50%
firm interlobular oedema (mild)
(marked) red/purple grey/pink
0% <26% 26%-50% >50%
firm interlobular oedema (mild)
(marked) red/purple grey/pink
Caudal lung tissues C H N A
O R
C H N A
O R
C H N A
O R
If consolidated please tick caudal proportion of lung tissue affected:
0% <26% 26%-50% >50%
firm interlobular oedema (mild)
(marked) red/purple grey/pink
0% <26% 26%-50% >50%
firm interlobular oedema (mild)
(marked) red/purple grey/pink
0% <26% 26%-50% >50%
firm interlobular oedema (mild)
(marked) red/purple grey/pink
Pleural cavity Pig 1 Pig 2 Pig 3
Pleural lesions:
if pleural lesions present then please tick all that apply:
Present Absent/Unremarkable
fibrinous localised unilateral
fibrous generalised bilateral
Other (specify) _______
Present Absent/Unremarkable
fibrinous localised unilateral fibrous generalised bilateral
Other (specify) _______
Present Absent/Unremarkable
fibrinous localised unilateral fibrous generalised bilateral
Other (specify) _______

Annexes 80
Pleural fluid: Pig 1 Pig 2 Pig 3
Please tick all that apply absent present clear turbid fibrin clots
absent present clear turbid fibrin clots
absent present clear turbid fibrin clots
Volume:
Please tick a box that best describes conditions*
slight moderate copious
slight moderate copious
slight moderate copious
CONCLUSION / DIAGNOSIS
unremarkable unremarkable unremarkable
*slight ie: not immediately obvious on opening pleural cavity - moderate ie: pleural cavity half full - copious ie: pleural cavity full. CARDIOVASCULAR:
DESCRIPTION: Pig 1 Pig 2 Pig 3
Pericardium
Please tick all that apply:
Pericarditis:
If present:
Present Absent/Unremarkable
fibrinous fibrous
Present Absent/Unremarkable
fibrinous fibrous
Present Absent/Unremarkable
fibrinous fibrous
Pericardial fluid:
Please tick all that apply.
excess clear turbid fibrin clots
excess clear turbid fibrin clots
excess clear turbid fibrin clots
Myocardium:
Please tick all that apply. enlarged hypertrophic enlarged flaccid pale stripey haemorrhagic unremarkable
enlarged hypertrophic enlarged flaccid pale stripey haemorrhagic unremarkable
enlarged hypertrophic enlarged flaccid pale stripey haemorrhagic unremarkable
Endocardium & Valves endocarditis haemorrhages unremarkable
endocarditis haemorrhages unremarkable
endocarditis haemorrhages unremarkable
CONCLUSION / DIAGNOSIS
unremarkable
unremarkable
unremarkable

Annexes 81
ALIMENTARY: Indicate lesion type:- C=Congestion, H=Haemorrhage, N=Necrosis, O=Oedema, A=Abscessation (please tick)
DESCRIPTION: Pig 1 Pig 2 Pig 3
Are teeth clipped? Yes No Yes No Yes No
Oral Cavity C H N O A
Other (specify) ________
C H N O A
Other (specify) ________
C H N O A
Other (specify) ________
Tonsils C H N O A
Other (specify) ________
C H N O A
Other (specify) ________
C H N O A
Other (specify) ________
Oesophagus C H N O A
Other (specify) ________
C H N O A
Other (specify) ________
C H N O A
Other (specify) ________
Stomach C H N O A
Other (specify) ________
C H N O A
Other (specify) ________
C H N O A
Other (specify) ________
Distal ileum C H N O A
Thickened wall
C H N O A
Thickened wall
C H N O A
Thickened wall
Ileocaecal colic junction C H N O A
Other (specify) ________
C H N O A
Other (specify) ________
C H N O A
Other (specify) ________
Caecum C H N O A
Other (specify) ________
C H N O A
Other (specify) ________
C H N O A
Other (specify) ________
Colon C H N O A
Other (specify) ________
C H N O A
Other (specify) ________
C H N O A
Other (specify) ________
Were Trichuris worms seen? Yes No Yes No Yes No

Annexes 82
Stomach:
Please tick all that apply
Pig 1 Pig 2 Pig 3
empty part filled full concentrate ration fibrous contents mixed contents
hyperkeratosis of pars oesophagea ulceration of pars oesophagea
empty part filled full concentrate ration fibrous contents mixed contents
hyperkeratosis of pars oesophagea ulceration of pars oesophagea
empty part filled full concentrate ration fibrous contents mixed contents
hyperkeratosis of pars oesophagea ulceration of pars oesophagea
Pig 1 Pig 2 Pig 3
Faecal consistency:
(please tick)
Unremarkable Fluid
Unremarkable Fluid
Unremarkable Fluid
PERITONEUM:
(Please tick)
Pig 1 Pig 2 Pig 3
Mesentery unremarkable oedema – mild oedema – marked
unremarkable oedema – mild oedema – marked
unremarkable oedema – mild oedema – marked
Peritonitis
If present please complete boxes below:
Present Absent/Unremarkable
Present Absent/Unremarkable
Present Absent/Unremarkable
Type fibrinous fibrous localised absent generalised
fibrinous fibrous localised absent generalised
fibrinous fibrous localised absent generalised
Peritoneal Fluid present absent clear turbid
present absent clear turbid
present absent clear turbid
Volume* slight moderate copious
slight moderate copious
slight moderate copious
Other findings:
CONCLUSION / DIAGNOSIS
unremarkable unremarkable unremarkable
*slight i.e.not immediately obvious - moderate i.e. peritoneal cavity half full - copious i.e. peritoneal cavity full

Annexes 83
LYMPHORETICULAR:
Tick lesion type:- E=Enlarged, H=Haemorrhage, P=Pale, O=Oedema, N=Necrosis
DESCRIPTION: Pig 1 Pig 2 Pig 3
Please tick all that apply.
Tracheo-bronchial
E H P O N
E H P O N
E H P O N
Mesenteric E H P O N
E H P O N
E H P O N
Superficial inguinal E H P O N
E H P O N
E H P O N
Other lymph node enlargement?
Yes No/Unremarkable
specify _____________
Yes No/Unremarkable
specify _____________
Yes No/Unremarkable
specify _____________
CONCLUSION / DIAGNOSIS
unremarkable
unremarkable
unremarkable SPLEEN: DESCRIPTION: Pig 1 Pig 2 Pig 3
Spleen enlarged? Yes No/Unremarkable
Yes No/Unremarkable
Yes No/Unremarkable
Lesions present? Yes No/Unremarkable
Yes No/Unremarkable
Yes No/Unremarkable
State lesion type:- H=Haemorrhage, I=Infarction, A=Abscesation, O=Other
Spleen
F = focal, M = multi focal, E = locally extensive, D = diffuse
H I E
Other (specify) ________
H I E
Other (specify) ________
H I E
Other (specify) ________
CONCLUSION / DIAGNOSIS
unremarkable
unremarkable
unremarkable

Annexes 84
LIVER:
DESCRIPTION: Pig 1 Pig 2 Pig 3
Milk spots: Present No/Unremarkable
Present No/Unremarkable
Present No/Unremarkable
Focal lesions: Present No/Unremarkable
Present No/Unremarkable
Present No/Unremarkable
If focal lesions present, please describe
Please tick all that apply.
Size:
enlarged shrunken
enlarged shrunken
enlarged shrunken
Colour: pale dark Zonal pattern orange
pale dark Zonal pattern orange
pale dark Zonal pattern orange
Texture: friable firm friable firm friable firm
CONCLUSION / DIAGNOSIS
unremarkable
unremarkable
unremarkable
URINARY SYSTEM:
DESCRIPTION: Pig 1 Pig 2 Pig 3
Kidneys:
Please tick any that apply
Colour:
tan pale mottled unremarkable
tan pale mottled unremarkable
tan pale mottled unremarkable
Consistency: friable fibrosed unremarkable
friable fibrosed unremarkable
friable fibrosed unremarkable
Size: swollen small unremarkable
swollen small unremarkable
swollen small unremarkable
Distribution of lesions: cortex medulla pelvis diffuse
cortex medulla pelvis diffuse
cortex medulla pelvis diffuse

Annexes 85
Lesion type: (If variable sized red spots or red spots larger than 1mm please record under haemorrhages)
Pig 1 Pig 2 Pig 3
pale spots/ streaks red spots (approx. 1mm) large cysts (> 2mm) small cysts (up to 2mm)
infarcts haemorrhage
No lesions present
Other (please specify)
pale spots/ streaks red spots (approx. 1mm) large cysts (> 2mm) small cysts (up to 2mm)
infarcts haemorrhage
No lesions present
Other (please specify)
pale spots/ streaks red spots (approx. 1mm) large cysts (> 2mm) small cysts (up to 2mm)
infarcts haemorrhage
No lesions present
Other (please specify)
DESCRIPTION: Pig 1 Pig 2 Pig 3 Bladder:
unremarkable mucosal haemorrhage lesions present*
unremarkable mucosal haemorrhage lesions present*
unremarkable mucosal haemorrhage lesions present*
CONCLUSION / DIAGNOSIS
unremarkable
unremarkable
unremarkable *If lesions are present please comment below in the text box at the end of the questionnaire MUSCULOSKELETAL SYSTEM: DESCRIPTION: Pig 1 Pig 2 Pig 3 Muscles
unremarkable pale
oedematous jaundice dark
unremarkable pale oedematous
jaundice dark
unremarkable pale oedematous
jaundice dark Joints:
Pig 1 Pig 2 Pig 3
unremarkable swollen single joint affected multiple joints affected synovial fluid – clear synovial fluid – turbid synovial membrane proliferation
unremarkable swollen single joint affected multiple joints affected synovial fluid – clear synovial fluid – turbid synovial membrane proliferation
unremarkable swollen single joint affected multiple joints affected synovial fluid – clear synovial fluid – turbid synovial membrane proliferation
Pig 1 Pig 2 Pig 3
CONCLUSION / DIAGNOSIS
unremarkable
unremarkable
unremarkable

Annexes 86
Summary of overall diagnosis (please also describe and comment on any other lesions not already covered)

Annexes 87
3.4 Histopathology recording forms a. Lymph node
FEATURE RESULT VLA Ref No. Date Examined Pig No. Autolysis Average size: Small (<75 sq mm), Medium (75 – 200 sq mm), Large (200 sq mm +)
Capsule Protein
RBCs
Clear space (oedema) Infiltrates Macrophag.
MNGCs
Eosinophils
Lymphocyte
Plasma cells
Neutrophils
Degenerate leucocytes
Cortex - follicles Size
Primary=1 or secondary=2
Necrosis, enter 1=present or 0=absent
Fibrin, enter 1 or 0
Macrophages
PCV 2 Ibs
MNGCs
Neutrophils
Eosinophils
Lymphocyte
Degenerate leucocytes
Depletion Paracortex Hyperplasia
Necrosis Paracortex-Infiltrates Macrophag.
Neutrophils
Eosinophils
MNGCs
Plasma cells
Depletion Medulla Fibrin exudation
Haemosid.
Clear space (oedema)
Protein
Red blood cells Medulla-Infiltrates Plasma cells
Macrophag.
Neutrophils
Eosinophils
MNGCs
Degenerate leucocytes
Lymphocyte Blood Vessels, enter 1 or 0 Thrombosed

Annexes 88
FEATURE RESULT Bacteria
Smooth muscle hyperplasia
Cuffed Neutrophils
Lymphocyte
Macrophag.
Eosinophils
Plasma cells Infiltration – mural (vasculitis) Neutrophils
Lymphocyte
Macrophag.
Eosinophils
Plasma cells
Fibrinoid change PCV2 IHC score 0=no specific labeling, 1=light/focal
labeling, 2=stronger more extensive labeling suggesting clinical significance
c) Lung
FEATURE RESULT VLA Ref No. Date Examined Pig No. Autolysis enter Alveoli-Walls Infiltration -Neutrophils Macrophag.
Lymphocyte
Eosinophils Fibrosis
Capillaries Dilation
Thrombosis
Pneumocyte Type 2 hyperplasia Necrosis Lumen Protein Fibrin Bacteria Red blood cells Necrotic cells Foreign material 0=absent, 1=present
Infiltration Neutrophils Macrophag. MNGCs Lymphocyte
Collapse Small Bronchioles-Mucosa Epithelial loss Necrosis Squamous metaplasia Epithelial hyperplasia Inclusions
Cuffing Neutrophils

Annexes 89
FEATURE RESULT Macrophag. Lymphocyte Plasma cells Eosinophils
Giant cells
Submucosa Fibrosis Sm. Muscle hyperplasia
Lumen Infiltrate-Neutrophils Macrophag. Eosinophils Giant cells Protein Fibrin Bacteria Necrotic cells RBCs Collapse Foreign material Large Bronchioles-Mucosa Epithelial loss Necrosis
Squamous metaplasia
Epithelial hyperplasia
subepithelial clear space
Inclusions
Mucosal infiltration-Neutrophiles
Eosinophils
Macrophag.
Lymphocyte
Submucosa Fibrosis
Smooth muscle hyperplasia
Cuffing Neutrophils Macrophag. Lymphocyte Plasma cells Eosinophils MNGCs
Lumen Infiltrates-Neutrophils
Macrophag.
Necrotic cells
Protein
Fibrin
Bacteria
MNGCs
RBCs
Eosinophils
Collapse
Foreign material Pleura-Surface Fibrin
Bacteria

Annexes 90
FEATURE RESULT Neutrophils
Necrosis
mesothel. Hyperplasia
Subpleural CT Clear space Fibrin Fibrosis RBCs Protein
Infiltrates- Neutrophils
Lymphocyte
Plasma cells
Macrophag.
Eosinophils
Neutrophils
MNGCs Interlobular septae Expansion
Clear space
Protein
Fibrin
Red blood cells
Bacteria
Infiltration-Neutrophils
Macrophages
Lymphocytes
Plasma cells
Eosinophils
Giant cells
Fibrosis
Degenerate leucocytes Blood vessels Thrombosed
Bacteria
Smooth muscle hyperplasia Cuffed Neutrophils Lymphocyte Macrophag. Eosinophils Plasma cells Infiltration – mural Neutrophils (vasculitis) Lymphocyte Macrophag Eosinophils Plasma cells
Fibrinoid Change
Pleurisy Morphological Diagnosis1
Duration
Distribution
Pneumonia Morphological Diagnosis2
Stage
Distribution

Annexes 91
FEATURE RESULT location
Score IHC-Lung 1 PRRS
(0,1,2) PCV2
M hyo

Annexes 92
3.5. Preliminary analysis of infectious agents and pneumonia. a) Relationship between infectious agents and gross signs of EP-lesions.

Annexes 93
b) Relationship between infectious agents and histological evidence of acute or chronic pneumonia.

Annexes 94
c) Relationship between infectious agents and histological evidence of broncho-, broncho-interstitial, or interstitial pneumonia.