please give us your feedback - samsung.com · aravindan gopalakrishnan, product manager, 3par...
TRANSCRIPT


Please give us your feedback
Use the mobile app to complete a session survey 1. Access “My schedule”
2. Click on this session
3. Go to “Rate & review”
– If the session is not on your schedule, just find it via the session scheduler, click on this session and then go to “Rate & review”.
– Thank you for providing your feedback, which helps us enhance content for future events.
Session ID: TB7428 Speakers: Anders Graham & Aravindan Gopalakrishnan
Anders Graham, Product Marketing Manager, Solid State Drives @ Samsung
Aravindan Gopalakrishnan, Product Manager, 3PAR Storage @ Hewlett Packard Enterprise
Three Reasons why Solid State Drives will take over Hard Drives in 2016

This presentation is intended to provide information concerning SSD and memory industry. We do our best to make sure that information presented is accurate and fully up-to-date. However, the presentation may be subject to technical inaccuracies, information that is not up-to-date or typographical errors. As a consequence, Samsung does not in any way guarantee the accuracy or completeness of information provided on this presentation.
The information in this presentation or accompanying oral statements may include forward-looking statements. These forward-looking statements include all matters that are not historical facts, statements regarding the Samsung Electronics' intentions, beliefs or current expectations concerning, among other things, market prospects, growth, strategies, and the industry in which Samsung operates. By their nature, forward-looking statements involve risks and uncertainties, because they relate to events and depend on circumstances that may or may not occur in the future. Samsung cautions you that forward looking statements are not guarantees of future performance and that the actual developments of Samsung, the market, or industry in which Samsung operates may differ materially from those made or suggested by the forward-looking statements contained in this presentation or in the accompanying oral statements. In addition, even if the information contained herein or the oral statements are shown to be accurate, those developments may not be indicative developments in future periods.
Legal Disclaimer

Why SSDs will take over HDDs in 2016
3 REASONS
TLC SSDs in The Enterprise
HPE 3PAR StoreServ Leading the next wave of solid state storage

1st Era
~2010 2nd Era
~2015 3rd Era
~2020
7.5ZB
44ZB
2ZB
A New Era of “Big Data Creation” is Here

What is Driving All of This Data?
Sources: Cisco VNI Report – May 2015, statista.com
2.8B
3.1B
60EB
Connected
Users
Apps
14.2B
Connected
Devices
Monthly
Data Traffic
Currently…
YOU are the New Driving Force for Data Explosion

Before Flash…
Long cab lines, payment issues On demand rides, auto pay
Transportation
Real-time Analytics: YOUR Location & Price
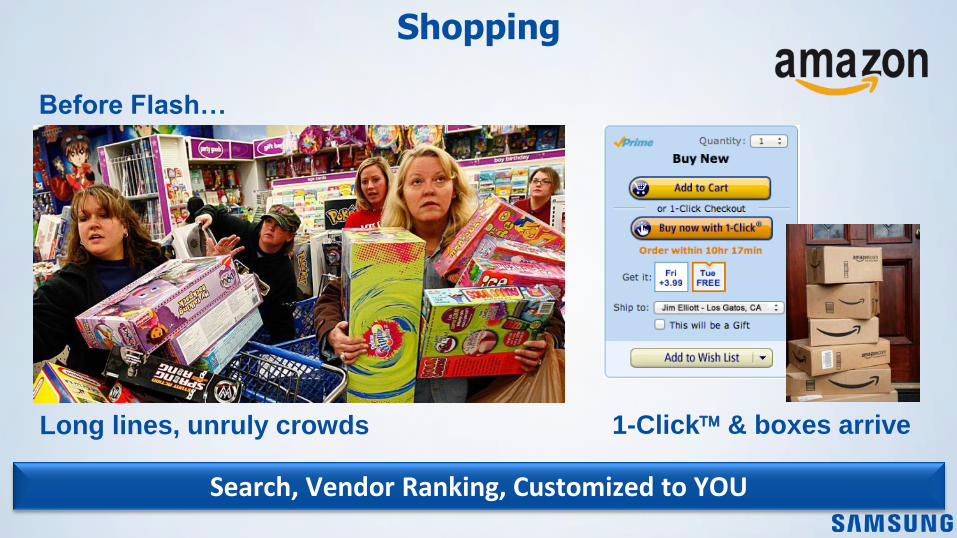
Before Flash…
Long lines, unruly crowds 1-Click & boxes arrive
Shopping
Search, Vendor Ranking, Customized to YOU
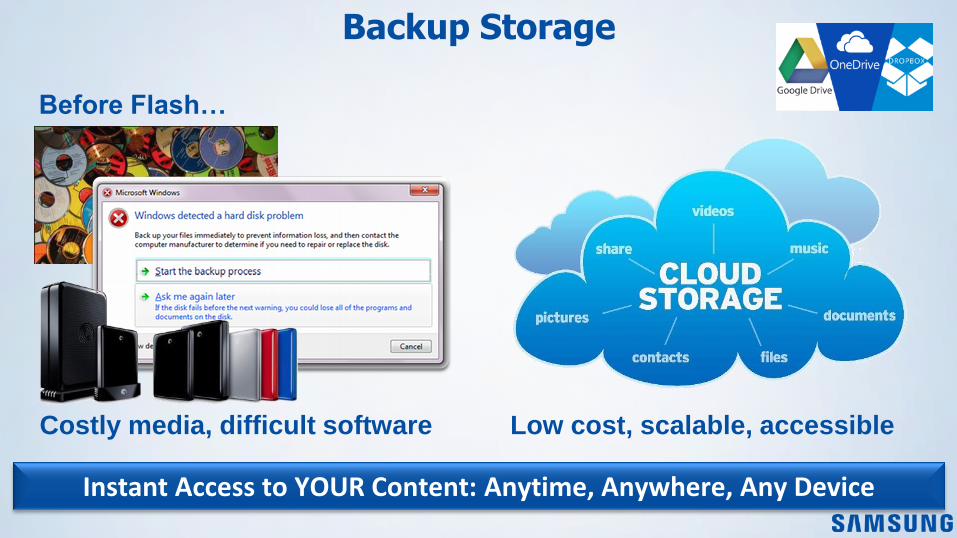
Before Flash…
Costly media, difficult software Low cost, scalable, accessible
Backup Storage
Instant Access to YOUR Content: Anytime, Anywhere, Any Device

Before Flash…
Scattered, fragile, unorganized Searchable, protected, free
Photos
Automatic Editing, Organization & Publishing of YOUR Memories

Before Flash…
Fixed location, fixed content Untethered a la carte
Entertainment
Millions of HD Streams on Demand; YOUR Video on Flash
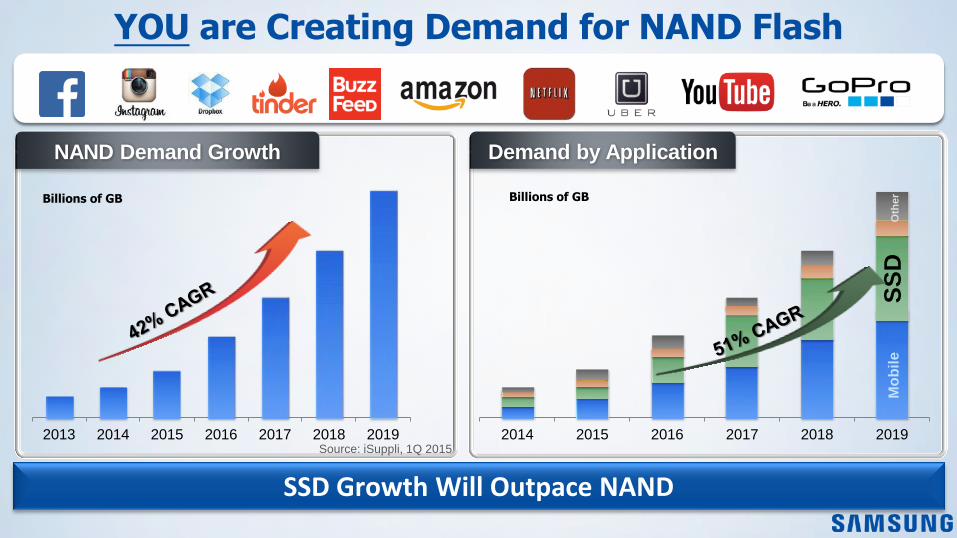
YOU are Creating Demand for NAND Flash
2013 2014 2015 2016 2017 2018 2019
NAND Demand Growth
Source: iSuppli, 1Q 2015
Billions of GB
Demand by Application
2014 2015 2016 2017 2018 2019
Billions of GB
Mo
bil
e
SS
D
Oth
er
SSD Growth Will Outpace NAND
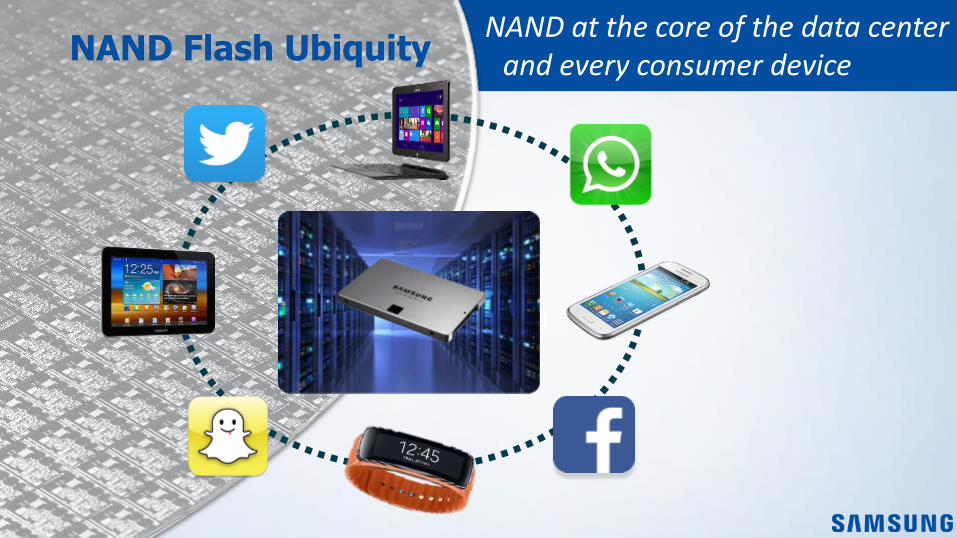
NAND at the core of the data center and every consumer device NAND Flash Ubiquity

? Impact of SSD

Why an SSD?
Processor Memory
Storage (HDDs)
Time
Pe
rfo
rma
nce
Closing the gap with
Solid State Storage
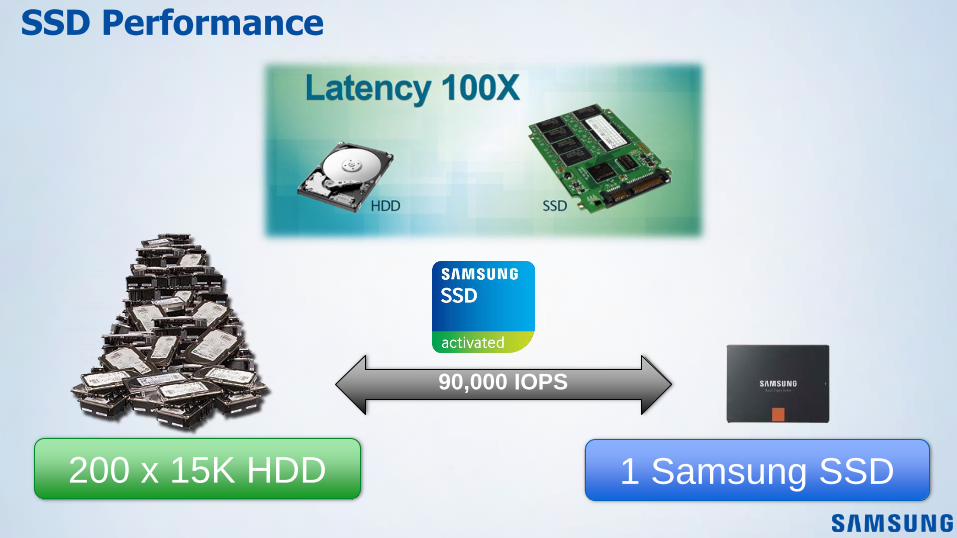
90,000 IOPS
1 Samsung SSD 200 x 15K HDD
SSD Performance

Lower failure rates
0.26% 1 in 387 SSDs
3.00% 1 in 33 HDDs
Sources: SSD: Sample set of 3 million SSD shipments, HDD: Google, Carnegie Mellon
vs
SSD HDD

HDD is the Enterprise Incumbent
Why?
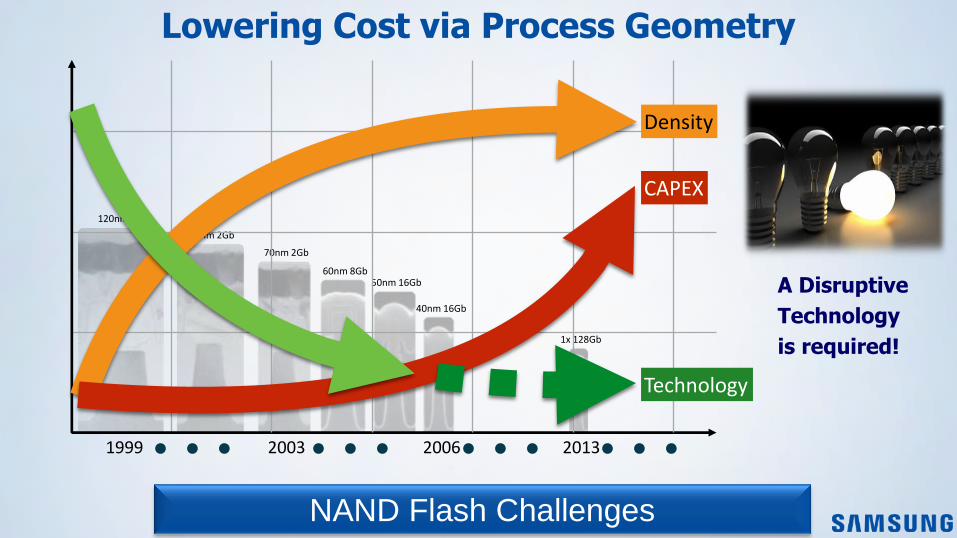
120nm 1Gb
90nm 2Gb
70nm 2Gb
60nm 8Gb 50nm 16Gb
40nm 16Gb
1x 128Gb
1999 2003 2006 2013
Technology
CAPEX
Density
NAND Flash Challenges
Lowering Cost via Process Geometry
A Disruptive
Technology
is required!
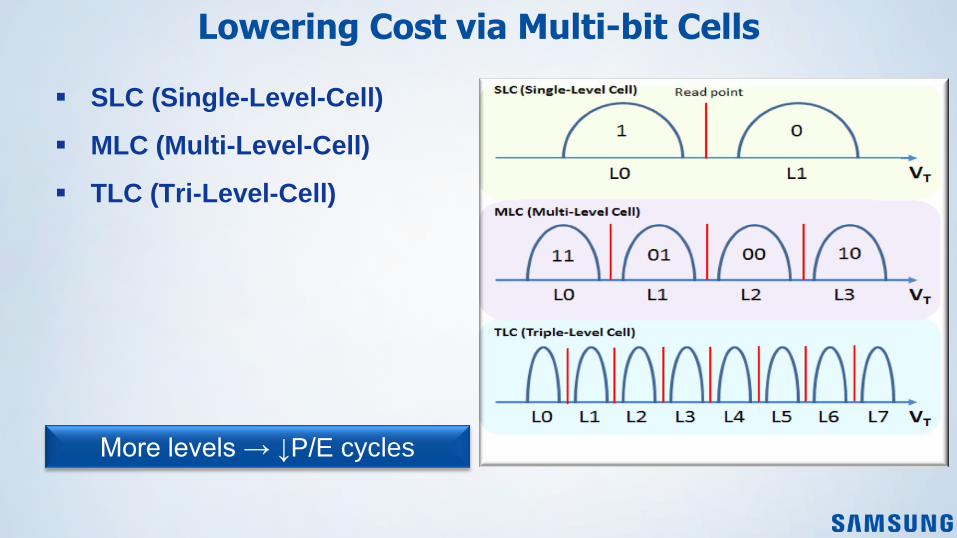
Lowering Cost via Multi-bit Cells
SLC (Single-Level-Cell)
MLC (Multi-Level-Cell)
TLC (Tri-Level-Cell)
More levels → ↓P/E cycles

Four Key Criteria for Storage
SSDs operate among 4 parameters
that influence each other
Cannot maximize all parameters
simultaneously
Must strike a balance to optimize
for the application
Capacity Performance
Endurance Cost
Cost optimization → ↓performance & ↓endurance
Why Samsung for SSD?
#1 Supplier
• World’s #1 SSD Supplier
• World’s #1 NAND Producer
• World’s #1 DRAM Producer
Customer Benefits
• No Need To Add Another Supplier
• Vertical Integration Leads To
Superior Product Capabilities
• Technology
Why SSDs will take over HDDs in 2016 REASON #1
More Capacity More Speed More Power Efficiency

2D Planar
‘05 ‘13 ‘07 ‘09 ‘11 Year
Design Rule (nm)
‘03
3D V-NAND / High Scalability
128Gb
16Gb
8 stack
128Gb
24 stack
1Tb
‘15
128Gb
32 stack
256Gb
48 stack
Transition to 3D NAND
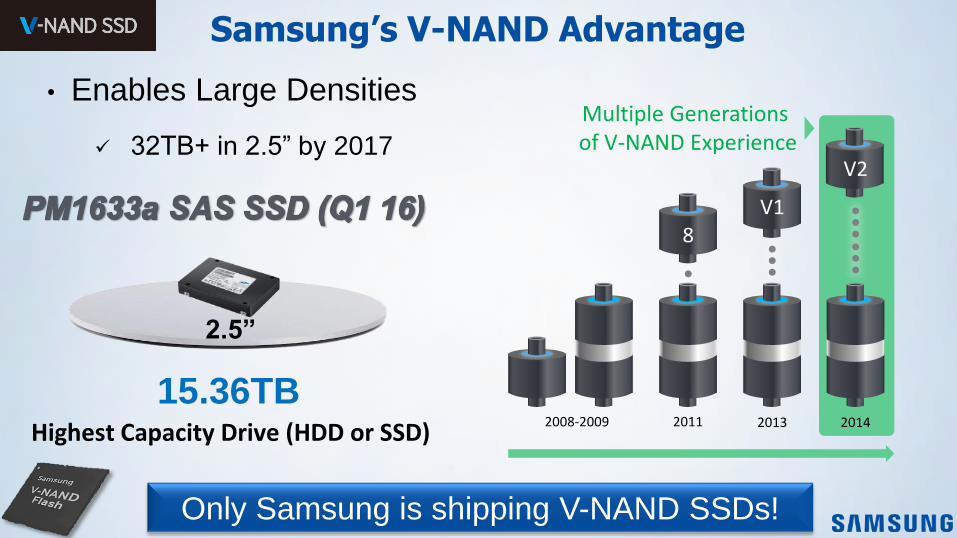
Samsung’s V-NAND Advantage
Only Samsung is shipping V-NAND SSDs!
• Enables Large Densities
32TB+ in 2.5” by 2017
2008-2009 2013
V1
2011
8
Multiple Generations of V-NAND Experience
2014
V2
2.5”
15.36TB Highest Capacity Drive (HDD or SSD)

Samsung’s V-NAND Advantage
Only Samsung is shipping V-NAND SSDs!
• Superior Performance
Up to 2x Write Performance
2008-2009 2013
V1
2011
8
Multiple Generations of V-NAND Experience
2014
V2
1 Million IOPS – Fastest SSD in the World
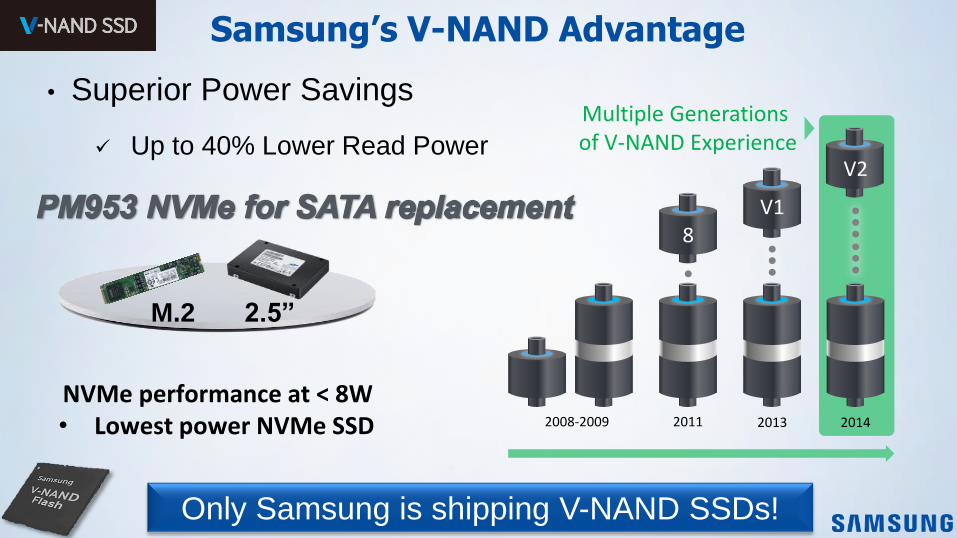
Samsung’s V-NAND Advantage
Only Samsung is shipping V-NAND SSDs!
• Superior Power Savings
Up to 40% Lower Read Power
2008-2009 2013
V1
2011
8
Multiple Generations of V-NAND Experience
2014
V2
M.2 2.5”
NVMe performance at < 8W • Lowest power NVMe SSD

Samsung’s V-NAND Advantage
Only Samsung is shipping V-NAND SSDs!
• Unmatched Write Endurance
Scales by Building Up,
Rather Than Shrinking Cells
Up to 10x Write Endurance
2008-2009 2013
V1
2011
8
Multiple Generations of V-NAND Experience
2014
V2
• PM1633 SAS • PM1725 and PM953 NVMe • PM863 SATA
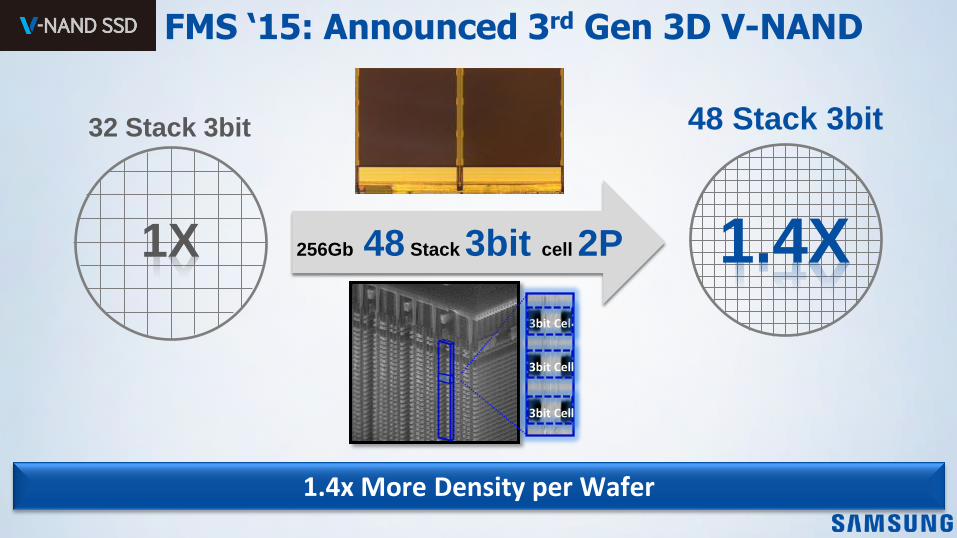
32 Stack 3bit 48 Stack 3bit
1.4X 256Gb 48 Stack 3bit cell 2P
3bit Cell
3bit Cell
3bit Cell
FMS ‘15: Announced 3rd Gen 3D V-NAND
1X
1.4x More Density per Wafer
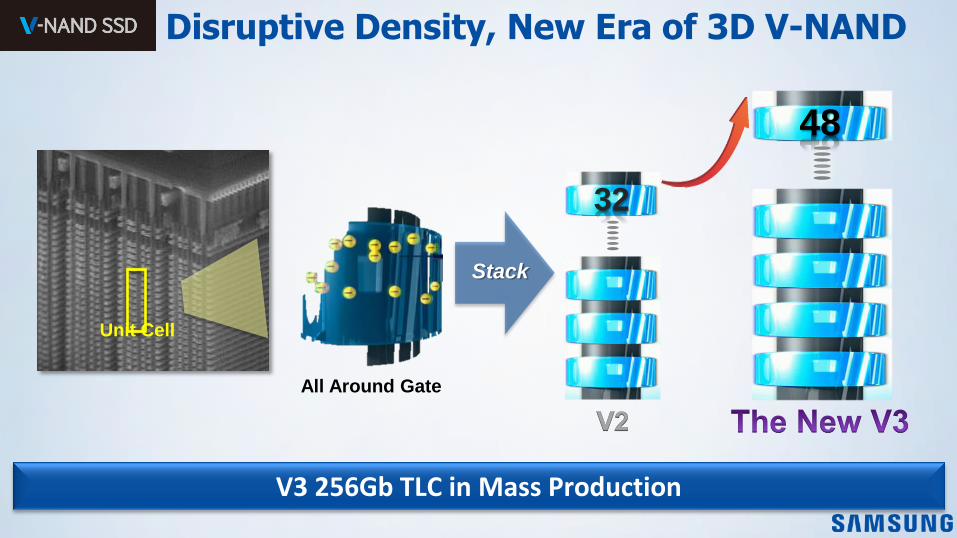
All Around Gate
48
Unit Cell
32
Stack
Disruptive Density, New Era of 3D V-NAND
V3 256Gb TLC in Mass Production

2015 2010 Year
Nu
mb
er
of
Layers
128Gb
256Gb
1Tb
> 100
Layers
128Gb
24 layer
32 layer
48 layer
Density Leadership
V-NAND Capacity Breakthrough and Scalability
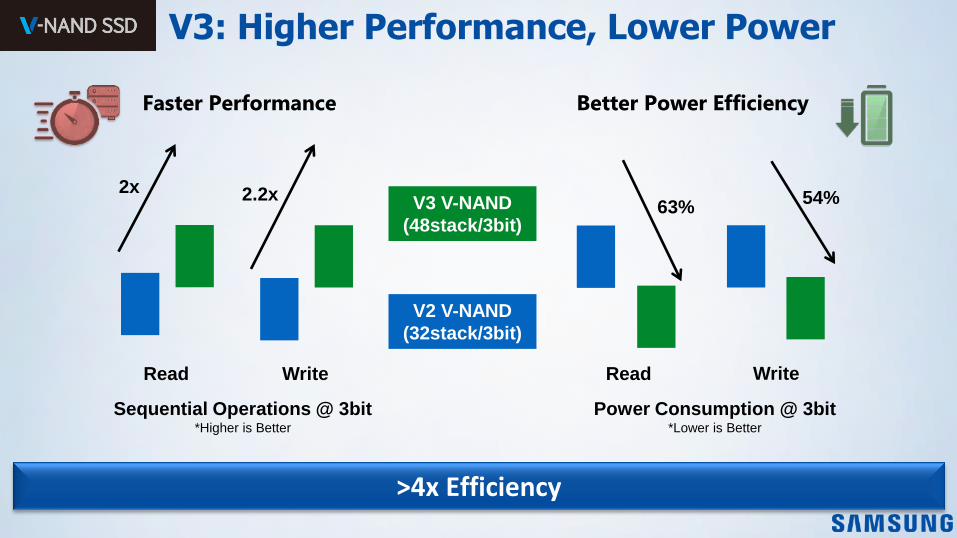
V3 V-NAND
(48stack/3bit)
V2 V-NAND
(32stack/3bit)
Sequential Operations @ 3bit *Higher is Better
Read
2x
Write
2.2x
Power Consumption @ 3bit *Lower is Better
Write
54%
Read
63%
V3: Higher Performance, Lower Power
>4x Efficiency
Better Power Efficiency Faster Performance
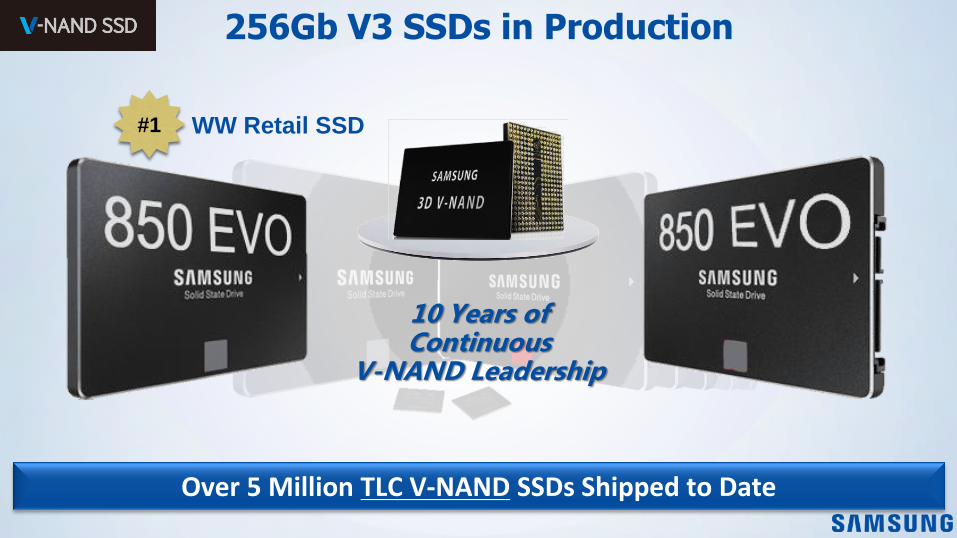
10 Years of Continuous
V-NAND Leadership
Over 5 Million TLC V-NAND SSDs Shipped to Date
256Gb V3 SSDs in Production
#1 WW Retail SSD
Why SSDs will take over HDDs in 2016 REASON #2
TLC SSDs in The Enterprise

V-NAND Gains Back What was Lost
For planar NAND, endurance was sacrificed going to TLC
V-NAND gains back what was lost
Industry transitioning to 3D NAND for mainstream client and enterprise applications
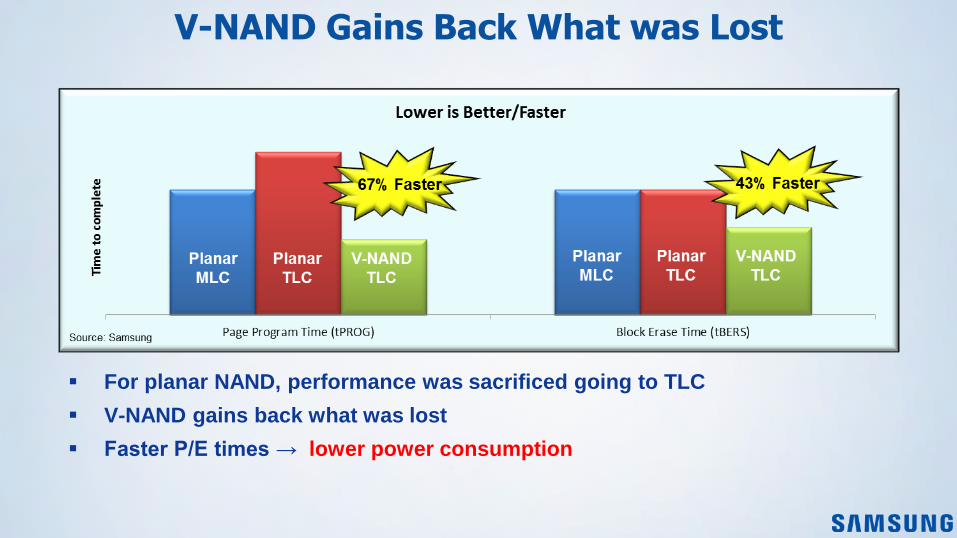
V-NAND Gains Back What was Lost
For planar NAND, performance was sacrificed going to TLC
V-NAND gains back what was lost
Faster P/E times → lower power consumption
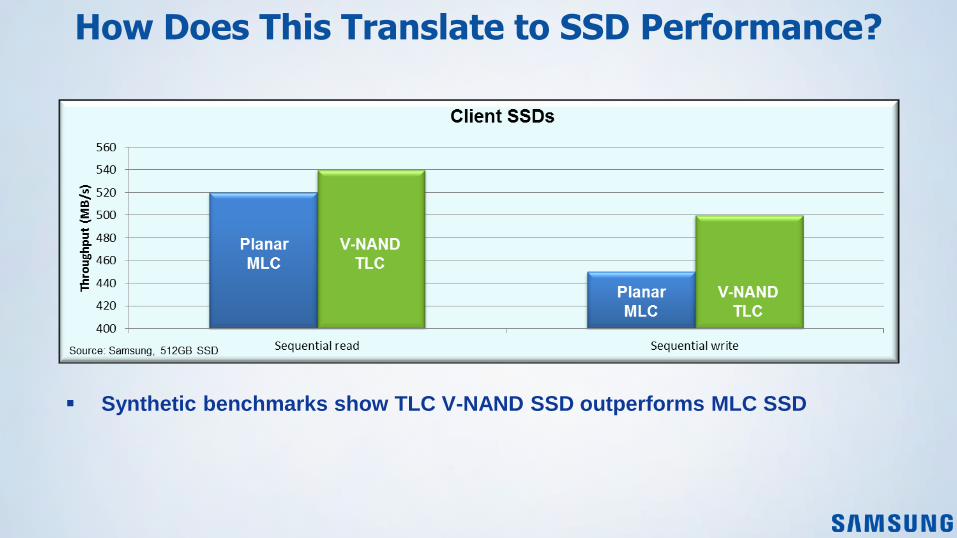
How Does This Translate to SSD Performance?
Synthetic benchmarks show TLC V-NAND SSD outperforms MLC SSD

How Does This Translate to SSD Performance?
Synthetic benchmarks show TLC V-NAND SSD outperforms MLC SSD
Data Center use also requires great random performance – TLC V-NAND
holds up well

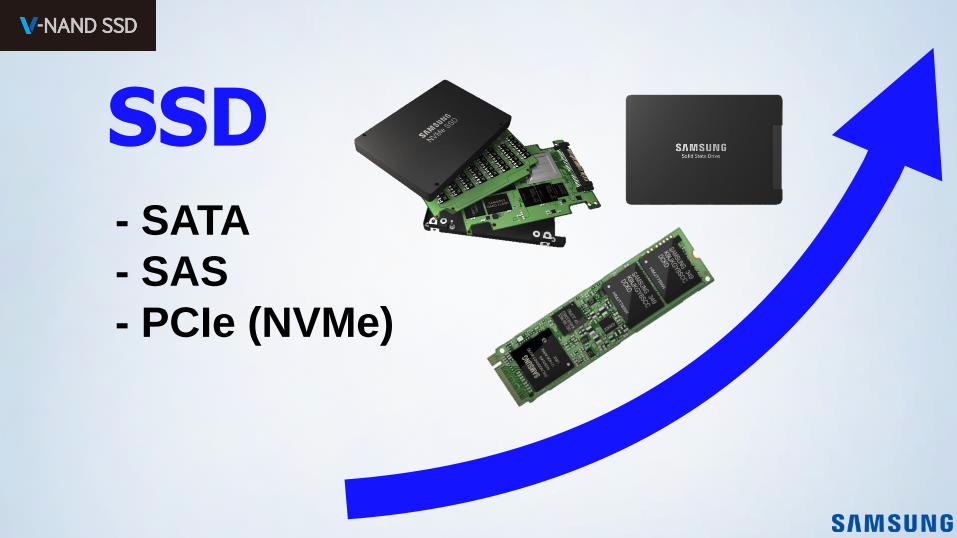
SSD - SATA
- SAS
- PCIe (NVMe)

2012 2013 2014 2015 2016 2017 2018
Un
it C
os
t
240GB SSD vs. 300GB HDD Pricing
Enterprise SSDs Past the Tipping Point
Source: Forward Insights, Samsung
300GB 15K
300GB 10K
240GB SSD
Past 15K / SSD PRICE INFLECTION POINT
Price Inflection Point
0
5
10
15
20
25
30
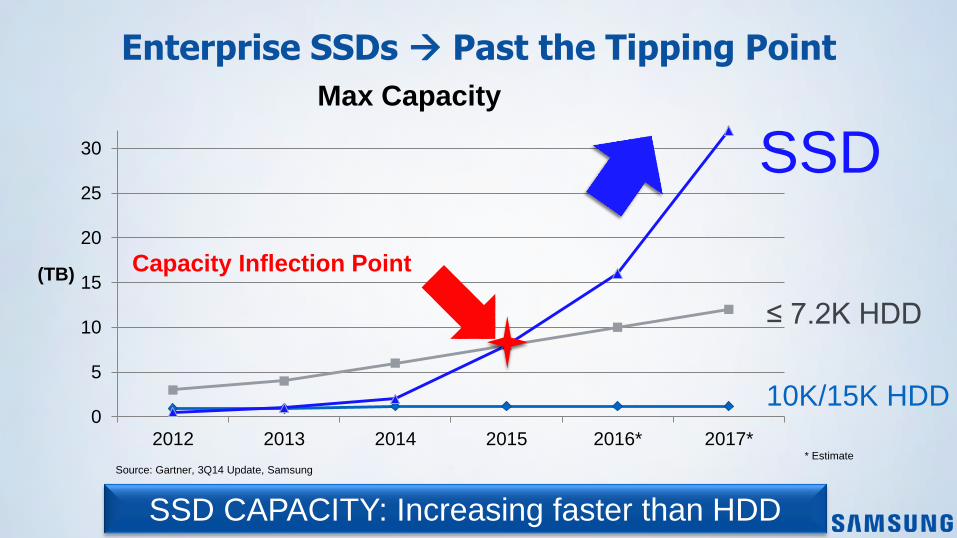
2012 2013 2014 2015 2016* 2017*
(TB)
Max Capacity
Enterprise SSDs Past the Tipping Point
SSD CAPACITY: Increasing faster than HDD
Source: Gartner, 3Q14 Update, Samsung
* Estimate
10K/15K HDD
≤ 7.2K HDD
SSD
Capacity Inflection Point

Changing Enterprise SSD Requirements
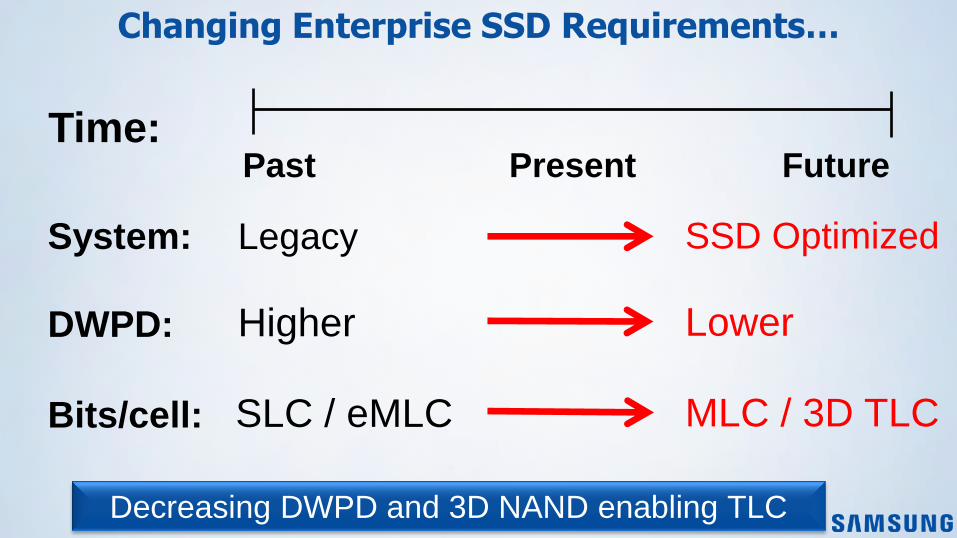
Changing Enterprise SSD Requirements…
Decreasing DWPD and 3D NAND enabling TLC
Higher
SLC / eMLC
System:
DWPD:
Legacy
Bits/cell:
Past Future Time:
Present
SSD Optimized
Lower
MLC / 3D TLC

SLC vs. MLC vs. TLC (NAND Cost)
SLC pricing cannot compare to MLC / TLC
Source: Forward Insights, NAND Quarterly Insights Q1/15
TLC
MLC
SLC
2013 2014 2015 2016 2017 2018

MLC vs. TLC (NAND Cost)
Further cost reduction for TLC NAND
Source: Forward Insights, NAND Quarterly Insights Q1/15
TLC
MLC
2013 2014 2015 2016 2017 2018
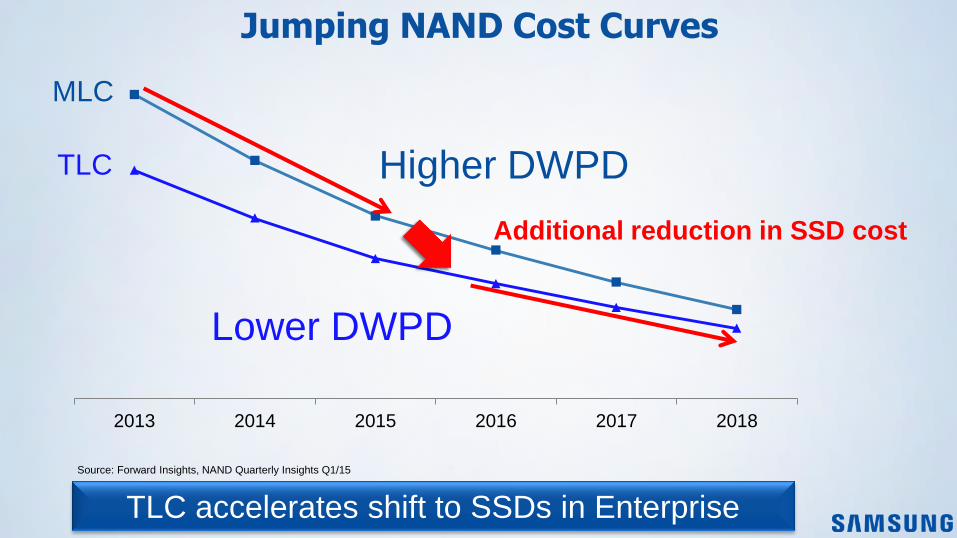
Jumping NAND Cost Curves
TLC accelerates shift to SSDs in Enterprise
Source: Forward Insights, NAND Quarterly Insights Q1/15
TLC
MLC
2013 2014 2015 2016 2017 2018
Higher DWPD
Lower DWPD
Additional reduction in SSD cost

0
5
10
15
20
25
30
35
40
2012 2013 2014 2015 2016 2017 2018
Un
its
Mil
lio
ns
10K/15K HDDs Shipped
15K SHIPMENTS: 40% Decline in 2016
Source: Gartner, 3Q14 Update
10K
10K/15K
(3.5 in)
15K - 40%
Enterprise SSDs Past the Tipping Point
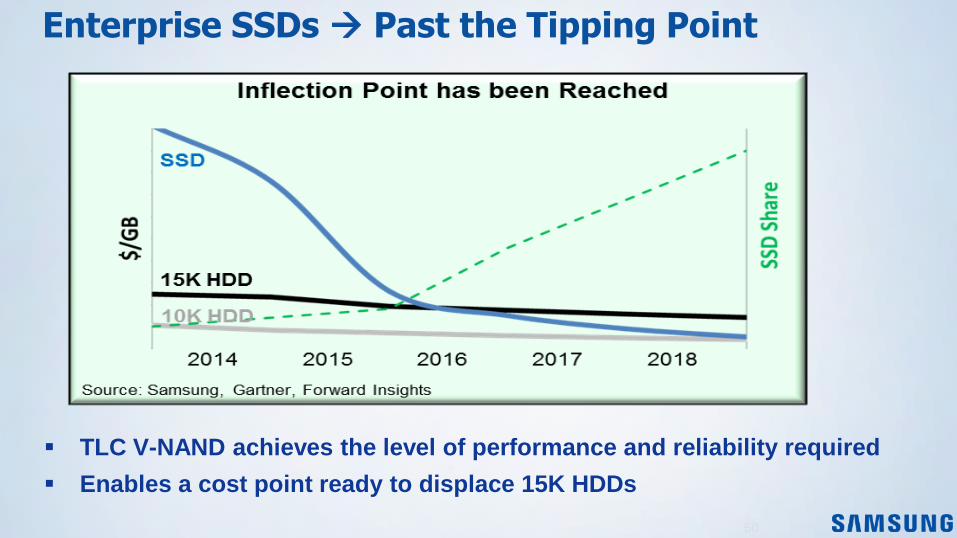
50
TLC V-NAND achieves the level of performance and reliability required
Enables a cost point ready to displace 15K HDDs
Enterprise SSDs Past the Tipping Point

Source: Forward Insights
Transition to TLC & 3D NAND
0%
25%
50%
75%
100%
2013 2014 2015 2016 2017 2018 2019
TLC
MLC
SLC
0%
25%
50%
75%
100%
2013 2014 2015 2016 2017 2018 2019
TLC - 3D
TLC - Planar
MLC - 3D
MLC - Planar
SLC - Planar
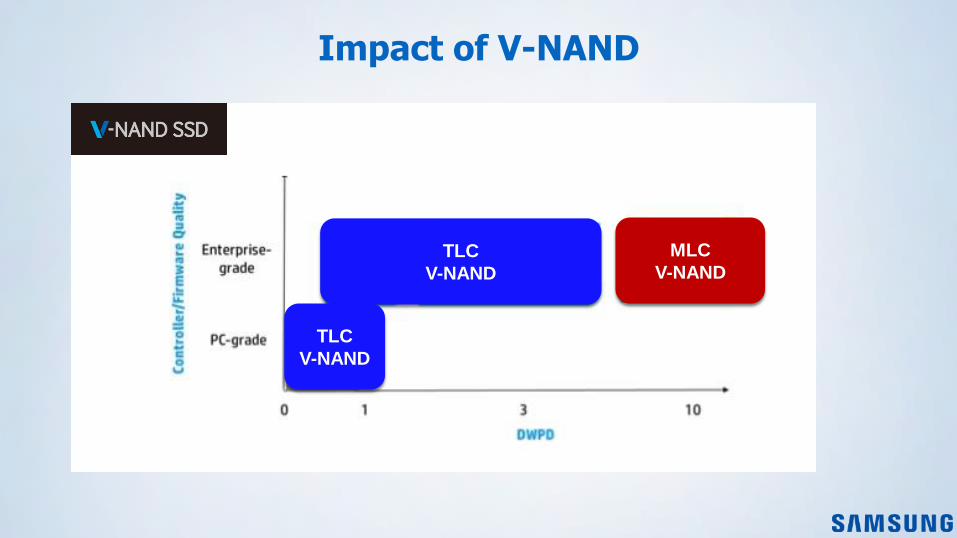
Impact of V-NAND
TLC
V-NAND
MLC
V-NAND
TLC
V-NAND
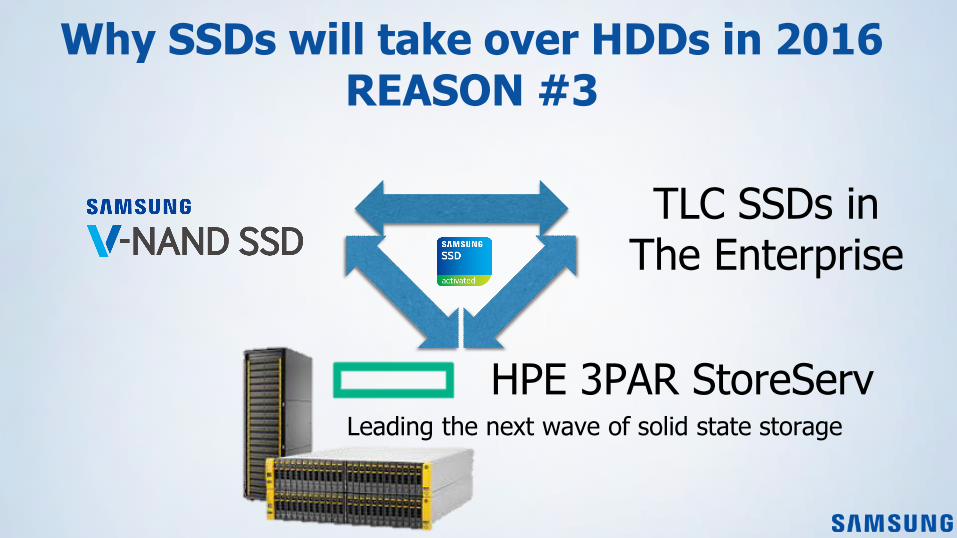
Why SSDs will take over HDDs in 2016 REASON #3
TLC SSDs in The Enterprise
HPE 3PAR StoreServ Leading the next wave of solid state storage
HPE 3PAR StoreServ Leading the next wave of solid state storage
Aravindan Gopalakrishnan, Product Manger – HPE Storage

All-flash arrays have been at a tipping point…
55
Mainstream
adoption
Wave 2 tried to
displace disk
Wave 1 focused on
performance
?
Speed
Affordability
Enterprise Resiliency & Data Services

The future is an all-flash data center
• Changes will enable new business models and increase productivity
• Workloads combined to share data using NAND flash as the active storage media
• Cloud-enabled converged infrastructure, this will reduce IT budgets, increase productivity
• Minimize physical copies, increase logical copies deployed from data
• Combine transactional, data warehouse & development data initially
• Combine all data within five years.
Source http://premium.wikibon.com/the-it-benefits-of-an-all-flash-data-center/

Architecture matters
To be successful an all flash architecture needs to possess all these attributes
Performance acceleration Eliminate system bottlenecks
System resiliency Provide constant application access
Efficiency Optimization Extend life and utilization of Media
Data mobility Federate across systems and sites

HPE 3PAR architecture is a study in efficiency
1 Spread the load evenly – “wide striped”
58
2 Intelligent writes
3 Innovative spare management
4 No locked-up pools of capacity
5 No locked-up pools of capacity
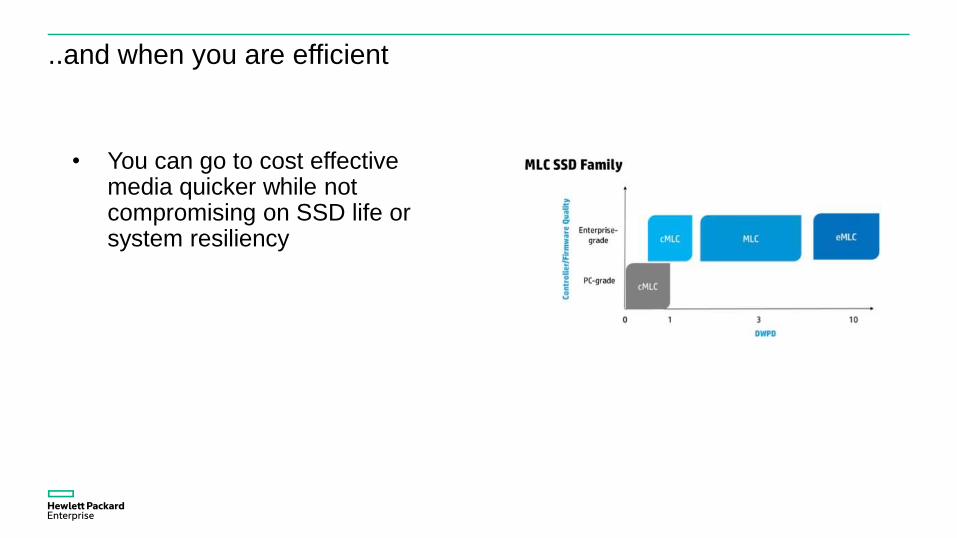
..and when you are efficient
• You can go to cost effective media quicker while not compromising on SSD life or system resiliency
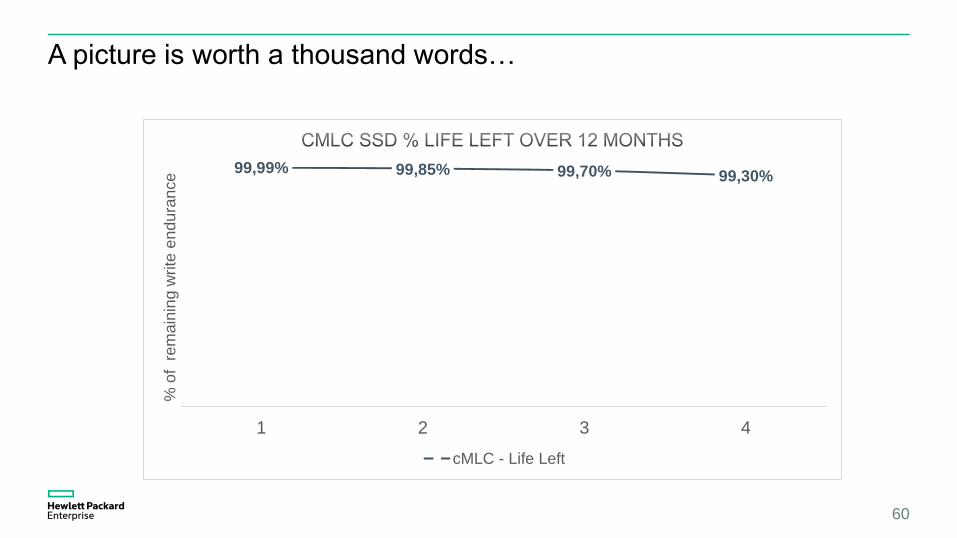
A picture is worth a thousand words…
60
99,99% 99,85% 99,70% 99,30%
1 2 3 4
% o
f r
em
ain
ing w
rite
en
du
ran
ce
cMLC - Life Left

Flash-optimized end-to-end data integrity, availability, and protection
1
3PAR Persistent Checksum
powered by 3PAR Gen5 ASIC
3PAR Asynchronous
Streaming Replication
3PAR Protection with
StoreOnce RMC-V Flat Backup
2 3
Express
Protect
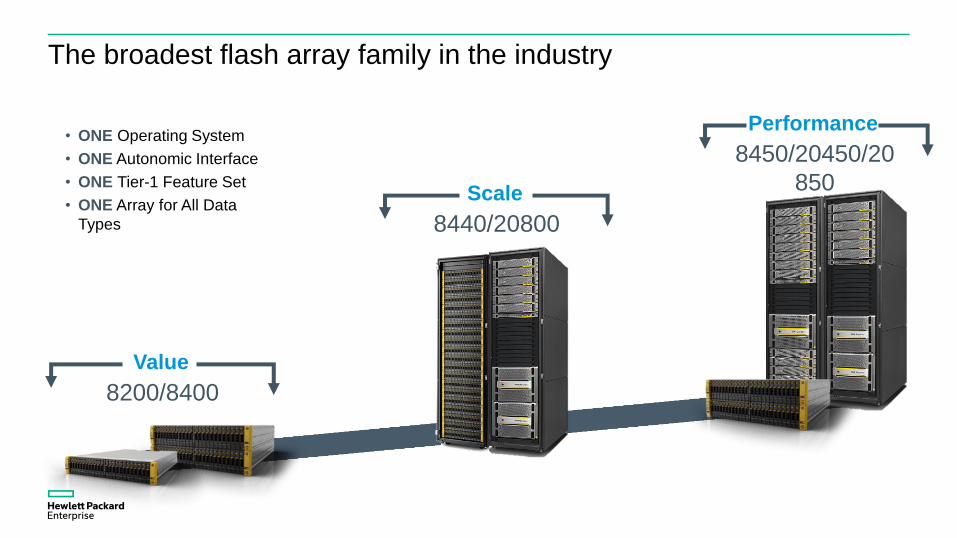
The broadest flash array family in the industry
• ONE Operating System
• ONE Autonomic Interface
• ONE Tier-1 Feature Set
• ONE Array for All Data
Types
8200/8400
Value
8440/20800
Scale
8450/20450/20
850
Performance


Visit Us At Booth #232
Demos, Raffles, SSD Giveaways!
• Ultra-Green Server w/ NVMe & DDR4
• AutoCache Software
• V-NAND SSDs in 3PAR 7200 AFA
• m.2 NVMe SSDs in Moonshot Server
Thank You!
http://www.samsung.com/semiconductor/products/flash-storage/v-nand/
https://www.hpe.com/us/en/storage/flash-hybrid.html
Anders Graham, Samsung Semiconductor Inc. [email protected]
Aravindan Gopalakrishnan, HP Enterprise [email protected]