plc - q2 2019 investor presentation aug 9 2019 - vplc...
TRANSCRIPT

Investor PresentationAs of Q2 2019
Park Lawn Corporation TSX: PLC

Disclaimers
2
Non‐Reliance
This presentation does not purport to be comprehensive or to contain all the information that a recipient may need in order to evaluate an investment in securities of Park Lawn Corporation (“Park Lawn” or the “Company”). No representation or warranty, express or implied, is given and, so far as is permitted by law and no responsibility or liability is accepted by any person, with respect to the accuracy or completeness of the presentation or its contents. In particular, but without limitation, no representation or warranty is given as to the achievement or reasonableness of, and no reliance should be placed on, any projections, targets, estimates or forecasts contained in this presentation. In giving this presentation, the Company does not undertake any obligation to provide any additional information or to update this presentation or any additional information or to correct any inaccuracies which may become apparent. This presentation has been prepared without reference to your particular investment objectives, financial situation, taxation position and particular needs. If you are in any doubt in relation to these matters, you should consult your financial or other advisers.
Cautionary Statement Regarding Forward‐Looking Information
This presentation may contain forward‐looking statements (within the meaning of applicable securities laws) relating to the business of the Company and the environment in which it operates. Forward‐looking statements are identified by words such as “believe”, “anticipate”, “project”, “expect”, “intend”, “plan”, “will”, “may”, “estimate” and other similar expressions. These statements are based on the Company’s expectations, estimates, forecasts and projections and include, without limitation, statements regarding the deathcare sector’s characteristics and the growth targets that PLC aspires to achieve by the end of 2022, as well as the Company’s business, future development and construction, future financial position and business strategy, potential acquisitions, potential business partnering, litigation and the Company’s plans and objectives. By its nature, forward‐looking information is inherently uncertain, is subject to risk and is based on numerous assumptions, including those set out under the heading “Outlook” in PLC’s management’s discussion and analysis for the second quarter of 2019 (filed on SEDAR on August 12, 2019), as well as that acquisition multiples remain at or below levels paid by PLC for previously announced acquisitions, the CAD to USD exchange rate remains consistent, the acquisition and financing markets remain accessible, capital can be obtained at reasonable costs and PLC’s current business lines operate and obtain synergies as expected, as well as those regarding present and future business strategies, the environment in which the Company will operate in the future, expected revenues, expansion plans and the Company’s ability to achieve its goals. Although management of the Company believes that the expectations represented in such forward‐looking information are reasonable, there can be no assurance that such expectations will prove to be correct.
A number of factors could cause actual results to differ materially from the results discussed in the forward‐looking statements, including, but not limited to, the factors discussed under the heading “Risk Factors” in the Company’s annual information form available at www.sedar.com. There can be no assurance that forward‐looking statements will prove to be accurate as actual outcomes and results may differ materially from those expressed in these forward‐looking statements. Readers, therefore, should not place undue reliance on any such forward‐looking statements. Further, these forward‐looking statements are made as of the date of this presentation and, except as expressly required by applicable law, the Company assumes no obligation to publicly update or revise any forward‐looking statement, whether as a result of new information, future events or otherwise.
Non‐IFRS Measures
EBITDA, adjusted EBITDA and adjusted EBITDA margin are not measures recognized under IFRS and do not have a standardized meaning prescribed by IFRS. Such measures are presented in this presentation because management of the Company believes that such measures are relevant in interpreting the effect of the acquisitions on the Company. Such measures, as computed by the Company, may differ from similar computations as reported by other similar organizations and, accordingly, may not be comparable to similar measures reported by such other organizations. Please see the Company’s most recent management’s discussion and analysis, available at www.sedar.com for how the Company reconciles such measures to the nearest IFRS measure.

3
Park Lawn CorporationCompany Overview
Park Lawn Corporation (TSX:PLC) is the largest publicly traded Canadian‐owned funeral, cremation and cemetery provider Park Lawn is a progressive, growth‐orientated company that delivers high quality products and services to meet the rapidly
evolving needs of the North American market Park Lawn operates in micro markets with an entrepreneurial and adaptable business model
– Exposure to markets with high cremation rates (Toronto, New York, New Jersey, New Mexico), as well as low cremation rates (Mississippi, Kentucky, North Carolina)
– #1 player in cremations in Toronto, conducting >50% of cremations performed in the market Products and services, including cemetery lots, crypts, funeral services and cremation options, are sold to clients on a pre‐
planned basis (pre‐need) or at the time of death (at‐need)
1 2
3
$100 M EBITDABy 2022
Acquisitions Organic Growth
Margin Expansion
Source: US Census Bureau, National Funeral Directors Association, Statistics Canada
Death Care Industry (North America)
Revenue generated from 22,000
funeral homes
Revenue generated from 5,000 cemeteries
$20 Bn
$16 Bn $4 Bn

Park Lawn’s Current Operating Presence
4
(1) Of the locations listed, 15 are on‐site funeral homes which are operated in conjunction with cemeteries
Location(1) Cemeteries Funeral Homes (FH) Crematoria
CanadaOntario 6 14 6Manitoba ‐ 6 -British Columbia ‐ 8 2Quebec ‐ 2 1Saskatchewan ‐ 2 1Subtotal 6 32 10
U.S.North Carolina 28 10 2Michigan 28 ‐ 15Kentucky 17 3 -New Mexico 3 12 5New Jersey 7 ‐ 4Texas 5 4 -Missouri 3 8 -Mississippi ‐ 3 -Illinois 1 1 -Kansas 1 2 -New York 1 ‐ -South Carolina 1 ‐ -Wisconsin ‐ 8 2Colorado 2 11 -Subtotal 97 63 28
Total (U.S & Canada) 103 95 38
Major Milestones
Operates in Wisconsin
8 FH 2 CrematoriaFeb‐19
Operates in Kansas, Missouri, New Mexico and Mississippi, Texas
9 Cemeteries 21 FH 5 Crematoria
May‐18
Operating Presence
Nov‐18
Operates in North & South Carolina
29 Cemeteries 8 FH
May‐19
Horan operates in Colorado with 2 Cemeteries & 11 FH
Baue operates in Missouri with 1 Cemetery & 4 FH
June‐19
Integrity operates in Houston

0
20
40
60
80
100
120
140
1974 1984 1994 2004 2014 2024 2034 2044 2054
Millions
0
1
2
3
4
5
6
1974 1984 1994 2004 2014 2024 2034 2044 2054Millions
Positioned For Future Success
5
Canada
Park Lawn is uniquely positioned to take advantage of population demographics
Favourable Demographics– Aging Population: Pre‐Need on the cemetery side – Increasing Death Rate: At‐Need on the funeral side
Population 65+
Annual Number of Deaths
United States
Population 65+
Annual Number of Deaths
Observed Projected
Observed Projected
Real Estate & Services– ~75% of PLC’s funeral home services are sold at‐need– ~75% of PLC’s cemetery business is sold pre‐need
PLC Revenue split is 17% Canada and 83% U.S.
0
6,000
12,000
18,000
1974 1984 1994 2004 2014 2024 2034 2044 2054 2064
0
200
400
600
1974 1984 1994 2004 2014 2024 2034 2044 2054 2064
Low Growth High Growth
Low Growth Medium Growth High Growth
Observed Projected
Observed Projected
Thou
sand
sTh
ousand
s
Source: ICCFA, OACFP, NFDA, Statistics Canada, U.S. Census Bureau, National Center for Health Statistics, Federal Reserve Economic Data
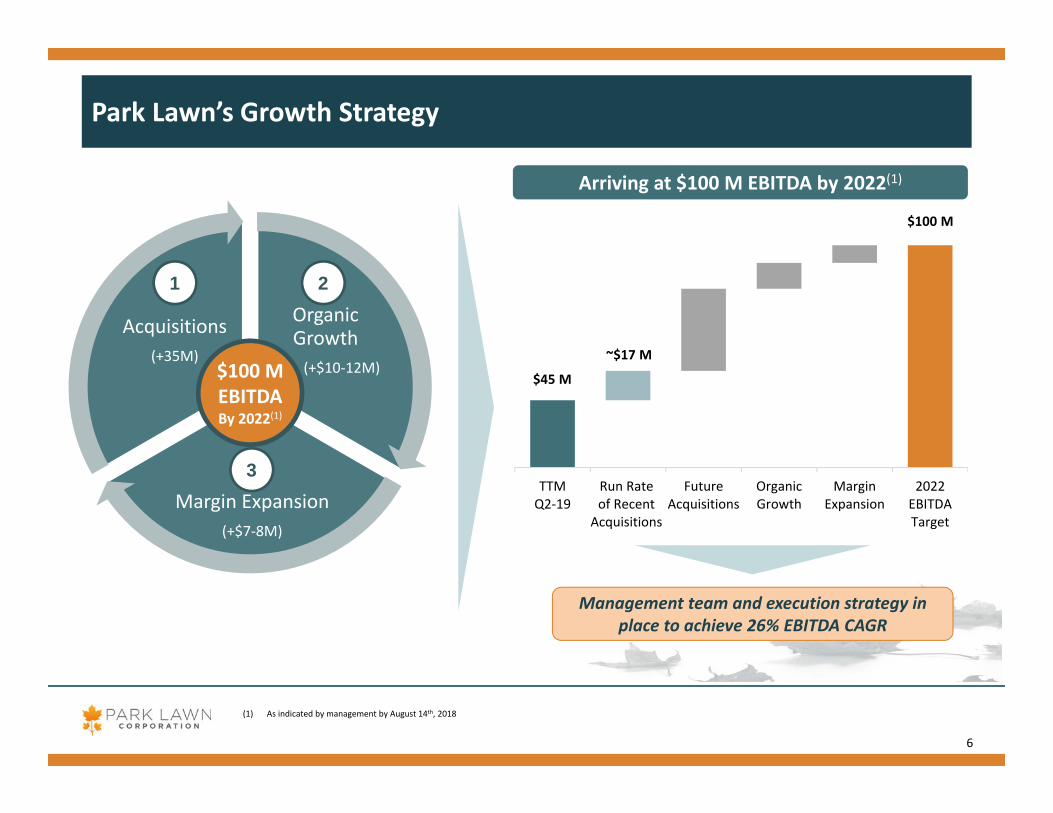
Park Lawn’s Growth Strategy
6
Organic Growth(+$10‐12M)
Margin Expansion(+$7‐8M)
Acquisitions(+35M)
1 2
3
$100 M EBITDABy 2022(1)
Management team and execution strategy in place to achieve 26% EBITDA CAGR
Arriving at $100 M EBITDA by 2022(1)
(1) As indicated by management by August 14th, 2018
TTMQ2‐19
Run Rateof Recent
Acquisitions
FutureAcquisitions
OrganicGrowth
MarginExpansion
2022EBITDATarget
~$17 M
$45 M
$100 M

7
Park Lawn’s Growth Strategy1. Acquisitions
Park Lawn has continued to increase the number of cemeteries and added funeral home assets across strategic markets in the U.S.
Bolstered growth in existing markets conducting tuck‐in acquisitions
Future acquisitions estimated to contribute $35 million in incremental EBITDA by 2022(1)
Continuing to increase cemetery and funeral home assets in the Canada and U.S. for geographic diversification
Near‐Term Strategic Priorities
1
Number of Locations AcquiredFuneral Homes CrematoriaCemeteries
Park Lawn spent $275 million on acquisitions in 2018& has committed/announced $170 million so far in 2019
48 37 11
19 13 1
3 26 22019
2018
2017
(1) As indicated by management by August 14th, 2018

Horan & Baue Acquisitions
8
Horan & McConaty Funeral Services, Inc. Strategic Rationale
Preeminent funeral home & cemetery businesses in two large metropolitan markets in the U.S., serving their respective families for generations
Key sites offer decades of cemetery inventory capacity.
Both transactions fall within PLC’s publicly‐stated purchase price multiple range for transactions of this nature
Acquisitions are expected to be immediately accretive to both PLC’s adjusted net earnings, and adjusted EBITDA per share
Operates 2 cemeteries & 11 funeral homes (including 2 on‐sites)
Location: Denver & Aurora, Colorado Horan has become one of the most respected names in
funeral service in the United States
Total Purchase Price: US$101.5 M
The Baue Funeral Home Co.
Operates 1 large cemetery & 4 funeral homes (including 1 on‐site)
Location: St. Charles County, Missouri Lisa Baue and her family are leaders in funeral and cemetery
services in the United States

9
Park Lawn’s Growth Strategy2. Organic Growth
Organic growth to contribute $10‐12 million of incremental EBITDA by 2022(1)
Growth capital of ~$40 million to be deployed between 2019 and 2022
Near‐Term Strategic Priorities Driven by introducing new products/services, investment in mausoleums, on‐site funeral homes and other projects
– High return opportunities that require capital investment upfront
– Unlock new sources of revenue for existing businesses while increasing the useful life of Park Lawn’s portfolio
Notable Examples
Paradise Mausoleum Expansion
Expansion of mausoleum located on Park Lawn Cemetery in Toronto in Nov 2016
Total invested: CAD$11 M Added 2,601 crypts to PLC’s inventory
Acquired an additional 78 acres of land in Lafayette Township, NJ for US$3 M in October 2018
Estimated development cost: US$1 M 1st Phase adds 10,000 lots to inventory
Forest Hill Memorial Mausoleum ‐ 432 crypts ~US$500 k
Westlawn Gardens Mausoleum ‐ 504 crypts/320 niches ~ US$625 k
Crematory at Forest Lawn ~ US$280 k
2
CMS Mid‐Atlantic Citadel
Target IRR of over 20% on expansion initiatives
(1) As indicated by management by August 14th, 2018

Park Lawn’s Growth Strategy3. Margin Expansion
10
Park Lawn’s Adjusted EBITDA Margin
17.5% 19.8% 21.9% 22.7%
2016 2017 2018 TTMQ2-19
27.1% 26.8%22.7%
Source: Company filings, Capital IQ(1) As indicated by management by August 14th, 2018(2) Represents Adjusted EBITDA for PLC shareholders; Adjusted EBITDA margin includes amounts attributable to the non‐controlling interest
3
Enhance margins to achieve $7‐$8 M of additional EBITDA(1)
Continue to streamline and improve operational efficiency
Integrate business functions across Park Lawn’s Canadian and U.S. offices
Complement existing business mix with higher margin operations (e.g. cremation and funeral homes)
Near‐Term Strategic PrioritiesAbility to enhance margins to achieve
$7 ‐ 8 M of additional EBITDA
Current Comparative Margins
(TTM Q2 2019 Adj. EBITDA)(2)
US$73 M US$859 M $45 MAdj. EBITDA
Park Lawn has exhibited rapid growth in its margins, expanding its Adjusted EBITDA margin by ~520 bps since 2016

$3.2 $4.9$8.6
$15.9$20.3
2015 2016 2017 2018 TTMQ2‐19
$28.2$67.3 $87.3
$161.4$202.6
2015 2016 2017 2018 TTMQ2‐19
Strong Underlying Growth and Financial Performance
11
Revenue
Adjusted EBITDA(1)
$7.1 $11.1$16.6
$34.7$45.3
2015 2016 2017 2018 TTMQ2‐19
Note: Figures shown in C$M’s unless indicated otherwise; as of Q2 2019(1) Represents Adjusted EBITDA for PLC shareholders; Adjusted EBITDA margin includes amounts attributable to non‐controlling interest(2) Figures calculated with respect to diluted shares outstanding at the respective reporting period
18.9% 138.4% 29.8% 84.9% 74.8%
25.1% 17.5% 19.8% 21.9% 22.7%
YoY Growth
Margin
Net Earnings
Adj. Net Earnings
Adj. Net Earnings
per Share(2)
Park Lawn continues to deliver strong results ‐ both at the firm‐wide and shareholder level
33.5% 52.6% 75.2% 85.9% 75.7%
$0.55 $0.61 $0.64$0.77 $0.76
2015 2016 2017 2018 TTMQ2‐19
16.7% 11.1% 4.7% 20.1% 18.6%
YoY Growth
YoY Growth
PerShare(2) $1.22 $1.39 $1.25 $1.67 $1.71

12
Investment Highlights
• High growth operator in a stable and highly fragmented industry
• An aging population across North America provides favourable demographic characteristics
• Fragmentation allowing for tuck‐ins providing economies of scale
• Margin expansion opportunities through increased scale and operating efficiencies
• High barriers to entry due to zoning laws – particularly in cemeteries –and pricing pressure on smaller operators
• Conservative capitalization facilitates further growth through acquisition
• Continued execution on a robust M&A pipeline
1
5
4
3
2
6
7

-50.0%
0.0%
50.0%
100.0%
150.0%
200.0%
250.0%
300.0%
350.0%
Jan‐13 Jan‐14 Jan‐15 Jan‐16 Jan‐17 Jan‐18 Jan‐19
Park Lawn’s Outperformance
13
Total Return Analysis(1)
Note: Information as at August 12, 2019(1) Source: Bloomberg; total return analysis includes share price performance plus company distributions and dividends
Since January 1, 2013, Park Lawn has posted a total return of over +303%
Comparatively, the S&P/TSX Composite Index posted a +58% total return over that same period
S&P/TSXComposite Index
58%
303%