platt’s conference presentation - latest oil, energy ... · pdf fileplatt’s...
TRANSCRIPT
Platt’s Conference Presentation
April 2017
The opinions and views expressed in this presentation are those of the author(s) and do not necessarily reflect the views of Valero Energy Corporation.

2
Safe Harbor Statement
Statements contained in this presentation that state the company’s or
management’s expectations or predictions of the future are forward-looking
statements covered by the safe harbor provisions of the Securities Act of
1933 and the Securities Exchange Act of 1934. The words “believe,” “expect,”
“should,” “estimates,” “intend,” and other similar expressions identify forward–
looking statements. It is important to note that actual results could differ
materially from those projected in such forward-looking statements. For more
information concerning factors that could cause actual results to differ from
those expressed or forecasted, see Valero’s annual reports on Form 10-K and
quarterly reports on Form 10-Q, filed with the Securities and Exchange
Commission, and available on Valero’s website at www.valero.com.

3
Introduction to Valero
Refineries and ethanol plants
are in advantaged locations
15 refineries with 3.1 million
barrels per day of capacity
4
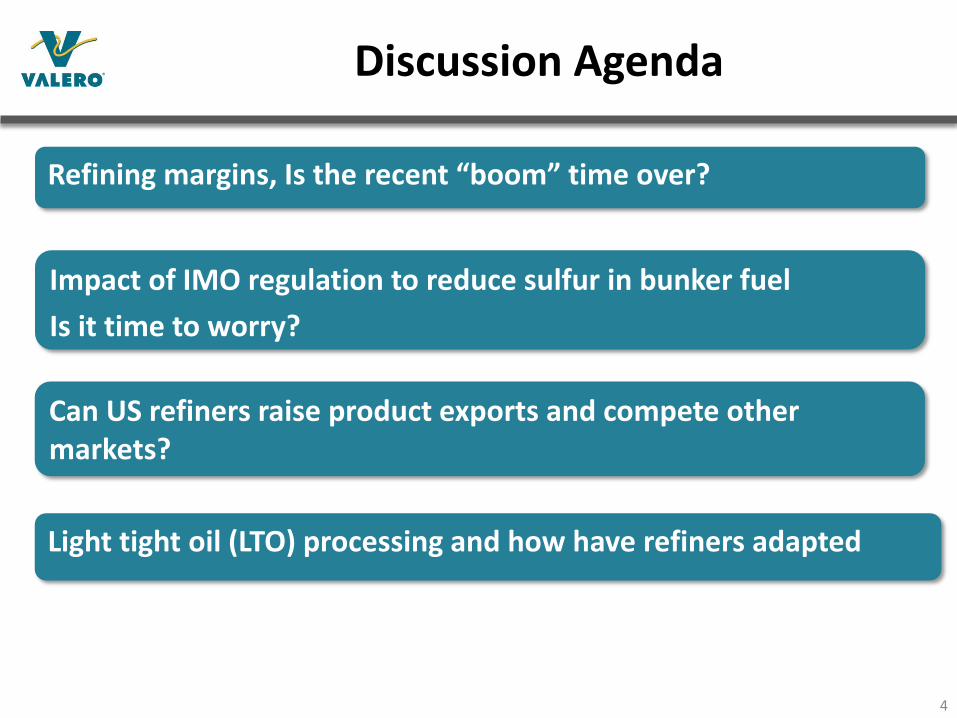
Discussion Agenda
Refining margins, Is the recent “boom” time over?
Light tight oil (LTO) processing and how have refiners adapted
Can US refiners raise product exports and compete other markets?
Impact of IMO regulation to reduce sulfur in bunker fuel
Is it time to worry?

5
Historical Margins
Heavy Sour Margins Light Sweet Margins
“Golden Age” shown on the charts from 2004-2008. Recent heavy sour margins not approaching “Golden Age”
Light sweet margins peaked in 2014-2015. 2016 margins down from peak, but, above historical average.
0.00
2.00
4.00
6.00
8.00
10.00
12.00
14.00
16.00
18.00
20.00
2001 2002 2003 2004 2005 2006 2007 2008 2009 2010 2011 2012 2013 2014 2015 2016
USGC Heavy Sour Coking Margin
Is the recent “boom” time over? First question is were 2014-2015 really a “boom” or just part of a cyclical refining business?
0.00
2.00
4.00
6.00
8.00
10.00
12.00
14.00
16.00
18.00
20.00
2001 2002 2003 2004 2005 2006 2007 2008 2009 2010 2011 2012 2013 2014 2015 2016
USGC Light Sweet Cracking Margin

6
Mid-Continent Historical Margins
WTI Discounts
Mid-Con margins and “boom” driven by wide differential between WTI and LLS in 2011-2014.
Mid-Con “boom” driven by low cost “stranded” crude as WTI to LLS spread widened. Increased pipeline “takeaway” capacity most likely prevents reoccurrence.
2001 2002 2003 2004 2005 2006 2007 2008 2009 2010 2011 2012 2013 2014 2015 2016
3-2-1 Crack Spreads
Group 3 3-2-1 WTI based USGC 3-2-1 LLS based
Mid-Con and USGC 3-2-1
2001 2002 2003 2004 2005 2006 2007 2008 2009 2010 2011 2012 2013 2014 2015 2016
WTI Minus LLS
WTI less LLS

7
Current Product Inventory Weighing on Margins
Product inventory draw needed or 2017 could follow similar pattern as 2016
Can increased demand draw down inventory?
Will supply reduce due to a heavy Spring Turnaround season?

8
Macro Environment Looks Favorable
Abundant global supply of crude oil
and natural gas. US crude
production on the rise. Adequate
supply of heavy crude from Canada
Forecasted world GDP growth
Product shortages in Latin America,
Europe, Africa, and Eastern Canada
Demand response to lower
product prices
SUPPLY DEMAND
North American logistics build out
added efficiency and removed
Mid-Continent bottlenecks to move
crude to USGC
2
Expect ample supply to keep prices low, which should continue driving increased petroleum demand.
1 3
4
5

9
-0.8
-0.4
0.0
0.4
0.8
1.2
1.6
2.0
2013 2014 2015 2016E-2020E Avg
MMBPD Europe China Middle East Other Net CDU Capacity Additions World Petroleum Demand Growth
Source: Consultant and Valero estimates. Net Global Refinery
CDU Additions = New Capacity + Restarts – Announced
Closures. (Does not include Condensate Splitters.)
Global Petroleum Demand Growth Expected
to Outpace Refinery Capacity Expansion
Expected demand growth to be supportive of business for coming years.
However, the winds of change are blowing and 2020 forward could bring a return to “Golden Age” type margins.

10
Forecasted Margins
Heavy Sour Margins Light Sweet Margins
Heavy Sour Coking margins exceed the “Golden Age”. Light Sweet Cracking margins at historical high.
Margins driven by market disruptions from the low sulfur bunker fuel regulations.
The recent “boom” is insignificant compared to the potential of what is coming.
0
2
4
6
8
10
12
14
20
01
20
02
20
03
20
04
20
05
20
06
20
07
20
08
20
09
20
10
20
11
20
12
20
13
20
14
20
15
20
16
20
17
20
18
20
19
20
20
20
21
20
22
20
23
20
24
20
25
USGC Light Sweet Cracking Margin
Consultant Range Historical
0
5
10
15
20
25
30
35
20
01
20
02
20
03
20
04
20
05
20
06
20
07
20
08
20
09
20
10
20
11
20
12
20
13
20
14
20
15
20
16
20
17
20
18
20
19
20
20
20
21
20
22
20
23
20
24
20
25
USGC Heavy Sour Coking Margin
Consultant Range Historical

11
Global Marine Fuel Sulfur Cap, Is it Time to Worry?
Bunker Sulfur Limits
• The International Maritime
Organization (IMO)
regulation reduces sulfur in
bunker fuel from 3.5 wt.% to
0.5 wt.% or requires
installation of scrubbers to
remove SO2 from exhaust
gas. Rule to be
implemented in 2020.
Product Market Impact
• HSFO to bunker market is
around 3 MMBPD
• Shift of 2 MMBPD of diesel
into bunker market
• Shift of VGO and ULSR into
bunkers to produce ULSFO
• HSFO could move to coal
parity, $15/bbl
Shippers Options for Compliance
• Marine gasoil. Higher
priced fuel, simple to
manage
• Scrubbed HSFO. Shippers
are reluctant to invest, but,
scrubbers will eventually
penetrate the market
• ULSFO creates new market
• LNG, developing, but small
Crude Market Impact
• Sweet crude market
develops two tiers with a
higher priced tier for crudes
that produce ULSFO
• Sweet/Sour differentials
widen
• Resid imports will compete
with sour crude for available
conversion capacity
Compliance Level is the Great Unknown
• Main compliance option to
be marine gas oil
• Scale of penalties and
method of enforcement for
non-compliance unclear
• Availability of compliant fuel
in developing nations
• Potential exemptions
Impact on Refiners
• Heavy Sour Coking refiners
to be advantaged especially
on the USGC
• Marginal European
refineries given life line due
to increased diesel demand
• Sour refineries without resid
conversion capacity will be
challenged

12
Valero Well Positioned for Future
• Valero USGC refineries fit into one of the three
configuration categories shown in the table
• Typical refinery configurations for similar feed
stocks are also shown in the table
• Valero Sour Coking refineries produce little to no
fuel oil blend stock
• Valero light sweet refineries have the capability
to crack resid in FCC units. This greatly reduces
fuel oil yield relative to typical light sweet
cracking refineries
• Typical Medium Sour Cracking refinery produces
high yield of fuel oil
• High conversion capacity and complexity gives
Valero an advantage
No need to worry over low sulfur fuel oil regulations, if, refineries are high complexity.
Yields from Valero vs. Typical Refineries
Valero Sour
Coking, HCU,FCC
Valero Sour
Coking, FCC
Valero Light
Sweet Cracking
Typical Light
Sweet Cracking
Typical Medium
Sour Cracking
FEEDSTOCK PURCHASES
Light Sweet 0.0 0.0 100.0 100.0 0.0
Medium Sour 0.0 60.0 0.0 0.0 100.0
Heavy Sour 100.0 40.0 0.0 0.0 0.0
H2 (FOE) 3.7 2.2 2.4 0.6 1.5
Other 9.0 12.8 5.4 1.1 1.8
PRODUCT SALES
Gasoline 37.6 45.8 40.8 41.3 34.4
Distillates 58.0 47.9 39.2 44.3 35.4
LPG 6.1 6.1 5.4 4.0 3.9
FO/FO Blendstock 0.0 1.1 1.6 11.2 27.4
Coke (FOE) 11.4 7.7 0.0 0.0 0.0
Other 3.7 10.7 22.5 0.0 0.0

13
0
100
200
300
400
500
600
700
800
900
1000
2005 2006 2007 2008 2009 2010 2011 2012 2013 2014 2015 2016
Other
Europe
Other Latin America
Mexico
Canada
Gasoline Exports 12 Month
Moving Average (MBPD)
Gasoline represents all finished gasoline plus all blendstocks (including ethanol, MTBE, and other oxygenates)
Source: DOE Petroleum Supply Monthly data through November 2016.
Can U.S. Continue or Raise Exports and Compete

14
Source: DOE Petroleum Supply Monthly data through November 2016.
Can U.S. Continue or Raise Exports and Compete
0
200
400
600
800
1000
1200
1400
2005 2006 2007 2008 2009 2010 2011 2012 2013 2014 2015 2016
Other
Europe
Other Latin America
Mexico
Canada
Distillate Exports 12 Month
Moving Average (MBPD)

15
$2.55/mmBtu U.S.
$0.83/bbl
$4.73/mmBtu Europe
$1.54/bbl
Natural Gas Cost Sensitivity for Valero’s Refineries
U.S. Natural Gas Cost Provides Opex and
Feedstock Cost Advantages for US Refiners
Average annual natural gas prices for 2016 through December 30 for U.S. and Europe. Estimated per barrel cost of 912,000 mmBtu/day of natural gas
consumption at 93% refinery throughput capacity utilization, or 2.8 MMBPD.
$719 MM
pre-tax
annual cost
advantage
• As an example, Valero’s refining operations consume approximately 912,000 mmBtu/day of
natural gas, of which 57% is operating expense and balance is cost of goods sold
• Significant annual pre-tax cost savings compared to refiners in Europe
• Prices expected to remain low and disconnected from global oil and gas markets
USGC has an operating cost advantage.

16
USGC Location Facilitates Optimization of Product
Exports
Distillate
Gasoline
Mexico
Load Vsl Size $/bbl
USG LR1 base
NW Europe LR2 1.01
Saudi Arabia LR2 2.02
India LR2 2.54
S. Korea LR2 3.68
Chili
Load Vsl Size $/bbl
USG LR1 base
NW Europe LR2 0.15
S Korea LR2 0.2
India LR2 0.43
Saudi Arabia LR2 0.52
Columbia
Load Vsl Size $/bbl
USG LR1 base
NW Europe LR2 0.4
Saudi Arabia LR2 1.4
India LR2 1.93
S. Korea LR2 2.07
West Africa
Load Vsl Size $/bbl
USG LR2 base
NW Europe LR2 -0.41
Montreal
Load Vsl Size $/bbl
USG LR1 base
NW Europe LR1 0.02
New York Harbor
Load Vsl Size $/bbl
USG MR base
NW Europe MR -0.91
USGC has freight advantage to Mexico and Latin America.

17
U.S. Advantage to Export Products
• Access to low cost natural gas and abundant low
cost North American crudes lowers production costs
• Pipeline capacity additions have increased crude
optionality and resulted in improved pricing
• Refineries have the flexibility to process wide range
of crudes and feedstocks
• Proximity to growing product export markets in
Mexico and Latin America provides freight advantage
• Competitive refined products supplier to Eastern
Canada and Northwest Europe
69 124
246 324
119
251
447
541
2011 2012 2013 2014 2015 2016 CurrentCapacity
PotentialFuture
Capacity
VLO’s U.S. Product Exports (MBPD)
Gasoline Diesel
USGC Refineries have Lower Costs than
Alternative Suppliers in Europe into Product
Markets in Mexico and Latin America
18
How Have Refiners Adapted to Light Tight Oil
(LTO) Processing
WTI Bakken Eagle
Ford
Arab
Medium
Mars Maya Cold
Lake
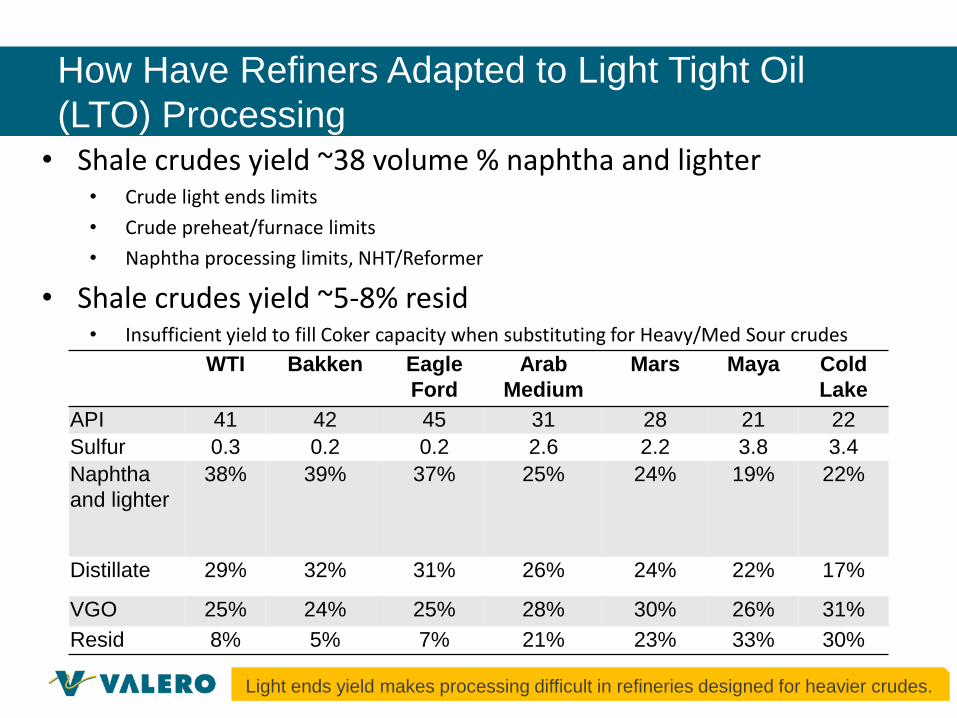
API 41 42 45 31 28 21 22
Sulfur 0.3 0.2 0.2 2.6 2.2 3.8 3.4
Naphtha
and lighter
38% 39% 37% 25% 24% 19% 22%
Distillate 29% 32% 31% 26% 24% 22% 17%
VGO 25% 24% 25% 28% 30% 26% 31%
Resid 8% 5% 7% 21% 23% 33% 30%
• Shale crudes yield ~38 volume % naphtha and lighter • Crude light ends limits
• Crude preheat/furnace limits
• Naphtha processing limits, NHT/Reformer
• Shale crudes yield ~5-8% resid • Insufficient yield to fill Coker capacity when substituting for Heavy/Med Sour crudes
Light ends yield makes processing difficult in refineries designed for heavier crudes.

19
Valero’s Flexibility to Adapt Crude Diet
• As an example, before the shale boom, domestic sweet processing was 19% of crude diet,
mainly at mid-continent refineries.
• At the height of the shale boom, domestic light sweet processing increased to 44% of crude
diet. This includes the addition of the Crude Toppers at Corpus and Houston, plus
maximum processing of domestic sweet crude at heavy refineries.
• Post shale boom, domestic light sweet removed from heavy refineries and replaced with
medium sour. Foreign sweet replaces domestic sweet in some sweet crude units.
44%
19%
11%
15%
6% 5%
Shale Boom
Domestic Sweet Medium Sour Foreign Sweet
S. America Residuals Cand. Heavy
32%
25%
18%
13%
7% 5%
Post Shale Boom
Domestic Sweet Medium Sour Foreign Sweet
S. America Residuals Cand. Heavy
19%
32% 24%
16%
7% 2%
Pre Shale Boom
Domestic Sweet Medium Sour Foreign Sweet
S. America Residuals Cand. Heavy
20
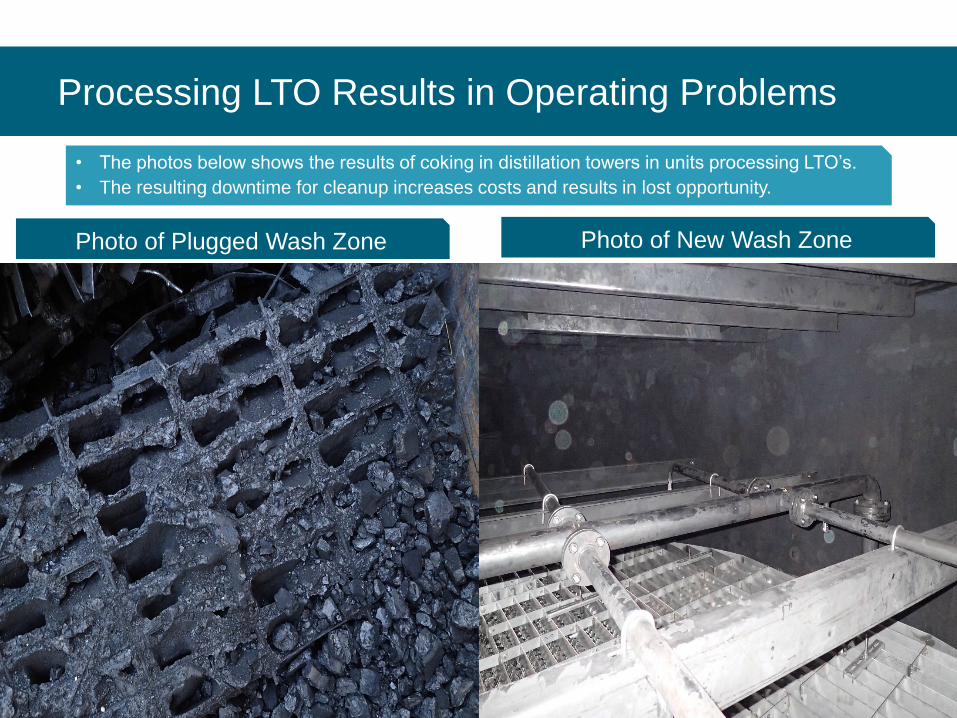
Processing LTO Results in Operating Problems
• The photos below shows the results of coking in distillation towers in units processing LTO’s.
• The resulting downtime for cleanup increases costs and results in lost opportunity.
Placeholder for Coking Photos
Photo of Plugged Wash Zone Photo of New Wash Zone

21
Processing LTO Results in Operating Problems
• The photos below show the results of fouling in distillation towers in units processing LTO’s.
• The resulting downtime for cleanup increases costs and results in lost opportunity.
Placeholder for Coking Photos
Photo of Fouled Tray Photo of Cleaned Tray

22
Photos of Eagle Ford Crude Receipts
• Variations in crude quality make predicting
yields and income from refining operations
challenging.
• API gravity and sulfur are not the only qualities
of interest to refiners.
• Distillation specifications are becoming more
prevalent as well as con carbon, metals, and
acid number.