platform for agricultural risk management...platform for agricultural risk management crop pests and...
TRANSCRIPT


Platform for Agricultural Risk Management
Crop pests and disease management in Uganda: status and investment needs FINAL REPORT November, 2016
Study conducted by
Delivered by:
M. Kansiime, J. Mulema, D. Karanja, D. Romney and R. Day
Uganda

Full Report | October 2016 3
Platfo
rm fo
r Agricu
ltural R
isk M
anagem
ent | C
rop
pests an
d d
isease man
agemen
t in U
gand
a: status an
d in
vestmen
t need
s
3/141
Table of contents
Table of content .......................................................................................................... 3
Foreword ..................................................................................................................... 6
List of Tables............................................................................................................... 7
List of Figures ............................................................................................................. 8
Acronyms and abbreviations ..................................................................................... 9
Executive Summary .................................................................................................. 11
Scope .......................................................................................................................................................... 11 Rationale ..................................................................................................................................................... 11 Pest risk in Uganda and root causes .......................................................................................................... 11 Policies and institutional frameworks for pest management ....................................................................... 11 Extension approaches ................................................................................................................................ 12 Potential of ICTs ......................................................................................................................................... 12 Investment plan........................................................................................................................................... 12 Implementation ........................................................................................................................................... 13 Financing the strategy ................................................................................................................................. 13 Monitoring and Evaluation .......................................................................................................................... 14 Graphical summary ..................................................................................................................................... 15
1. Introduction and rationale ................................................................................. 16
1.1 Background to the study and rationale ............................................................................................... 16 1.1.1 Importance of agriculture ............................................................................................................. 16 1.1.2 Farming systems and agricultural development .......................................................................... 16 1.1.3 Pests and disease risk in Uganda (overview) .............................................................................. 17 1.1.4 Pest and disease risk management - rationale ........................................................................... 18 1.2 Objective of the study .................................................................................................................... 19
1.3 Approach ............................................................................................................................................ 19 1.3.1 Data sources and collection methods .......................................................................................... 19 1.3.2 Data analysis and presentation ................................................................................................... 20 1.3.3 Data validation ............................................................................................................................ 20
2. Root causes for plant pest and disease risk in Uganda ................................. 21
2.1 Overview of value chains and geographic distribution ....................................................................... 21 2.1.1 Coffee .......................................................................................................................................... 21 2.1.2 Banana ....................................................................................................................................... 21 2.1.3 Cotton ......................................................................................................................................... 22 2.1.4 Cassava ...................................................................................................................................... 22 2.1.5 Maize .......................................................................................................................................... 23 2.1.6 Rice ............................................................................................................................................. 23 2.1.7 Beans .......................................................................................................................................... 23 2.1.8 Potato ......................................................................................................................................... 24 2.1.9 Fruits and vegetables .................................................................................................................. 24
2.2 Pests and diseases affecting key value chains .................................................................................. 24 2.2.1 Coffee ......................................................................................................................................... 24 2.2.2 Banana ....................................................................................................................................... 25 2.2.3 Cotton ......................................................................................................................................... 25 2.2.4 Cassava ..................................................................................................................................... 25 2.2.5 Maize .......................................................................................................................................... 26 2.2.6 Rice ............................................................................................................................................ 26 2.2.7 Beans ......................................................................................................................................... 26 2.2.8 Potato ......................................................................................................................................... 27

Platform for Agricultural Risk Management | Crop pests and disease management in Uganda: status and investment needs
4
Full Report | October 2016
2.2.9 Fruits and vegetables ................................................................................................................. 27 2.3. Root causes for the pests not being effectively controlled ................................................................ 31
2.3.1 New pests spread ....................................................................................................................... 31 2.3.2 Poor farm level management ..................................................................................................... 32 2.3.3 Counterfeit chemicals ................................................................................................................. 34 2.3.4 Poor quality seed ........................................................................................................................ 34 2.3.5 Poor farm level soil fertility and nutrient management ................................................................ 36 2.3.6 Other factors ............................................................................................................................... 36 2.4 Current pest management options ................................................................................................ 40
3. Legal and institutional framework for pest management ............................... 43
3.1 Relevant legal documents ................................................................................................................. 43 3.1.1 National Development Plan ........................................................................................................ 43 3.1.2 National Agricultural Policy (NAP) 2013 ..................................................................................... 44 3.1.3 Agriculture Sector Strategic Plan (ASSP) .................................................................................. 44 3.1.4 The Plant Protection and Health Act, 2016 ................................................................................ 47 3.1.5 The Agricultural Chemicals (Control Act) 2006 .......................................................................... 50 3.1.6 The Seeds and Plant Act 2006 .................................................................................................. 50 3.1.7 Biosafety and biotechnology bill 2012 ......................................................................................... 51
3.2 Stakeholders ..................................................................................................................................... 51 3.2.1 MAAIF ......................................................................................................................................... 51 3.2.2 Department of Crop Protection (DCP) ....................................................................................... 52 3.2.3 Research ................................................................................................................................... 52 3.2.4 Education .................................................................................................................................. 53 3.2.5 Local Government ..................................................................................................................... 53 3.2.6 Private sector actors and value chain actors ............................................................................. 54 3.2.6.1 Input providers ............................................................................................................................ 54 3.2.6.2 Producers ................................................................................................................................... 54 3.2.6.3 Traders and processors .............................................................................................................. 55 3.2.6.4 Farmers associations ................................................................................................................. 55 3.2.7 Dissemination/information service providers .............................................................................. 55 3.2.8 Donors ........................................................................................................................................ 56
3.3 Issues related to the legal and institutional framework ..................................................................... 57 3.3.1 Crop protection and sustainable intensification .......................................................................... 57 3.3.2 Pesticide policy .......................................................................................................................... 58 3.3.3 Pesticide registration ................................................................................................................. 58 3.3.4 Integrated Pest Management (IPM) .......................................................................................... 59 3.3.5 Clarification of MAAIF Departments’ responsibilities ................................................................. 60 3.3.6 Public private partnership .......................................................................................................... 60 3.3.8 Plant biosecurity planning .......................................................................................................... 61
3.4 Summary and recommendations for pest management .................................................................... 61
4. Cost-benefit and sustainability of pest management initiatives ..................... 62
4.1 Introduction ........................................................................................................................................ 62 4.2 Initiatives involved in agro-advisory services and approaches used ................................................. 62
4.2.1 Intensive interpersonal interactions ............................................................................................. 63 4.2.2 Moderately intensive interpersonal interactions .......................................................................... 64 4.2.3 Mass media ................................................................................................................................ 67 4.2.4 Private sector led approaches .................................................................................................... 68
4.3 Regional initiatives for pest management .......................................................................................... 69 4. 4 Pest management technologies in Uganda ...................................................................................... 70 4. 5 Cost efficiency of extension methods ............................................................................................... 73
4.5.1 Cost ingredients of extension approaches .................................................................................. 74 4.5.2 Cost per farmer for different extension approaches ................................................................... 75 4.5.3 Cost efficiency of extension approaches using estimated adoption rates ................................. 77 4.5.4 Speed of information spread ..................................................................................................... 78
4.6 Summary and recommendations for pest management .................................................................... 79
5 Potential to promote information technologies for pest management ........... 80
5.1 Introduction ........................................................................................................................................ 80 5.2 Potential of mobile in delivery of agricultural services........................................................................ 80 5.3 Potential for information technology in data collection and sharing .................................................. 81
Platform for Agricultural Risk Management | Crop pests and disease management in Uganda: status and investment needs
5
Full Report | October 2016
5.4 Potential for information technology to track and monitor pests ........................................................ 82 5.4.1 Current pest monitoring systems ............................................................................................... 82 5.4.2 Current use of ICT for pest monitoring ...................................................................................... 82 5.4.3 Integration of pest monitoring with new online statistics system ................................................ 83
5.5 Summary and recommendations for ICT ........................................................................................... 84
6 Sustainable pest management – Investment strategy ..................................... 85
6.1 Introduction ........................................................................................................................................ 85 6.2 Intervention areas ................................................................................................................................. 87 6.3 Investment plan ................................................................................................................................. 89
6.3.1 Goal ............................................................................................................................................ 89 6.3.2 Development Objective .............................................................................................................. 89 6.3.3 Strategic Outcomes .................................................................................................................... 89 6.3.4 Priority interventions and cost implications ................................................................................. 90 Strategic Outcome 1: Effective pest information system established ..................................................... 90 Strategic Outcome 2: Improved access to pest management services .................................................. 96 Strategic Outcome 3: Strengthened capacity to monitor and combat pests and diseases ................... 100 6.3.5 Logical framework .................................................................................................................... 106
6.4 Budget summary by result and activity ............................................................................................ 108 6.5 Work plan ........................................................................................................................................ 112 6.6 Partnerships for sustainable implementation ................................................................................... 115
6.6.1 Partnerships .............................................................................................................................. 115 6.6.2 Financing the investment strategy ............................................................................................ 115 6.6.3 Way forward ............................................................................................................................. 116
References .............................................................................................................. 118
Appendices ............................................................................................................. 126
Appendix 1: Overview of some of intitiatives in Uganda using ICT to support initiatives/provide services. Some of information is sourced from a meeting with ICT4AG actors run by Plantwise in July, with additional information from a review of the literature ................................................................................. 126 Appendix 2: List of Key Informants ........................................................................................................... 131 Appendix 3: Crop queries from Ugandan clinics illustrating main crops brought to clinics in different regions and difference between men and women ................................................................................................. 134 Appendix 4: Detailed budget .................................................................................................................... 136
Platform for Agricultural Risk Management | Crop pests and disease management in Uganda: status and investment needs
6
Full Report | October 2016
Foreword

Platform for Agricultural Risk Management | Crop pests and disease management in Uganda: status and investment needs
7
Full Report | October 2016
List of Tables
Tabella 1: Some estimates of economic losses in Uganda for specific pests ............................................ 19
Tabella 2: Summary of key pests and diseases of key value chains in Uganda, their distribution and
economic losses ......................................................................................................................................... 28
Tabella 3: Major crop pests and diseases in Uganda and available management options ........................ 40
Tabella 4: Interventions under the Agriculture Objective in the NDPll ........................................................ 43
Tabella 5: Extract of ASSP Budget (NDPII constrained version) covering crop and livestock pests and
diseases (figures in UGX billions) ............................................................................................................... 46
Tabella 6: Extract of ASSP Budget (NDPll constrained version) showing additional budgets related to crop
and livestock pests and disease (figures in UGX billions) ........................................................................... 47
Tabella 7: Some definitions from the IPPC Glossary and the Plant Protection and Health Act .................. 48
Tabella 8: Factors encouraging pesticide use (Waibel, 1991) .................................................................... 58
Tabella 9: Some changes envisaged by ASSP that have implications for pest management .................... 59
Tabella 10: Typology of pest management practices from a communication’s perspective ....................... 72
Tabella 11: Cost ingredients associated with selected extension approach ............................................... 74
Tabella 12: Variable costs associated with administration of extension methods ...................................... 75
Tabella 13: Cost efficiency estimates for various extension methods ........................................................ 77
Tabella 14: Literacy and media usage key figures ..................................................................................... 80
Tabella 15: Roles of key stakeholder groups in implementing actions from prevention to control and costs
incurred by the different groups .................................................................................................................. 86
Tabella 16: Priority crops under the ASSP, their production and market arrangements and key
stakeholders................................................................................................................................................ 88
Tabella 17: Recommended time allocation to different interpersonal extension methods .......................... 97
Tabella 18: Priority skills and areas of knowledge for training DCP staff ................................................. 104
Tabella 19: Logical framework ................................................................................................................. 107

Platform for Agricultural Risk Management | Crop pests and disease management in Uganda: status and investment needs
8
Full Report | October 2016
List of Figures
Figura 1: Agricultural production zones in Uganda .................................................................................... 17
Figura 2: Root causes contributing to the spread of pests and diseases ................................................... 38
Figura 3: Root causes associated with poor farm level management of pests and diseases. ................... 39
Figura 4: Structure of the Department of Crop Protection .......................................................................... 52
Figura 5: Possible trajectories of crop intensification under ASSP. A: unsustainable intensification. B:
sustainable intensification ........................................................................................................................... 58
Figura 6: Tradeoff of different extension approaches based on desired reach and impact ........................ 62
Figura 7: Pest invasion curve and actions at different stages .................................................................... 85
Platform for Agricultural Risk Management | Crop pests and disease management in Uganda: status and investment needs
9
Full Report | October 2016
Acronyms and abbreviations
AAPBP Australia-Africa Plant Biosecurity Partnership
ACTED Agency for Technical Cooperation and Development
AGINSBA Agricultural Innovation System Brokerage Association
AGRA Alliance for a Green Revolution In Africa
ASARECA Association for Strengthening Agricultural Research in East and Central Africa
ASDP Agriculture Sector Development Paper
ASHC Africa Soil Health Consortium
ASIS Agricultural Statistics and Information System
ASSP Agricultural Sector Strategic Plan
ATI Agricultural Training Institutes
BXW Banana Xanthomonas Wilt
CAADP Comprehensive African Agricultural Development Programme
CABI Centre for Agricultural Biosciences International
CBSD Cassava Brown Streak Disease
CDO Cotton Development Organisation
CGIAR Consultative Group on International Agricultural Research
CKW Community Knowledge Workers
CMD Cassava Mosaic Disease
COMESA Common Markets for Eastern And Southern Africa
CWD Coffee Wilt Disease
DCP Department of Crop Protection
EAC East African Community
EAHB East African Highland Banana
FAO Food and Agriculture Organisation of the United Nations
FEWSNET Famine Early Warning System Network
FFS Farmer Field Schools
FIP Framework Implementation Plan
FRI Farm Radio International
GDP Gross Domestic Product
GPC Global Plant Clinic
ICT Information Communication and Technology
ICT4AG Information Communication and Technology for Agriculture
IFAD International Fund for Agricultural Development
IPM Integrated Pest Management
IPM-CRS Integrated Pest Management - Collaborative Research Support Program
IPPC International Plant Protection Convention
ISSD Integrated Seed Sector Development

Platform for Agricultural Risk Management | Crop pests and disease management in Uganda: status and investment needs
10
Full Report | October 2016
LG Local Government
MAAIF Ministry of Agriculture, Animal Industry and Fisheries
MADDO Masaka Diocese Development Organisation
MLND Maize Lethal Necrosis Disease
MNOs Mobile Network Operators
NAADS National Agricultural Advisory Services
NaCRRI National Crop Resources Research Institute
NAP National Agricultural Policy
NARI National Agricultural Research Institute
NARL National Agricultural Research Laboratories
NARO National Agricultural Research Organisation
NARS National Agricultural Research System
NDA National Drug Authority
NDL National Diagnostic Laboratory
NDP National Development Plan
NGO Non-Government Organisation
NPPO National Plant Protection Organisation
PARM Platform for Agricultural Risk Management
SHA Self Help Africa
SMS Short Message Service
SNF Safe Neighborhood Foundation
SOCADIDO Soroti Catholic Diocese Integrated Development Organization
SPS Sanitary and Phytosanitary
SQMT Quality Assurance, Metrology and Testing
UBOS Uganda Bureau of Standards
UCDA Uganda Coffee Development Authority
UNADA Uganda National Agro-input Dealers Association
UNFFE Uganda National Farmers Federation
UNMA Uganda National Meterological Authority
URA Uganda Revenue Authority
USAID United States Agency for International Development
USTA Uganda Seed Trade Association
VAS Value Added Service
WTO World Trade Organisation
ZARDI Zonal Agricultural Research and Development Institute

Platform for Agricultural Risk Management | Crop pests and disease management in Uganda: status and investment needs
11
Full Report | October 2016
Executive Summary
Scope This paper presents results of two key elements. The first element is the analysis that aimed to
understand; (a) the root causes for plant pest and disease risk in Uganda, (b) the legal and institutional
framework for pest management in Uganda and its key actors, (c) cost-benefit and sustainability of existing
and planned initiatives related to pest management, and (d) the potential for further promoting information
technologies/applications for pest management. Using results from the analytical part, a feasibility
assessment is undertaken as well as an investment plant for pest management in Uganda.
Rationale The agricultural sector, provides approximately 24 % of the Uganda Gross Domestic Product (GDP),
generates nearly 48% of export earnings, and provides direct and indirect livelihood support for over 80%
of the total households. As such, the government has developed implementation frameworks to further
develop the sector. Strategic activities aim to increase production and productivity in the sector and
stimulate export. The ASSP targets US$4bn agricultural export by 2019/20 (from the current US$1.3bn), of
which about 73% is from crops. However, crop farming largely remains risky due to presence of biotic and
abiotic factors. Annual crop losses in Uganda are estimated at USh 2 trillion - 2.6 trillion (equivalent to
USD 606 - 804 million) per year, which is approximately 61% of current export value and 14% of total
annual GDP. Losses due to pests and diseases are estimated at 10%-20% during pre-harvest and 20%-
30% during post-harvest reaching 100% for perishable and export crops. The threat pests and diseases
particularly pause for agricultural export and food security warrants concerted efforts.
Pest risk in Uganda and root causes There are currently different scenarios for pest risk in Uganda: 1) pests already permanently present in
Uganda (endemic), that cause losses every season unless managed; 2) pests present at low levels but for
which occasionally resurgence may occur leading to serious crop losses e.g. cassava mealy bug and; 3)
Pests new to the country e.g. Maize lethal necrosis disease (MLND) that on arrival have the potential to
suddenly cause very high losses. Pest spread and potential economic impact depends on various factors
including: the value chain affected; geographical location;management practices available at farm level
and; whether the pest is introduced or endemic. Key factors contributing to spread of new pests were
inadequate internal controls and limited enforcement of material movement regulations. Border control is
largely inadequate with just 5 out of 30 gazetted border points manned. On the other hand, outbreaks may
go unnoticed due to lack of information on these pests to inform decision making. Spread of endemic pests
was attributed to limited farmer awareness on solutions, limited extension support, lack of practical
solutions, and counterfeit or poor quality inputs (particularly chemicals and seed).
Policies and institutional frameworks for pest management The policy and legal framework for pest management in Uganda is satisfactory, particularly with the recent
Plant Protection and Health Act that aligns the role of DCP with the responsibilities of an NPPO in regard
to preventing the introduction of new pests. Other key functions required for effective pest management
(particularly for pests that are already widespread) are well spelled out in various other items of legislation.
It is important that regulations that currently exist or are in draft are properly aligned to the Acts. However,
an institutional framework is only fully adequate if it can be implemented. DCP and other stakeholders
currently do not have sufficient capacity for implementation, monitoring and where necessary enforcing
regulations. The proportion of the ASSP budget allocated to crop protection is relatively small, and not
adequate for the substantial increase of capacity required. The proposed split of DCP to establish new
Departments of Crop Inspection and Certification (DCIC) and Entomology, needs to be resolved. Majority
of stakeholders were uncertain as to its merit, therefore we recommend it stays as one department, but
with internal re-organisation. One aspect of the re-organisation would be to better equip DCP to develop

Platform for Agricultural Risk Management | Crop pests and disease management in Uganda: status and investment needs
12
Full Report | October 2016
and maintain effective partnerships and relationships with its many stakeholders, including the private
sector. The envisaged commercialization of agriculture in Uganda risks an increase in unsustainable
activities (such as the use of pesticides). It is essential that the policy framework is strengthened to
counter this risk. In particular Integrated Pest Management (IPM) needs to be strongly promoted and
encouraged by all means, including through policy, regulation and strategies. It is currently more or less
absent from the ASSP.
Extension approaches Several extension approaches have been used by stakeholders in Uganda. They range from intensive
face to face approaches e.g. extension agent visits, to less intensive mass media approaches. This
presents a trade-off between reaching large numbers of farmers and achieving levels of understanding for
farmers that allows them to adopt recommendations. Low intensity and mass media approaches can reach
large numbers at low cost but are probably not suited to clearly getting across a complex message. High
intensity interactions are more likely to lead to adoption of complex approaches – but this means that
relatively few farmers can be reached.
Uganda government is already committed to staffing a single spine extension system that will put
extension staff at sub-county level across the country. However, it is inevitable that staff will still have
large numbers of farmers in their catchment areas. Extension staff plans should ideally embed different
methods and approaches that use their time most efficiently and at the same time leverage contributions
from other service providers including village based intermediaries and value chain stakeholders. To be
effective extension staff as well as other intermediaries need to be well trained and equipped with various
dissemination approaches / tools that they can employ depending on the nature of the message they
intend to disseminate. Continued collaboration with academia to facilitate inclusion of new methods into
curricula would contribute to capacity building.
Potential of ICTs There is potential to build on the ICT based initiatives that are on-going in the country. Currently all rely
directly or indirectly on donor support. Centralized collection of farmer profiles by government in a
database that could be accessed by businesses could encourage private sector investment in sustainable
services. Potential for integrating pest monitoring data in the online agricultural statistics and information
system (ASIS) was not clear – and there may be sensitivities. However, this would be a good opportunity if
effective working arrangements could be established. A strategically placed network of plant clinics
operated by plant doctors using tablets to collect data, integrated into the working practice of government
extension, could form the basis of a pest monitoring system as well as extending demand led advisory
services. Data collected at clinics could be complemented by pest observation data collected by any
extension officer at any place or time and sent electronically using a common form. To be sustainable
clinics would need to be institutionalized with a customized data collection and management approach
developed that is streamlined and tailored to national system.
Investment plan The proposed investment plan takes into cognizance the existing plans and efforts by MAAIF to address
pest problems in the country. As such, the plan focuses on areas deemed key for investment in the
medium term to ensure establishment of sustainable pest management systems.
Goal: The goal of this investment plan is: Crop losses due to pests and diseases reduced, leading to
increased production and productivity of key crops, and increased household level incomes for smallholder
farmers
Development Objective: In the medium term, the investment plan aims to strengthen capacity of
agricultural institutions to establish sustainable pest management systems and structures for effective pest
management. This includes the policies, frameworks and coordination mechanisms used by institutions to
Platform for Agricultural Risk Management | Crop pests and disease management in Uganda: status and investment needs
13
Full Report | October 2016
inform actions to reduce crop losses.
Strategic Outcomes: The proposed investment plan is presented as a set of outputs and activities under
three components or strategic outcomes:
1. Cost-efficient information systems to detect and monitor plant pests and diseases established,
providing timely information to MAAIF (and other relevant stakeholders) to effectively respond to pest
situations;
2. Improved access to pest management services by smallholder farmers and other value chain actors to
effectively manage plant pests and diseases;
3. Strengthened capacity of MAAIF (and other relevant stakeholders) to monitor, analyse and combat the
threat of plant pests and diseases.
Strategic Outcome 1: Effective pest information system established: This strategic outcome covers
activities that largely address root causes contributing to the introduction and spread of new pests.
Proposed interventions areas under this outcome are; i) Operationalisation of emergency pest response
plans, ii) Effective pest monitoring at borders points decreasing risk of new pest incursions and, iii)
Establishment of pest surveillance system providing early warning including establishment of plant clinics
to be run by sub-county extension staff that will also provide advisory services to farmers.
Strategic Outcome 2: Improved access to pest management services: This outcome covers activities that
address the root causes of poor farm level. Considerations are also made to ensure promotion of
sustainable models to reach out to farmers with pest management services. Two priority interventions are
proposed; i) Improving farmer awareness of pest and disease management, achieved through a variety of
activities including the use of mass media, and ii) Improving access to high quality inputs (crop protection
products and seed).
Strategic Outcome 3: Strengthened capacity to monitor and combat pests and diseases: The main focus of
capacity development recommended here is in relation to monitoring and combating pests and diseases,
including implementation of a pest information system. As DCP is also mandated to regulate various inputs
important in pest management, capacity development in those areas is also proposed. Training district and
sub-county extension staff to run plant clinics and collect and manage data is also required. Based on this,
two priority intervention areas are proposed; i) Reviewing of DCP structure and staff training, and ii)
Improving infrastructure for pest and disease management including refurbishing and maintaining
laboratories and greenhouse facilities
Implementation The investment strategy has made clear that multiple stakeholders will be involved in implementation. The
main categories of stakeholders and their roles have been described in relation to prevention and control
of pests at different stages of invasion. MAAIF has a key role to play, as provided for in the legal and
institutional framework. This role involves providing national leadership in addressing crop pest and
disease risks; implementing specific activities (especially those delivering public goods); coordinating,
guiding and overseeing the inputs of the various stakeholders; and facilitating and managing the different
partnerships entailed. The importance of establishing and maintaining effective partnerships is reflected in
the recommendation that a new positon is created in DCP for partnership management.
Partnerships also need to be established with other government ministries, department and agencies in
order to ensure implementation of actions that are complementary to pest management such as extension
services, diagnostic services and chemical regulation. Other actors, particularly the private sector, have
key roles to play and DCP should ensure that their interventions are dovetailed with the overall strategy as
far as possible, and that different actors’ interventions are complementary rather than duplicative or
contradictory.
Financing the strategy
Platform for Agricultural Risk Management | Crop pests and disease management in Uganda: status and investment needs
14
Full Report | October 2016
The case budget has been estimated at USD 30,573,120 for a five year investment. Finance for the
investment strategy is likely to come from a variety of sources. Some elements of the strategy may be
implemented as externally funded independent projects, so efforts should be made to embed such projects
within the overall strategy, particularly those that are still at the planning stage. With many of the activities
being for the public good, government is expected to be the primary financier, particularly for recurring
activities. A number of the required investments are one-time capital expenses or activities necessary to
upgrade the capacity of DCP to fulfil the expanded and enhanced role required. Such investments would
be appropriate for an external financier, with a long term impact to be expected from the short term
investment.
As part of implementing the strategy, opportunities for cost recovery should be identified, and for public
sector bodies be included in regulations where necessary. For example, fees can be levied for services
that benefit specific private sector stakeholders, such as import risk analyses, input (pesticide and seeds)
registration procedures, phytosanitary export certification, inspections at farms or packhouses. A number
of such fees are already levied, so the fee rates should be reviewed. However, a more important issue
may be the retention of such fees by the appropriate agency, provided it is used within the context of good
regulatory practice.
Apart from the payment of fees, private sector actors can also be expected to support the strategy
especially as it relates to commodity value chains that are well organised and generating substantial
foreign export earnings. Such finance would support their activities and involvement in the implementation
of the plan. Another specific area in which private sector funding could be expected is in the
implementation of emergency responses. Emergency response plans should detail, as far as possible, not
only who does what in the event of an emergency, but how it will be financed by the various stakeholders.
Monitoring and Evaluation This strategy is presented as a specific and measurable description of change that forms the basis for
planning, ongoing decision making and evaluation. It defines the building blocks required to bring about
the desired goal, as well as assumptions to address the major underlying causes / barriers to effective pest
management. As such, monitoring and evaluation need be carried out in view of expected change as
opposed to completed actions. To guide this process, a set of performance indicators has been developed
to measure the achievement of this strategy. In order to be adequately institutionalized, performance
indicators under this strategy should be integrated into the MAAIF M&E framework and monitored
regularly. An amount of $700,000 annually is included to cover the costs of M&E for the investment.
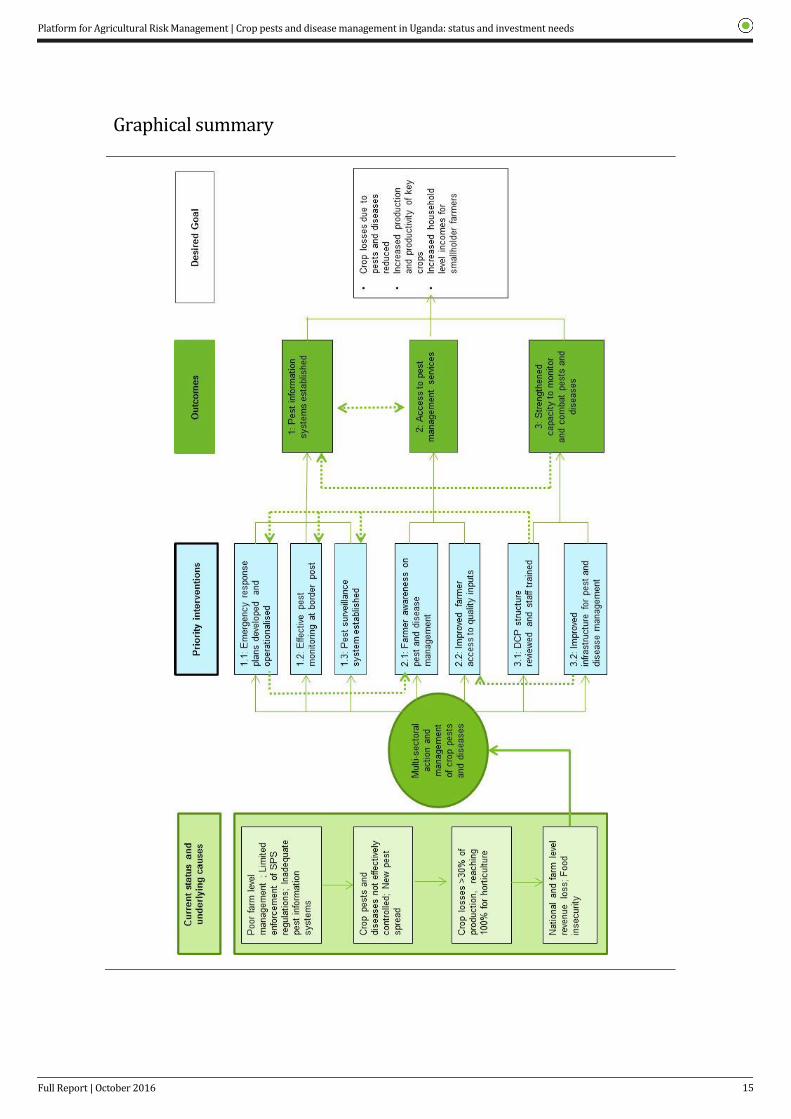
The graphical summary below shows the causal pathway of change as described in this strategic plan. It
shows the underlying causes of the problem, priority interventions and inter-relationships between various
interventions for achievement of the desired goal.
Platform for Agricultural Risk Management | Crop pests and disease management in Uganda: status and investment needs
15
Full Report | October 2016
Graphical summary

Platform for Agricultural Risk Management | Crop pests and disease management in Uganda: status and investment needs
16
Full Report | October 2016
1. Introduction and rationale
1.1 Background to the study and rationale
1.1.1 Importance of agriculture
Uganda has an estimated total population of 34.6 million (51% female) and an annual population growth
rate of 3.2%, making it one of the fastest growing populations in the world (UBOS, 2016; ICEIDA, 2014).
There are approximately 7.3 million households countrywide with the majority of the households (75%)
living in rural areas (UBOS, 2016). The country has a very young population, with 55% of the population
being below the age of 18 years and youths (persons 18 – 30 years) constituting 23% of the total
population (UBOS, 2016). Administratively, Uganda consists of 116 districts including Kampala City
following the creation of 4 additional districts on 1st July 2016. The districts are further sub-divided into
Counties, Sub-counties and Parishes. The role of these administrative units is to implement and monitor
government programmes at the respective levels. Over time, there has been subdivision of the
administrative units with the aim of easing administration and improving the delivery of services (UBOS,
2016).
The agricultural sector, the mainstay of the economy of Uganda, provides approximately 24 % of the
Gross Domestic Product (GDP), generates nearly 48% of export earnings, provides direct and indirect
livelihood support for over 80% of the total households, and supply he bulk of the raw materials used by
the domestic industry (UBOS, 2016). The 2014 Ugandan household and population census revealed that
approximately two-thirds (69%) of the working population are engaged in subsistence agriculture. The
government of Uganda identifies agriculture as a vital growth sector capable of reducing poverty and
stimulating economic growth. The key focus is on increasing production and productivity, improving
household food security, increasing farmers’ income and increasing the value of exports.
1.1.2 Farming systems and agricultural development
Farming systems in Uganda cover a wide range of activities including the production of cash and food
crops and keeping livestock (cattle, sheep, goats, pigs and poultry). Major crops grown include; bananas
and coffee, often intercropped with a wide range of annual crops (maize, cassava, sweet potatoes,
cocoyam and beans). Farming systems are mainly determined by the rainfall pattern i.e. the total amount
per year and the distribution, which determines the production potential of the area and crops grown
(Osiru, 2006). There is a distinct spatial specialization in the production of perennial and annual crops.
Perennial crops are associated with areas of high annual rainfall (1000-2100mm) and a less pronounced
dry season. In areas of lower annual rainfall (500-1000mm) and prolonged dry season (especially the
north, north east and west Nile), the main farming activities involve the production of annual crops such as
finger millet, sorghum, maize, cassava, sweet potatoes, simsim, pigeon peas, groundnuts, beans and
cowpeas.
Ministry of Agriculture, Animal Industry and Fisheries, through the agricultural zoning strategy 2004 divided
the country into 10 production zones (Figure 1.1). The zoning is aimed at increasing household incomes
through sustainable and profitable zonal agricultural products for export. An “agricultural production zone”
is defined as an area with similar socio-economic characteristics and where ecological conditions, farming
systems and practices are fairly homogeneous. It is assumed that a unique agricultural production zone
has common crops and livestock types. Zones may cut across districts. Subsequently government of
Uganda and MAAIF planning for agricultural development has largely been based on these production
zones. In each of the zones, there is a Zonal Agricultural Research Institute (ZARDI), under the N
ational Agricultural Research Organisation (NARO), supporting research and development of zone specific
or relevant technologies

Platform for Agricultural Risk Management | Crop pests and disease management in Uganda: status and investment needs
17
Full Report | October 2016
Figura 1: Agricultural production zones in Uganda
Source: Adapted from MAAIF, 2010
1.1.3 Pests and disease risk in Uganda (overview)
Danielsen et al. (2014) notes: “Like most African countries, Uganda is ill equipped to safeguard crops
against existing and emerging pest and disease risks associated with climate change, increasing
globalisation and human mobility. Diagnostic services, for example, are scarce and poorly coordinated.”
Also that “Public crop protection measures are mainly restricted to border control and sporadic field
inspections with hardly any services to deal with farmers’ day-to-day crop health problems. There is a
pervasive feeling among Ugandan extension organisations and line ministry officials that farmers have
been abandoned in their struggle against an escalating plant pest and disease burden”. Meanwhile,
Kroschel et al. (2014) noted “Major pest and disease outbreaks create shocks at local and larger scales
and erode resilience of farming systems, perpetuating and deepening poverty. Such events are
characterised by weak phytosanitary capacity in pest and disease risk analysis, diagnostics, surveillance
and control and policy interventions. This predisposition is projected to become more acute under
scenarios of climate change, increased trade, human movement and due to intensified agriculture to meet
demand for food and feed from an increasing population.”
Various stakeholders in Uganda, including researchers, argue that changes in weather patterns including
drought, unpredictable and varied rains and temperature changes are causing alterations in the
appearance and severity of newer pests e.g. black twig borer (Xylosandrus compactus (Eichhoff)). In

Platform for Agricultural Risk Management | Crop pests and disease management in Uganda: status and investment needs
18
Full Report | October 2016
addition, existing diseases are migrating to ecological zones where previously they did not exist. For
example, coffee leaf rust (Hemileia vastatrix), traditionally limited to higher elevations, is now appearing at
all elevations, whereas stem and bean borers are moving up to higher altitudes. Although credible data on
the levels and spread of these diseases and pests is not available, the potential risk cannot be
underestimated. The outbreak of Coffee Wilt Disease (CWD) (Gibberella xylarioides) in 1990s, for
example, destroyed more than 10 million Robusta coffee trees countrywide, in a period of less than 20
years, making the country lose billions of shillings.
The pests and disease problem is exacerbated by limited resources for research and extension in Uganda.
The inability to identify and monitor infestations in a timely manner, insufficient research capacity to
evaluate and respond to problems, insufficient extension services to promote good agricultural control
practices, and limited access to inputs suggest that the sector is presently not sufficiently prepared to
address pest and disease risks in an effective manner that would adequately mitigate potential losses.
1.1.4 Pest and disease risk management - rationale
Development of an appropriate risk management strategy for pest and disease requires proper
identification, assessment and prioritisation of risks. Depending on the nature or severity of the risk, a
single or combination of different management strategies is required to mitigate the economic, social and
environmental impacts of the pest and of the management methods. This approach is termed integrated
pest management (IPM). FAO (2014) defines IPM as “Careful consideration of all available pest control
techniques and subsequent integration of appropriate measures that discourage the development of pest
populations and keep plant protection products and other interventions to levels that are economically
justified and reduce or minimise risks to human health and the environment”. Farmers also require early
warning on likelihood of pest and disease outbreaks, as well as advice (extension service) that would
enable them select the most effective and economical risk management option. The specific IPM methods
used in the management of major pest and disease risk on key value chains in Uganda is presented in
Section 2.1.2.
As laid out in the recent agricultural risk assessment study (RAS) in Uganda (PARM, 2015), risk is defined
as a probability multiplied by the consequences. The RAS concluded that crop pests and diseases have
very high average severity, very high frequency, with very high losses in the worst case scenario.
However, in devising appropriate strategies for managing this risk, we recognise that there is a range of
pest risk scenarios. Some pests are already permanently present in Uganda, and it is known that they will
cause losses every season unless managed. Some pests may be usually present at low levels, but
occasionally become serious. And other pests are new to the country e.g. Maize lethal necrosis disease
(MLND), but on arrival have the potential to suddenly cause very high losses. Improved access to pest
management services, improved pest information systems and improved capacity to monitor and combat
pests and diseases are all relevant for managing all these risk scenarios, but details of the approaches
may be different.
Actual economic losses are hard to find – PARM (2015) report per annum losses from MAAIF as 35-200;
60-80; 8 and; 10 million USD/per annum for banana, cassava, coffee and cotton respectively. Some pest
specific estimates for important crops are given in Table 1.1 below – details on per-cent losses can be
found in table 2.1.
Platform for Agricultural Risk Management | Crop pests and disease management in Uganda: status and investment needs
19
Full Report | October 2016
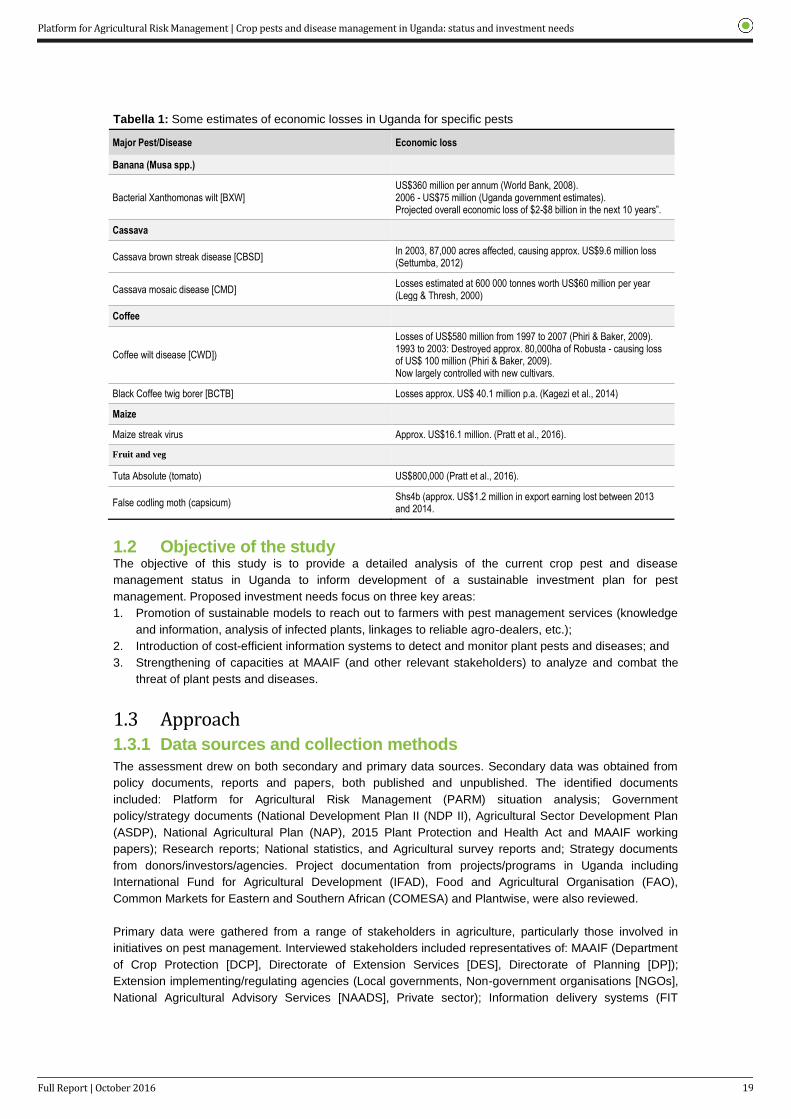
Tabella 1: Some estimates of economic losses in Uganda for specific pests
Major Pest/Disease Economic loss
Banana (Musa spp.)
Bacterial Xanthomonas wilt [BXW] US$360 million per annum (World Bank, 2008). 2006 - US$75 million (Uganda government estimates). Projected overall economic loss of $2-$8 billion in the next 10 years”.
Cassava
Cassava brown streak disease [CBSD] In 2003, 87,000 acres affected, causing approx. US$9.6 million loss (Settumba, 2012)
Cassava mosaic disease [CMD] Losses estimated at 600 000 tonnes worth US$60 million per year (Legg & Thresh, 2000)
Coffee
Coffee wilt disease [CWD])
Losses of US$580 million from 1997 to 2007 (Phiri & Baker, 2009). 1993 to 2003: Destroyed approx. 80,000ha of Robusta - causing loss of US$ 100 million (Phiri & Baker, 2009). Now largely controlled with new cultivars.
Black Coffee twig borer [BCTB] Losses approx. US$ 40.1 million p.a. (Kagezi et al., 2014) Maize
Maize streak virus Approx. US$16.1 million. (Pratt et al., 2016). Fruit and veg
Tuta Absolute (tomato) US$800,000 (Pratt et al., 2016).
False codling moth (capsicum) Shs4b (approx. US$1.2 million in export earning lost between 2013 and 2014.
1.2 Objective of the study The objective of this study is to provide a detailed analysis of the current crop pest and disease
management status in Uganda to inform development of a sustainable investment plan for pest
management. Proposed investment needs focus on three key areas:
1. Promotion of sustainable models to reach out to farmers with pest management services (knowledge
and information, analysis of infected plants, linkages to reliable agro-dealers, etc.);
2. Introduction of cost-efficient information systems to detect and monitor plant pests and diseases; and
3. Strengthening of capacities at MAAIF (and other relevant stakeholders) to analyze and combat the
threat of plant pests and diseases.
1.3 Approach 1.3.1 Data sources and collection methods
The assessment drew on both secondary and primary data sources. Secondary data was obtained from
policy documents, reports and papers, both published and unpublished. The identified documents
included: Platform for Agricultural Risk Management (PARM) situation analysis; Government
policy/strategy documents (National Development Plan II (NDP II), Agricultural Sector Development Plan
(ASDP), National Agricultural Plan (NAP), 2015 Plant Protection and Health Act and MAAIF working
papers); Research reports; National statistics, and Agricultural survey reports and; Strategy documents
from donors/investors/agencies. Project documentation from projects/programs in Uganda including
International Fund for Agricultural Development (IFAD), Food and Agricultural Organisation (FAO),
Common Markets for Eastern and Southern African (COMESA) and Plantwise, were also reviewed.
Primary data were gathered from a range of stakeholders in agriculture, particularly those involved in
initiatives on pest management. Interviewed stakeholders included representatives of: MAAIF (Department
of Crop Protection [DCP], Directorate of Extension Services [DES], Directorate of Planning [DP]);
Extension implementing/regulating agencies (Local governments, Non-government organisations [NGOs],
National Agricultural Advisory Services [NAADS], Private sector); Information delivery systems (FIT
Platform for Agricultural Risk Management | Crop pests and disease management in Uganda: status and investment needs
20
Full Report | October 2016
Uganda, Farm Gain, Agrinet, FEWSNET, Mercy Corps, Farm Radio International); Input supply (UNADA,
USTA); Farmers associations (UNFFE, District Farmers Associations); Academia (Makerere University,
Uganda Christian University) and Research (NARO). We also interacted with PARM focal persons and
national ARM focal persons to further understand the rationale for the analysis and strategy (see Appendix
1 for list of KII).
1.3.2 Data analysis and presentation
During the study, we gathered information to address the following key areas: (a) root causes for plant
pest and disease risk in Uganda, (b) the legal and institutional framework for pest management in Uganda
and its key actors, (c) cost-benefit and sustainability analysis of existing and planned initiatives related to
pest management, and (d) potential for further promoting information technologies/applications for pest
management. Results are presented as follows:
Root causes for plant pest and disease risk in Uganda: Examination of pest and disease risk for
farmers during the entire production cycle (from planting to marketing) was done for key value chains, and
root causes for the spread of plant pests and diseases. The analysis also attempted to segment the
disease exposure by geography, gender and type of farmers affected; economic losses; and management
options available or that have been used in Uganda (Chapter 2).
Legal and institutional framework for pest management in Uganda: Analysis of existing legal and
institutional arrangements for tackling the pest and disease risk; and main stakeholders in Uganda (public
or private) engaged in pest management, their roles and the type of support or services offered by each
actor. Relevant legal documents such NDP II, the NAP, ASDP, Plant Health and Protection Act, Draft
Extension Policy and Implementation Strategy and the Framework Implementation Plan (FIP) Statistics,
ICT and Risk management were reviewed to assess their relevance for pest management (Chapter 3).
Cost effectiveness and sustainability of extension approaches: Existing extension approaches used
in Uganda by various actors – public sector, private sector and donor-led, were assessed to understand
the services offered, costs involved and benefits for each so as to assess the cost effectiveness of each.
We also reviewed initiatives on the regional level, such as FAO's strategy for improved IPM in the region,
COMESA SPS strategy and regional IPM Collaborative Research initiatives (Chapter 4).
The potential for promoting information communication technologies (ICTs): Analysis of the
potential for further promoting information technologies/applications for pest management; including
identification of information technology and systems currently used by the government to track and monitor
pest and diseases and planned improvements for these systems; how different initiatives linked to farmers
share the information on detected plant pests and diseases with MAAIF; the current use of mobile
technology/applications and the potential to further increase usage (Chapter 5).
Pest management investment plan: Based on the analysis, an investment plan for sustainable pest
management is proposed. The plan focuses on three key areas; 1) access to pest management services;
2) access to pest information systems; and 3) institutional capacity to monitor and combat pests and
disease risks. Along each of these investment areas, activities are proposed as well as possible timelines,
institutional setup, human resources and budget requirements for effective implementation (Chapter 6).
1.3.3 Data validation
A validation and feedback exercise was conducted following the preparation of the first draft of the report.
This was done through a one day meeting involving key stakeholders. Results were presented and
feedback from relevant stakeholders collected. Feedback from the workshop was incorporated in the final
report.
Platform for Agricultural Risk Management | Crop pests and disease management in Uganda: status and investment needs
21
Full Report | October 2016
2. Root causes for plant pest and disease risk in Uganda
2.1 Overview of value chains and geographic distribution Crop production in Uganda is diverse with bananas, maize, cassava, beans and rice as the main food
crops, and coffee, cotton, tobacco, tea as the main cash crops. High value crops such as citrus, mangoes,
capsicum and tomatoes are also increasingly gaining prominence as cash crops in specific regions of the
country. The importance of these crops also varies by geography - determined by the production potential,
biophysical characteristics of the area and market access. The MAAIF zoning strategy is based on this and
aims to further develop key value chains based on comparative advantage of respective crops in particular
zones. The Agricultural Sector Development Plan (ASDP 2015/16-2019/20) prioritises 12 commodities,
nine of which are crops i.e. Coffee, Bananas, Cotton, Cassava, Maize, Rice, Beans, Citrus and Tea. This
section reviews these key value chains and other important value chains in Uganda in the context of
production systems, geographical distribution and economic importance, to further understand the needed
efforts to enhance agricultural development in general and pest management in particular.
2.1.1 Coffee
Coffee is Uganda’s main cash crop contributing 20-30% foreign exchange earnings. The sector supports
livelihoods for an estimated 1.5 million households most of whom depend on coffee as the only source of
income (Parizat et al. 2001). The crop is mainly produced by smallholder farmers owning average farm
sizes of less than one acre (Jassogne et al., 2012). The crop is intercropped with food crops such as
banana, beans and peanuts which are important for household food security; however banana is the most
intercropped crop. Banana also provides shade and in-situ mulch while beans rejuvenate soil fertility due
to nitrogen fixation (Jassogne et al., 2012). Crops that deliver a large amount of cash are usually male
dominated and coffee is no exception. The coffee/banana intercrop is mostly managed by men while
beans are normally managed by the women (Jassogne et al. 2012). Coffee is largely grown under shade
trees to ensure sustainable coffee production (Parizat et al. 2001). The leaves that fall from the shade
trees provide manure for the coffee plants.
In Uganda, two types of coffee are grown, Robusta and Arabica (Ahmed, 2012). Robusta coffee is
indigenous to the country and contributes 85% of total annual production and export volume (Ahmed,
2012). It is mainly grown in low altitude areas of up to 1,200 metres above sea level (masl.) mainly in the
Central region, parts of Western and South-eastern regions and recently Northern region (Ahmed, 2012).
The Central region produces the highest amounts of Robusta followed by the Western and the northern
region. Robusta coffee is more tolerant to higher temperatures, pests and diseases. Arabica coffee on the
contrary, is an introduction from Ethiopia and Malawi. It accounts for around 15% of total annual
production (Ahmed, 2012). It is mainly grown on the slopes of Mountain Elgon (Bududa, Bulambuli, Bukwo
Sironko, Kapchorwa, Manafwa and Mbale) in the east, Mountain Muhabura (Kisoro district) in South-
western and Mountain Rwenzori (Bundibugyo, Kasese and Ntoroko) in North-western at altitudes ranging
from 1500 to 2,300 masl (Ahmed, 2012).
2.1.2 Banana
Uganda is the second largest producer of banana in sub-Saharan Africa (IITA, 2016). It is one of the major
crops that support livelihoods of smallholder poor rural farming communities in Uganda (Tushemereirwe et
al., 2004). Four types of banana are grown, the East African highland banana (EAHB), dessert banana,
plantain and beer banana (Kiiza et al., 2004; Byabachwezi et al., 2012). EAHB includes the cooking type
(Matooke) and is the most predominantly grown in the country (Byabachwezi et al., 2012). According to
the 2008/2009 agricultural census, this type of banana is mostly grown by the Western region (Isingiro,
Mbarara and Bushenyi districts), followed by the Central region (Masaka) and the Eastern region (Mbale)
with the northern region mostly Arua district, producing the least (UBOS, 2010). The dessert banana
Platform for Agricultural Risk Management | Crop pests and disease management in Uganda: status and investment needs
22
Full Report | October 2016
includes Sukali Ndizi (apple banana) and Bogoya (Gros Michel). The 2008/2009 census indicated that this
type is produced in large quantities by the Western region (Rukungiri district), followed by the Central
region (Mpigi district) and the Eastern region (Mbale and Budaka districts) (UBOS, 2010). The brewing
type which includes Kisubi (Ney Poovan) and Kayinja (Pisang Awak) (Tushemereirwe et al., 2004) is
mostly produced in the west (Kibaale and Kanungu districts) and the Central (Mpigi and Mubende districts)
regions. The Plantain type is mainly for roasting and Gonja, which is under this category, is not widely
grown but Kasese district in Eastern Uganda is the leading source. Another cultivar, Kivuvu is used for
making beer but can also be cooked. Therefore besides food, the crop has multiple uses such as feed,
beverage, snacks and also crafts.
The cooking banana is a staple in many parts of the country especially in Central, Eastern and Western
parts (Haggblade and Dewina, 2010). Most farming communities find the cooking type ideal for food,
nutrition and income security than other crops because it is the only crop that can be harvested all year
round. Banana is mostly grown under mixed cropping arrangements mostly with maize and beans
although it is also intercropped with both Arabica and Robusta coffee (Okech et al., 2004; Jassogne et al.,
2012). Where it is intercropped with coffee, banana provides food, while coffee provides the cash, a
system that provides efficient utilization of labour and land (Jassogne et al., 2012). Although banana is key
for food and income in the household that produce it, the crop is under threat orchestrated by constraints
such as declining soil fertility, drought and mostly pests and diseases (Gold et al., 1999). The different
types of banana also demonstrate differences in severity following infestation and infection by different
pests and diseases respectively (Tushemereirwe et. al., 2004).
2.1.3 Cotton
Cotton is the third largest tradition cash and export crop after coffee and tea. According to the Cotton
Development Organization, which regulates the production and marketing of cotton, the crop is the main
source of livelihood, for close to quarter of a million households in Uganda (PMA, 2009; Ahmed and
Ojangole, 2012). On average, the majority of farmers grow the crop on approximately one acre, under rain-
fed conditions, with minimal use of inputs especially fertilizers and agro-chemicals (Ahmed and Ojangole,
2012). Whereas the crop can be produced in most parts of Uganda, it prefers altitudes less than 1,500
masl and requires a rainfall region of over 800 mm per annum. The ecological zones for growing cotton
are the northern and eastern dry areas which grow the variety Serere Albar Type Uganda (SATU)
(Hillocks, 2013) and the Southern and Western wet areas which grow the variety Bukalasa Pedigree Albar
(BPA) (Hillocks, 2013) however, BPA is the variety grown by most farmers because it fetches better prices
(Ahmed and Ojangole, 2012). Under appropriate management practices, cotton yield can vary from 2,500
to 3,000 kg/ha. About 90% of total cotton production is conventional, with the rest being organic. Organic
cotton is produced mainly in the north in the districts of Lira, Apac, Kitgum and Pader. Compared to
conventional cotton, organic cotton value chain faces challenges like low yields attributed to pests and
diseases; inadequate training and farmer sensitization on principles of organic production and
requirements; lack of effective organic pesticides and seed dressing products. Cotton farming in general
faces challenges such low soil fertility and pests and diseases which decimate total yields (Horna et al.
2009; Chell, 2013).
2.1.4 Cassava
Cassava is a very important staple food crop in Uganda especially in West Nile, Northern and Eastern
Uganda especially in the districts of Mbale, Iganga, Apac, Kamuli, Lira, Tororo and Kumi (Haggblade and
Dewina, 2010). Production has been increasing in the Central region because of declining soil fertility that
has affected cultivation of the major staple, banana. It is an easy crop to grow with a high yielding
capability. Mainly referred to as a “poor man’s crop” and mostly considered a famine reserve crop,
cassava is grown on plots averaging 1 to 3 acres mostly in mixtures involving either of the cereals; maize,
sorghum, finger millet or legumes; beans, groundnuts, cowpeas, soya beans (Bekunda and Woomer,
1996; Bekunda and Woomer, 1999; Soniia, 2003). Cassava is also grown in banana and coffee
establishments (Soniia, 2003). When mixtures are considered, cereals or legumes are planted two to three
weeks before or after planting cassava, the spacing of cassava being wider than that used for the normal

Platform for Agricultural Risk Management | Crop pests and disease management in Uganda: status and investment needs
23
Full Report | October 2016
sole crop. Most planting is done in the first and not the second rains.
Cassava contributes a substantial proportion of caloric requirements. When the sweet cassava roots are
peeled, they can be eaten raw, boiled, fried, roasted, or after drying and pounding, they are turned into a
paste. There is a preference for these sweet varieties because of the high demand and higher prices they
fetch unlike the bitter varieties. When peeled, the butter varieties are turned into flour after a solid-state
fermentation process or after soaking in water (wet fermentation) and subsequent boiling of whole pieces
immediately or after sun-drying. The bitter varieties are preferred for brewing local beer and distilling a
spirit called waragi. Studies conducted by Otim-Nape and Zziwa (1990) demonstrated that boiled fresh
cassava was regarded as the most important product, followed by flour and lastly fermented drinks. They
also found that flour was more important in places where cassava was second or third most important
crop.
2.1.5 Maize
Maize is the most important cereal and second most cultivated crop after banana and beans (FAOSTAT).
Moreover, it is one of the only two cereals among the 9 priority crops that the government will support and
promote under its new strategic policy (ASDP 2015/16-2019/20). It is cultivated on about 1.5 million
hectares of land mainly by smallholder farmers. The crop is grown in all parts of the country but most
intensely in Eastern (Kapchorwa, Mbale, Kamuli, Jinja and Iganga), Central (Masaka and Mubende) and
Western (Masindi, Kamwenge, Kyenjojo, Kasese, and Kabarole) with the Eastern region accounting for
over 50% of total annual production (UBOS, 2010). In most parts of the country, maize is grown twice a
year, utilizing the bimodal rainfall opportunity and as an intercrop of beans, soybeans or groundnuts.
Shortage of land has resulted into continuous cropping which has led to decline in soil fertility. It provides
income to close to two million households. Primarily grown for income generation, until recently maize did
not constitute the major part of the diet like in the neighbouring countries. However, the increasing cost of
banana (the main staple crop), has had an impact of increasing the consumption of maize. Therefore, the
crop has become a major staple replacing crops like sorghum, millet, cassava and banana providing over
40% of the calories in both rural and urban areas. In addition to food, maize has had a wide range of other
uses including processing of livestock and poultry feeds and making of local brew (Okoboi, 2010). It is the
most traded food crop. In a study by Nabbumba and Bahiigwa (2003) on agricultural productivity
constraints in Uganda, farmers ranked pests and disease as the main constraint to maize production
followed by inadequate capital to invest in production with low and fluctuating prices.
2.1.6 Rice
Rice is among the emerging staples and commercial crops in Uganda. It is the third most important cereal
after maize and wheat. The crop is not only increasingly replacing some staple foods in the country but
also becoming the preferred cash crop in some regions. Area under rice cultivation has increased from
1,500 hectares in the early 2000s to 220,000 hectares in 2011. Consequently, production has increased
from 154,000 tonnes in 2006 to 237,000 tonnes in 2016 (FAOSTAT). The increase in production is partly
attributed to the introduction of upland rice especially the NERICA varieties especially NERICA 4 although
NERICA 1 and 10 have also been widely adopted in the country. The NERICA 4 variety is preferred for its
hardiness, high yields, and shorter maturation time compared to traditional rice varieties. This has reduced
rice imports to the country by one third saving the country very important foreign exchange revenue. Rice
was important in supporting food security during the times when cassava mosaic and banana
xanthomonas wilt ravaged Eastern and Central Uganda respectively.
2.1.7 Beans
Beans provide 25% of the total dietary calorie intake and 45% of the protein intake. It also provides
essential micronutrients and vitamin B. It is one of the most widely grown food crops together with banana,
cassava and maize (FAOSTAT). Beans are mainly produced by women for food security at household
level however; it has become also a major source of income for farmers and traders. This is partly because
beans have a short growing cycle and adaptability to a wide range of conditions but also because there is

Platform for Agricultural Risk Management | Crop pests and disease management in Uganda: status and investment needs
24
Full Report | October 2016
increasing demand from both the domestic and export markets especially Kenya. Production is dominant
in the Central, Eastern and Western regions and dominated by smallholder farmers with average plot sizes
of one acre per household. In Uganda, varieties from two types of beans are grown, bush and climbing
beans (CIAT, 2008; Sonia et al., 1997). Bush beans are the most widely grown mostly in intercrops of
maize, cassava, banana, cotton, or groundnuts. Climbers, which constitute about 20% of total bean
acreage, are mostly grown in the highlands of southwest, Western (on slopes of Mountain Rwenzori) and
Eastern (Mountain Elgon) Uganda. They can be intercropped with maize although farmers mainly grow
them in pure stands due to higher yield potential. Decreasing soil fertility, pests and diseases are the major
production constraints (Wortmann et al. 1998).
2.1.8 Potato
Potato also referred to as Irish potato is a source of both income and food security in areas where it is
produced. The crop is mainly produced in the highland regions at altitudes between 1,500-3,000 masl
(Bonabana-Wabbi et al., 2013). Most of the crop is grown in South-western Uganda in the districts of
Kabale and Kisoro which produce over 60% of the national crop on plots approximately one acre with
Kapchorwa and Mbale in Eastern districts producing the rest (Kaguongo et al., 2008; Bonabana-Wabbi et
al., 2013). However, due to increased urban demand, production is spreading to Central Uganda
especially in the districts of Lwengo and Masaka (Ferris et al., 2002; Bonabana-Wabbi et al., 2013)
2.1.9 Fruits and vegetables
The demand for fruits especially citrus, passion fruits and mangoes by the urban population has
tremendously increased in the past decade. This is partly because of the increased awareness of the
health benefits of fruits and vegetables. Citrus and mangoes are mainly grown in Eastern part of the
country while passion fruits a mainly under production in the Western districts of Kabale, Rubanda and
areas around the slope of Mt Elgon.
2.2 Pests and diseases affecting key value chains 2.2.1 Coffee
There have been declining in volumes in coffee in the last decade which has largely been attributed to pest
and diseases although there are other factors that have also been suggested (Jassogne et al., 2012). It
has also been suggested that changes in climatic conditions that have resulted in rampant droughts,
unpredictable and varied rain patterns, temperature changes could have resulted in the appearance of
new pests and severity of new and existing pest problems (Jassogne et al., 2012). In addition the results of
climate could have resulted in migration of pests to ecological zones where they never existed. Diseases
causing losses of economic importance include coffee wilt disease, coffee leaf rust, coffee berry disease.
Coffee wilt diseases caused by Gibberella xylariodes (Telomorph: Fusarium xylariodes) was first reported
on Robusta coffee in the early 1990s in the western district of Bundibugyo. The disease claimed 44.6% of
coffee trees between 1993 and 2002 (Flood and Brayford, 1997, 1998). Although recognised in this
section, the disease is not a major threat to the coffee industry as it was decades ago. Coffee leaf rust is
caused by the rust fungus Hemileia vastatrix which causes major loses on Arabica coffee, although the
disease has also been known to affect Robusta coffee but with less severe consequences, some clones in
Uganda demonstrate high susceptibility which results in high yield losses (Jassogne et al., 2012). It is
more significant in the high altitude districts of Bududa, Kapchorwa, Bulambuli, Mbale and Manafwa found
in the Elgon ranges. Coffee berry disease is caused by the fungal pathogen Colletotrichum kahawae and
mainly affects Arabica coffee (Birikunzira, 2000). The disease infests flower buds, leaves, fruits and the
maturing bark. Like coffee leaf rust, the disease is predominant in the Eastern and Western districts
growing Arabica coffee. There are reports that suggest a shift from 1,600 masl where it was previously
recorded to attack crop cultivated to higher altitudes such as 1,800 masl. Recently, the insect pest, the
black twig borer (Xylosandrus compactus) was reported in Bundibugyo (Kagezi et al., 2013). The insect
thrives on over 225 plant and forest species. It causes extensive damage on coffee mainly Robusta.
Affected twigs do not bear berries. More than 40 host species have been recorded and reported in
Uganda.

Platform for Agricultural Risk Management | Crop pests and disease management in Uganda: status and investment needs
25
Full Report | October 2016
2.2.2 Banana
Banana is affected by a number of pests and diseases which result in significant decline in yield. The
banana weevil also referred to as the banana root borer (Cosmopolites sordidus) is the most damaging
pest in Uganda especially in neglected plots (Gold et. al., 2004). It lives, feeds and breeds in pseudostems
for periods of up to two years. It lays eggs against the sides of the stems. After hatching, the larva bores
into the stem, weakening them and making them liable to wind damage. Black sigatoka, which is also
referred to as black leaf streak is caused by the fungus Mycosphaerella fijiensis, a pathogen that has a
wide host, range and considered the most important folia disease of banana (Tushemereirwe et. al., 2004).
Infestation results in significant reductions in leaf area through premature drying of leaves and yield loss.
Early leaf drying results in incomplete filling of banana fingers as well as premature ripening both of which
are detrimental in exported fruit. Yield loses have been estimated to more than 50% under heavy
infestation. Studies done at Kawanda, revealed a bunch weight reduction of 37% due to black sigatoka.
The disease is more damaging and difficult to control than yellow sigatoka (Mycosphaerella musicola).
Fusarium wilt is caused by the soil borne fungus Fusarium oxysporum f.sp. cubense (Tushemereirwe et.
al., 2004). The disease has remained one of the most important diseases of bananas in the country having
wiped out entire plots of susceptible cultivars. It has been recorded all around the country especially where
susceptible cultivars such as Bogoya, Kayinja, Sukali Ndizi and Kisubi are grown (Tushemereirwe et. al.,
2004). Banana xanthomonas wilt is caused by the bacterium Xanthomonas campestris pv. musacearum
(Tushemereirwe et. al., 2004). The disease first reported in Kayunga and Mukono districts in 2003 spread
uncontrollably to major banana-growing areas in Uganda spanning over 30 districts. It is locally referred to
as Kiwotoka (Kagezi et. al., 2006) and causes wilting of banana plants of all age causing the affected
plants to die prematurely. Majorly transmitted through male flower bud by pollinating insects, bats and
sunbirds, spread has however, been intensified by farmer exchange of planting materials and banana
trade between neighbouring districts and sub-counties. Nematode species important in Uganda include
Radopholus similis, Pratylenchus goodeyi, Helicotylenchus multicinctus and Meloidogyne spp (Kashaija et
al., 1993). They infect root tissues and impair absorption and transportation of water and nutrients in
addition to weakening plant anchorage in soil. Damage to banana is associated with a reduction in bunch
weight, loss of bunches due to plant toppling, increase in crop cycle duration and decrease in plantation
longevity with yield losses ranging from 30% to 50%.
2.2.3 Cotton
Insect pests alone have been estimated to reduce cotton yields by 40%. Annually this may translate into
losses of 50,000 barrels or US$ 10 million equivalent in value. The African bollworm (Helicoverpa
armigera) (Berocan et. al., 2014) is the most important cotton pest in Uganda. It is a difficult pest to
manage because it has a wide range of hosts especially vegetables like tomatoes, okra, pepper and peas.
Most of these are grown within the proximity of cotton fields. The lygus bug (Lygus simonyi) has also been
reported to cause serious damage through sucking the young leaves and apical buds causing retarded
growth (Berocan et. al., 2014). Jassids feed on cotton leaves causing them to curl at the edges, turn yellow
or reddish and in severe cases, they may even dry (Sabune 2005). This pest has been reported by
farmers in Lango and Acholi regions in northern Uganda and Kasese in the west. The diseases include
cotton bacterial blight, a bacterial disease caused by Xanthomonas citri pv. Malvacearum (Akello and
Hillocks, 2002), the wilts caused by the soil-borne fungi, Fusarium (Fusarium oxysporum f.sp vasinfectum)
and Verticlium (Verticillium dahliae) and the leaf spots caused by Alternaria (Alternaria macrospora) and
Cercospora (Cercospora gossypina).
2.2.4 Cassava
Cassava mosaic disease (CMD) is a viral disease spread by the white flies. The disease is common in all
major cassava growing regions in the country. Symptoms of CMD infected plants include mosaic, mottled,
deformed and twisted leaflets. There is observed overall reduction in size of leaves and plants and such
plants normally produce few or no tuber although this is dependent on the severity of the disease and the
age of the plant at which it was infected. Cassava brown streak disease (CBSD) is another viral disease

Platform for Agricultural Risk Management | Crop pests and disease management in Uganda: status and investment needs
26
Full Report | October 2016
transmitted by the white fly and causes serious economic losses in the yield and quality of the roots (Alicai
et al., 2007). Especially in susceptible varieties, infestation renders the roots unusable particularly when
left in the ground for longer periods. CBSD symptoms are observable on the leaves, stems and roots
however; on the leaves, the symptoms are more prominent on older leaves than young ones. Unlike CMD,
infected leaves do not become distorted. The characteristic symptom on the leaves appear as patches of
yellow areas mixed with normal green colour which may enlarge and join to form comparatively large
yellow or necrotic patches. These yellow patches are more pronounced in mature than young leaves. On
the stems, the disease appears as dark brown streaks and spots and is more prominent on the upper
green portions of the stem. On the roots, the disease causes cracks, discoloration, root constriction and
malformation. The harvested roots are corky with yellow-brown necrotic spots. The cassava green mite
(Mononychellus tanajoa) is a spider mite, which causes serious infection on cassava. It feeds on young
leaves and green stems and can easily be confused with effects cassava mosaic disease.
2.2.5 Maize
Major pests include stalk borers especially Busseola fusca and Chilo partellus (Matama-Kauma et. al.,
2007; Calatayud et al., 2014) whose management is very difficult once in the field; maize weevil (Sitophilus
zeamais) and larger grain borer (Prostephasnus truncates) which are key storage pests (Gafishi et al.,
2012). The diseases include those caused by viruses, maize streak virus and maize lethal necrosis (MLN).
MLN has been reported in the Eastern districts of Busia, Bulambuli, Tororo, Iganga, Mbale and Sironko.
The disease first reported in 2013, has become the most important destructive disease in Uganda causing
massive reductions in yield (0.25 to 1.0 tonne per hectare). The major fungal diseases include turcicum
leaf blight caused by Exserohilim turcicum; gray leaf sport caused by Cercospora zeaemaydis and
Cercospora sorghai var. maydis; and ear rots caused by two species Sternocarpella maydis and Fusarium
species (F. graminearum and F. verticillioides) (Adipala et. al., 1993; Asea et. al., 2002; Okori et. al., 2003;
Bigirwa et al., 2007). Ear rots are associated with production of aflatoxins and in Uganda, studies identified
F. verticillioides as the most common mould species (Bigirwa et. al., 2006). Aflatoxins are toxic
metabolites with significant social-economic impacts - including on food security, trade and human health.
They cause direct economic losses by spoiling produce. Animals fed on contaminated grain have
lower productivity and slower growth while commodities have lower market value and often consumed
locally. Aflatoxins have been reported in a number of value chains especially maize, sorghum, millet, rice,
wheat, groundnut, soybean, sunflower, cassava and cotton. Aflatoxins are largely as a result of poor post-
harvest handling of produce, though pre-harvest management practices have been suggested to reduce
the risk of aflatoxins (see Table 2.2). The notorious weed, Striga is also a major problem causing heavy
cereal crop loses especially in the Eastern districts especially in Busoga and Teso region and Kasese in
Western Uganda (Olupot et. al. 1999). There are two species Striga hermonthica which is the most
important in infesting most cereals in Uganda although the second species Striga asiatica has also been
reported.
2.2.6 Rice
Rice yields are decimated by Striga especially in Eastern Uganda, and three key diseases; rice yellow
mottle virus, a Sobemovirus vectored by the Chrysomelids, bacterial blight caused by Xanthomonas
oryzae pv. oryzae and rice blast caused by Magnaporthe oryzae (Anamorph: Pyricularia oryzae)
significantly affect yields (Habarurema et. al. 2013; Ochola et. al. 2015; Onaga and Asea, 2016). These
diseases have been recorded where ever rice countrywide.
2.2.7 Beans
Diseases of beans include those caused by fungi such as: angular leaf spot caused by Phaeoisariopsis
griseola; anthracnose caused by Colletotrichum lindemuthianum, and bean rust caused by Uromyces
appendiculatus. Diseases caused by bacteria include: common bacterial blight caused by Xanthomonas
axonopodis pv. phaseoli and halo blight caused by Pseudomonas syringae pv. Phaseolicola. Viruses,
especially the bean common mosaic virus, continue to limit production levels (Nkalubo et. al. 2007;
Pamela et al., 2014).
Platform for Agricultural Risk Management | Crop pests and disease management in Uganda: status and investment needs
27
Full Report | October 2016
2.2.8 Potato
Potato is affected by a number of diseases, the most important include late blight caused by Phytophthora
infestans and bacterial wilt caused by Ralstonia solanacearum (Lamega et. al. 2001; Ochwo et al., 2002;
Mulema et. al. 2005).
2.2.9 Fruits and vegetables
The horticultural industry has been ravaged by the fruit fly scourge with Bactrocera invadens being the
most widespread although other species such as Ceratitis cosyra, Ceratitis rosa and Ceratitis capitata
have also been reported. Bactrocera invadens has been reported to reduce mango yields by 73%
(Nankinga et al., 2014; Isabirye et al., 2016). The false codling moth (Thaumatotibia leucotreta) is another
key pest that has been reported by MAAIF mostly affecting the hot pepper value chain. The prevalence of
this pest has resulted in the European Union restricting hot pepper exports destined for the European
Union.
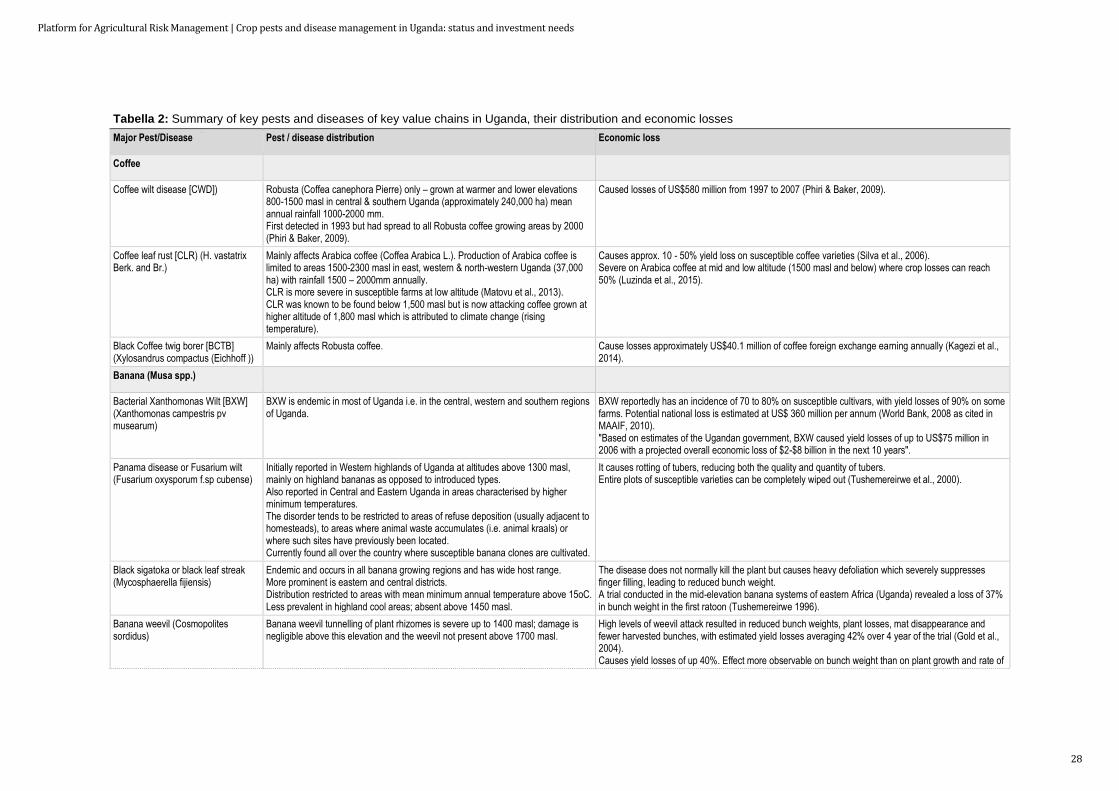
Platform for Agricultural Risk Management | Crop pests and disease management in Uganda: status and investment needs
28
Tabella 2: Summary of key pests and diseases of key value chains in Uganda, their distribution and economic losses
Major Pest/Disease Pest / disease distribution Economic loss
Coffee
Coffee wilt disease [CWD]) Robusta (Coffea canephora Pierre) only – grown at warmer and lower elevations
800-1500 masl in central & southern Uganda (approximately 240,000 ha) mean annual rainfall 1000-2000 mm. First detected in 1993 but had spread to all Robusta coffee growing areas by 2000 (Phiri & Baker, 2009).
Caused losses of US$580 million from 1997 to 2007 (Phiri & Baker, 2009).
Coffee leaf rust [CLR) (H. vastatrix Berk. and Br.)
Mainly affects Arabica coffee (Coffea Arabica L.). Production of Arabica coffee is limited to areas 1500-2300 masl in east, western & north-western Uganda (37,000 ha) with rainfall 1500 – 2000mm annually. CLR is more severe in susceptible farms at low altitude (Matovu et al., 2013). CLR was known to be found below 1,500 masl but is now attacking coffee grown at higher altitude of 1,800 masl which is attributed to climate change (rising temperature).
Causes approx. 10 - 50% yield loss on susceptible coffee varieties (Silva et al., 2006). Severe on Arabica coffee at mid and low altitude (1500 masl and below) where crop losses can reach 50% (Luzinda et al., 2015).
Black Coffee twig borer [BCTB] (Xylosandrus compactus (Eichhoff ))
Mainly affects Robusta coffee. Cause losses approximately US$40.1 million of coffee foreign exchange earning annually (Kagezi et al., 2014).
Banana (Musa spp.)
Bacterial Xanthomonas Wilt [BXW] (Xanthomonas campestris pv musearum)
BXW is endemic in most of Uganda i.e. in the central, western and southern regions of Uganda.
BXW reportedly has an incidence of 70 to 80% on susceptible cultivars, with yield losses of 90% on some farms. Potential national loss is estimated at US$ 360 million per annum (World Bank, 2008 as cited in MAAIF, 2010). "Based on estimates of the Ugandan government, BXW caused yield losses of up to US$75 million in 2006 with a projected overall economic loss of $2-$8 billion in the next 10 years".
Panama disease or Fusarium wilt (Fusarium oxysporum f.sp cubense)
Initially reported in Western highlands of Uganda at altitudes above 1300 masl, mainly on highland bananas as opposed to introduced types. Also reported in Central and Eastern Uganda in areas characterised by higher minimum temperatures. The disorder tends to be restricted to areas of refuse deposition (usually adjacent to homesteads), to areas where animal waste accumulates (i.e. animal kraals) or where such sites have previously been located. Currently found all over the country where susceptible banana clones are cultivated.
It causes rotting of tubers, reducing both the quality and quantity of tubers. Entire plots of susceptible varieties can be completely wiped out (Tushemereirwe et al., 2000).
Black sigatoka or black leaf streak (Mycosphaerella fijiensis)
Endemic and occurs in all banana growing regions and has wide host range. More prominent is eastern and central districts. Distribution restricted to areas with mean minimum annual temperature above 15oC. Less prevalent in highland cool areas; absent above 1450 masl.
The disease does not normally kill the plant but causes heavy defoliation which severely suppresses finger filling, leading to reduced bunch weight. A trial conducted in the mid-elevation banana systems of eastern Africa (Uganda) revealed a loss of 37% in bunch weight in the first ratoon (Tushemereirwe 1996).
Banana weevil (Cosmopolites sordidus)
Banana weevil tunnelling of plant rhizomes is severe up to 1400 masl; damage is negligible above this elevation and the weevil not present above 1700 masl.
High levels of weevil attack resulted in reduced bunch weights, plant losses, mat disappearance and fewer harvested bunches, with estimated yield losses averaging 42% over 4 year of the trial (Gold et al., 2004). Causes yield losses of up 40%. Effect more observable on bunch weight than on plant growth and rate of

Platform for Agricultural Risk Management | Crop pests and disease management in Uganda: status and investment needs
29
Major Pest/Disease Pest / disease distribution Economic loss
development (Rukazambuga et al., 1998; Gold, C.S. et al. 2004).
Cotton
African bollworm (Helicoverpa armigera)
Cotton growing districts in Lango and Acholi in northern Uganda and Kasese in the west.
Data not available.
Cassava (Manihot esculenta)
Cassava brown streak disease [CBSD]
CBSD is confined to altitudes below 1,000 masl in endemic areas but has been reported at mid altitude levels (1200–1500 masl) (Alicai et al., 2007).
Cause up to 100% yield loss in susceptible varieties (Kaweesi et al., 2014). In Mukono district, for example, 30% of the 87,000 acres under cassava cultivation was affected by CBSD in 2003, causing approximately USD 7.5 million loss in revenue (Settumba, 2012).
Cassava mosaic disease [CMD] Wide spread in cassava growing areas in the country. Losses estimated at 600 000 tonnes worth USD 60 million per year (Legg & Thresh, 2000).
Cassava bacterial blight [CBB], (Xanthomonas axonopodis pv. manihotis)
Widespread in the country and caused severe losses in the savannah areas particularly on susceptible varieties grown on poor soils.
Up to 70 % reduction in yields of cassava tubers and planting materials (Otim-Nape and Sengooba, 1980). On poor sandy soils in the Nile, and part; of the Northern and Eastern provinces, 90-100% crop losses was recorded on susceptible varieties (Otim-Nape, 1980).
Maize
Maize Lethal Necrosis (MLND) Eight districts bordering with Kenya. Losses not quantified in Uganda but in Kenya, by 2012, the disease had affected 26,000 ha of maize,
causing losses amounting to US$ 52 m (MDRAT, 2012).
Maize streak virus Mainly in the eastern districts on the border with Kenya. Approx. USD 16.1 million. (Pratt et al., 2016).
Larger Grain Borer (LGB) Serious pest of stored maize and dried cassava roots, but will also attack maize in the field just before harvest. Minor hosts include yam, sorghum, triticale and wheat. LGB is also present on a number of wild hosts and can infest wooden grain storage structures. Distributed across the country.
Data on yield loss due to LGB not quantified but studies estimate that about 40% of post-harvest grain losses are due to storage insect pests..
Striga Eastern districts especially in Busoga and Teso region and Kasese in Western Uganda
Yield loss due to Striga not quantified in Uganda. Studies in SSA estimate that parasite infests 40% of the cereal-producing areas resulting to crop losses estimated at US$7 billion annually (Ejeta, 2007). Most affected are subsistence farmers losing about 20–80% of their yield (Gethi et al., 2005).
Beans
Anthracnose Anthracnose is endemic in Uganda and as long as conditions are right, it will affect
any bean crop across the country although more prevalent in high altitude areas (Pastor-Corrales, 1995)
Reduces yield potential in susceptible varieties by 30-45% (Nkalubo et al., 2007).
Angular leaf spot All over the country where beans are grown Yield losses of up to 50% have been reported among commercial varieties (Opio et al. 2001).
Potato

Platform for Agricultural Risk Management | Crop pests and disease management in Uganda: status and investment needs
30
Major Pest/Disease Pest / disease distribution Economic loss
Ralstonia (potato, eggplant, nightshade etc.)
Although less information is available, has been reported in key major potato and tomato growing regions
Potato yield losses estimated at 30%, with more severe losses being 100% (Alacho and Akimanzi, 1993).
Fruit and veg
Tuta Absoluta (tomato) Reported but distribution not yet known (Tumuhaise et al., 2016). Annual loss of US$800,000 estimated by Pratt et al., 2016.
Fruit fly (mango) Bactrocera invadensis very prevalent while Ceratitis capitata is the populous (Nankinga et al., 2014). Distributed country wide in all mango growing areas.
Loses can range from 73% to 83 % depending on agro-ecological zone (Nankinga et al. 2014).
False codling moth (capsicum) Affects a range of hosts hence might have wide distribution. As a result of the pest, earnings from peppers declined from $1.74m (Shs6.3b) in 2013 to $573,000 (Shs2b) in 2014. In effect, Uganda lost more than Shs4b (204 per cent).
Platform for Agricultural Risk Management | Crop pests and disease management in Uganda: status and investment needs
31
Full Report | October 2016
2.3. Root causes for the pests not being effectively controlled Based on review of the literature, interviews with key informants and personal experiences of the
consultants a problem tree approach was taken to consider the key causes behind ineffective pest control.
During development of a problem tree, it appeared to make most sense to identify causes around two
main causes: 1) New pests spread and 2) Poor farm level management. The root causes were then
tracked back as presented in Figures 2.1 and 2.2.
2.3.1 New pests spread
The spread of new pests was considered to take place primarily due to a set of under-lying causes related
to a) Spread through marketing and material movement; and b) outbreaks going unnoticed due to limited
information and surveillance measures.
a) Marketing and material movement
Marketing affects movement of plants and plant materials both internally and across borders. This can be
either through grain, seed / planting material or fresh produce such as fruits taken to the market. Traders
move diseased plant materials either knowingly (to avoid income loss) or unknowingly. For example, pests
like fruit fly can easily be moved from one place to another through marketing. It’s not easy to identify a
fruit carrying the larvae of the fruit fly at harvest, thus such fruits can easily find their way to the market.
Similarly, marketing of coffee was responsible for the spread of coffee wilt as dried coffee husks were
taken to uninfected gardens as manure spreading the disease from infected to non-infected fields. Cross
border trade and transport of food aid across borders have also been blamed for the entry of the larger
grain borer – Prostephanus truncatus which has become an endemic pest in the entire East African region,
as well as the Maize Lethal Necrosis. It is projected that pests and diseases may become a bigger
problem as more trade and aid flourish in the region.
Movement of viable plant material, whether for sale or just exchange, has been responsible for pest
spread. For example, movement of cassava and banana planting materials country wide has been partly
responsible for the spread of cassava brown streak and banana bacterial wilt diseases respectively.
Similarly, indiscriminate exchange of planting materials by farmers across borders without following proper
plant quarantine regimes is considered a big threat to ensuring crop health within Uganda. For example,
cassava mealy bug entered Uganda in 1992 via the Democratic Republic of Congo. Likewise cassava
brown streak disease occurred in Uganda when infected materials were taken from Tanzania in 1934.
Though the disease was effectively controlled at the time due to destruction of all infected plant material,
CBSD reemerged in Uganda in 2005 (Alicai et al., 2007).
Movement of materials per se is not the key problem, but rather the inadequate monitoring and
enforcement in the way materials are transferred. Two key issues then emerge; limited enforcement of
internal controls and limited border in relation to internal and cross border materials movement
respectively. The structure for DCP provides for 70 staff and usually just a fraction are hired, with the
department currently having 39 staff only. There are also conflicting pressures at the district level not to
restrict movement of produce or plant materials when a problem is identified. The technical staff at district
level have no mandate/authority to either arrest perpetrators or confiscate suspected goods to prevent
movements. In terms of cross border management, it was noted that out of 30 gazetted border posts, only
5 are currently manned i.e. Busia, Malaba, Katuna, Mutukula and Entebbe International Airport.
Inadequate monitoring at key entry points leads to free movement of materials that may potentially contain
exotic or invasive pests that can easily spread into the country. Related to this, there is limited
consultations and coordination between Uganda Revenue Authority and MAAIF. Most times, traders move
their goods after clearing their import taxes, without such materials being checked and verified by MAAIF
technical teams. This further depicts limited awareness of standard materials movement guidelines.
b) Outbreaks go unnoticed
Pest introductions may occur in a country due to various reasons; marketing mentioned earlier being just
one of them. Other biotic and abiotic factors can contribute to resurgence of pests and diseases that were

Platform for Agricultural Risk Management | Crop pests and disease management in Uganda: status and investment needs
32
Full Report | October 2016
considered to be under control, e.g. climate change, change in pest mating types, spread through vectors
across borders. Sometimes, new pest epidemics and outbreaks may occur due to pest migration across
borders. Mechanisms to anticipate and respond to pest problems before they become serious are needed
– but are currently insufficient as a result of:
– Inadequate personnel and budget in DCP to undertake pest and disease monitoring and response.
DCP mentioned a general lack of human capacity (inadequate staffing) as the key factor affecting the
ability of the department to effectively manage pests particularly introduced ones. There are limited
financial resources to effectively undertake surveys and general surveillance / early warning on pest
incidences. In some instances, once the pest problem is identified, financial resources to implement
agreed prevention or control measures are not available or not released in time to arrest the situation.
In particular, the DCP lacks a contingency budget to quickly address pest and disease outbreaks. This
in part may be related to absence of pest-specific plans that can guide what resources are likely to be
required for response. Though largely, this is attributed to limited funds allocated to the department and
limited capacity and funds at the district level.
– Inadequate and non-coherent monitoring and reporting of pest situations - In theory extension workers
are the front line staff that provide reports with regard to emerging pest to MAAIF (DCP). The gap in the
current extension system is partly to blame for the inadequate reporting of pests, but also non-
coherence due to several reporting lines. With the single spine extension system (detailed description in
section 3.2.8) under implementation, there will be a direct link between extension staff and MAAIF, but
adequate collaboration between Directorate of Extension Services, DCP and District Agricultural
Officers is still critical for ensuring adequate information flow. Plant clinics (distributed in over 90
districts) are to some extent providing pest data as a result of providing a crop advisory service. This
could be a possible solution to pest monitoring systems, although systems require investment and clear
lines of authority and mandate. Several private sector players (e.g. agrodealers, aggregators, village
based intermediaries etc.), NGOs and donor organisations may observe or hear of outbreaks and
generate information on pests and diseases which can be utilized by DCP if there was a coordinated
approach. Collaboration with the Department of Planning and statistics will be needed to integrate and
capitalize on new infrastructure and work processes being planned to integrate collection of pest data.
Although it is not clear whether there are existing plans to incorporate processes on regular pest
monitoring rather than annual statistics.
– Inadequate diagnostics services - At district level, interviewees mentioned lack of proper diagnostic
equipment and also capacity to diagnose pest problems. In cases where problems were referred to the
national systems either at MAAIF or NARO level, there was a slow response on how they could be
managed. A follow up on the status of the National Agricultural Research Laboratories (NARL)
Kawanda and the DCP run National Diagnostic Laboratory (NDL) Namalele showed that basic
equipment for routine diagnosis are available, however there was a lack of adequate personnel,
inadequate skills in diagnosing some pest/disease problems especially viruses, and limited supply of
reagents. NARL also hosts the seed testing lab.
2.3.2 Poor farm level management
The principle causes of poor pest management at farm level were identified as; a) limited awareness of
pest management solutions, b) sometimes farmers don’t follow advice, c) Lack of practical solutions, d)
counterfeit chemicals e) poor quality seed, and f) poor soil fertility and nutrient management.
a) Limited awareness of pest management solutions
Farmers have limited capacity to identify, differentiate and diagnose disease problems and effectively
respond to them. In situations where they can identify the problems, they fall short on management
practices both pre- and post-harvest. Kumakech et al. (2013) report that lack of knowledge on disease
recognition and management contributed significantly to rapid spread of CBSD in northern Uganda. This
lack of knowledge is partly blamed on inadequate supporting extension system. There is not enough
extension staff to support farmers. In one of the meetings, the District Production and Marketing Officer
mentioned that although they are reinstating the extension staff; services are not yet operational. It was
also acknowledged that extension staff, more often than not lack knowledge and technical packages to

Platform for Agricultural Risk Management | Crop pests and disease management in Uganda: status and investment needs
33
Full Report | October 2016
manage emerging pests and diseases, underscoring the need for frequent re-training of extension
personnel to effectively offer extension advice. Better access to sources of information on technical
packages is needed. A number of national and international databases are available – but are not all easily
accessible.
b) Farmers don’t follow advice
There are many reasons why farmers do not follow advice; lack of economic incentives to invest in pest
management, recommended inputs not accessible and usually of questionable quality, farmers tired of
conflicting advice, and land fragmentation.
– Lack of incentives: Output markets are generally poor and farmers do not achieve adequate returns to
their investment, implying that additional input into pest management options would further decrease
expected returns. The coffee industry gives a premium price for quality coffee encouraging farmers to
invest in managing their crop well, including in pest management.
– Poor access to quality inputs: Farmers lack access to recommended inputs either because they are
very expensive or they cannot be purchased near to farmers homes. Further, the quality of inputs
remains questionable as majority of farmers would testify that the inputs are often fake or adulterated
and control measure to combat adulteration are not strong or adhered to. This demotivates farmers to
further invest in inputs if they cannot achieve the intended pest/disease management objectives.
– Farmers tired of receiving conflicting advice: Key informants also noted that farmers were “tired” of
receiving conflicting advice from different sources, and often complained that the promoted
recommendations do not yield positive results. Smallholder farmers are risk averse and need to be very
confident of a positive return in order to invest in pest management.
– Land fragmentation: Failure to invest in pest management is further aggravated by decreasing land
sizes. Increased pressure on land in the recent decades due to population explosion frequently came
out as a key cause. This has resulted in both excessive land fragmentation and continuous cropping of
the small land pieces with no fallow periods. Continuous cropping implies that there is no break in
seasons which can create persistence of pest problems. Continuous cropping especially of bananas
was mentioned as key in the persistence of banana weevils and nematodes as well as for bacterial wilt
caused by Ralstonia solanacearum in tomato and other solanaceous crops such as potato and egg
plants. Small land sizes also means that there is no economy of scale and even less incentive for
farmers to invest – as the land size is unable to support families. Often farmers are forced to seek off-
farm opportunities to earn money – so that lack of labour also becomes a constraint.
– Labour constraints: Some pest management options are labour consuming and tedious which makes
their application and sustainability problematic. For example, in the management of the fruit fly,
recommended practices have proved tedious and not practical for a regular farmer. One of the options
in the management of fruit fly is the collection of fallen fruits and burying them at a depth of not less
than 2 metres. Similarly, bagging to lower insect and disease damage in fruits is effective but requires a
lot of labour hence may not be practical to ordinary farmers. Given these challenges, farmers either
leave the fruit trees to nature or apply local knowledge that is not validated e.g. use of cow dung or
brewers waste.
c) Lack of practical solutions
Interactions with scientists and researchers revealed a general lack of practical solutions for management
of key pests and diseases. Weak linkages between the National Agricultural Research Organisation
(NARO) and international capacity further contribute to the challenge of lack of practical solutions.
Researchers interviewed indicated that solutions to some of the pest problems may exist elsewhere
especially for management of introduced pests. However, due to lack of effective linkages, such solutions
are not always brought to the table. Similarly, the lack of adequate research staff and infrastructure hinders
investigations into emerging problems to develop appropriate solutions in a timely manner. Successful
linkages have been recorded in the management of cassava green mite and cassava mealy bug
employing classical biological control using natural enemies already developed by the International
Institute for Tropical Agriculture (IITA) in West Africa.
Platform for Agricultural Risk Management | Crop pests and disease management in Uganda: status and investment needs
34
Full Report | October 2016
2.3.3 Counterfeit chemicals
The looming challenges in the management of pests and diseases, particularly the lack of harmonized
pest and disease control programmes, limited feasible pest management options, and inadequate
extension services, have led to the reactive use of pesticides for pest control. This has provided fertile
ground for increasing illegal imports of pesticides, proliferation of unlicensed dealers, and high incidence of
counterfeit inputs. It has been reported that the probability of buying fake seed or fake pesticides in
Uganda is high. Counterfeits and fake agro chemicals account for 10% to 15% of the national
agrochemicals in the market valued at U$ 6 million per year (ASARECA, 2010). Counterfeit pesticides
coupled with poor application methods by farmers (either poor equipment, poor dosage, non-selective
application of pesticides) have led to pesticide resistance in some instances. This means that certain pests
cannot easily be managed by existing pesticides in the market. For example, studies in Uganda have
demonstrated the development of resistances by some strains of Phytophthora infestans (late blight of
potato) to Metalaxyl fungicide (Mukalazi et al., 2001).
Inadequate registration and limited enforcement of pesticide regulation have largely contributed to this
situation. Respondents indicated that MAAIF has limited capacity and vigilance to enforce compliance of
chemical standards. Much as MAAIF is expected to register agro-input dealers, just a fraction is registered.
The number of agro-dealers in Uganda has increased rapidly since 2002, rising from 100 to around 2500
by 2012 (ASHC profile of Uganda, pers comm.). A total of 800 were registered with MAAIF. The other
unregistered agro-dealers operate in different capacities and sometimes they may also deal with a variety
of commodities other than agro-inputs. These unlicensed dealers are also unlikely to have the requisite
knowledge to correctly inform farmers what the appropriate pesticides to use are and how to use them
safely, besides having knowledge of chemicals themselves (including ability to check for authenticity of
inputs from suppliers). It was also noted that penalties given to unscrupulous traders are too minimal and
not biting. For example, the current penalty if caught dealing in fake chemicals is UGX 50,000 (approx.
USD15), which is too small given the value of chemicals, and losses fake chemicals create. Further,
conflicting mandates between various government agencies - National Environment Management
Authority (NEMA), Uganda National Bureau of Standards (UNBS), National Drug Authority (NDA), and
MAAIF as regards pesticides monitoring and management, has caused ineffective monitoring due to
unclear responsibilities (MAAIF, 2014).
Limited knowledge on the side of farmers on quality pesticides and effective application is also an
increasing challenge. Farmers easily pay for the fake/adulated inputs because they are not aware of
quality and also because they are more affordable. The cost of genuine inputs is prohibitively high. This
was attributed to the high tax regimes but also the government policy of liberalization in which government
withdrew from pest and disease control. In terms of effective application, the proportion of farmers using
recommended personal protective equipment while handling pesticides is very low and exposure to
hazards is amplified given that some farmers allow their children to do the spraying. In some cases
farmers use inappropriate spray equipment and wrong dosage. This chemical misuse leads to pesticide
resistance.
2.3.4 Poor quality seed
The seed industry in Uganda is increasingly under scrutiny for selling and distributing poor quality seed
and planting material. It is important that seed put on the market is free of pests, diseases and obnoxious
weeds. Ideally, under the MAAIF structure, all commercial seed should be inspected and certified. Seed
producers are expected to submit planting returns at the onset of the season and MAAIF schedules
inspections, at least three times during the season (in field and post-harvest). MAAIF then issues seed
labels corresponding to the amount of seed each company has produced that meet quality standards.
Seed testing and post control checks are also supposed to be undertaken to ensure seed on the market
meets the quality standards. However, seed inspection and certification has not adequately been done by
MAAIF due in part to inadequate inspection staff to cover the entire country, inadequate logistics for
inspection and seed testing, and limited enforcement of by-laws related to seed counterfeiting. This gap in
inspection and certification contributes to the proliferation of fake seed and unscrupulous seed dealers on

Platform for Agricultural Risk Management | Crop pests and disease management in Uganda: status and investment needs
35
Full Report | October 2016
the market.
Again the quest for quality seed by farmers that is by far not met by formal seed enterprises has partly
contributed to increasing fake seed trade. Unscrupulous seed merchants just colour any grain to look like
certified seed and sell it to unsuspecting farmers who are not able to tell the difference between good
quality and fake seed, except by the colour. Part of the solutions to address the unmet seed demand has
been the focus on community seed multiplication by some of government efforts and some NGOs.
Integrated Seed Sector Development (ISSD), (an initiative led by Centre for Development Innovation (CDI)
part of Wageningen University and the Royal Tropical Institute in Netherlands) has championed seed
entrepreneurship in Uganda where groups of small-scale market-oriented farmers are organised and
employed in seed production and marketing, having access to research, extension, quality assurance,
finance and a market. Seed entrepreneurs produce quality seed of various crops that are locally
demanded, adaptable to local conditions and have market potential. These approaches provide farmers
with alternative sources of good quality seed. The seeds and plant act 2006 recognises different types of
seed, including standard seed – “any seed which is not grown under a certification program but which may
enter the market in case of certified seed shortage and which meets the same laboratory seed testing
standards as certified seed”. In other instances, this type of seed has been labeled Quality Declared Seed
whose promotion has yielded positive results in increasing farmers’ access to quality seed (see box 2.1 for
QDS example in Tanzania). In Uganda, HE the President launched the QDS label in July 2016, implying
that it can now be officially used. However, the QDS systems still needs further development, including
training a cadre of QDS inspectors – work has been initiated under the ISSD programme – though still
limited to a few districts.
Besides, there is lack of standards relating to planting material for vegetatively propagated crops such as
cassava, sweet potato and Irish potato. With the current shortage of planting materials in key production
zones for these crops, there has been massive movement of planting materials, even under government
programmes – NAADS and operation wealth creation (OWC), and NGOs within country. It is indicated that
such materials have been produced following guidelines for quality seed production and ideally have to be
inspected by the DPO or ZARDI officials before they are distributed as seed. But the fact that there are no
written standards on quality of such materials, this largely remains a claim. Also from interviews with key
informants at district level, planting materials are not well inspected, if at all it’s done, before distribution.
Two issues then emerge here - the existence and implementation of certification measures, and effective
enforcement of regulation. Better regulations undoubtedly would lead to cleaner planting material,
contributing to pest management. Given the current capacity gaps in MAAIF, strengthening capacity of
district agricultural personnel and delegating to them some of the inspection activities could go a long way
in ensuring routine inspections. Approval and implementation of quality declared seed (QDS) system or
standard seed, along with standards, is also a viable strategy for ensuring farmers have access to quality
seed at local level, particularly of crops that are of less interest to formal enterprises e.g. beans, ground
nuts, millet etc.
Box 2.1: Promoting seed entrepreneurship in Tanzania, the case of QDS system
In Tanzania, existing quality assurance mechanisms include; quality declared seed (QDS), certified seed
and specialized (non-certified) seed. Certified and specialized seed are generally applied to commercial
seed especially of high value crops and hybrids. A QDS production system was introduced by the
government in Tanzania, with support from the Danish Government in 2000, a modification of the FAO
QDS. QDS was incorporated into the formal seed system in the national Seeds Act of 2003, along with
its seed rules, regulations & procedures (2007) and Guidelines for control (2007) for the QDS
production. The type of seed produced is usually for crops/varieties that have not gained accessibility to
the area as certified grades, and/or open pollinated varieties.
QDS helps to address the gap between the formal and informal seed systems. Review of QDS in

Platform for Agricultural Risk Management | Crop pests and disease management in Uganda: status and investment needs
36
Full Report | October 2016
Tanzania shows that it has played a key role is providing quality seed for crops that are not well
integrated into the commercial / certified seed system, and farmers in remote areas not well served by
the formal sector are able to access quality seed. QDS is produced by a registered, trained small scale
farmer or a group of small-scale farmers producing seed for their own use or for sale to the neighboring
farmers within the ward where the QDS is produced. Field inspections are done by the official seed
certification agency (10%) and Authorized District Seed Inspectors (90%), who are normally extension
workers from the Ministry of Agriculture, Food Security and Cooperatives (MAFSC). Discussions with
seed inspectors showed that QDS seed has generally been good and meets minimum quality standards.
They indicated that rejection rate has been less than 20% across the region. Rejected seed is usually
sold by farmers as saved seed at lower price than QDS. Source: Kansiime et al. (2015).
2.3.5 Poor farm level soil fertility and nutrient management
Soil nutrient depletion is wide spread in Uganda. This affects susceptibility of plants to insect pests by
altering plant tissue nutrient levels. Research shows that the ability of a crop plant to resist or tolerate
insect pests and diseases is tied to optimal physical, chemical and mainly biological properties of soils
(Altieri and Nicholls, 2003). On the other hand, farming practices, such as excessive use of inorganic
fertilizers, can cause nutrient imbalances and lower pest resistance. Farmers’ inability to adequately
manage soil fertility is in part due to limited resources but also due to limited awareness on fertility
management. This ties in again with limited extension to adequately address farmer production
constraints.
2.3.6 Other factors
Other factors contributing the pest problem include; climate change and lack of collective action.
a) Climate change
Climate change was also considered a key problem, but was mentioned as a phenomenon that was taken
for granted and hence took long to institute mitigation measures. Most respondents agreed that there a
number of pest problems that they observe today which have become more prevalent than they were in
the past. However, some attributed this to the open borders and lack of proper regulation of movement
crop products within the country rather than climate change.
b) Lack of collective action
Effective management of some pests requires concerted efforts and collective action. Collective action
ensures community wide management of pests, because if only a few farmers implement pest
management, their crops may still be infected as a result of poor practices their neighbors fields. For
example, banana xanthamonas wilt (see box 2.2) and coffee wilt diseases were to a large extent managed
due to community participation and vigilance. The current increasing spread of coffee twig borer could also
be attributed to lack of collective action, where some farmers manage their fields but get re-infestation
from neighboring unmanaged fields.
Box 2.2: Community awareness and collective action key to disease containment
Banana is a key strategic crop for Uganda both for food and income security. Emergence of and spread
of Banana Xanthomonas wilt (BXW) resulted in huge financial loses because the banana value chains
supports millions both directly and indirectly. Among the mitigation practices put in place by government
was to mobilise human and financial resources and conduct comprehensive campaigns for disease
awareness among key value chain actors and service providers. However, there was also investment to:
raise public awareness; provide community-level facilitation and; ensure information exchange and well-
defined reporting mechanisms were put in place. Robust diagnostic tools were developed including field

Platform for Agricultural Risk Management | Crop pests and disease management in Uganda: status and investment needs
37
Full Report | October 2016
diagnosis to ensure that farmers even in absence of extension officers could diagnose the disease. All
diagnostic tools developed were tested for field detection of BXW and fine-tuned for gender responsible
cultural control. Investments were also made in research to develop resistant varieties and/or selected
wilt-escaping genotypes through genetic transformation. At the local government level, effective
coordination mechanisms were put in place through stakeholder meetings, creation of platforms for BXW
control such as the Ankole Stakeholders Platform, and development of regional strategies for
containment. Farmers’ knowledge and skills for BXW management and other banana pests and
diseases were enhanced through field days and information campaigns. Local government capacities to
prevent and respond to banana pest and disease epidemics were developed particularly through
enforcement of bylaws. Similar strategies especially community awareness about disease identification
and management by cultural means were employed in the early 2000s for the effective management of
coffee wilt disease. Source: Kubiriba et al. (2012) and Nankinga and Okasaai (2005)

Platform for Agricultural Risk Management | Crop pests and disease management in Uganda: status and investment needs
38
Figura 2: Root causes contributing to the spread of pests and diseases
Spread through marketing
of infected seed and
produce
Limited general
surveillance/
early warning
Information to inform
decisions not adequate
Limited awareness
of product
standards
Limited enforcement
of material
movements
Not enough
county-staff
County staff
have no arrest
authority
Inadequate
diagnosis
Inadequate
diagnostic staff
Inadequate lab
equipment
Poor internal control Inadequate
border control
Only 5/30
Border posts
manned
Weak links
between DCP
extension
Clinics not
integrated
= Human resources constraint
= Other
Few plant
docs
New pests spread;
Pests not effectively
controlled
Phytosanitary regulations
Limited
staff
Outbreaks go
unnoticed
Few specific
surveys
Information system

Platform for Agricultural Risk Management | Crop pests and disease management in Uganda: status and investment needs
39
Figura 3: Root causes associated with poor farm level management of pests and diseases.
Lack of
awareness of
solutions
Poor farm level
management
Counterfeit
chemicals
Farmers
don’t seek
advice
Inadequate
testing facilities
at DCP
Limited
enforcement of
regulations
Limited border
control
Few
extension
staff
No solutions /
no practical
solutions
Extension staff
not aware of
solutions
Farmers
not reached
Inefficient
approaches
Farmers don’t
follow advice
Tired of
conflicting/poor
advice
Advice not
economically
viable
Contracted
testing prone to
manipulation
Land too
small
Poor
markets
Infrastructure
and staffing
poor
Lack of links to
international
capacity
Poor quality
seed
Inadequate
certified seed
Few MAAIF
inspectors
Inadequate
QDS
inspectors
Penalties too low /
poor or fake seed
not destroyed
Inputs not
accessible
Formal
certification
expensive
QDS not
well
developed
Pesticide regulation Seed regulationMarkets Advisory services
Pests not effectively
controlled

Platform for Agricultural Risk Management | Crop pests and disease management in Uganda: status and investment needs
40
Full Report | October 2016
2.4 Current pest management options
As noted, Uganda is vulnerable to pest and disease attack especially due to environmental conditions that
favour availability of crops in most parts of the region. The weather also favors favours the pests and
diseases. Virtually every crop is affected by pests and therefore requires some form of pest management
during cultivation. Some crop pests have largely been managed for example coffee wilt disease and
banana xanthomonas wilt, but new pests keep emerging for example the coffee twig borer. For cassava,
the problem has been the cassava mosaic disease, now the new challenge is the Brown Streak diseases.
Table 2.2 shows a summary of key crop pests and available pest management options.
Tabella 3: Major crop pests and diseases in Uganda and available management options
Crop Major Pest/Disease Available management options
Coffee Coffee wilt disease [CWD]) · Uproot and burn infected coffee trees (together with neighbouring trees) on site as soon as symptoms appear · If more than 70% of coffee trees are affected uproot and burn all coffee trees in the farm and replant with resistant/tolerant coffee germplasm · Restrict movement of infected planting materials, coffee husks and soil · Disinfect farm tools that have been used in an infected garden using flames or Jik solution (5%). · When pruning or handling plants, start with the healthy looking plants first · Avoid wounding of plants e.g. during weeding · Plant resistant varieties · A fallow period of 6 months to 2 years before replanting with susceptible coffee seedlings · Chemical control is difficult but painting cut stem and braches with copper-based fungicides (e.g. copper oxychloride solution) may reduce infection
Coffee leaf rust [CLR) (H. vastatrix Berk. and Br.)
· Cultural strategies include; open pruning to reduce humid conditions; regular stumping; good weeding and soil fertility management to ensure strong and healthy trees · Supplement cultural practices by applying copper-based fungicides (2.5g per litre of water) every 3 weeks starting at the onset of rains for a maximum of 5 sprays per season · Alternatively, apply curative or systemic fungicides; spray the underside of the leaves as well.
Coffee berry disease [CBD] · Plant tolerant varieties e.g. SL14 · Practice good field hygiene including: regular harvesting all ripe cherries; removing all remaining dried or ripe cherries from the tree or the ground at the end of the harvest; pruning coffee and shade trees to reduce humidity levels · Improving soil fertility management · Spray with copper-based fungicides such as Copper Nordox 75% (140g/CP20) – at the onset of rain in a well pruned and weeded garden at 4 week intervals
Black Coffee twig borer [BCTB] (Xylosandrus compactus (Eichhoff))
· Regularly monitor fields for infestation · Field sanitation; trim off and burn infected branches; clean weeding; stump coffee trees if infestation is high; reduce excess shade · For heavily affected fields beyond 15% infestation, encourage farmers to seek expert advice from extension staff · Advise your neighbours to also control BTB to prevent re-infestation of your field · Use of adequate fertilizer and irrigation to ensure vigorous plants can speed recovery from pruning injury · Spray infested field with Imax (Imidacroprid) pesticide at 4mls/ litre of water
Banana (Musa spp.)
Bacterial Xanthomonas wilt [BXW] (Xanthomonas campestris pv musearum)
· Early removal of male buds i.e. appx 2 weeks after emergence of the inflorescence & disinfection of cutting tools · Use clean planting material e.g. cultivars Mpologoma, Atwalira, Kisansa, Gonja, Kabana 3 (FHIA 17) & FHIA 25 o Combination of cultural practices: desuckering, monocropping, weeding, de-trashing, manure application, mulching & soil/water conservation
Panama disease or Fusarium wilt (Fusarium oxysporum f.sp cubense)
· Sanitary practices: removal of affected plants; providing adequate drainage; composting household refuse prior to its application to soil · Use of pathogen-free planting material in disease free soils
Black sigatoka or black leaf streak (Mycosphaerella fijiensis)
· Use of resistant cultivars e.g. FHIA 01, FHIA 03, FHIA 17 and FHIA 23 hybrids · Cultural practices that reduce humidity in the field e.g.: correct spacing or plant density; good field sanitation; absence of weeds; and good drainage · Good fertilisation of banana plants reduces the impact of diseases through an increase in the rate of leaf production from photosynthesis.
Banana weevil (Cosmopolites sordidus)
· Field sanitation e.g. destruction of crop residues · Plant healthy planting material which do not any visible tunnels · Hot water treatment of clean trimmed suckers to kill eggs and grubs · Applications of neem powder to reduce weevil numbers

Platform for Agricultural Risk Management | Crop pests and disease management in Uganda: status and investment needs
41
Full Report | October 2016
Crop Major Pest/Disease Available management options
· Use appropriate insecticides at time of planting to reduce weevil numbers
Cotton African bollworm (Helicoverpa armigera)
· Trap cropping/intercropping with marigold (cv. Golden Age) reduces both eggs and larvae of the African bollworm · Use neem tree (Azadirachta indica) extract as spray and other organic pesticides · Pheromone traps
Cassava (Manihot esculenta)
Cassava brown streak disease [CBSD]
· Use only healthy and disease free cuttings for planting · Plant tolerant/resistant varieties e.g. NASE 12 · Remove and destroy any plants with symptoms of the disease including alternative hosts · Early harvesting · Disease surveillance & quarantine · Control of whiteflies (insect vector)
Cassava mosaic disease [CMD] · Inspect plants regularly for symptoms of disease and remove (roguing) and destroy any plant showing symptoms · Use resistant varieties e.g. ‘Rwizihiza’, ‘Ndamirabana’, ‘Cyizere’, ‘Seruruseke’, ‘Mavoka’, ‘Garukunsubir’ and ‘Mbakungahaze’ · Use clean planting materials and avoid planting cuttings from plants showing symptoms of the disease
Cassava bacterial blight [CBB], (Xanthomonas axonopodis pv. manihotis)
· Crop rotation with non-host · Intercropping with maize and melon · Field sanitation: plough crop debris into soil after harvest or remove and burn, pruning infected parts of the plant · Use clean planting cuttings obtained only from healthy plants
Cassava green mite (Mononychellus tanajoa, M. progresivus)
· Together with Cassava mealy bug (Phenacoccus manihoti), the green mite has been effectively controlled using biological control (Typhlodromalus aripo) · Crop rotation, early planting, and intercropping
Maize Maize Lethal Necrosis (MLND) · Use certified seed of tolerant maice varieties eg BAZOOKA (UH5354) · Avoid using home saved seed from previously infested MLN fields and seed from unknown sources eg local markets or country boundary seed exchange · Ensure proper soil fertility is maintained through use of manure and inorganic fertilisers · Avoid planting maize near crops in the grass family eg sorghum, millet, nappier. These are alternative hosts to MLN transmitting insects · Crop rotation with potato or common legumes to reduce disease incidence built up during previous season · Field sanitation – removal of weeds, volunteer maize crops · Uproot and burn MLN infected maize crops
Maize streak virus · Grow resistant maize lines
Larger Grain Borer · Mainly a storage pest and sources of infestation include; cross infestation from neighboring lots of stores; migration from waste or rubbish; hiding places in stores e.g. cracks; use of infested bags; and introduction of infested lots. · Cultural management practices; good store hygiene; removing and burning infested residues; immersing grain sacks in boiling water; fumigating the store to eliminate residual infestations; selection of only uninfected material for storage · Harvesting the maize as soon as possible after it has reached maturity will reduce the chances of attack by LGB and other storage pests. · Use of resistant cultivars · Chemical control using synthetic pyrethroid insecticides such as permethrin and deltamethrin. Only for grain that will be stored for long
Striga · Seed treatment with herbicide (Imazapyr) · Incorporate soil fertility practices such as use of legume rotation and intercrops and fertiliser additions to replenish soil nutrients and optimise crop yields.
Aflatoxins · Use healthy improved and early maturing seed varieties · Dress seeds with appropriate agro-chemicals before planting · Maintain at least 2 years of crop rotation in order to reduce the build-up of Aflatoxin producing fungi · Avoid using farm from which maize, cotton, tobacco and tomatoes, have just been harvested – these crops are susceptible to soil borne Aflatoxin producing fungi · Control soil inhabiting insects such as termites · Harvest the crop at right maturity and maintain the right moisture content · Grain infested by fungi should not be used as feed or food.
Rice Bacterial blight · Resistant varieties · Cultural practices – burn crop residue after harvesting heavily infested fields, destroying the surrounding weeds that serve as a reservoir of the pathogen, and management of fertilizers, particularly nitrogen

Platform for Agricultural Risk Management | Crop pests and disease management in Uganda: status and investment needs
42
Full Report | October 2016
Crop Major Pest/Disease Available management options
Beans Angular leaf spot Bean rust
· Often, angular leaf spot and bean rust occur simultaneously (Paparu et al. (2014) · Can be controlled using fungicides, resistant varieties, biological control and cultural practices such as intercropping, crop rotation, optimum plant spacing and use of soil amendments that promote soil health and plant nutrition (Pamela et al., 2014) · Use of fungicide in Uganda is however limited to beans with high commercial value e.g. snap beans
Potato Ralstonia · Also affects tomato, eggplant, nightshade and other solanacea plants · Use clean planting material · Organic matter amendments, such as plant residue, animal waste, and simple organic compounds, have been reported to suppress bacterial wilt diseases · Biological control agents e.g. R. solanaceurum, Pseidomonass spp, Bacillus spp, and Streptomycetes spp
Fruit and veg Tuta Absoluta(tomato) · Using pheromone traps (Tutrack) and/or sticky traps · Chemical management e.g. chlorantraniliprol at a rate of 2ml in 20 litres of water, sprayed each time the pest is observed · Crop rotation with non-solanaceous crops · Field sanitation – remove and destroy crop residue and affected crops · Farmers in the area should comply with crop rotation ie have a season when there is not tomato growing · Plant pest free seedlings
Fruit fly (mango) · Bagging (put a single fruit in a bag) · Collecting fallen fruits and burying them. Should be buried to a depth of not less than 2m · Use of pheromone traps
False codling moth (capsicum) · Has a wide range of hosts- cotton, coffee, citrus, maize, sorghum, pineapple etc. so chemical control may not be feasible · Use cultural practices - destroy affected plants, use clean planting materials · Monitor fields for signs on pest · Avoid moving infected plant parts from one farm to another · Farmers advised not grow capsicum in a field where tree crops such as citrus, coffee have previously been affected by the moth

Platform for Agricultural Risk Management | Crop pests and disease management in Uganda: status and investment needs
43
Full Report | October 2016
3. Legal and institutional framework for pest management
3.1 Relevant legal documents
3.1.1 National Development Plan
The second national development plan (NDPII) covers the period 2015/16 to 2019/20. Agriculture is one of
three prioritised areas (along with tourism and minerals, oil and gas). Although growth during the first
national development plan was only around 1% per annum, attributed to a range of factors including crop
pests and diseases, in line with the Comprehensive Africa Agriculture Development Programme (CAADP),
the sector is seen as critical to economic development. Infrastructure development and human capital
development are also prioritised as fundamental to growth and the goal of achieving middle income status
by 2020.
In agriculture 12 value chains are prioritised for investment (Cotton, Coffee, Tea, Maize, Rice, Cassava,
Beans, Fish, Beef, Milk, Citrus and Bananas), 7 of which are crops, including the four which are reported
by MAAIF as suffering the highest monetary loss due to pests (banana, cassava, cotton and coffee). For
these 12 value chains, emphasis will be on the following:
strengthening agricultural research and implementing the single spine extension system
technology adaptation at the farm level
increasing access to and effective use of critical farm inputs
promoting sustainable land use and soil management
increasing access to agricultural finance with specific options for women farmers
strengthening agricultural institutions for effective coordination and service delivery
Key interventions planned for agriculture are in Table 3.1. While only one intervention refers directly to
pests (1(vii) – control pests, diseases and vectors), a number of the others will affect how pests are
controlled:
1(i) refers to ecologically sound technologies and practices, which could include Integrated Pest
Management (IPM), although IPM is never mentioned.
Two interventions (1(iii) and 3(ii)) refer to quality standards, market requirements, regulation and
safety standards, all of which are related to pest management, particularly the level of use of
pesticides
A number of interventions concern the provision of information (1(ii), 4(iii), 4(v) and other services (2(i-
iv)) to farmers, which can affect how pests are managed
The promotion of investment in storage infrastructure to reduce post-harvest losses (2(iv)) will affect
management of stored product pests.
Elsewhere in the NDP it is said that a national regulatory mechanism consistent with the World Trade
Organisation (WTO) Sanitary and Phytosanitary (SPS) Agreement will be established, which would include
phytosanitary issues for which DCP is responsible.
Tabella 4: Interventions under the Agriculture Objective in the NDPll
Objective (Agriculture) Interventions
1. Increase agricultural production and
productivity.
i. Strengthen ecologically sound agricultural research and climate change resilient
technologies and practices.
ii. Implement the Single Spine Agricultural Extension system while promoting gendered
innovation in agricultural research centres and extension services.
iii. Strengthen quality assurance, regulation and safety standards for agricultural products.
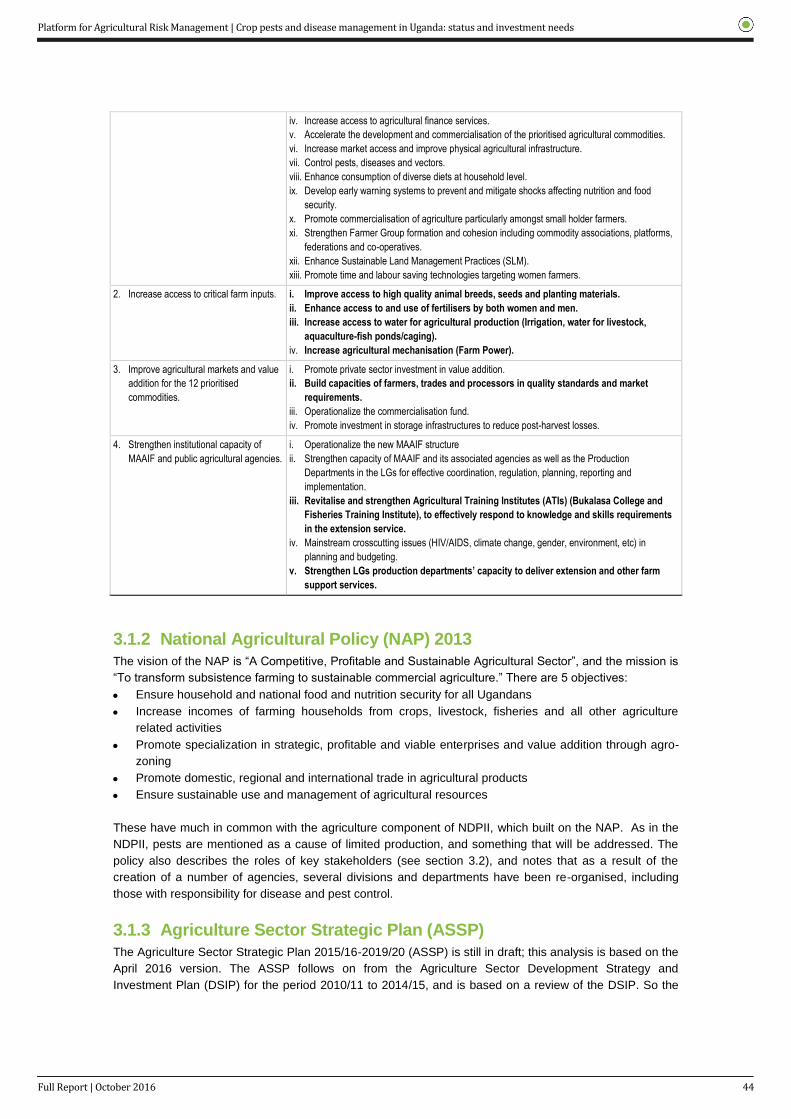
Platform for Agricultural Risk Management | Crop pests and disease management in Uganda: status and investment needs
44
Full Report | October 2016
iv. Increase access to agricultural finance services.
v. Accelerate the development and commercialisation of the prioritised agricultural commodities.
vi. Increase market access and improve physical agricultural infrastructure.
vii. Control pests, diseases and vectors.
viii. Enhance consumption of diverse diets at household level.
ix. Develop early warning systems to prevent and mitigate shocks affecting nutrition and food
security.
x. Promote commercialisation of agriculture particularly amongst small holder farmers.
xi. Strengthen Farmer Group formation and cohesion including commodity associations, platforms,
federations and co-operatives.
xii. Enhance Sustainable Land Management Practices (SLM).
xiii. Promote time and labour saving technologies targeting women farmers.
2. Increase access to critical farm inputs. i. Improve access to high quality animal breeds, seeds and planting materials.
ii. Enhance access to and use of fertilisers by both women and men.
iii. Increase access to water for agricultural production (Irrigation, water for livestock,
aquaculture-fish ponds/caging).
iv. Increase agricultural mechanisation (Farm Power).
3. Improve agricultural markets and value
addition for the 12 prioritised
commodities.
i. Promote private sector investment in value addition.
ii. Build capacities of farmers, trades and processors in quality standards and market
requirements.
iii. Operationalize the commercialisation fund.
iv. Promote investment in storage infrastructures to reduce post-harvest losses.
4. Strengthen institutional capacity of
MAAIF and public agricultural agencies.
i. Operationalize the new MAAIF structure
ii. Strengthen capacity of MAAIF and its associated agencies as well as the Production
Departments in the LGs for effective coordination, regulation, planning, reporting and
implementation.
iii. Revitalise and strengthen Agricultural Training Institutes (ATIs) (Bukalasa College and
Fisheries Training Institute), to effectively respond to knowledge and skills requirements
in the extension service.
iv. Mainstream crosscutting issues (HIV/AIDS, climate change, gender, environment, etc) in
planning and budgeting.
v. Strengthen LGs production departments’ capacity to deliver extension and other farm
support services.
3.1.2 National Agricultural Policy (NAP) 2013
The vision of the NAP is “A Competitive, Profitable and Sustainable Agricultural Sector”, and the mission is
“To transform subsistence farming to sustainable commercial agriculture.” There are 5 objectives:
Ensure household and national food and nutrition security for all Ugandans
Increase incomes of farming households from crops, livestock, fisheries and all other agriculture
related activities
Promote specialization in strategic, profitable and viable enterprises and value addition through agro-
zoning
Promote domestic, regional and international trade in agricultural products
Ensure sustainable use and management of agricultural resources
These have much in common with the agriculture component of NDPII, which built on the NAP. As in the
NDPII, pests are mentioned as a cause of limited production, and something that will be addressed. The
policy also describes the roles of key stakeholders (see section 3.2), and notes that as a result of the
creation of a number of agencies, several divisions and departments have been re-organised, including
those with responsibility for disease and pest control.
3.1.3 Agriculture Sector Strategic Plan (ASSP)
The Agriculture Sector Strategic Plan 2015/16-2019/20 (ASSP) is still in draft; this analysis is based on the
April 2016 version. The ASSP follows on from the Agriculture Sector Development Strategy and
Investment Plan (DSIP) for the period 2010/11 to 2014/15, and is based on a review of the DSIP. So the

Platform for Agricultural Risk Management | Crop pests and disease management in Uganda: status and investment needs
45
Full Report | October 2016
ASSP, NAP and NDPll have much in common.
In general the performance of the agriculture sector over the period of the DSIP was disappointing.
Productivity of some crops increased only slightly, while for others productivity actually declined. The
review highlighted some success. In the area of pest management progress was made in developing
policies (mainly the Plant Protection and Health Act), resulting, it is claimed, in improved control of pests,
vectors and diseases, although no evidence is presented. The review also found that continuous
countrywide forecasting of crop pest and diseases was undertaken, and that the capacity of the MAAIF
laboratory technicians was strengthened for diagnosis of pests and diseases. Furthermore it is stated that
a robust post-entry quarantine regime to handle dangerous pests, diseases and weeds was established at
various border posts.
Despite these successes, a high prevalence of pests and diseases is cited as a serious constraint,
examples mentioned in the plan coffee wilt disease, banana xanthomonas wilt, cassava brown streak
virus, fruit flies and citrus canker, all pests of the priority crops. One of the lessons from DSIP was that new
and emerging pests and diseases are serious impediments to production, and by implication the ability to
respond effectively to such pests will be necessary to achieve the ASSP targets.
The ASSP vision is ‘A competitive, profitable and sustainable sector’. Its mission is ‘Transforming the
sector from subsistence farming to commercial agriculture’. In contrast to the sluggish performance over
the last 5 years, the goal is an average growth rate of 6% per year over the period of the plan. The ASSP
has four strategic objectives:
a) Increasing agricultural production and productivity;
b) Increasing access to critical farm inputs;
c) Improving agricultural markets and value addition; and
d) Improving service delivery through strengthening the institutional capacity of MAAIF and its agencies.
Crop protection largely falls under Objective 1, which aims to strengthen:
Generation and adoption of research technologies;
Provision of extension services: enhancing access to extension services through operationalisation of
the single spine agricultural extension system;
Control of pests, diseases and vectors among crops and animals by strengthening the institutional and
regulatory framework; strengthening the capacity of laboratories and disease control infrastructure;
and conducting market surveillance to rid the market of counterfeit agro-chemicals.
Box 3.1: Description of control of crop and livestock pests and diseases from ASSP
This action will encompass the following interventions.
a) Crop and livestock pests and disease control regulatory strengthening through formulating, reviewing
and operationalisation of supportive policies, legislation, standards and guidelines for pests, vectors
and disease control including data collection for informed policy analysis and planning. This will be
complemented with creation of awareness among the public on the new regulations to enhance
control and compliance. The target audience will include crop and livestock farmers, traders,
transporters, abattoir managers, law enforcement agencies, security personnel, DLG officials,
Uganda Revenue Authority (URA) personnel, consumers and the general public.
b) Conducting early detection of crop and livestock pests, vectors, weeds and diseases outbreaks and
timely reporting of crop pests, weeds and disease outbreaks is essential for rapid field investigations,
laboratory confirmation and prompt interventions to control them. Investments will target the
establishment of a functioning early warning and detection system for all outbreaks. This will involve
upgrading the surveillance systems using communities and modern technology, timely reporting of
diseases, vectors and pest outbreaks and conducting routine surveillance in addition to procurement
of appropriate agro-chemicals and equipment to address the outbreaks;
c) Establishing and maintaining functional crop and livestock pests and disease control infrastructure
through investments that will target establishment of functioning regulatory infrastructure needed for

Platform for Agricultural Risk Management | Crop pests and disease management in Uganda: status and investment needs
46
Full Report | October 2016
effective pests and disease surveillance and control. This will include laboratories, as well as other
appropriate infrastructure for enforcement e.g. that required at border posts;
d) Controlling crop and livestock pests, diseases and vectors to ensure that communicable diseases
are effectively managed in order to promote crop and livestock health as a means to higher
production, productivity and market penetration. Over the plan period, surveillance, prevention and
control measures will be implemented for each of the priority commodities and for the seven major
livestock diseases, namely: tsetse and Trypanosomiasis; east coast fever; foot and mouth disease;
rift valley fever; African swine fever; rabies; and animal brucellosis.
Crop and livestock pests and diseases are lumped together here, which is reasonable at the level of detail
in the ASSP, but clearly much more detailed plans will be needed where the two areas are separated. The
ASSP notes that a number of framework implementation plans (FIPs) were developed for the non-
commodity areas, including “one on research, extension and pests and disease control”, as well as
another on inputs (seeds, fertiliser, agricultural mechanisation and water). It is stated that the respective
Ministries, Departments, Agencies and local governments will also develop annual operational plans
(AOPs) for these areas that will be integrated into the National Agricultural Annual Operational Plan.
During this analysis, the FIP covering pest and disease control, was not seen but rather a draft report of
the thematic review on pest and disease control (MAAIF, 2015a). However, the draft was concerned
almost entirely with control of livestock pests and diseases, with very little on crop pests. It is not clear
whether this reflects what is in the FIP, or whether the DCP had not had chance to make its input into the
draft. In either case there is a need for more detailed planning for crop pest management.
In the budget crop and livestock pests are separated, as shown below in an extract from the budget (ASSP
Annex D). On the one hand a total of UGX 84bn for crop pest management over 5 years is a substantial
sum (approximately US$5m per year). However, in comparison with the amount for livestock pest and
disease control it is relatively small, comprising just 1.83% of the total ASSP budget compared to 6.39%
for livestock pests and diseases. While it may be more expensive to control livestock pests and diseases,
this seems disproportionate. Of the US$4bn agricultural exports targeted by 2019/20 (ASSP Annex C),
about 73% is from crops rather than livestock. Thus per dollar of targeted export value, the investment in
livestock pests and diseases is nearly 10 times the investment in crop pests and diseases.
Tabella 5: Extract of ASSP Budget (NDPII constrained version) covering crop and livestock pests and
diseases (figures in UGX billions)
There are some additional funds for activities related to crop pest and disease management elsewhere in
the budget. Table 3.3 below shows the main ones.
Budget line Year 1 Year 2 Year 3 Year 4 Year 5 Total
Outcome 1, Strategy 5: Control pests, vectors, diseases
Control of pests and diseases for crops
Crop pest and disease control regulatory strengthening 1.5 1.5 1.5 1.5 1.5 7.5
Conduct early detection and control of crop pests, weeds, diseases 4 4.4 4.84 5.32 5.86 24.42
Crop pests and disease control infrastructure 4 4 4 4 6 22
Banana bacterial wilt control 0.4 0.9 0.9 0.9 0.9 4
Management of coffee diseases and pests 4.93 4.93 4.93 4.93 6.9 26.6
Total for crop pests and diseases 14.83 15.73 16.17 16.65 21.15 84.52
Livestock diseases, vectors
Control livestock diseases and vectors 26.95 46.86 46.47 51.37 64.8 236.45
Policy and Regulatory Environment for Livestock desease control 2.81 2.26 1.62 1.66 1.73 10.08
Establish disease control infrastructure and operationalisation 6.6 10.29 9.9 9.07 13.16 49.02
Total for livestock pests and diseases 36.36 59.41 57.99 62.1 79.69 295.55
Grand total for Outcome 1, Strategy 5 51.18 75.14 74.15 78.76 100.85 380.07

Platform for Agricultural Risk Management | Crop pests and disease management in Uganda: status and investment needs
47
Full Report | October 2016
Tabella 6: Extract of ASSP Budget (NDPll constrained version) showing additional budgets related to crop
and livestock pests and disease (figures in UGX billions)
The FIP may include additional details on how crop protection activities might be financed on an ongoing
basis. Commercialised agriculture provides more opportunity for revenue collection, through general levies
as well as specific fees for crop protection related activities such as field inspections and the issue of
phytosanitary permits for consignments being exported. In some countries such fees are remitted to the
treasury, while in other countries at least a portion of the income generated by the phytosanitary service is
retained. Retention of the fees by the regulatory agency has some merits, although it can create a
perverse incentive to increase regulation, rather than decrease it to the minimum level necessary to
achieve public policy goals.
A specific case in which cost-sharing might be possible is when a new pest arrives in the country. This
needs discussing and agreeing as part of a contingency or emergency response plan, and in some
countries cost sharing arrangements are defined for different categories of pests in terms of where the
costs and benefits accrue. So for example, for a new pest affecting a crop predominately produced by
large scale commercial farmers, a higher proportion of the cost of the emergency response action would
be covered by the private sector than for a new pest that predominately affected smallholders.
3.1.4 The Plant Protection and Health Act, 2016
The preamble identifies the purpose of the new act:
Consolidate and reform the law relating to protection of plants against destructive diseases, pests and
weeds
Prevent the introduction and spread of harmful organisms that may adversely affect Uganda’s
agriculture, the natural environment and livelihood of the people
Ensure sustainable plant and environmental protection
Regulate the export and import of plants and plant products and introduction of new plants in
accordance with international commitments on plant protection
Protect and enhance the international reputation of Ugandan agricultural imports and exports
To entrust all plant protection regulatory functions to the government
These objectives are in line with the International Plant Protection Convention (IPPC), to which Uganda is
a contracting party. In particular, the convention requires contracting parties to nominate a National Plant
Protection Organisation (NPPO), and specifies the NPPO’s responsibilities (Box 3.2).
Box 3.2: Responsibilities of a National Plant Protection Organisation (from IPPC Article lV).
The issuance of certificates relating to the phytosanitary regulations of the importing contracting party
for consignments of plants, plant products and other regulated articles
The surveillance of growing plants, including both areas under cultivation (inter alia fields, plantations,
nurseries, gardens, greenhouses and laboratories) and wild flora, and of plants and plant products in
Budget line Year 1 Year 2 Year 3 Year 4 Year 5 Total
Outcome 1, Strategy 1
Characterizing plant and animal disease strains and agents 3.57 3.62 3.64 3.71 3.79 18.33
Release pest and drought resistant varieties/breeds 4.71 4.85 4.98 5.13 5.34 25.01
Outcome 1, Strategy 4
Control of the new breed of weed and water hyacinth 1.2 1.2 1.5 1.9 5.8
Outcome 2, Strategy 2
Improve phytosanitary control at entry points 0.74 1.04 0.24 0.24 0.24 2.5
Several crop-specific lines on planting material, eg
Distribution of quality clean pineapple seedlings tolerant to P&D 0.9 0.9 0.9 0.9 0.9 4.5

Platform for Agricultural Risk Management | Crop pests and disease management in Uganda: status and investment needs
48
Full Report | October 2016
storage or in transportation, particularly with the object of reporting the occurrence, outbreak and
spread of pests, and of controlling those pests, including the reporting referred to under Article VIII
paragraph 1(a)
The inspection of consignments of plants and plant products moving in international traffic and, where
appropriate, the inspection of other regulated articles, particularly with the object of preventing the
introduction and/or spread of pests
The disinfestation or disinfection of consignments of plants, plant products and other regulated articles
moving in international traffic, to meet phytosanitary requirements
The protection of endangered areas and the designation, maintenance and surveillance of pest free
areas and areas of low pest prevalence
The conduct of pest risk analyses
To ensure through appropriate procedures that the phytosanitary security of consignments after
certification regarding composition, substitution and reinfestation is maintained prior to export
Training and development of staff
The Act addresses all these issues, with the exception of training and development, although that would
not necessarily appear in such an act. However, while the Act does align the plant protection institutional
framework with the IPPC, it is noted that there are some slight inconsistencies.
The definitions provided in the Act have some small but potentially significant differences from the
definitions provided by the IPPC (in ISPM5, Glossary of terms). Table 3.4 shows the IPPC definition of
Quarantine, which is the official confinement of regulated articles. The IPPC defines a regulated article
(see Table 3.4), while the Act does not, but instead spells out the items in the definition of quarantine.
However, the list of items is narrower than that included in the definition of regulated article; for example,
conveyances is included in “regulated items”, but not listed in the Act’s definition of quarantine. However,
paragraph 16 of the Act is titled Conveyance, and the provisions would allow it to treat a conveyance as a
regulated article for quarantine purposes.
A related example is in the definition of a quarantine pest. The IPPC definition includes a pest present in
the country, not widely distributed, and being officially controlled. In contrast the definition of a quarantine
pest in the Act is very similar but includes pests not widely distributed but being actively controlled, a
broader definition than the IPPC’s, given the definition of official control (see table 3.4). However, in
paragraph 20(d) the Minister is empowered to declare a pest to be a quarantine pest “if it presents or is
likely to present a threat to the production of or trade in plant materials or the natural environment, and if is
either not known to be established in Uganda, or is established in Uganda but is the subject of measures
for its eradication or containment”. This is nearer to the IPPC meaning of “official control”, though here the
distribution of the pest has not been mentioned as it is in the IPPC definition.
Tabella 7: Some definitions from the IPPC Glossary and the Plant Protection and Health Act
Term IPPC Glossary (ISPM5) Plant Protection and Health Act
Official control The active enforcement of mandatory phytosanitary regulations and the application of mandatory phytosanitary procedures with the objective of eradication or containment of quarantine pests or for the management of regulated non-quarantine pests
Not defined
Quarantine Official confinement of regulated articles for observation and research or for further inspection, testing or treatment
Official confinement of plants and plant products, organisms harmful to plants, beneficial organisms, goods or soil being imported into or exported from Uganda, subject to phytosanitary regulations, for observation and research, for further inspection and or testing
Quarantine pest
A pest of potential economic importance to the area endangered thereby and not yet present there, or present but not widely distributed and being officially controlled
A pest of potential national economic importance to the country endangered by such pest, and not yet present there, or present but not widely distributed and being actively controlled

Platform for Agricultural Risk Management | Crop pests and disease management in Uganda: status and investment needs
49
Full Report | October 2016
Regulated article
Any plant, plant product, storage place, packaging, conveyance, container, soil and any other organism, object or material capable of harbouring or spreading pests, deemed to require phytosanitary measures, particularly where international transportation is involved
Not defined
These inconsistencies should not normally prove problematic, although it is possible that should a trade
issue arise, they could confuse rather than help clarify the situation.
This act repeals the Plant Protection Act, although regulations, notices etc. made under that act remain in
force until revoked or amended, and provided they are consistent with the provisions of the new act. A set
of new regulations for implementation of the Act is in draft. An important feature of the Act is that it
provides wide-ranging powers to the Minister, Commissioner for Plant Protection, and inspectors. In
principle this should make it easier to take the necessary action to respond to new pests.
The Act also appears to provide for the regulation of biological control agents. Paragraph 9 empowers the
Minister to make rules for preventing and controlling pest attacks and spread on a number of matters
including (para. 9n) “the use of animals, plants or micro-organisms for combating specified harmful
organisms”. Biological control, in various forms, is a critical approach for sustainable pest management,
and it is important that the regulatory environment, while ensuring it is used safely, does not unnecessarily
hinder its application.
It should be noted that the IPPC aims to prevent the introduction and spread of new pests, i.e. quarantine
pests. It is not about the management of established and widely distributed pests that are not under official
control, even though such pests can be extremely important in terms of damage and control costs.
Although the Act is particularly concerned with issues covered by the IPPC, it does address non-
quarantine/unregulated pests. For example paragraph 13, on Contingency measures for the containment
of outbreak of pests, empowers the Minister to bring into force the rules under Paragraph 9, to contain the
outbreak. The Act’s definition of “outbreak pests” clearly includes non-quarantine pests.
Thus although the responsibilities of DCP (as Uganda’s NPPO) listed in Box 3.2 are critical, and are in
Uganda’s own interest as well as that of the global community, they only form part of its work. This is
reflected in the fact that other legislation (see below) assigns responsibilities to DCP that do not fall within
the ambit of the IPPC. This is a common situation in many countries, and is not seen as an impediment to
managing pests.
Paragraph 7 is potentially very important – the appointment by the Minister of a Plant Protection and
Health Technical Committee to advise him or her on all technicalities arising from the administration of the
Act, and on any other related issues. The composition is given in Box 3.3; while good reason can be given
for all the listed members, it is noted that only 2 of the 16 members are from the private sector, and one
from civil society; the rest are government officials. However, the committee may co-opt members as it
thinks fit. It is not known whether the committee is functioning yet, and if so, with what effect.
Box 3.3: Members of the Plant Protection and Health Technical Committee
The Commissioner for Crop Protection
The Principle Inspector who shall be the secretary
An entomologist
A plant pathologist
A forest officer
One person to represent the Farmers’ Associations
One person to represent the Agricultural Exporters or Importers organisations
One scientist to represent the National Environment Management Authority
One scientist to represent the Uganda National Council for Science and Technology
One scientist to represent the Agricultural Research Organisation

Platform for Agricultural Risk Management | Crop pests and disease management in Uganda: status and investment needs
50
Full Report | October 2016
One officer to represent the Uganda Revenue Authority
One officer to represent the Uganda National Bureau of Standards
One member of the Uganda Consumer Protection Association
A representative of the Ministry responsible for Trade and Industry
A representative of the Attorney General
Ministry responsible for Trade and Industry
One officer to represent the Uganda National Bureau of Standards
3.1.5 The Agricultural Chemicals (Control Act) 2006
This act is to control and regulate agricultural chemicals including all sorts of pesticides, fertiliser, growth
regulators, wood preservatives, bio-rationals (potent plants, parts of plants or chemical extracts of plant
origin), biopesticides, bio-fertilisers or any other chemicals used for promoting and protecting the health of
plants.
The Act is administered through an Agricultural Chemicals Board, appointed by the Minister, comprising 10
members and 10 more ex-officio members including the Commissioner for Crop Protection, and a
Registrar from MAAIF who acts as the secretary. The functions of the board are to ensure that regulations
on the manufacture, storage, distribution and trade in, use, importation and exportation of agricultural
chemicals are made and followed. The board advises the minister on applications for registration and
licenses, on policies for safe use, storage and disposal of agricultural chemicals including public
awareness campaigns, and on enforcement of regulations. The Board receives technical advice from a 15-
person Agricultural Chemicals Technical Committee. The Act also confers powers on inspectors regarding
monitoring and enforcing conformity with the Act and its regulations.
Thus as would be expected from such an act, there is appropriate control over the use of pesticides and
other agrochemicals. However, the supporting regulations can have a significant effect on the way in which
pesticides are used. The regulations regarding registration have not been seen, but we understand that
the Board has discretionary powers, for example in granting specific producers a permit to import an
unregistered pesticide for use on the farm only. Such discretionary powers should be used to promote and
encourage investment in and marketing of lower risk products such as biopesticides. We have been told of
cases where permits for biological control agents have resulted in quite rapid registration, though we do
not know whether this is a frequent occurrence or not.
3.1.6 The Seeds and Plant Act 2006
This act provides for the promotion, regulation and control of plant breeding and variety release, and the
multiplication, conditioning, marketing, importing and quality assurance of seeds and other planting
materials. The Act is administered through the National Seed Board, comprising 9 members and 3 ex-
officio members including the Commissioner for Crop Protection. The Act also establishes a Technical
Committee which functions as the variety release committee, the secretary of which is the head of the
certification service.
The Act establishes the National Seed Certification Service in the Crop Protection Department, which is
responsible for the design, establishment and enforcement of certification standards, methods and
procedures. This includes licensing of seed merchants and dealers, seed conditioners, and seed exporters
and importers. The Act provides for different categories of seed to be defined in the regulations (which
have not been seen).
The Act appears to provide the necessary legal powers for effectively regulating the seed sector, though
as with control of agricultural chemicals, the difficulty is in implementation. The Department of Crop
Protection has many important tasks including providing the seed certification service, but it has
insufficient resources and capacity.

Platform for Agricultural Risk Management | Crop pests and disease management in Uganda: status and investment needs
51
Full Report | October 2016
3.1.7 Biosafety and biotechnology bill 2012
There has been much debate about the pros and cons of biotechnology, especially genetic modification.
This is relevant to crop protection because some of the most widely used modifications confer pest
resistance, and in Uganda a number of such traits have been engineered and tested. Enactment of the
Bill would provide the necessary regulatory framework for the commercialisation and release of these
materials, which would have substantial implication for the way in which pest problems are managed.
3.2 Stakeholders 3.2.1 MAAIF
MAAIF’s mandate is, “To promote and support sustainable and market oriented agricultural production,
food security and household incomes”, with functions as listed in Box 3.4.
Box 3.4: Functions of MAAIF (from ASSP).
e) Formulate, review and implement national policies, plans, strategies, regulations and standards and
enforce laws, regulations and standards along the value chain of crops, livestock and fisheries;
f) Control and manage epidemics and disasters and support the control of sporadic and endemic
diseases, pests and vectors;
g) Regulate the use of agricultural chemicals, veterinary drugs, biological, planting and stocking materials
as well as other inputs;
h) Support the development of infrastructure and use of water for agricultural production along livestock,
crop and fisheries value chains;
i) Establish sustainable systems to collect, process, maintain and disseminate agricultural statistics and
information;
j) Support provision of planting and stocking materials and other inputs to increase production and
commercialisation of agriculture for food security and household income;
k) Develop public infrastructure to support production, quality / safety assurance and value-addition
along the livestock, crop and fisheries commodity chains;
l) Monitor, inspect, evaluate and harmonize activities in the agricultural sector including local
governments;
m) Strengthen human and institutional capacity and mobilize financial and technical resources for delivery
of agricultural services;
n) Develop and promote collaborative mechanisms nationally, regionally and internationally on issues
pertaining to the sector.
MAAIF is divided into Directorates, including one on Crop Resources within which the Crop Protection
Department is situated. According to ASSP, MAAIF is implementing a new structure proposed in a 2010
review, which includes establishing new Departments of Crop Inspection and Certification (DCIC) and
Entomology. However, this process appears to be progressing slowly. At least some stakeholders are
uncertain as to its merit, and there is continuing discussion about the Department of Crop Inspection and
Certification (see further discussion below). A split of the DCP would necessitate amending the Plant
Protection and Health, and other Acts, to reassign the responsibility for certain activities which are
currently assigned to Commissioner of Crop Protection, to the Commissioner of the new department.
Nevertheless the ASSP says a Commissioner has already been appointed to the Department of Crop
Inspection and Certification.
MAAIF also has a number of agencies, having some roles and responsibilities in pest management:
National Agricultural Research Organisation (NARO) - for generation and dissemination of
technologies, knowledge and information related to pest management. Through its ZARDIs, NARO
implements outreach and partnership programmes to strengthen relevance and dissemination of
research products and services.
National Agricultural Advisory Services (NAADS), previously in delivery of advisory services – since

Platform for Agricultural Risk Management | Crop pests and disease management in Uganda: status and investment needs
52
Full Report | October 2016
2015 focus on input provision – particularly seed and planting materials. NAADS also supports
demonstrations on pest and disease control methods, provision of chemicals for control of pests and
diseases (particularly on mango and citrus), provision of clean planting materials e.g. tissue cultured
banana and verification of materials supplied by service providers in collaboration with DAOs, MAAIF
and OWC.
Uganda Coffee Development Authority (UCDA) for promotion of coffee development, also provides
farmer training and distributes clean coffee planting material. Pest management for coffee is primarily
done by UCDA, and MAAIF provides backstopping in case of coffee disease outbreaks.
Cotton Development Organisation (CDO) for promotion of cotton development, including pest and
disease management;
According to the MAAIF website, the current MAAIF HQ establishment has a total of 411 positions out of
which only 279 are filled.
3.2.2 Department of Crop Protection (DCP)
The structure of the DCP (Figure 3.1) is from the website of the IPPC; it is an obligation of contracting
parties to report on the structure of their NPPO. The structure reflects the responsibilities as assigned by
the three pertinent Acts.
Should the Department be divided into two, it is possible that the current structure would serve as the
basis for that. However, that would mean the Epidemiology and Diagnostics sections would be in a
different department from the Phytosanitary and Quarantine section, even though they need to work
closely together. The DCP currently has inadequate capacity to fulfil all its roles, in terms of facilities,
operating costs and human resource.
Figura 4: Structure of the Department of Crop Protection
Source: IPPC website, www.ippc.int/en/countries/uganda/.
3.2.3 Research
Under MAAIF, one of the agencies is the National Agricultural Research Organisation (NARO). It was
created in 1992, but in the National Agricultural Research Act it was converted into a secretariat
Platform for Agricultural Risk Management | Crop pests and disease management in Uganda: status and investment needs
53
Full Report | October 2016
responsible for coordination of all agricultural research in the country. Nevertheless, public-funded
research still predominates, undertaken by the National Research Institutes (NARIs) formerly part of
NARO, and the Zonal Agricultural Research and Development Institutes (ZARDIs). The NARIs are
mandated to do research on issues of strategic national importance (priorities), the ones with an interest in
crop protection being the National Agricultural Research Laboratories (NARL), the National Crops
Resources Research Institute (NaCRRI), the National Semi Arid Agricultural Research Institute (NaSARI)
and the Coffee Research Institute (CoRI). ZARDIs address priorities that are articulated through
participatory processes at the zonal level. There are nine ZARDIs corresponding to the major
agroecological zones, so different ZARDIs focus on the crops relevant to their zone.
NARO is nearing the end of a 10-year strategic plan, with a vision of “A market-responsive, client-oriented,
and demand-driven national agricultural research system”, and a mission “To generate and disseminate
appropriate, safe and cost effective technologies”. The plan has 5 strategic objectives:
Client and impact-oriented, market responsive agricultural sector research agenda developed and
implemented
Capacity and efficiency of public and private agricultural sector research service provider teams to
respond to client needs and market opportunities improved
Infrastructural and financial sustainability capacities to support and facilitate agricultural research
enhanced and strengthened
Mechanisms for contributing to agricultural research sector policy formulation and development
strengthened
Quality assurance procedures in the National Agricultural Research Systems (NARS) established and
implemented
Although the plan identifies pests and diseases as a cause of poor productivity and as an ongoing threat,
the document does not describe specific research areas (such as plant protection). Nor does it explain
how NARO would collaborate with MAAIF departments such as that for Crop Protection. MAAIF is
however seen as a “Buyer” of research, reflecting a more demand driven approach.
3.2.4 Education
Makerere University has a good track record in pest management, and in recent years the university has
taken steps to ensure that their students are equipped with knowledge and experience that will be
applicable in the jobs they are likely to get. For example, experience of providing advice to farmers at plant
clinics has been added to the practical programme, and the plant doctor training programme that teaches
practical field diagnosis, is being used to strengthen the diagnostics training. The demand for tertiary
education is encouraging the establishment of new universities, though new universities can take time to
match the quality of established universities.
A number of agricultural training institutes (ATIs) exist for more vocational training, but the ASSP notes
that during the period of the DSIP, although student enrolment has increased, the credibility of the ATIs
has remained poor. The ASSP thus includes review of the ATI curricula, and it will be important to ensure
that pest management issues are adequately addressed in that review.
3.2.5 Local Government
Local governments are responsible for local agricultural activities including pest management, particularly
in relation to endemic pests (that usually cause some damage every year). Extension is also the
responsibility of local government. MAAIF’s responsibility is to support and build the capacity of district
authorities so that they can better deliver regulatory and quality assurance services, as well as collect
agricultural statistics. However, the MAAIF website says “The reality is that the link between MAAIF HQ
and the districts is very weak, exacerbated by the increasing number of districts as well as the limited
numbers of staff” as a result of capacity shortages both in MAAIF and in the Districts. Re-structuring of the
extension system is described in section 3.2.8 with a new single spine extension system for extension staff
deployed at sub-county level.

Platform for Agricultural Risk Management | Crop pests and disease management in Uganda: status and investment needs
54
Full Report | October 2016
Nevertheless, a number of districts have allocated resources (staff time and operating expenses) to
running plant clinics under the Plantwise programme, which indicates an awareness of the need for
improving pest management advisory services.
3.2.6 Private sector actors and value chain actors
3.2.6.1 Input providers Agro-input dealers (seed, chemicals and fertilisers) are important players in crop protection. Actors in this
area include Uganda Seed Trade Association (USTA), Uganda National Agro-dealers Association and
National Organic Agricultural Movement of Uganda (NOGAMU). These are majorly membership
organisations that bring together input providers to a common platform to work on key issues affecting the
sector.
USTA was formed in 1999 to coordinate and oversee the development of the seed industry and to
enhance the availability of quality assured seed for the entire farming community locally, regionally and
internationally. The Association currently has a total of 27 members of whom 23 are seed companies and
4 are associate members. USTA has been key in the development and enhancement of the seed industry
and currently represents 70% of the formal seed sector. USTA has been participating in regional seed
harmonization efforts convened by EAC and COMESA.
UNADA is the umbrella body for all agro-input dealers. UNADA has been involved in efforts to train more
dealers to operate efficiently and according to the law (see section 4.2.4 on agro-dealers). However, given
the presence of USTA, UNADA has tended to concentrate more on agricultural chemicals, leaving the
seed component to USTA.
NOGAMU on the other hand comprises producers, processors, exporters, trainers and other stakeholders
with interest and practice in organic farming. NOGAMU markets and promotes local and export organic
products; trains and coordinates research and extension; undertakes development of standards and
promotion of application of organic standards; and carries out lobbying and advocacy on organic
agriculture. NOGAMU has already developed the Uganda Organic Standard with the guidance and
participation of UNBS and is coordinating with the East African Community through the East African
Bureau of Standards to formulate the East African Organic Standards. Its focus on organic farming
provides an opportunity to advise farmers on how to reduce reliance on pesticides and use alternative pest
control measures.
3.2.6.2 Producers At the production level, there are still large numbers of smallholder subsistence farmers (less than 5
acres). The ASSP expects the number of subsistence farmers to halve from 6 to 3 million during the period
of the plan, by becoming “commercial”, but also through increased employment in non-agricultural
enterprises. Currently 85% of the rural work force is involved in subsistence agriculture (UBOS, 2016) –
also see section 1. Medium scale farmers (5-15 acres) and large scale farmers (more than 15 acres)
comprise 12% and 3% of farming population respectively. Medium and large scale farmers mainly engage
in production of cash crops and high value horticultural crops.
At lower levels, producers are organised under producer-owned cooperatives, where they access inputs,
extension and business development services. However, more often than not, this is a recipe of medium
and large scale farmers. Farmer cooperatives are also organized along value chains, implying any farmer
support services target only those engaged in the respective crop. Notable are coffee marketing
cooperatives, with some of the oldest member owned cooperatives such as Bugisu Farmers’ Cooperative
Union and Bukonzu Joint Cooperative Union, still existing. Cooperatives have profiles of members but also
farmers who trade through the cooperative and would form an important link between DCP and farmers.

Platform for Agricultural Risk Management | Crop pests and disease management in Uganda: status and investment needs
55
Full Report | October 2016
3.2.6.3 Traders and processors The level of organization of various value chains varies. Marketing of less commercial crops such as
cassava and to some extent banana (which is both a commercial crop and a staple) is generally relatively
informal. In contrast, value chains for commodity crops, especially export crops (e.g. coffee, cotton,
flowers, vegetables and fruits) are more organized and have structures and systems for farmer outreach
and extension. The level of organization of marketing also depends on the nature of producers. For
example, the flower sector is well organized (being relatively small), and comprising commercial large
scale farmers. In some cases associations have been established to help organize value chain actors for
crops where production is still disaggregated yet the crops are largely exported e.g. maize. Uganda grain
council is one of such organisations focusing on establishing standards for grain marketing in the country,
including management of post-harvest pests, quality standards and processing.
Partnership with DCP or MAAIF will largely depend on the level of organization of the traders. The flower
sector has already established a good relationship with DCP in successfully addressing a problem with
caterpillars in exports of roses to EU (Box 3.5). Similar problems with interceptions (in this case false
codling moth on fruits/vegetables) will be harder to address as there are many more, smaller producers,
who are less well organized. However, partnerships with Uganda Export Promotions Board (UEPB), the
national focal point for export promotion and development could be appropriate for ensuring wide
awareness and compliance monitoring on regulation requirements.
With increased market orientation, other value chain actors will become more important than at present,
including transporters, aggregators and processors, as well as operators of storage facilities. All these
people will need some understanding of pest management issues, particularly in storage where major
post-harvest losses can occur.
Box 3.5: Successful DCP-Private sector collaboration in pest management
In a project designed to reduce Spodoptera interceptions on exports of roses to Europe, DCP and the
private companies involved in flower export worked together to solve the problem. Activities focused on
building the capacity of both partners, and improving linkages between private sector companies (through
the Uganda Flower Exporters Association) and DCP. Task force meetings between private and public
sector representatives took place and common trainings were held where both groups participated.
Private sector stakeholders organized themselves and set up traceability, enabling “naming and shaming”
and fines if a member was non-compliant. A fund was established to facilitate DCP staff to implement
farm assessments. Although fewer stakeholders are involved in flower exports making linking and setting
up mechanisms relatively straight forward, an interviewee from the government wondered if similar
processes could be established for other crops.
3.2.6.4 Farmers associations The government of Uganda, through various initiatives has been promoting development of farmer
associations to operate as business entities, demand advisory services, access markets and credit. Under
the NAADS programme, several farmers associations were created around enterprises such as dairy,
crop, fisheries, coffee etc. depending on location and comparative advantage of producers. Farmers
associations are organized under their umbrella bodies – District Farmers Associations (DFAs) and the
Uganda National Farmers Federation (UNFFE). Membership to these associations is not limited to
farmers, but also agro-industrialists and agro-commodity dealers. UNFFE and its DFAs support farmers by
advocating and lobbying for support to farmers’ developmental issues and programs. These associations
are different from farmer owned cooperatives due to their focus on policy issues affecting farmers and
farming in general with less focus on specific value chains.
3.2.7 Dissemination/information service providers
Institutions currently mandated to provide pest management information to farmers include the Directorate

Platform for Agricultural Risk Management | Crop pests and disease management in Uganda: status and investment needs
56
Full Report | October 2016
of Agricultural Extension and Directorate of Crop Resources in the MAAIF, and Department of Production
under the Ministry of Local Government. Dissemination has been in flux over the past 20 years. Prior to
decentralization in 1997, MAAIF had a staff of 4,300 including subject matter specialists at the district and
sub county level to implement its agricultural extension program. However, in 1998 the directorate of
extension was abolished as the district local governments took over responsibility for extension and
numbers of extension staff reduced to 2,000 with technical staff based at district level reporting to the local
government. In 2001, the National Agro-Advisory Development Services (NAADS) was established as a
semi-autonomous body under MAAIF with significant donor support promoting “privatized” extension,
where services were contracted in response to farmer demand – often from staff that were previously
working as sub-county extension staff. The MAAIF extension staff continued to work alongside the donor-
funded NAADS program until 2010 when a circular from Ministry of Public Services (dated 14 January
2010) directed that all agricultural extension staff at the sub county be converted to NAADS. This move
combined with the various reforms under NAADs had a major effect on extension service delivery, in
particular crop pest management, because the cadre of staff that were in close contact with farmers were
eliminated from the service. The NAADS reforms focused more on making agriculture a business venture
and ignored the science of dealing with issues like pests and diseases. Danielsen et al. (2014) describes
the issues caused by weak linkages between district staff and MAAIF and the frustration of MAAIF officials
with the lack of authority and resources to handle major pests and enforce regulations. It was noted for
example that: ‘The districts carry out disease surveys each in their own way, without any standardisation
and coordinated follow up. Activities are scattered and fragmented, and many pests and diseases are
getting out of control. If something is not done soon on cassava brown streak we will not have cassava in
five years’ time’.
Latest restructuring in 2015 means that NAADS no longer has responsibility for extension and focuses on
input provision particularly seed and planting material. During the year 2015/16, working under the
Presidential direction, NAADS is concentrated on distributing seed for; maize, bananas, beans, mango,
citrus, pineapple, passion fruits, grapes and cassava. Coffee is also prioritized, but seed distribution is
managed by UCDA. A new Directorate of Agricultural Extension was established and an extension policy
and implementation strategy has been developed and is in final stages of completion (pers comm. P.
Rwamigisa). The strategy provides a framework on how capacity for extension services support will be
enhanced under the new single-spine system. This includes how the following activities will be
implemented and coordinated amongst the various players: recruitment; certification and re-tooling of
extension service providers; farmer registration and; resourcing for various extension visits. The strategy
recommended to cabinet manpower of more than 12,000 technical staff for the structure to function in all
disciplines - agriculture, veterinary, entomology, fisheries, and commercial / marketing. Approval was
received to recruit 4,000 staff, and so far 2000 have been recruited, expecting to reach 80% by end of
2016.
Beside the public extension system, several private sector players and NGOs are also increasingly
engaging in extension services and agricultural information dissemination. These players either work
directly through their own network of extension service providers or in partnership with existing public
extension systems and private sector players. Mass media approaches including radio, TV and agricultural
sections in national newspapers are also being used to deliver information to farmers. Mobile enabled agri-
information services are also being used, with village based intermediaries interacting with farmers and
sourcing information using a mobile phone or tablet. Some services deliver messages on SMS or voice –
though the greatest success using mobile appears to be in providing information on markets (e.g. prices),
weather and other services including financial.
3.2.8 Donors
Several donor funded projects are also being implemented in Uganda either through direct funding to
MAAIF or through parallel structures that have no link (in terms of flow of information) with MAAIF. Some
of the donors that have supported projects related to pest and disease management include;

Platform for Agricultural Risk Management | Crop pests and disease management in Uganda: status and investment needs
57
Full Report | October 2016
World Bank support to East African Agricultural Sector Productivity Programme, Agriculture Cluster
Development Project (ACDP), including various ICT initiatives, and ATAAS.
USAID Uganda Feed the Future support for Commodity production and marketing, and Agricultural
inputs programme.
IFAD support to Vegetable Oil Development Project, Agricultural Technology and Agribusiness
Advisory Services Project (ATAAS) co-financed with the World Bank, and Project for Restoration of
Livelihoods in the Northern Region.
European Commission support to Northern Uganda Agricultural Livelihoods Recovery programme
(ALREP) and the Karamoja Livelihoods Programme (KALIP) programmes.
Food and Agricultural Organisation (FAO) of the United Nations support for livestock disease
surveillance in Karamoja region. FAO has also been involved in supporting emergency and relief
actions including distribution of emergency relief seed/planting materials, awareness campaigns on
pests and diseases and drought/flood early warning systems.
Plantwise a CABI led project funded by consortium of donors including the UK Department for
International Development (DFID), the Swiss Agency for Development and Cooperation (SDC), the
European Union, the Ministry of Foreign Affairs of the Netherlands, the Australian Centre for
International Agricultural Research (ACIAR), the Ministry of Agriculture of the People’s Republic of
China, Irish Aid, and the International Fund for Agricultural Development (IFAD).
Bill and Melinda Gates Foundation agricultural support to organisations leading projects in Uganda
e.g. Alliance for a Green Revolution in Africa (AGRA) focusing on soil health; CARE, Heifer
International, International Development Enterprises, International Rice Research Institute, and
TechnoServe, to develop local science, technology, farmer extension services, and market systems.
Embassy of the Kingdom of the Netherlands supports the Integrated Seed Sector Development
program focusing on developing seed entrepreneurship and integrating formal and informal seed
systems for enhanced access to seed by smallholder farmers.
While this list is not exhaustive, it is important that any efforts to manage pests and diseases recognize
such existing initiatives, to ensure effective coordination and avoid duplication of efforts, as promoted
through the Paris Declaration on Aid Effectiveness (2005) and Accra Agenda for Action (2008). Such
coordination for the government side would occur through DCP, which probably currently is inadequately
resourced to fulfil that role.
3.3 Issues related to the legal and institutional framework From this review of the legal and institutional framework, we identify a number of issues for consideration
in the development of the pest management investment plan by DCP.
3.3.1 Crop protection and sustainable intensification
The policy framework clearly promotes the commercialisation of agriculture, including amongst the large
number of smallholders. The number of subsistence farmers is expected to halve to 3m by the end of the
ASSP, and NDPII aims to increase agricultural exports from USD 1.3bn to USD 4bn by 2020.
In the context of pest management this presents both an opportunity and a risk. Commercial agriculture
generally represents “intensified” production, characterised by higher investment, greater input use,
reduced diversity of crops and cropping systems, and at least in the short term, higher production and
productivity. This is an opportunity as commercial incentives can drive investment in inputs by individual
farmers as well as investment by the private sector. The risk is that this intensification is unsustainable,
often characterised by extensive use of pesticides to control pests.
This has led to the idea of ‘sustainable intensification’ (The Royal Society, 2009), in which increased
productivity per unit area is achieved with reduced environmental impact. However, there are many
examples round the world of unsustainable intensification resulting in damage to human health and the
environment, and crop productivity eventually falling, such as through excessive use of pesticides. Figure

Platform for Agricultural Risk Management | Crop pests and disease management in Uganda: status and investment needs
58
Full Report | October 2016
3.2 shows two trajectories of agricultural intensification, and the challenge for Uganda will be to find ways
of pushing the trajectory towards B and away from A.
Figura 5: Possible trajectories of crop intensification under ASSP. A: unsustainable intensification. B:
sustainable intensification
The following discussions therefore reflect this understanding and risk.
3.3.2 Pesticide policy
As Uganda’s agriculture intensifies along the lines of the ASSP, demand for and use of pesticides will
increase, and undoubtedly this will be seen as improving yields. However, in order to promote sustainable
intensification, pesticide policy and regulation needs to avoid promoting pesticides only, and instead
promote lower risk alternatives. There are many factors that can encourage pesticide use, some of which
may be hidden, but many of which are under the control or influence of government policy and regulations.
Table 3.5 shows a list of items that are seen in different countries to be promoting pesticide use. Some of
the factors are already at play in Uganda e.g. distribution of pesticides by government under OWC
(especially for control of pests and diseases on mango and citrus), donors projects providing pesticides at
low or no cost, and inadequate regulation of pesticide use. Others are listed as factors that DCP/MAAIF
should seek to avoid doing as production (and so crop protection) becomes more commercially oriented /
intensified.
Tabella 8: Factors encouraging pesticide use (Waibel, 1991)
Price factors Non-price factors
Obvious factors
Government sells or gives pesticides
Donors provide pesticides at low or no cost
Government refunds pesticide companies’ costs
Subsidized credit for pesticides
Preferential rates for tax and exchange rate
Misguided use of governments’ activities in reducing pesticide damage
Governments’ investments in pesticide research
Inadequate government research in environmentally benign pest management
Hidden factors
Plant Protection Service outbreak budget
Pesticide production externalities
Pesticide use externalities
Lack of adequate procedures for: o pest definition o crop loss definition
Lack of information on agro-ecological parameters
Lack of transparency in regulatory decision making
Curricula of agricultural education and extension
Dominance of pesticide industry in the market for crop protection information
3.3.3 Pesticide registration
Pesticide registration is a specific aspect of pesticide policy, which can have a very direct effect on the way
in which pests are controlled, as it affects what products are in the market and their price. Registration has

Platform for Agricultural Risk Management | Crop pests and disease management in Uganda: status and investment needs
59
Full Report | October 2016
a cost, and pesticide traders will only pay that cost if they expect to make a return. The cost of registration
is not simply the fee, but the cost of obtaining all the necessary data to support the application.
Consider two products. A broad spectrum organophosphate can be used against many pests, so can
expect to have a sizeable market. But being broad spectrum, it has significant non-target effects, killing
other organisms including beneficial species that usually keep pests in check. Conversely, a pest-specific
biopesticide will have a smaller market, but being more pest-specific in its action, has a much lower impact
on the environment, including killing fewer natural enemies of pests. If the registration process costs the
same for both, then the broad spectrum organophosphate is more likely to come to market, and/or be
cheaper to purchase than the biopesticide, despite being more damaging to the environment, and possibly
causing additional pest problems.
So an opportunity in the area of pesticide regulation is to have a registration process that promotes and
encourages the lower risk products, which are more likely to provide sustainable pest management. This
would require DCP to be more regular in updating recommended pesticide lists for use in Uganda and
developing capacity for pesticide testing (skills and equipment) before new pesticides are approved for use
in the country.
3.3.4 Integrated Pest Management (IPM)
IPM (as defined in section 1.1.4) is widely promoted in many countries’ strategies and plans related to pest
management, and CAADP clearly advocates the use of IPM. However, in the ASSP and other documents
it is conspicuous by its absence, or at least by the lack of emphasis. There is also relatively little mention of
pesticides, except with reference to the fake and adulterated products in the market.
In implementing the ASSP, there is an urgent need to firstly acknowledge that there is a risk of pesticides
being overused, as in the intensification scenario described above. Then there need to be steps taken to
actively promote IPM. IPM needs to be included in documentation, not just as a desirable goal, but as a
set of specific steps to support sustainable intensification. The “Integrated” part of IPM generally refers to
the combination of pest management methods (with pesticides used as little as possible), but integration is
also needed between pest management and the other areas where crop production is to be intensified.
The ASSP envisages a number of changes taking place in the way in which crops are produced, and
these can all present risks and opportunities with respect to crop pests. Table 3.6 indicates some of these
changes, which therefore need to be addressed, not only by those running crop protection activities.
An important element of IPM is using agronomic practices that reduce the likelihood of pests causing
losses. There is a tendency, particularly among those less directly concerned with crop protection, to
view crop protectionists as a fire brigade to be called when a problem arises. This is certainly an important
part of their role, but just as a major part of reducing the costs of fires is preventing them occurring in the
first place, so increasingly crop protection must be concerned with anticipating and responding to pest
problems before they become serious. The use of pest resistant or tolerant varieties contributes to risk
reduction, but there are many other aspects that are part of the IPM approach. Table 3.6 suggests some
changes that may need to be addressed in crop protection, aimed at promoting lower risk pest
management alternatives.
Tabella 9: Some changes envisaged by ASSP that have implications for pest management
Changes envisaged by ASSP Implications for pest management
Increased use of irrigation Irrigation modifies the agro-ecology of a crop, so changes pest risk. In many cases it can increase the probability and/or severity of pests, because there is a longer or unseasonal crop growing period allowing more scope for pest multiplication.
Increased use of fertiliser and soil fertility management
Fertilisers change the health and vigour of plants, which affects their susceptibility to pests. Healthy plants can be more attractive to pests, but at the same time better able to withstand pest attack. Adjustment of soil fertility and land management practices can be used to reduce pest problems.

Platform for Agricultural Risk Management | Crop pests and disease management in Uganda: status and investment needs
60
Full Report | October 2016
Increased use of high yielding and pest resistant crop varieties
ASSP includes many references to the production of pest and disease resistant or tolerant crop varieties. However, such resistance can be associated with lower yield potential. It cannot be assumed that it will be possible to produce varieties that simultaneously maximise both yield potential and pest resistance/tolerance. Where preference is given to high yield potential, pest risk can be increased.
Expansion of post-harvest crop storage facilities and reduction of post-harvest waste
Pests are a major cause of post-harvest loss. Greater storage of crops could mean more stored pest problems, but appropriate storage facilities should also allow improved management of such problems.
Increased commercialisation of production
Commercial agriculture increases the opportunities for pest management, as investing in pest control becomes economically viable. Though there are dangers in over-reliance on and mis-use of pesticides
More export oriented production Some export markets are very demanding in their requirements, including in relation to pest management issues. In aiming to produce high quality crops, farmers may resort to use of pesticides, even on a prophylactic basis. However, markets may also be sensitive to pesticide residues (eg EU markets). Export markets may also have strict phytosanitary requirements regarding quarantine pests, which reduce the profitability of exports or halt them if the requirements cannot be met.
Increased accessibility of financial services
Greater access to credit makes investing in crop protection possible. But greater investment results in greater exposure to risk such as pest attack. Insurance against crop failure (including due to pests) is a new market for financial service providers, and an opportunity to promote IPM.
3.3.5 Clarification of MAAIF Departments’ responsibilities
There appears to be lack of clarity concerning the structure of MAAIF in respect of crop protection
responsibilities. The Plant Protection and Health Act clearly recognises the Department of Crop Protection,
and assigns responsibility to the Commissioner for Crop Protection. Similarly, “The Agricultural Chemicals
Control Act” and “The Seeds and Plant Act” specify roles for DCP, but not for the DCIC.
This situation creates uncertainty for individuals working in DCP, which, together with the lack of clarity
about who is meant to do what, must be reducing the efficiency of DCP and the Directorate of Crop
Resources. Under the ASSP, one of MAAIF’s roles is to periodically review and restructure itself to ensure
adequate alignment with the implementation requirements of the ASSP. The ideal situation therefore
would be leaving DCP as originally organized and as recognised under the various Acts. However, should
a split be necessary intended to increase efficiency, a preferable split might be to have the sections for
seed certification and agrochemicals in one department and the other three in the crop protection
department. That would mean that one section focuses on input quality (registration, certification and
regulation), while the other focuses on pest and disease surveillance, diagnostics and control.
3.3.6 Public private partnership
Partnerships between public and private sector actors are important for all aspects of the ASSP, and in the
area of crop protection there are several areas where there is opportunity and need.
One such area is in the development of crop protection products. A common area for research in
universities and government laboratories is biopesticides, but often the research proceeds little further than
identifying an organism, such as an insect pathogen, that can kill a pest. Turning such findings into viable
commercial products is not easy, but requires partnership between the public and private sector. Such
partnerships are not always easy to maintain, a secure intellectual property management framework being
one of the areas that can assist in the building of trust and collaboration.
Phytosanitary services are another situation where good public-private partnership is required. The ASSP
includes a number of references to phytosanitary regulations and services, but in practice it is not
uncommon for there to be tension between a regulatory body and the private sector. Again, mutual trust
needs to be built, based on the recognition that cooperation can enable both parties to achieve their goals
(see example on Box 3.5 above). However, building partnerships with institutions such as Private Sector
Foundation, Uganda Grain Council, Farmers Cooperatives, Uganda National Farmers Federation (and

Platform for Agricultural Risk Management | Crop pests and disease management in Uganda: status and investment needs
61
Full Report | October 2016
associated district farmers associations/ fora) and trading agencies could to a large extent help DCP reach
more exporters/producers in the management of crop pests/diseases.
3.3.8 Plant biosecurity planning
Plant biosecurity is a term being increasingly used, although much of what plant biosecurity entails is what
crop protection departments are already doing. The main emphasis of plant biosecurity is preventing the
introduction and spread of new pests and addressing phytosanitary issues around exports, although it
commonly includes other aspects of crop protection.
One aspect of plant biosecurity is the preparation of biosecurity plans, and these would be particularly
appropriate in the implementation of the ASSP where there are focus commodities. For each commodity a
biosecurity plan could be developed, that would identify new pest risks (i.e. quarantine pests), and spell
out the responsibilities of the different stakeholders including financing arrangements in monitoring/
surveillance of those risks, and in responding to an incursion or outbreak if the pest should arrive. Many of
the major pest problems in Uganda originated outside the country, and often the response has been slow
and inadequate. Biosecurity plans enable the country to react much more quickly and effectively, as many
of the key decisions have already been clearly laid out and anticipated.
3.4 Summary and recommendations for pest management The policy and legal framework for pest management in Uganda is satisfactory, particularly with the
recent Plant Protection and Health Act that aligns the role of DCP with the responsibilities of an NPPO
in regard to preventing the introduction of new pests.
Other key functions required for effective pest management (particularly for pests that are already
widespread) are well spelled out in various other items of legislation.
It is important that regulations that currently exist or are in draft are properly aligned to the Acts.
An institutional framework is only fully adequate if it can be implemented. DCP and other stakeholders
currently do not have sufficient capacity for implementation, monitoring and where necessary
enforcing regulations.
The proportion of the ASSP budget allocated to crop protection is relatively small, and not adequate
for the substantial increase of capacity required.
The proposed split of DCP needs to be resolved; we recommend it stays as one department, but with
internal reorganisation.
One aspect of the reorganisation would be to better equip DCP to develop and maintain effective
partnerships and relationships with its many stakeholders, including in the private sector.
The envisaged commercialization of agriculture in Uganda risks an increase in unsustainable activities
(such as the use of pesticides). It is essential that the policy framework is strengthened to counter this
risk.
In particular Integrated Pest Management (IPM) needs to be strongly promoted and encouraged by all
means, including through policy, regulation and strategies. It is currently more or less absent from the
ASSP.

Platform for Agricultural Risk Management | Crop pests and disease management in Uganda: status and investment needs
62
Full Report | October 2016
4. Cost-benefit and sustainability of pest management initiatives
4.1 Introduction There have been many innovations in extension approaches to reach farmers that aim to strike a balance
between the intensity of interaction and reach. This section examines how pest management knowledge
and innovations are diffused to farmers in Uganda and evaluates the most cost-effective method or
combination of methods available to disseminate that information. Effectiveness of different methods is
measured based on a set of criteria that a particular method should possess in order to be considered
desirable. The effectiveness of each method is weighed against the cost of diffusing information to farmers
in order to create an overall measure of cost-effectiveness for the pest management diffusion methods.
Delivery of advisory services has undergone many changes in the past 20 years in Uganda – both
specifically related to pest management (see Danielsen et al., 2014) and more generally (see section
3.2.8).
Diffusing information to farmers whether conducted by government, NGOs, or private sector, should be
done in the most cost-effective manner possible in order to ensure that the training and dissemination
programs are sustainable and the funding from sponsoring institutions continues. However, inevitably
there is a trade-off between cost and effectiveness that varies depending on the type and complexity of the
message, importance of timing etc. The current section considers different service costs and efficiency
factors associated with extension service delivery in Uganda.
4.2 Initiatives involved in agro-advisory services and approaches used Primarily, extension services in Uganda have been led by the government or not-for-profit NGOs working
in partnership with local government. Increasingly, private sector led extension is taking shape particularly
focusing on key value chains (examples given in section 4.2.4). Different institutions utilize a variety of
methods to diffuse pest management knowledge and practices to farmers. Diffusion methods usually
involve some degree of interpersonal communication either between a qualified extension staff or a less
qualified intermediary such as an agro-dealer or community worker. Interactions can be short one-off
interactions, or a series of interactions over a period time. A number of indirect methods operating through
mass media including radio, TV and increasingly mobile phones are also operating.
The choice of delivery mechanism will depend on a number of variables including: the level of complexity
of pest management innovation to be transferred; the desired reach (number of farmers); the intended
target audience (men/women; young/old tend to engage differently) and of course available resources
(staff and money). Indirect methods such as mass media, may be useful to raise awareness of a new seed
variety or the presence of a new pest and lead to a basic level of understanding but deliver information to a
relatively large number of farmers per dollar spent. In contrast, very intense methods such as farmer field
schools involving regular interactions between an extension staff and group of famers over a period of time
provide a deep understanding of pest management but train a relatively small number of farmers per dollar
spent on the program. Inevitably there is a trade-off – as illustrated in Figure 4.1 and usually a combination
of approaches is needed.
Figura 6: Tradeoff of different extension approaches based on desired reach and impact

Platform for Agricultural Risk Management | Crop pests and disease management in Uganda: status and investment needs
63
Full Report | October 2016
As information needed becomes more complex, it is likely that more intensive interactions are needed or a
combination of approaches which will reach fewer people. In this section, the trade-offs between reach and
costs are considered in more detail. Delivery mechanisms used in Uganda can therefore be categorised
into three classes:
1. Intensive interpersonal interactions
2. Moderately intensive interpersonal interactions
3. Mass media approaches
4.2.1 Intensive interpersonal interactions
Here, extension workers provide direct training and technical support to farmers. Examples include
technical agent visits and farmer field schools.
Extension or technical agent visits
In line with the training and visit approach recommended by the World Bank in the 1980’s, extension
agents or technical staff undertake periodic visits to villages to give ½ day trainings to farmer groups and
make a number of follow-up visits to individual farmers. This is still common practice in Uganda. Pest
management issues are addressed, often in conjunction with other issues. In Uganda, technical staff are
recruited up to sub-county level to provide extension services. The sub-county has an average of 2,000
farm households. These extension staff are either specialized in livestock, crop or fisheries. They provide
training to groups of farmers within the sub county, organized under farmer groups or specific enterprises.
Typically an extension agent will work with around 30 farmer groups – each with 30 members, although
around 20 typically attend trainings. Field / farm follow-ups are later undertaken to ensure that trained
farmers correctly apply techniques, with further on-spot support provided by extension staff. Extension
officers also respond to ad-hoc farmer requests and inquiries on emerging crop pests and diseases, as
well as reporting to higher authorities cases of pest and disease outbreaks. The sub-county extension staff
(expected to comprise of technical people in crop, fisheries and livestock) are technically backed by
MAAIF and the District Agricultural Officers. Beside the public extension, several NGOs and private sector
(including commodity boards, cooperatives and trading companies) in various fields have employed field
extension workers to work with farmers in this way. The minimum qualification for extension workers is a
first degree in Agricultural sciences, though personnel with Diploma level training have been employed in
some cases as service providers or by NGOs.

Platform for Agricultural Risk Management | Crop pests and disease management in Uganda: status and investment needs
64
Full Report | October 2016
Transaction cost of having extension officers visit farmers is relatively low because the agents normally live
in close proximity to the farmers with whom they work. Usually an extension officer has access to a
motorcycle so transport costs are monthly cost for fuel and maintenance. Additional costs of the agent
visits include salaries, perdiems and training materials. The main drawback to this system is that it is
insufficiently funded so it is impossible for extension personnel to routinely interact with farmers. Also the
government has not been able to recruit extension officers to reach each sub-county (see section 3.2.8).
Furthermore, the quality of extension agents varies as does their ability to connect with farmers and
influence them to adopt new practices and technologies. This requires routine refresher trainings and re-
tooling the extension agents so that they are able to adequately diagnose and recommend appropriate
pest and disease management solutions.
Farmer field schools (FFS)
Farmer field schools comprise of weekly, small group training sessions, commonly focused on pest
management, over a whole crop season for a specific crop. Sessions are normally led by a qualified
extension officer, although use of lead farmers is also being tested in some cases. In this model,
participatory, experiential learning approaches are used, requiring intensive training for facilitators/trainers.
FFS programs stress the importance of observing fields regularly, conserving natural enemies, farmer
experimentation, and using relevant, science-based knowledge. Hands-on training is important to attract
both literate and illiterate farmers and to keep them interested in learning. FFS projects are used to
communicate complex ideas such as integrated crop management while also empowering farmers by
strengthening their skills, problem-solving capabilities and confidence. The standard FFS training involves
a field-based, season-long programme overseen by an FFS facilitator, with weekly meetings near the plots
of participating farmers. Each FFS typically has 20–25 participants, with farmers working together in
groups of five and a total of 14 sessions including a start-up session and field day, as well as 3 monitoring
visits).
Farmer field schools were developed by FAO as a means of empowering farmers by improving their
analytical and decision making skills. In Uganda, IFAD and a number of other organisations have adopted
this approach as the most appropriate for disseminating pest management technologies and information. A
“Learning site approach” and “Farmer Life Schools” are modifications of the FFS that have been largely
applied in the area of health. Self Help Africa (SHA) in Uganda is using these two methods for nutritional
outreach, targeting persons attending health facilities. The common attribute among farmer field schools
and learning sites is the emphasis on experiential learning and participation.
To become a FFS facilitator extension staff undergo additional “training of trainers” programmes, normally
over 2 weeks to train them in the specific techniques used in the schools. A cadre of Master facilitators is
established to implement these training of trainers. However, a challenge with many FFS is that quality is
often an issue with some FFS simply providing traditional top-down teaching as opposed to the
participatory and joint problem solving approach – the key selling point for FFS. Investment of time per
farmer is also high – with extension staff spending around 17 work days delivering FFS which normally
involve around 20-30 farmers.
4.2.2 Moderately intensive interpersonal interactions
this includes short interactions between a farmer and an intermediary – often where the farmer
comes to ask specific advice where farmers travel to the venue. the intermediary may be a trained
extension staff or a trained local facilitator. examples include; plant clinics, farmer field days, plant
health rallies and several variations of village-based intermediaries (e.g. village based advisors,
community knowledge workers or model/lead farmers).
Plant clinics
Plant clinics are a novel way to provide plant health advice to farmers developed by CABI initially through
its Global Plant Clinic, and since 2012 through the Plantwise program. At its core, a plant clinic is a simple
rural service, run by trained agricultural extension workers, referred to as ‘plant doctors’, who operate in a
similar way to staff at a human health clinic. The plant clinics encourage farmers to bring examples of the
Platform for Agricultural Risk Management | Crop pests and disease management in Uganda: status and investment needs
65
Full Report | October 2016
crop and use analysis of the sample as well as questioning the farmer on farm context to be able to
diagnose the problem and offer advice on pest management as well as general advice on crop production.
Clinics are open to everyone and address any crop and any problem brought to the clinic. They are
typically run once a week or fortnight in a particular location where farmers naturally congregate, often a
market place. Some clinics are “mobile” moving to different locations over a set period of months. Currently
over 190 plant clinics are said to be operational across 91 districts in Uganda. An additional benefit of the
clinics is that information on the problem, the diagnosis and the recommendation are collected. Although
coverage of plant clinics is relatively low, collection of data at clinics provides a snapshot of plant health
problems in a given area that can be used to inform complementary approaches that can deliver targeted
messages at scale. At the same time, analysis of the data can serve as an early warning mechanism of
new pests, information on pest abundance that could be used to inform agrodealers of required inputs as
well as providing information on quality of advice. Data is currently collected on paper forms in a
systematic way, with plant doctors recording information on symptoms, a diagnosis and recommendations.
The data is collated by the Department of Crop Protection (DCP) and entered to the Plantwise Online
Management System (POMS) where it can be accessed by individuals given permission by the DCP.
Uploading into POMS is slow and quality of data are variable. New work in Uganda planned by Plantwise
and funded by IFAD will introduce tablets to clinics to improve the efficiency of data collection and
management and seek to streamline data harmonization, validation and use processes. Work in Kenya
showed the use of tablets to make a big impact on the speed of data collection and meant less
harmonization work.
Plant clinics were piloted in Uganda in 2006 with technical and financial support from CABI’s Global Plant
Clinic (GPC) as a collaborative effort between district local governments (LGs) and nongovernmental
organisations (NGOs) as implementers and the Department of Crop Protection of MAAIF as coordinator.
Trainee plant doctors including public sector and NGO extension workers receive basic plant doctor
training comprising of 2 modules of 3 days; Module 1: Basic course: field diagnosis, how to run a Plant
Clinic and; Module 2) Basic Plant Healthcare: control options, decision-making, quality of service. Normally
2 plant doctors are trained for each clinic established. Other courses run for some plant doctors and others
involved in the Plantwise program include; Module 3) How to design extension messages and write Fact
Sheets and pest management decision guides and Module 4) Monitoring Plant Clinic Performance. CABI
and MAAIF continue to offer technical backstopping to the clinics and participate in monitoring visits.
The recurrent costs involved in running a plant clinic include allowances for clinic staff, transport of
furniture and tent, labour to set up the tent and publicity. The recurrent costs for running a clinic session
are estimated at an average of $40. A clinic session usually takes place fortnightly, operates for half a day
and is run by 1-2 plant doctors and one plant nurse (equivalent to community based facilitator). Startup
costs include training the plant doctors and equipping them with prescription books and related pest and
disease management guides. This cost is estimated at an average of USD 260 per plant doctor. Numbers
attending are very variable; Danielsen and Matsiko (2016) reported an average of 13 clients per clinic
session. However, of these: five had 4-8 clients; three 15-27 and one 40. This level of variability is
common, depending on season with clinics run during growing season attracting relatively larger numbers
than those operating during off season. However, many argue that the greatest value of clinics is in the
data that is collected and the information it provides on pest and diseases, if the data can be used, rather
than the numbers reached directly with advice. The data can potentially be used to inform actions by other
stakeholders including the NPPO. This is addressed in more detail in section 5, but it should be noted
here that the use of tablets is being introduced to replace paper based data collection. This can increase
start-up costs by an extra USD200. The cost of airtime to use the tablets is largely offset by the fact that
record books are no longer needed.
Farmer field days
During the farmer field days, scientists or extension workers make in-depth presentations and hold
discussions in farmers’ fields, or undertake demonstrations to introduce new management practices and
innovations to farmers including those related to pests and diseases. Farmer field days may also be
hosted by farmers themselves with some assistance from sponsor organizations. In this case, the host
Platform for Agricultural Risk Management | Crop pests and disease management in Uganda: status and investment needs
66
Full Report | October 2016
farmers share information and farming practices with participants and engage in discussions to learn from
each other. Beside the farmers, field days are also attended by technical staff (district and sub county
extension officials), political leaders, NGOs, agro-input dealers, researchers, agro-processors, financial
institutions, press etc. This gives participants an opportunity to observe pest management or any other
practices first hand and receive more in-depth information about specific practices. The interactions with
various technical and input service providers’ helps participants obtain further information on availability of
technologies and how they can be applied. Farmers also get contacts where they can seek further
information.
Field days in Uganda are sponsored by MAAIF and a number of NGO’s. For example, MAAIF conducted
several farmer field days to showcase successful BXW control on previously affected fields in 10 hotspots
in Western Uganda (Byantwale, 2014). The press picked lessons and disseminated in local media the
BXW control campaigns. Similarly, two of HORIZONT3000’s partner organizations in the Enabling Rural
Innovation (ERI) East Africa Project, Safe Neighborhood Foundation (SNF) and Caritas MADDO, have
been organizing farmer field days. The Integrated Seed Sector Development (ISSD) Uganda has also
been organizing field days focusing on utilization of quality seed and crop pest and disease management.
The benefit of field days is that a large number of farmers can receive information about pest management
technologies or practice at the same time. On average field days involve 80-300 participants depending on
available budget, and they typically last one day. The number of field days depends on the objective and
urgency of response required. The costs associated with field days include allowances of the experts that
administer the event, transportation for the experts to the event, cost of food and refreshment for
participants, venue hire, publicity and invitations.
Plant health rallies
Plant health rallies have been developed and implemented in Uganda and other countries through CABI
led initiatives including the Plantwise programme and other projects. Each rally is a short event held in a
public place, often a market place, where a particular problem is addressed. Typically, a rally lasts 30
minutes to one hour. A group of individuals, normally extension staff, come to the agreed place and deliver
targeted information to the gathered crowd. Materials may be used and small leaflets distributed. No
formal erection of tents and chairs are used and no refreshments given meaning the rally team can cover
2-3 venues in a day. The rallies can be used to raise awareness of a particular pest, provide simple
advice as well as gather information on observations etc. They have been used in Uganda to address a
number of key pests and diseases. As the teams are mobile and preparation time short, a large area can
be covered in a short period of time. A challenge with plant health rallies is that a crowd is gathered
spontaneously meaning that many participants may not be those for whom the information is most
relevant. Some countries overcome this by advertising the plant health rallies beforehand, for example on
the radio to encourage those with a particular interest to attend.
Village based intermediaries
Village based intermediaries are typically farmers or other resource persons who live in the village and are
trained to provide assorted advice/services to farmers. There are different models and different objectives
for the village based intermediaries. Intermediaries sometimes use a mobile device allowing them to
access information and data on weather/market prices to support interactions between themselves and
farmers. For example community knowledge workers (CKW) by Grameen Foundation deliver information
and sometimes collect information from farmers for monitoring or evaluation purposes. CKWs are
equipped with mobile phones enabled with technical content of commonly asked questions by farmers
relating to pests and disease management. Farmers send their questions to CKWs through SMS or
calling. From key informant interviews, it was established that CKWs are commonly asked questions on
pest management, though the most frequent questions relate to weather, market prices, livestock health
and then crop pests and diseases.
The village agents approach by actors e.g. FIT-Uganda, Agrinet and Farm Gain uses a network of people
located on strategic locations in the village who collect market information on a daily basis. The information

Platform for Agricultural Risk Management | Crop pests and disease management in Uganda: status and investment needs
67
Full Report | October 2016
is then sent by SMS to a central data base for analysis. Village agents may be traders or community
workers. Feedback is received again by mobile phone which the agents can then share within their
communities either by word of mouth or use of information boards placed at strategic places. Messages
are also sent out to members who have subscribed for the SMS to these organisations. Village agents are
currently not extending messages on pest management, but could be utilized to gather and share such
information if there is need.
Village-based intermediaries approach places farmers at the center of knowledge generation and
dissemination process. Farmers’ abilities to spread innovation, due to their comprehensive local
knowledge and location, make them potentially better able to communicate with fellow farmers, and at
lower cost. The costs associated with village based advisors include training and extension materials. In
some cases, they are facilitated with a bicycle to ease their transport, gumboots and demonstration
materials.
4.2.3 Mass media
Mass media methods include; i) print media; ii) Radio and television broadcasts; and iii) mobile phone
based extension messaging and information delivery. Mass media methods are relatively less intensive
can transmit information to farmers quickly and widely where other more intensive methods may take
longer for messages to spread. However, the potential for media such as phone and mobile have
limitations on the complexity of information that can be shared.
Print media
Print media such as newspapers, leaflets, pest and disease management guides, posters and bulletins
provide pest management information to farmers. These approaches give farmers a general knowledge of
pest management practices, are inexpensive to produce and transmit, but reach a limited number of
farmers. In Uganda, major newspapers have weekly bulletins on farming, which occasionally feature pest
management messaging or early warning on key pests and diseases. Harvest Money in the New Vision
and Seeds of Gold in the Monitor are examples of these weekly bulletins. Agricultural information is also
produced in their sister newspapers in local language – Bukedde, Orumuri and Rupiny. Others print media
sources include; farmers media and agribusiness digest magazine. Print runs are reported as around
20,000– but a large proportion of the distribution is in urban areas, with an estimated 20% reaching rural
areas and farmers. An advantage is that farmers can keep articles to remind them of key messages.
Radio and TV broadcasts
Radio broadcasts and television programmes on the other hand can be interactive, for example with
technical experts responding to farmers’ phone-in questions. Radio broadcasts and television
programming with agricultural themes occur every day in Uganda on various radio and TV stations. To a
great extent, this is in response to presidential directive that all media houses should incorporate
broadcasts on agriculture and agricultural development. Radio and TV broadcasters usually invite
technical persons to deliver presentations on key topics, usually from the Directorate of Crop Resources in
MAAIF. Also a number of partners (NGOs) are supporting radio and TV programming on various topics
related to agriculture in general or specific interest areas like promotion of orange fleshed sweet potatoes,
control of banana xanthomonas wilt, sensitization of maize lethal necrosis and consumption of vegetables
for health and nutrition.
For example, Farm Radio International (FRI) has partnered with 60 community and private radios in
Uganda supporting them to develop interactive radio programmes on agriculture. The support given
includes training radio broadcasters to air information in the right way, developing and sharing radio
scripts, gathering feedback from farmers, and training farmers (organized in radio listening groups) how to
use phone services and call centers. The radio programming also includes mechanisms for feedback
generation and response to key questions from farmers through call centers and opinion polls.
Radio, because of its unrivalled access and low production costs, is thought to be one of the technologies
that best meet the information and communication needs of farmers worldwide. Radio can reach

Platform for Agricultural Risk Management | Crop pests and disease management in Uganda: status and investment needs
68
Full Report | October 2016
communities at the very end of the development road — people who live in areas with no phones and no
electricity. Radio also reaches people who can’t read or write. Even in very poor communities, radio
penetration is vast. Calandro et al. (2012) report 77% of households in Uganda own radio, a figure that is
typical for households in developing countries. However, although radio ownership is high, there are
challenges. Uganda has an unusually high number of local radio stations (>150 reported by Myers, 2008)
that are mostly regionalized. This leads to fragmentation of listenership, with no single station recording
higher ratings than 4.5% in May-July 2015 (Elliott, 2015). Elliott (2015) further indicates that 11 radio
stations covered 54% of listeners, with 46% listening to the other stations, with approximately 39% of their
survey sample reporting listening to programmes. Another limitation with radio is that listenership is
skewed towards men and the better off – although listenership is high across communities compared to
other sources of information (Perkins et al., 2011).
Mobile phone enabled messaging
Use of mobile enabled messaging is also increasingly being used. Farm radio international has included
the use of SMS services and call centers in their various programs. SMS of up to 160 characters are sent
out to subscribing farmers focusing on crop production and pest management. Through the call centers /
beeping service, farmers beep and receive a call from the radio where they log their question. These can
then later be addressed through radio or TV broadcasts. In a similar approach, some private sector players
are also using SMS to reach to their subscribers. Currently the focus is on market prices and market
information, though an opportunity exists to use such platforms to share information on pest management.
Information on prices is gathered by agents located in various areas, is collated, analyzed and simple
messages developed that are sent to subscribers. The SMS platforms for information gathering currently
range from web-based (e.g. Agrinet) to simple excel based systems. Examples of partners using ICT-
enabled information delivery include; FIT Uganda, Farm Gain and Agrinet.
Overall, mass media offers opportunities to reach a large segment of the population quickly and with a
relatively low average cost per farmer reached. Limitations associated with mass media include; its inability
to reach the entire population. Print media is limited in the number of people it can reach because of
limitations in literacy and numeracy levels that have remained low. The difficulty in reaching people with
television is that while it can reach illiterate people, there are many farming households particularly in rural
areas without electricity making access to television difficult or impossible (refer to Table 5.1).
4.2.4 Private sector led approaches
Approaches entirely led by the private sector aimed at managing key problems in agricultural product
quality and market facilitation. Private sector led approaches may be very intensive or less intensive, but
are distinctly different from public approaches due to their profit motivation. The business model used is
able to cover operational costs for extension delivery. Examples include; trading agents / commodity
aggregator model and agricultural service providers models.
Commodity aggregator model
The service provider provides extension services and an end-market for products. Usually focused on a
particular value chain where the service provider is a private entity with interest in trading the commodity.
The service provider ensures that farmers receive training and information on production, pest control and
quality management. In this way, the service provider is assured of quality produce and farmers are
assured of the market. Examples of organisations using this model are the Joseph Initiative (maize), Self
Help Africa (honey) and Sustainable Traded Initiative (tea). This model largely uses extension agent visits,
an intensive extension approach.
Agro-dealer networks
Agro-dealers are a cluster of private business operators, organized under the umbrella of Uganda Agro-
input Dealers Association (UNADA). They are for profit entities, dealing in all farm inputs ranging from
seed to chemicals and fertilisers, often in combination. For one to qualify as an agro-dealer, they undergo
one week training facilitated by Makerere University focusing on product knowledge and handling and
must be certified by MAAIF. Much as most agro-dealers don’t have technical knowledge in agriculture,

Platform for Agricultural Risk Management | Crop pests and disease management in Uganda: status and investment needs
69
Full Report | October 2016
they often offer advisory services to farmers at the point of sale, based on their experience with particular
products, or feedback from farmers using particular products. This is partly due to the fact that they
interface with farmers more often, but also due to the lack of adequate extension services in the recent
past.
In Uganda, like most African countries where Alliance for a Green Revolution in Africa (AGRA) is working,
there was a move to build their capacity including to act as service providers. This approach however
presents difficulties due to the fact that their primary objective is profit and not service provision. Ideally
they would be selling products and not necessarily advising farmers. In addition, it’s usually the shop
owners who are trained yet, they are not the ones working in the shop.
4.3 Regional initiatives for pest management At the regional level, several initiatives exist for pest management, linked to national strategies and
programmes. Some of the notable initiatives are:
East African Community: The agriculture and rural development policy for East African Community
(EAC) recognizes the need to manage plant and animal pests, in order to promote sustainable
production and trade. The policy statement mandates the EAC to; Develop and harmonise policies,
legislation and standards on plants, animals and their respective products quality control and safety
assurance; Establish and coordinate mechanisms for monitoring and surveillance of trans-boundary
pests of plants and animals; and Promote research and development in pests and diseases
management programmes. The EAC food security action plan further details how interventions related
to pests and diseases management will be rolled. Key actions include to; Develop and support pest
and disease surveillance system in the region; Enforce disease and pest control measures and
procedures; and Develop regional disease and pest control regimes in the EAC. Further, the EAC
developed an SPS and Quality Assurance, Metrology and Testing (SQMT) protocols, which member
countries are required to ratify. Uganda so far has launched a National Policy on EAC
Integration; adopted 359 standards in line with the SQMT Protocol and ratified the SPS Protocol.
Common Markets for Eastern and Southern Africa (COMESA): The core of COMESA’s strategy for
the agricultural sector is intended to address these two challenges - how to assure food security
through sustainable increase in overall agricultural production, and how to stimulate a strong and
dynamic agriculture-industry link. COMESA agricultural strategy stresses the importance of co-
operation and co-ordination of regional agricultural policy, food security, marketing, research and
development, plant and animal disease and pest control, training, irrigation development, and
exploitation of marine and forestry resources. COMESA Regulations and harmonized Quarantine and
Phytosanitary Measures aim to facilitate safer and faster movement of seeds through the
establishment of common quarantine and phytosanitary measures. If well implemented, such
measures could reduce the direct and indirect costs related to seed trade and result in greater
transparency and harmonization of regulatory processes and documentation.
Association for Strengthening Agricultural Research in East and Central Africa (ASARECA):
ASARECA is a regional hub and think tank for knowledge, information and learning. ASARECA’s
activities mainly include facilitating the generation of Technology Innovations and Management
Programmes (TIMPs) for the sub-region and up-scaling of appropriate TIMPs across borders. It also
contributes to ensuring an enabling policy environment for agricultural transformation thus enhancing
institutional and stakeholder capacities for innovation generation. ASARECA’s past initiatives include;
Sustainable Management of Banana Xanthomonas Wilt within Banana; Management of cassava CMD
and CBSD for improved productivity; Integrated Striga Management for Improved Sorghum
Productivity; management of Napier Grass Smut and Stunt and management of Maize Lethal Necrosis
disease. ASARECA works in partnership with NARS, supporting them to sustainably manage trans-
boundary pests and diseases.

Platform for Agricultural Risk Management | Crop pests and disease management in Uganda: status and investment needs
70
Full Report | October 2016
Integrated Pest Management - Collaborative Research Support Program (IPM-CRSP): East
Africa. This is an initiative of United States Agency for International Development (USAID), whose
purpose is to foster IPM through collaborative research between U.S. and low developed countries
institutions for their mutual benefit by improving their abilities to develop and implement economically
and environmentally sound crop protection methods. The Satellite Sites include Ecuador, Honduras,
Haiti, Uganda, and Thailand. The IPM CRSP fosters participatory, interdisciplinary IPM research,
training, and information exchange programs that will be adopted in (1) horticultural export crop
production in Latin America and the Caribbean, (2) semi-arid transitional systems in the Sahel, and (3)
innovative programs for rice-based food systems in Asia. The activities of the program are broad and
comprehensive. They cover IPM issues on insects, diseases, weeds, and nematodes on both field and
horticultural crops. The broad project activity areas include technical as well as economic, policy, and
socio-cultural issues as related to IPM. In Uganda, the host institution is Makerere University.
Food and Agriculture Organisation of the United Nations (FAO): Under the Plant Production and
Protection Division, FAO has developed a strategy for improved IPM, aimed at promoting Sustainable
Intensification of Crop Production. This requires the integration and harmonization of all appropriate
crop production policies and practices. FAO has focused on developing; effective and strategic
decisions that increase crop production using an ecosystem approach; national capacities to monitor
and to respond to trans-boundary and other important outbreak pests; policies and technologies
appropriate to reduce negative impact of pesticides; and conservation and sustainable use of plant
genetic resources with strong linkages between conservation, plant breeding and seed sector
development.
Australia-Africa Plant Biosecurity Partnership: The Australia-Africa Plant Biosecurity Partnership
(AAPBP) is a plant biosecurity capacity development program using Australian expertise to strengthen
biosecurity skills and planning in Africa. The partnership aims to enhance plant biosecurity capacity in
African countries and regions in order to lift agricultural economic productivity and promote safe trade
in plant commodities. Countries involved include Burundi, Ethiopia, Kenya, Malawi, Mozambique,
Rwanda, Uganda, Tanzania, Zambia and Zimbabwe. The AAPBP is led by Plant Biosecurity
Programme Capacity Development PBCRCP and funded by the Australian International Food Security
Research Centre within the Australian Centre for International Agricultural Research. The program is
being delivered by a consortium of PBCRC, the Crawford Fund and CAB International. The AAPBP
aims to leverage support from other international agencies and to complement other work underway
on plant biosecurity issues in Africa
4. 4 Pest management technologies in Uganda Certain characteristics of a pest management practice or technology are likely to influence the choice of
dissemination method (or methods). Characteristics include:
1. Complexity of the technology and therefore of the messages needed to explain the technology to
farmers;
2. Whether the method is relevant for control at an individual farm level – or whether effective
control depends on collective action by all farmers in an area – or centralized action;
3. Whether purchased inputs are required.
The main pest management methods can be clustered as follows: a) Cultural & physical; b) chemical c)
biological d) use of resistance and e) regulatory. Integrated Pest Management (IPM) has been advocated
for as a sustainable pest management approach. Though presented as a pest management method,
ideally, it’s a set of guiding principles for effective and sustainable pest management. In the following, the
various pest management options are described from a communications perspective and summarized in
Table 4.1.
a) Cultural and physical control
Platform for Agricultural Risk Management | Crop pests and disease management in Uganda: status and investment needs
71
Full Report | October 2016
These are applied control practices aimed at altering conditions or pest behaviors or pest populations.
These practices include; clearing fields of weeds and host plants to reduce harborage; removing infected
plant parts, materials and burning / burying them; mulching; managing manure and other soil amendments
to improve crop vigor; planting timing; crop rotations; using irrigation and related field measures. Passing
on messages related to cultural practices may require relatively more intense dissemination approaches
such as extension agent visits or moderate approaches like field days. For management of some pests,
collective action is required because if only a few farmers implement field sanitation measures, their crops
may still be infected as a result of poor sanitation in their neighbors fields. For example in the control of
Banana xanthomonas wilt, collective community action was used due to the ease of spread of the disease
from infected fields to non-infected fields.
b) Chemical control
Chemical crop protection products (pesticides) are biologically active chemicals that control a range of
insect and vertebrate pests, diseases and weeds. Pesticides may be systemic or contact, selective or non-
selective, and residual or non-residual. Effective application of pesticides requires that farmer have
appropriate knowledge of the type of pesticide in relation to the pest or disease they intend to manage.
Use of pesticides is effective, fast and easy but requires proper diagnosis of the pest/disease problem is
key, followed by appropriate application. Responsible use and good handling practices limit potential
pesticide residues in crops and the environment as well as help avoid pest resurgence and resistance. To
ensure this, there is need for demonstrations and more intensive extension approaches that incorporate
follow up and routine check with farmers on usage of chemicals.
c) Biological control
This involves nature’s own methods of pest control. This includes introduction of beneficial insects or
predators; applying micro-organisms such as viruses, fungi and bacteria; and using pheromones to lure,
trap and kill or interfere with insects’ mating habits.
i. Use of natural enemies: This involves mass rearing of the pest natural enemy and its periodic
release into the environment. An example is mass rearing and release of T. aripo against
cassava green mite and cassava mealy bug in Uganda. The natural enemy was obtained from
IITA (West Africa) and currently managed by the Bio-Control Unit at the NARL in Kawanda.
Deployment of the natural enemy is considered easy, even farmers can do it once given the
biocontrol agent by research. Once released, the enemy sustains its self for long in the habitat
though a post release monitoring is required to ensure pest populations do not build up.
ii. Bio-pesticides: Involves the mass rearing and use of bacteria, fungi, nematodes or viruses to
control some pests. The most common and successful is Bacillus thuringiensis (Bt), a naturally
occurring bacterium, which has been used to control several important pests (e.g. caterpillar
pests in vegetables, vineyards and orchards). Use of bio-pesticides is moderately complex and
farmers need practical guidance on how to apply them.
iii. Sex pheromones baits and traps: This involves the development and use of insect sex
pheromones and other behavior-modifying chemicals to trap and kill pests. Some pheromones
disrupt mating thus slowing down population build-up of insect pests. Often use of traps requires
collective action – and messages are relatively complicated. Sometimes farmers operating traps
for monitoring are perceived to be rearing and releasing the pest.
d) Use of resistance
This involves use of planting materials that have levels of resistance or tolerance to pests and diseases.
Two approaches are commonly used:
i. Pest or disease resistant varieties. NARO and other research institutions have developed
various crop varieties with resistance to pests and diseases. Farmers need to be aware of these
varieties and associated costs of acquiring seed/planting materials. Raising awareness of new
varieties is likely to involve relatively simple messages – explaining what the advantages are and
indicating where to buy a variety. To enhance further learning and observations, intermediate
approaches such as farmer field days and demonstrations may be undertaken so that farmers
observe first had the difference between their own varieties and resistant ones, and possibly
Platform for Agricultural Risk Management | Crop pests and disease management in Uganda: status and investment needs
72
Full Report | October 2016
associated agronomic practices.
ii. Grafting or budding is also used to enhance resistance of plants by selecting a resistant root
stock on which a desirable plant material (high performing but susceptible) is grafted. Grafting has
mainly been used in the management of pests and disease in fruits and vegetables. The
technique is quite complex and therefore requires more intensive extension approaches,
combined with demonstrations for farmers to be able to understand and effectively adopt it.
e) Regulatory pest management
The objective of regulatory pest management is to prevent the introduction and/or spread of pests through
the application of various pest management techniques such as pest exclusion, detection, eradication,
mitigation, and public education. Achieving this objective requires limiting movement of commodities and
materials, and treating commodities, materials, and the environment. This requires regulatory authorities to
efficiently and effectively identify pest harm, assess pest risk; and manage pest risk. Two approaches are
commonly used:
i. Quarantine: The primary strategy to exclude pest entry is through the use of quarantines.
Quarantine inspection programs at ports of entry are designed to prevent the introduction and
establishment of pests into the country. Quarantine can be effective at reducing the incidence of
pest introduction and reduce any incidents of pest introduction to a manageable population that
can be eradicated.
ii. Eradication: If prevention is not successful and an introduction occurs, there is need for the
control programme to institute eradication measures. Eradication generally means using all
available viable options, which often includes the application of pesticides or destruction of plant
materials. Eradication programmes require participation of farmers and communities who must
first be sensitized especially if losses to farmers are anticipated. Farmers require adequate
knowledge of such pests and implications for non-compliance. Moderately intensive measures
such as field days can be used for farmer education, or lighter methods such as mass campaigns
through radio and TV.
f) Integrated pest management (IPM)
IPM means considering all available pest control techniques and other measures that discourage the
development of pest populations, while minimizing risks to human health and the environment. IPM
emphasizes the growth of a healthy crop with the least possible disruption to agro-ecosystems and
encourages natural pest control mechanisms (FAO, 2012). IPM requires a combination of cultural,
biological and chemical measures to manage diseases, insects, weeds and other pests. It takes into
account all relevant control tactics and methods that are locally available, evaluating their potential cost-
effectiveness Implementation of IPM lies with farmers, who adopt practices they view as practical and
valuable to their activities. Ultimately, IPM is a site-specific strategy for managing pests in the most cost-
effective, environmentally sound and socially acceptable way. Using IPM is rather complex and require
intensive extension measures to ensure that farmers learn and adopt IPM practices.
Tabella 10: Typology of pest management practices from a communication’s perspective
Pest management methods
Examples of pest management practices Complexity of message
Individual/Collective / Centralised action
Purchased inputs required
Cultural and physical Destruction of infected plant parts Moderate Collective No
Fertility management Moderate Individual Yes
Soil and water management Moderate Individual Yes
Crop rotation Simple Individual No
Weed management Moderate Individual Yes

Platform for Agricultural Risk Management | Crop pests and disease management in Uganda: status and investment needs
73
Full Report | October 2016
Chemical Inorganic pesticides Moderate Centralized Yes
Organic pesticides Moderate Individual No
Biological Natural enemies Moderate Centralised Yes
Bio-pesticides Moderate Individual Yes
Pheromone baits and traps Complex Collective Yes
Resistance Pest resistant varieties Simple Individual Yes
Grafting or budding Complex Individual Yes
Regulatory Quarantine Complex Centralized Yes
Eradication programmes Complex Centralized Yes
Integrated pest management
Integrated pest management Complex Individual Sometimes
4. 5 Cost efficiency of extension methods Impacts and benefits achieved by a given extension approach can be very variable. Although there are
studies on the impacts of different approaches (including Farmer Field Schools, radio, mobile delivery and
plant clinics) – impact assessments usually focus on the impact of particular practices and technologies.
The economic benefit of an approach will depend not only on the effectiveness of the approach in
influencing adoption – but also on the effectiveness of the practice or technology promoted to influence
production.
The costs of and benefits from utilizing different extension methods to promote or train in pest
management practices can differ depending on the intensity of the method (on the cost side) and the
complexity of the practice and the influence that this has on the probability of farmer adoption—and thus
the benefit side. Harris et al. (2013) talks of three levels of complexity: ‘‘simple,’’ ‘‘intermediate,’’ and
‘‘complex’’ technologies and noted that choice of extension approach should be influenced by the type of
technology with low intensity approaches being used for simple technologies and higher intensity methods
for more complex technologies.
It is assumed then that once farmers adopt technologies, they will be able to reduce crop losses as a result
of pest and disease damage thus increasing their production and profitability. Similarly, there is likely to be
spontaneous diffusion of technologies from farmer to farmer, if the technology is appreciated. Neighbours
and other family members are often the most frequently cited source of information in studies, however we
did not find indications in the literature that information acquired by farmers from different approaches were
more or less likely to be shared – therefore the spillover effects were not considered.
The magnitude of economic benefits from a single dissemination activity therefore depends on the
resources devoted to the activity, the number of farmers reached, the resulting level of adoption including
spillovers and economic benefits of the technology (e.g., yield increase, input cost reductions, reduced
consumer prices). Given the enormous range of possible practices that could be considered we avoid
looking at monetary benefits of adoption and thus focus on cost-efficiency reflecting numbers reached and
likelihood of adoption.
At the same time, many other factors influence adoption. For example: the timeliness of advice given,
availability and affordability of any required inputs such as seed, fertilizer, crop protection products or
labour; there should be adequate incentives for the farmers to be able to apply advice such as available
market and the expected benefits should at least offset the costs.

Platform for Agricultural Risk Management | Crop pests and disease management in Uganda: status and investment needs
74
Full Report | October 2016
In summary, agricultural extension projects generally can have strong and positive impacts on producer
outcomes, but estimates also reveal high variance and are plagued by a number of measurement and
attribution problems. Similarly, different extension methods achieve different results with different levels of
investment. This has raised debate over the most appropriate diffusion methods.
In the analysis of cost-effectiveness, we first review the cost “ingredients” for different extension
approaches, but then focus on variable costs of each method to estimate a cost per farmer reached. This
is then converted into cost efficiency (cost per farmer adopting) for simple and complex technologies using
estimates of likelihood of adoption based on “expert opinion” using information on adoption rates from the
literature and personal experiences of the authors. We also briefly discuss other factors that may
influence choice of approach.
4.5.1 Cost ingredients of extension approaches
The costs of extension are defined as the value of the resources that are given up by society to effect the
information delivery. These are referred to as the ingredients of the extension approach, and it is the value
of those ingredients that constitute its overall cost. In doing a cost analysis, the first step is to ascertain
which ingredients are required for a given extension approach. Once the ingredients have been identified,
then their cost is ascertained. Costs of extension include both fixed and variable costs, along with the
marginal costs of these programs. Fixed costs are incurred by the institutions that implement extension
and do not increase when additional events are held or when more farmers participate. Variable costs are
the costs that increase when more events are held or when more farmers attend. The marginal cost is the
cost of providing an additional session or allowing an additional farmer to participate. Each of these types
of cost provides a different aspect of the true cost of administering extension for pest management. Table
4.2 shows the cost ingredients associated with selected extension approaches.
Tabella 11: Cost ingredients associated with selected extension approach
Extension approach
Fixed costs Variable costs Marginal costs
Extension agent visits
- Maintaining the national extension including recruitment costs, cost of technical backstopping and administration
- Re training and re-tooling extension agents
- Extension agent’s salary - Perdiems for field visits - Transportation (fuel, lubricants
and spares)
Extension agents visit about 10 farmers per day. Reaching more farmers involves increasing the frequency of visits.
FFS - Costs associated with administering the national level program such as paying consultants and administrators
- Research on the field school program - Development of the curriculum - Training master trainers and
facilitators
- Extension agent’s salary - Materials - Food and refreshments - Renting locations
FFS curriculum is designed to train no more than 25 farmers at a time. Increasing the number of farmers, implies a different FFS with all the associated variable costs
Plant clinics - Training of Plant doctors - Equipping plant doctors (prescription
books, pest and disease management guides, knife and magnifying glass, plant doctor coats).
- Costs associated with administering the national level program such as national steering committees, data collection and management, local level supervision, cost of tablets for e-clinics etc.
- Extension agent’s salary - Allowances for clinic staff - Transport of furniture and tent - Casual labour to set up the
tent - Publicity
Plant clinics operate for 2-3 hours a day during public gatherings such as market days. Reaching more farmers requires establishment of more clinics or increasing the frequency of clinics.
Farmer field days
- None - Extension agent’s salary - Publicity and invitations - Facilitators’ allowances
Extra food /refreshments and materials for the additional participants

Platform for Agricultural Risk Management | Crop pests and disease management in Uganda: status and investment needs
75
Full Report | October 2016
- Food and refreshments - Training materials - Transportation costs and
venue hire
Village based intermediaries
- Training costs - Transport and materials support (e.g.
bicycle, gumboots) - Admin of national program
- Information materials - Opportunity cost of
intermediary’s time - Allowances for the advisors in
some cases
An intermediary would have capacity to interact with a fixed number of farmers – additional farmers would require more facilitators
Radio - Radio programs and scripts - Cost of managing the program - Content development and packaging
- Cost of airtime - Facilitator’s allowance and
transport
Different radio stations have a fixed reach. The additional costs would relate to more programs being aired and/or more stations being used.
4.5.2 Cost per farmer for different extension approaches
The number of farmers each method reaches includes those farmers in direct contact with the program
plus the spread from those farmers to other farmers who did not have the initial direct contact. Determining
how many farmers each method reaches for a given budget requires information on the number of people
who participate in the various types of training. For this analysis, we obtained information on the number of
people reached from the organisations that sponsor extension programs, whether face to face, through an
intermediary or through mass media. The cost associated with each extension method was then divided by
the number of people reached to obtain per farmer cost.
Cost estimates for various extension approaches and per farmer cost are shown in Table 4.3. Average
costs are based on results obtained from key informant interviews. The costs that the study examines are
the variable field cost of administering various extension methods. Fixed costs are not considered on
assumption that sustainability of the system is based not on fixed but recurrent costs of maintaining it.
Similarly, the analysis does not include the opportunity costs of farmers time on assumption that their time
is covered by added benefits of participating in the trainings or receiving information.
Extension agents involved in training and visits and village-based intermediaries have a relatively fixed
client base. In estimating variable costs for extension agents, it was assumed that only 20% of their time is
spent on training and visit activities – this may be pest management or other aspects of crop production,
soil fertility and enterprise management. In the remaining time they are engaged in other activities,
including some of the other extension approaches e.g. field days, plant clinics, FFS etc. Village based
advisors are normally not remunerated, but some cases where they received an allowance were
encountered during the KIIs. For example Grameen Foundation initially paid CKWs an allowance of
UGX100,000 per month as a startup. Other extension approaches, such as farmer field days and plant
clinics, involve a single or series of events. The total number of farmers reached in this case depends on
the frequency of the events, not necessarily implemented in the same locations. In this case, number of
farmers reached are estimated for a single event. Radio is different as each station covers a fixed area.
Costs are given for a single 30 minute programme following a talk-show format. For FFS, salary costs are
estimated assuming 1 day is spent on each ½ day session (including preparation and travel).
Tabella 12: Variable costs associated with administration of extension methods
Extension methodd
Variable costs Costs (UGX) Costs (USD)
# farmers reached
USD/ farmer
Extension agent visits (1-day trainings)
Extension agent salary (20% of time on T&V)a 1,920,000 582
Perdiems for field visitsb 880,000 267
Transportation (fuel, lubricants and spares) 288,000 87
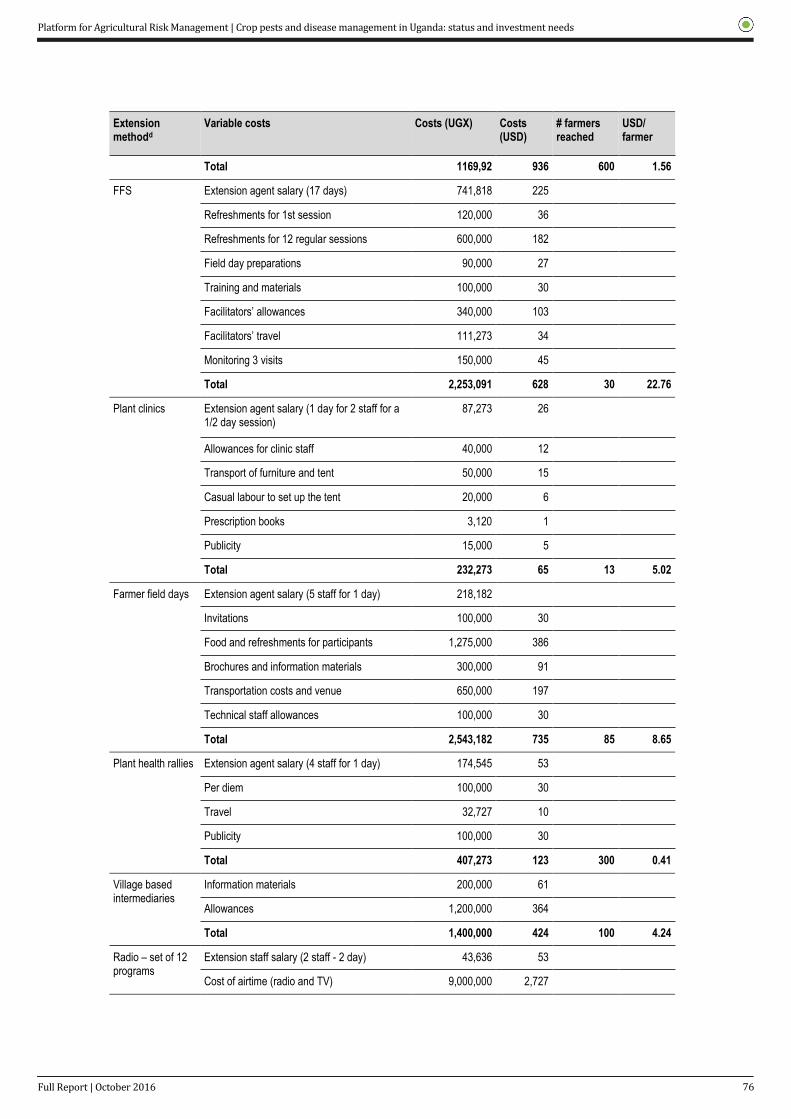
Platform for Agricultural Risk Management | Crop pests and disease management in Uganda: status and investment needs
76
Full Report | October 2016
Extension methodd
Variable costs Costs (UGX) Costs (USD)
# farmers reached
USD/ farmer
Total 1169,92 936 600 1.56
FFS Extension agent salary (17 days) 741,818 225
Refreshments for 1st session 120,000 36
Refreshments for 12 regular sessions 600,000 182
Field day preparations 90,000 27
Training and materials 100,000 30
Facilitators’ allowances 340,000 103
Facilitators’ travel 111,273 34
Monitoring 3 visits 150,000 45
Total 2,253,091 628 30 22.76
Plant clinics Extension agent salary (1 day for 2 staff for a 1/2 day session)
87,273 26
Allowances for clinic staff 40,000 12
Transport of furniture and tent 50,000 15
Casual labour to set up the tent 20,000 6
Prescription books 3,120 1
Publicity 15,000 5
Total 232,273 65 13 5.02
Farmer field days Extension agent salary (5 staff for 1 day) 218,182
Invitations 100,000 30
Food and refreshments for participants 1,275,000 386
Brochures and information materials 300,000 91
Transportation costs and venue 650,000 197
Technical staff allowances 100,000 30
Total 2,543,182 735 85 8.65
Plant health rallies Extension agent salary (4 staff for 1 day) 174,545 53
Per diem 100,000 30
Travel 32,727 10
Publicity 100,000 30
Total 407,273 123 300 0.41
Village based intermediaries
Information materials 200,000 61
Allowances 1,200,000 364
Total 1,400,000 424 100 4.24
Radio – set of 12 programs
Extension staff salary (2 staff - 2 day) 43,636 53
Cost of airtime (radio and TV) 9,000,000 2,727

Platform for Agricultural Risk Management | Crop pests and disease management in Uganda: status and investment needs
77
Full Report | October 2016
Extension methodd
Variable costs Costs (UGX) Costs (USD)
# farmers reached
USD/ farmer
Allowance for technical staff for radio 200,000 61
Total 9,374,545 2,841 150,000 0.02
Print media Cost of print publication (newspaper pages) 5,000,000 1,515 5,000 0.30
Mobile Cost of SMS for phone based messagingc 2,400,000 727 2,000 0.36
Notes: a) Salary cost of extension staff in each case assumes a similar person with a standard salary typical of a field extension staff grade and is based on the number of days spent on a particular event or series of events. b) Different allowances for per diem and travel were mentioned by different groups – reflecting different rates agreed with different projects. A standard rate of UGX 20,000 as day allowance was used in calculations. c) Costs based on sample private sector company charges for delivering 30 SMS to 2000 farmers over a period of 3 months (each sms at UGX40). d) Information used for different methods were gathered from key informants including; CABI, ISSD Uganda, Grameen Foundation, Farm Radio International, as well as review of literature for FFS e) it should be noted that the more intensive methods particularly FFS cover a larger number of topics compared to other approaches.
Results from Table 4.3 show that mass media approaches (mobile, print and radio) have the lowest per
farmer cost. This is because the cost of administering these programs is very low and their potential reach
is very high. Extension agent visits, village intermediaries and plant clinics also have much lower cost of
reaching farmers approximately $2, $4 and $5 per farmer respectively. Farmer Field Schools have the
highest per farmer cost at $23. Extension agent visits are classified as very intensive approaches due to
the routine training and follow up visits that are conducted by extension agents. The advantage is that the
trainings may be conducted in groups, often involving demonstrations and follow ups which enhance
farmer learning and retention of trained techniques.
4.5.3 Cost efficiency of extension approaches using estimated adoption rates
Dissemination alone does not yield benefits; farmers who learn about a practice must decide to adopt it.
Thus the effectiveness of extension also depends on the ability to affect adoption of technologies. Based
on technology characteristics, certain dissemination methods may be more effective in inducing adoption
than others. Less speedy but interactive approaches such as field days, agent visits and FFS may be
appropriate for passing on more complex technologies such as IPM. These approaches allow for farmer
participation and experiential learning which ultimately improves adoption. Table 4.4 presents costs
efficiency estimates for the range of extension methods.
Tabella 13: Cost efficiency estimates for various extension methods
Method Cost $/ farmer (variable only)
No. farmers /$1,000 (n)
Probability of adoption of simple message (p1)
Probability of adoption of complex message (p2)
Effectiveness for simple message (n x p1)
Effectiveness for complex message (n x p2)
Extension agent visits 1.6 641 0.3 0.2 192.3 153.8
Farmer field schools 22.8 44 0.4 0.4 17.6 15.8
Plant clinics 5.0 202 0.3 0.2 60.6 42.4
Farmer field days 8.7 116 0.3 0.2 34.7 24.3
Plant health rallies 0.4 2,439 0.2 0.1 487.8 292.7
Village based intermediaries 4.2 236 0.2 0.1 47.2 28.3
Radio 0.0 52,632 0.02 0.00 1052.6 210.5
Print media 0.3 3,333 0.03 0.01 100.0 20.0

Platform for Agricultural Risk Management | Crop pests and disease management in Uganda: status and investment needs
78
Full Report | October 2016
Method Cost $/ farmer (variable only)
No. farmers /$1,000 (n)
Probability of adoption of simple message (p1)
Probability of adoption of complex message (p2)
Effectiveness for simple message (n x p1)
Effectiveness for complex message (n x p2)
Mobile 1.8 556 0.02 0.00 11.1 2.2
Notes: a) Probability of adoption of simple messages is based on data from the literature (e.g. Harris et al.2013) as well as individual experiences of the authors
From the analysis (Table 4.4), radio emerges as the most cost efficient for simple and complex messages
because of the high reach, though it should be noted that the costs and reach can be variable. Often a
series of radio shows are carried out – costs above are based on a single 30 minute show. FRI commonly
use a campaign approach with 12-18 shows, participatory listening groups and feedback mechanism that
increase costs – though also adoption rates.
In contrast to radio the high effectiveness of extension training and visits is attributed to the high adoption
rates of techniques by farmers. Extension agents have capability to reach many farmers with information
on pest management and offer an opportunity for further follow up to ensure that trained techniques are
fully adopted. The biggest drawback of using extension agent is the big cost of establishing and
maintaining the national extension system. But once established, the transactions costs are much lower
compared to the benefits achieved.
Farmer field days follow in line in terms of their relative cost-effectiveness. Farmer field days are
interactive, allowing farmers to engage with the technical teams on pest management. They also attract
varied stakeholders who provide options for pest management, reaching many farmers. MAAIF has
recorded success stories in the management of BXW using farmer field days. Farmer field days targeted
in BXW hotspots demonstrated appropriate management practices. It’s documented that as a result, BXW
incidence reduced from over 45% in June 2012 to below 13% at farm level and to 3% at plant level in
November 2013 (Byantwale, 2014).
Analysis of FFS on the other hand shows high per farmer cost and relatively lower farmer benefits due to a
relatively low number of farmers reached compared to other dissemination methods. This has also largely
been the reason why FFS have been criticised – high participant costs. Waddington and White (2014) in
their review of over 500 FFS evaluations report overall change in farmer practices and yield increases in
pilot projects, but less effectiveness when FFS are taken to scale. The FFS approach requires a degree of
facilitation and skilled facilitators, which are difficult to sustain beyond the life of the pilot programs. FFS
still present the most appropriate for passing on more complex pest management technologies such as
integrated pest management. For this approach to be cost-effective, requires that knowledge obtained
spills over to non-participating farmers and that farmers transfer their knowledge to other crops (Ricker-
Gilbert et al., 2008). This would directly increase the number of participants, thus reducing the per farmer
cost. A mechanism to ensure spillover of information is important when using FFS approach.
4.5.4 Speed of information spread
Information on some pest and disease outbreaks and early warning of emerging pests and diseases, if not
delivered early in an outbreak or before a new pest has time to spread could have negative consequences.
For such information, finding a method that spreads information to large numbers of farmers quickly can
be very important. Based on expert opinion we assume that mass media reaches farmers at the fastest
rate of all formal methods. For example MAAIF launched awareness campaigns on BXW in several FM
radios in all the 4 main banana growing regions (central, mid-west, south west and east) in Uganda. As a
result of the campaign, significant recovery of fields was registered - up to 60.9% in south west between
June 2012 and November 2013 (Byantwale, 2014). Use of mass media approaches have also been
applied to pass on information related to identification and management of maize lethal necrosis (MLN),
cassava brown streak disease (CBSD) and other outbreaks. Early warning systems and advisories have
also been based on mass media due to the speed desired for farmers to be able to make timely decisions

Platform for Agricultural Risk Management | Crop pests and disease management in Uganda: status and investment needs
79
Full Report | October 2016
within the season.
Other methods such as field days and extension agent visits that rely on a relatively small number of
extension staff means that information is spread more slowly. Although technologies that are complex may
require interactive approaches, to ensure learning and proper application, this may be particularly
important for integrated pest management approaches that are often knowledge intensive. FFS takes even
more time – but, many argue leads to additional benefits including increased capacity of farmers to solve
new problems.
4.6 Summary and recommendations for pest management The analysis provides a description of extension approaches and their effectiveness in achieving pest
management. A number of factors affect overall effectiveness of extension methods. As explained there is
a trade-off between reaching large numbers and achieving levels of understanding for farmers that allows
them to adopt recommendations. Low intensity and mass media approaches can reach large numbers at
low cost but are probably not suited to clearly getting across a complex message. High intensity
interactions are more likely to lead to adoption of complex approaches – but this means that relatively few
farmers can be reached.
Uganda government is already committed to staffing a single spine extension system that will put
extension staff at sub-county level across the country. However, it is inevitable that staff will still have
large numbers of farmers in their catchment areas. Ideally work-plans would be developed together with
government departments that rely on them for service delivery, including the DCP, to ensure that priorities
are addressed. At the same time plans would ideally embed different methods and approaches that use
their time most efficiently and at the same time leverage contributions from other service providers
including village based intermediaries and value chain stakeholders. Some scenarios with implications for
pest management include:
Where a new pest is detected or a pest outbreak occurs and it is important to deliver information
quickly to large numbers, mass media may be most appropriate – as well as rapid field based methods
such as plant health rallies and farmer field days. Such methods may encourage farmers to seek
further information from different sources.
For well-organized value chains, private sector service provision is feasible and already taking place.
For advice on these crops, extension staff should also link with these service providers to spread
messages further. DAE already has a plan of profiling extension service providers, which will provide
an opportunity for coordinated extension delivery.
To ensure access to good advice – sources of information should be linked and made accessible.
This is likely to capitalize on improving ICT infrastructure, for example through open and linked
databases.
In some cases, where introduction of complex pest control methods are to be encouraged, more
intensive methods such as farmer field schools could be used with selected farmers – complemented
by the use of farmer field days, demonstration plots etc.
For demand-led advisory services for crop problems, plant clinics provide a method that has the
added advantage of providing a pest monitoring approach. Targeting clinics strategically in districts
where crop production is key and in areas of intensive production within districts would give good
coverage of where new pests detections are most likely as well as providing advisory services.
To be effective extension staff as well as other intermediaries need to be well trained and equipped with
various dissemination approaches / tools that they can employ depending on the nature of the message
they intend to disseminate. Close collaboration with academia (e.g. Makerere University) to facilitate
inclusion of new methods into curricula would contribute to capacity building. Currently MAAIF is working
with 4 agricultural institutions – Makerere, Gulu and Uganda Christian Universities and Bukalasa
agricultural college to develop the curriculum.
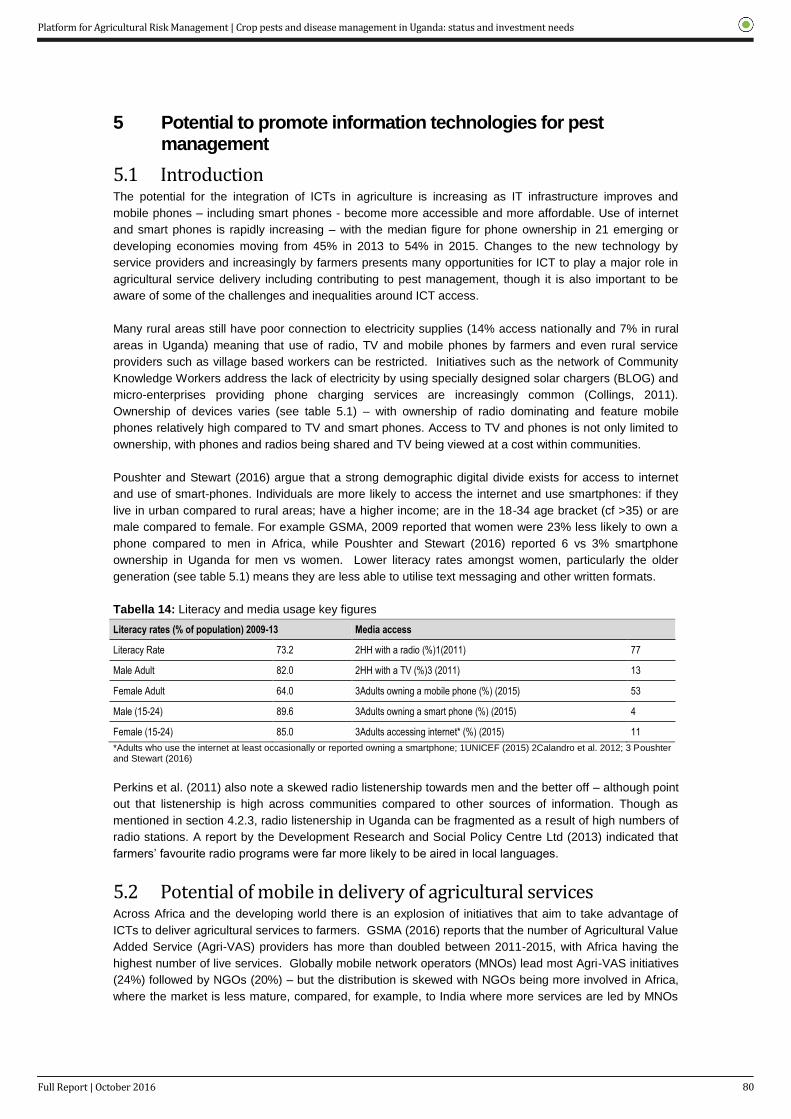
Platform for Agricultural Risk Management | Crop pests and disease management in Uganda: status and investment needs
80
Full Report | October 2016
5 Potential to promote information technologies for pest management
5.1 Introduction The potential for the integration of ICTs in agriculture is increasing as IT infrastructure improves and
mobile phones – including smart phones - become more accessible and more affordable. Use of internet
and smart phones is rapidly increasing – with the median figure for phone ownership in 21 emerging or
developing economies moving from 45% in 2013 to 54% in 2015. Changes to the new technology by
service providers and increasingly by farmers presents many opportunities for ICT to play a major role in
agricultural service delivery including contributing to pest management, though it is also important to be
aware of some of the challenges and inequalities around ICT access.
Many rural areas still have poor connection to electricity supplies (14% access nationally and 7% in rural
areas in Uganda) meaning that use of radio, TV and mobile phones by farmers and even rural service
providers such as village based workers can be restricted. Initiatives such as the network of Community
Knowledge Workers address the lack of electricity by using specially designed solar chargers (BLOG) and
micro-enterprises providing phone charging services are increasingly common (Collings, 2011).
Ownership of devices varies (see table 5.1) – with ownership of radio dominating and feature mobile
phones relatively high compared to TV and smart phones. Access to TV and phones is not only limited to
ownership, with phones and radios being shared and TV being viewed at a cost within communities.
Poushter and Stewart (2016) argue that a strong demographic digital divide exists for access to internet
and use of smart-phones. Individuals are more likely to access the internet and use smartphones: if they
live in urban compared to rural areas; have a higher income; are in the 18-34 age bracket (cf >35) or are
male compared to female. For example GSMA, 2009 reported that women were 23% less likely to own a
phone compared to men in Africa, while Poushter and Stewart (2016) reported 6 vs 3% smartphone
ownership in Uganda for men vs women. Lower literacy rates amongst women, particularly the older
generation (see table 5.1) means they are less able to utilise text messaging and other written formats.
Tabella 14: Literacy and media usage key figures
Literacy rates (% of population) 2009-13 Media access
Literacy Rate 73.2 2HH with a radio (%)1(2011) 77
Male Adult 82.0 2HH with a TV (%)3 (2011) 13
Female Adult 64.0 3Adults owning a mobile phone (%) (2015) 53
Male (15-24) 89.6 3Adults owning a smart phone (%) (2015) 4
Female (15-24) 85.0 3Adults accessing internet* (%) (2015) 11
*Adults who use the internet at least occasionally or reported owning a smartphone; 1UNICEF (2015) 2Calandro et al. 2012; 3 Poushter and Stewart (2016)
Perkins et al. (2011) also note a skewed radio listenership towards men and the better off – although point
out that listenership is high across communities compared to other sources of information. Though as
mentioned in section 4.2.3, radio listenership in Uganda can be fragmented as a result of high numbers of
radio stations. A report by the Development Research and Social Policy Centre Ltd (2013) indicated that
farmers’ favourite radio programs were far more likely to be aired in local languages.
5.2 Potential of mobile in delivery of agricultural services Across Africa and the developing world there is an explosion of initiatives that aim to take advantage of
ICTs to deliver agricultural services to farmers. GSMA (2016) reports that the number of Agricultural Value
Added Service (Agri-VAS) providers has more than doubled between 2011-2015, with Africa having the
highest number of live services. Globally mobile network operators (MNOs) lead most Agri-VAS initiatives
(24%) followed by NGOs (20%) – but the distribution is skewed with NGOs being more involved in Africa,
where the market is less mature, compared, for example, to India where more services are led by MNOs

Platform for Agricultural Risk Management | Crop pests and disease management in Uganda: status and investment needs
81
Full Report | October 2016
and VAS providers (GSMA 2016). Uganda is no exception – though in a workshop held recently it was
considered that the marketplace is currently less crowded with service providers than other African
countries (pers comm. R. Rwakigumbe, MercyCorps), possibly because of the relatively low mobile
penetration in the country. An overview of some of the mAgri services operating in Uganda as well as
other initiatives using ICT are given in Appendix 2.
GSMA (2016) defines business models of existing Agri-VAS as falling in two broad categories: a direct
revenue model and an indirect benefits model. Under the direct revenue model, three “sub-models’ are
defined: a) smallholders pay a fee to use the service; b) agribusinesses pay for farmers to access the
services and c) a mixture of both. The indirect revenue model applies only to mobile operators who can
derive non-cash benefits, such as increased market share and rural acquisitions; higher usage of SIM
cards for core services, data usage, or other VAS usage; customer loyalty; and related churn reduction
and brand awareness. In addition there are subsidised models, where the Agri-VAS relies mainly on
donors, NGOs, government agencies, or private companies to sustain their operations. In Uganda – some
actors are looking to establish direct revenue models, but direct payment for services is farmers is rare.
FIT-Uganda is a good example where its Infotrade service operates a mixed model with some payments
by farmers. According to key informant interviews – a significant amount of donor support was still being
provided through NGOs and other partners using the FIT-Uganda platform. Some models are emerging
within closed value chains – where a private sector enterprise uses ICT platforms to support its business
with farmers. A good example of this is the Joseph Initiative. As far as the team is aware – no services led
by mobile operators were identified.
5.3 Potential for information technology in data collection and sharing Most of the ICT initiatives involve both collection and sharing of data and information. Data collected
centrally by services consulted included: farmer profiles collected alongside farmer numbers, market
information (prices and information on buyers and sellers of commodities); data on queries asked by
farmers (nature of request); feedback on services or topics covered in radio programs and socio-economic
and other data collected during surveys applied as part of services. Few collected data on pests and
diseases except for the plant doctors receiving visitors at plant health clinics in the CABI lead Plantwise
program.
Farmer profiles / numbers: FIT-Uganda explained the importance of farmer profiling – not only to allow
farmers to receive information that is relevant to them – but to start to build an identity that can help
farmers access services such as finance or insurance. Such information also has a high value to service
providers including: input-suppliers, banks, insurance companies, traders etc. Profiles generally include
information on farmer location, crops grown and acreage as well as demographic information on age, sex
etc. FIT are also developing a farm record management solution to help farmers keep records – as
service providers are looking for this. The Joseph Initiative uses a technology platform that monitors all
operations where farmers delivering to the company are registered and transactions recorded (Bymolt,
2015). A challenge for maintaining databases of farmer profiles is the high churn rate (switching between
mobile service providers or numbers) – meaning that it is sometimes difficult to keep track of farmers.
Market data: Market data normally incurs a cost – as prices change constantly and value is in receiving
real-time prices. In most cases agents are present in key markets distributed across the country where the
services operate.
Socioeconomic survey data: Two initiatives: Gutsinda and Grameen Foundation implement surveys
using their networks of village agents, collecting monitoring and evaluation data paid for by partners.
Technical information on good practices: Information formed a core part of most systems, with most
initiatives providing technical information related to crop production including input supply. Information is
sourced nationally (e.g. from NARO, NaCRRI) or regionally / internationally (e.g. AGRA / ASARECA /

Platform for Agricultural Risk Management | Crop pests and disease management in Uganda: status and investment needs
82
Full Report | October 2016
CABI / FAO / CGIAR). Information databases are developed that can be accessed using a smart phone by
intermediaries (e.g. Gutsinda Development Group, Grameen Foundation, CABI-Plantwise) or over the web
(e.g. AGINSBA (Agricultural Innovation System Brokerage Association) and the Plantwise Knowledge
Bank) although during the review team attempts to access content databases, this was only possible for
the Plantwise Knowledge Bank which is currently donor supported and open access. In a Plantwise
meeting with ICT4AG partners, there was interest in developing a common framework leveraging different
initiatives. Most claimed to include information on crop pests and diseases in their databases. Only
Plantwise specialized on pests and diseases.
5.4 Potential for information technology to track and monitor pests 5.4.1 Current pest monitoring systems
Currently, the primary source of monitoring pests and diseases for MAAIF is from local extension agents
that have a responsibility to report pest and disease outbreaks in their localities. The information may
come from their own observations or reports from farmers. The extension workers report to the District
Agricultural Officers, who then report to the Department of Crop Protection in MAAIF. Other information
sources are direct reports from farmers, Local government, Zonal Agricultural Research Institutes, and
border post monitoring units. The Department of Crop protection has provided a direct line where issues
related to pest and diseases can be reported. An interviewee noted that the private sector focus on data
related to profits and sales rather than on pests and diseases. Although they also noted that flower
exporters are keen on pest reporting and that it was more common for high value crops, where private
sector need the data and will therefore help generate it.
Once information is received, the Plant Protection and Health Technical Committee (see section 3.1.4)
evaluates the extent of the problem and devises strategies for management of the pest/disease.
Depending on the nature of the pest/disease, MAAIF may mandate District Agricultural Officers to take
action. Action is often with support from international organisations e.g. recent development of a manual
and work plan for MLND and interventions brought to the Plantwise steering committee.
MAAIF also receives information through partnerships with other agencies including FEWSNET and
ACTED (both collecting data for early warning systems) UNMA (National Meterological Authority) and
related agencies. As far as the consultants are aware – this information mainly relates to drought early
warning rather and does not include pest and disease information.
5.4.2 Current use of ICT for pest monitoring
Plantwise: Use of information technologies is currently limited, although DCP staff interviewed referred to
the data collected at plant clinics under the Plantwise program. Plantwise involves establishment of a
sustainable network of local plant clinics, run by trained plant doctors, where farmers can find practical
plant health advice. In Uganda, plant doctors are mainly local government or, when NAADS was
operational in extension, NAADS staff. A number of NGOs (including Self Help Africa, Rwenzori
Information Centres Network (RICNET) and; Soroti Catholic Diocese Integrated Development Organization
(SOCADIDO) support plant clinics, usually also working with government staff as plant doctors. Data is
currently collected using paper forms that are collected and entered by a data manager, working in DCP,
into the CABI managed Plantwise Online Monitoring System (POMS). Plantwise promotes sharing data
nationally as widely as possible, but provides access to data according to the wishes of the national
counterpart. It was highlighted in key informant interviews that some of the data can have major
implications for trade and therefore access is largely restricted to DCP staff. However, the data can
potentially be used to identify new outbreaks of endemic pests and diseases as well as occurrence of new
pests and diseases and can act as an early warning system to trigger responses.
At the same time data can give an overview of the main pests and diseases by crop by region. To illustrate
data available, Appendix 3 gives an overview of crops brought to clinics in different regions by male and
female farmers. Similar tables can also be developed for problems diagnosed by crop and by region and
Platform for Agricultural Risk Management | Crop pests and disease management in Uganda: status and investment needs
83
Full Report | October 2016
advice given. This data is not presented because of restrictions. Other potential uses of data include:
identification of gaps in plant doctor knowledge that can be used to target additional training and;
monitoring of advice on banned chemicals.
The paper based system of data collection is slow and many plant doctors dislike completing the paper
forms as they don’t see direct benefits for themselves. In order to improve diagnostics and speed of
information delivery, CABI and MAAIF are currently starting to pilot e-clinics, shown to be successful in
Kenya (Wright et al. 2016) - using internet enabled tablets at the clinics. The tablets allow access to the
Plantwise factsheet application and knowledge bank and mechanisms for peer to peer support using social
media to consult other plant doctors and supervisors when they cannot solve the pest/disease problem.
Tablets also allow for a digitized system of collecting data that can be automatically sent to a central
database for validation in real time. A proposal has already been submitted to IFAD for funding to support
research to introduce ICT to explore more efficient ways of collecting, validating, sharing and using data.
Institutional barriers to data collection and cooperation between different organisations also need to be
addressed. Sensitive data needs to be protected – but sufficient incentives are needed to encourage data
collection by plant doctors that are normally field extension staff who don’t report to DCP. This may require
timely access to data by the organisations of individuals collecting data.
Crowd sourcing: Crowd sourcing information and data is a tool that is also gaining popularity and
UNICEF has been working with a number of tools using RapidPro, their common platform for developing
and sharing mobile services that can be adapted for different contexts and sectors and that is open
source. Three tools that could have relevance for pest and disease monitoring (see
http://causetech.net/innovation-zone/unicef-innovation) include:
mTrac: Launched by the Uganda Ministry of Health - uses mobile phones and SMS to speed up
weekly reports on disease outbreaks and medicines; provide a mechanism for community members to
report on service delivery challenges, and provide timely information for action by district health teams.
U-Report: A mobile phone, text based service where young people can voice their opinions. The
system is used to poll U-reporters and to share information and although not an agriculture based tool
was used to gather information on Banana Xanthomonas wilt and share advice. (see
http://www.unicefstories.org/2014/02/13/its-bananas-ugandas-youth-and-u-report-save-banana-crops/)
EduTrac: used in Uganda by District Education Officers’ to support schools. Teachers, head teachers,
school committee members report periodically on indicators, such as absenteeism, cases of violence
against children, and curriculum progress. Data is used to drive supervision efforts at the local level,
and to inform planning nationally.
Event Mobile Application (EMA), a partnership project for FAO and MAAIf for livestock disease
surveillance in Karamoja Region. EMA is a web based real-time technology that uses smartphone for
making instant reporting on livestock disease. It’s anticipated that the technology will support the
strengthening of early warning and disease surveillance capabilities and improve reporting and
response to disease outbreaks in the Karamoja Region. (see http://www.fao.org/in-action/new-mobile-
application-proves-essential-to-uganda-veterinarians/en/)
Uliza: Used in Uganda by Farm Radio International to gather feedback and response to key questions
from farmers / listeners. Uliza (meaning ‘ask’) platform allows farmers to call in and log their questions,
or respond to poll questions so as to gauge level of farmer learning from radio programming.
Tracfm (http://tracfm.org) used by some radio stations provides a call-in facility to radio stations to
gather feedback from listeners.
5.4.3 Integration of pest monitoring with new online statistics system
It was noted that there are plans to develop an online agricultural statistics and information system (ASIS)
to collate and manage data collected at district level through local government. Feasibility of integrating
data on pest and disease monitoring was not clear. One interviewee commented that this integration may
not be easy given the different interests of each with the ASIS database focusing on details about farmers
and on-farm production rather the pest situation.

Platform for Agricultural Risk Management | Crop pests and disease management in Uganda: status and investment needs
84
Full Report | October 2016
5.5 Summary and recommendations for ICT Potential opportunities include the following:
There is potential to build on the ICT based initiatives – for example – a major cost of setting up
sustainable systems – centralized collection of farmer profiles that can be protected – but used to
support businesses that rely on them.
Potential for linking ASIS with pest monitoring was not clear – and there may be sensitivities – it does
seem an opportunity if good working arrangements could be established. At this stage it would be
important to avoid establishing parallel systems as occurs in some countries (see box 5.1)
Box 5.1: Parallel data management systems based on farmer profiles
In Costa Rica both the extension and crop protection departments have databases and collect information
at farm level. Each data base manages a set of farmer profiles to which they add information on that
farmer. However, the two databases were developed independently and have separate, incompatible
farmer profile systems. This means there is no way of, for example, connecting a farmer’s history of pests
with the extension services she’s receiving etc. as they have separate incompatible profile systems. A
shared profile system would make more efficient use of resoures Source: C. Finegold, pers comm.
A strategically placed network of plant clinics operated by plant doctors using tablets to collect data,
integrated into the working practice of government extension, could form the basis of a pest monitoring
system as well as extending demand led advisory services. Data collected at clinics could be
complemented by pest observation data collected by any extension officer at any place or time and sent
electronically using a common form. To be sustainable clinics would need to be institutionalized with a
customized data collection and management approach developed that is streamlined and tailored to
national system. A key challenge would be to identify win-win situations where those collecting data
benefited or had some incentives to ensure sustainable systems
Crowd sourcing approaches – to verify occurrences and extent of spread could be used. An existing
system such as U-report could be used such as in the example with BXW, or a tailor made approach
developed. An approach could be designed to feed in to ASIS. It could target extension staff only or a
broader community including farmers.
Without funds and systems to respond to monitoring data on outbreaks or new pests from Plant
clinics, crowd sourcing or elsewhere – monitoring will not serve much purpose – low investment
compared to other sectors could be an issue. Otherwise investment in building capacity to collect and
analyse data and establish frameworks for response would be logical
It would be important to audit available information and determine how accessible it is. For example,
the phytosanitary section has developed a harmonised seed trade regulation for COMESA. Pest lists
were developed and support provided to develop national pest lists for plant protection and health
regulations. However it is not clear how easily can these be accessed? Access to this and other
information – including recommendations for pest control approaches should be developed.
Different organisations maintain different databases of information on pest and disease management
– the Plantwise Knowledge bank appears to be most organized –but there are other data sources
being used in different ways. If there is appetite it would make sense to establish a network of
partners with databases of information and work towards establishment of a central search page that
allows users to search available national and international databases through a set of APIs – to
effectively create a set of open and linked databases. APIs represent a piece of software that allows
an individual not familiar with a database structure to nevertheless source content easily. In a recent
workshop of organisations involved in ICT4AG there was enthusiasm for such an activity.
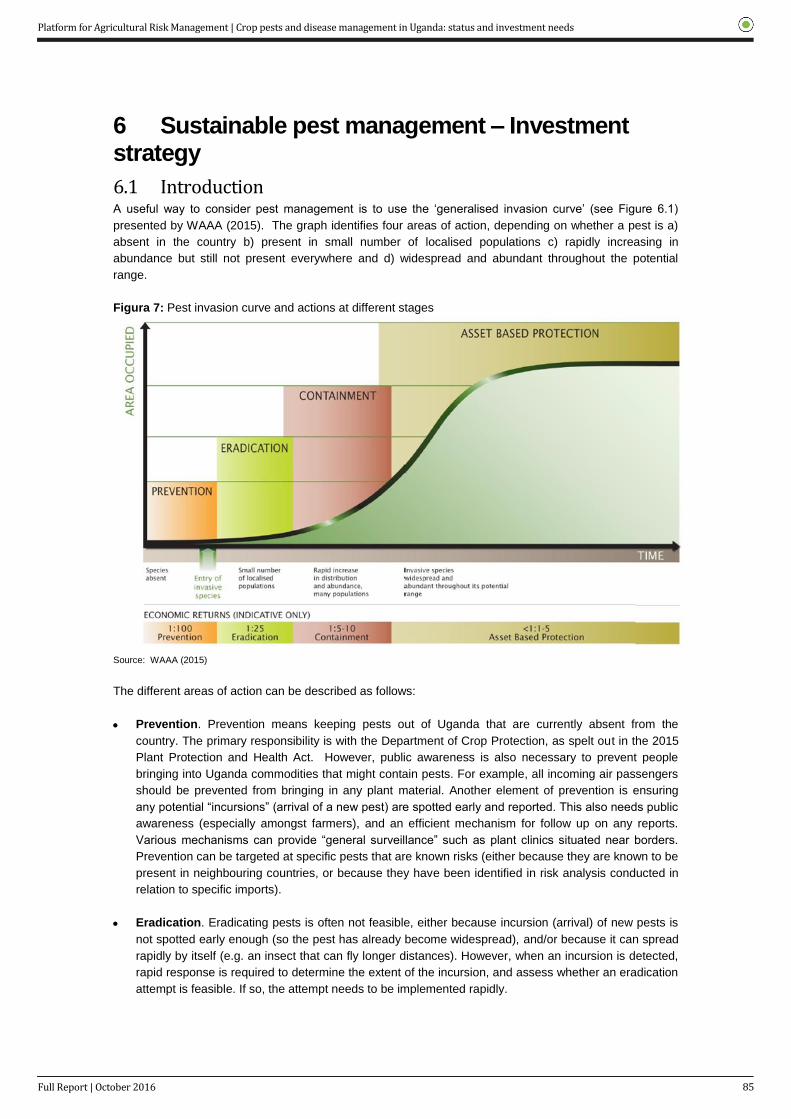
Platform for Agricultural Risk Management | Crop pests and disease management in Uganda: status and investment needs
85
Full Report | October 2016
6 Sustainable pest management – Investment strategy
6.1 Introduction A useful way to consider pest management is to use the ‘generalised invasion curve’ (see Figure 6.1)
presented by WAAA (2015). The graph identifies four areas of action, depending on whether a pest is a)
absent in the country b) present in small number of localised populations c) rapidly increasing in
abundance but still not present everywhere and d) widespread and abundant throughout the potential
range.
Figura 7: Pest invasion curve and actions at different stages
Source: WAAA (2015)
The different areas of action can be described as follows:
Prevention. Prevention means keeping pests out of Uganda that are currently absent from the
country. The primary responsibility is with the Department of Crop Protection, as spelt out in the 2015
Plant Protection and Health Act. However, public awareness is also necessary to prevent people
bringing into Uganda commodities that might contain pests. For example, all incoming air passengers
should be prevented from bringing in any plant material. Another element of prevention is ensuring
any potential “incursions” (arrival of a new pest) are spotted early and reported. This also needs public
awareness (especially amongst farmers), and an efficient mechanism for follow up on any reports.
Various mechanisms can provide “general surveillance” such as plant clinics situated near borders.
Prevention can be targeted at specific pests that are known risks (either because they are known to be
present in neighbouring countries, or because they have been identified in risk analysis conducted in
relation to specific imports).
Eradication. Eradicating pests is often not feasible, either because incursion (arrival) of new pests is
not spotted early enough (so the pest has already become widespread), and/or because it can spread
rapidly by itself (e.g. an insect that can fly longer distances). However, when an incursion is detected,
rapid response is required to determine the extent of the incursion, and assess whether an eradication
attempt is feasible. If so, the attempt needs to be implemented rapidly.

Platform for Agricultural Risk Management | Crop pests and disease management in Uganda: status and investment needs
86
Full Report | October 2016
Containment. Once a new pest has become established, and eradication is deemed not feasible,
some containment might be possible, in which the distribution of the pest is limited to part of the area
in which it could. Containment is thus concerned with preventing the spread of a pest that has
established. Containment might involve regulatory activities, such as preventing movement of planting
materials and/or produce (that could spread the pest) from one area to another. Containment might
also involve sustained pest control activities, for example to maintain pest free areas or areas of low
pest prevalence (as specified by international standards). Containment can require actions by many
stakeholders, depending on the details of the situation. For many pests containment may not be
feasible or cost effective.
Asset based protection (farm level management including prevention and control). Many pests
will be present in a country in all the areas that are suitable for them. In most cases there will be little
or no practical prospect or economic justification for attempting to create pest free areas, so the main
strategy is to control them and prevent crop losses (asset based protection). The responsibility for this
generally falls with the owner of the crop (or natural resource), but often they will need advice on how
to do this. Agricultural extension is the role of local government, though advice may be received from
and through many other sources including NGOs and mass media. As shown in the problem tree,
there are multiple problems that mean farmers are unable to effectively manage the pests on their
farms
Of the priority pests listed in table 2.1 most are at the control stage, except for BXW, Tuta Absoluta, certain
species of fruit fly and of ralstonia that merit containment action.
Conceptualising the issues in this way is useful and aligns with the problem trees presented in section 2
that identifies two principal causes that contribute to the main problem of pests not being effectively
controlled. The first is that new pests spread (from one country to another and within the country). This is
the stage where DCP intervention is critical and action is needed to prevent, eradicate and contain pests.
Recommendations to develop a strategy are presented in section 6.2. The second is that there is poor
management at farm, or household level attributed to inadequate farmer knowledge on management
practices, lack of practical solutions or lack of access to quality inputs (seed and pesticides). Once pests
are widespread and abundant throughout their potential range – then the main responsibility for pest
management lies at farmer level and the main responsibility of DCP shifts from direct action to detect and
prevent spread, to supporting service provision – particularly regulation of pesticides and seed certification.
DCP also has a role in taking responsibility for solutions as well as diagnosis – working together with
NARO and the extension personnel. Recommendations will be presented in section 6.3. Table 6.1
illustrates the shifting responsibility of stakeholders as action shifts from prevention to control.
Tabella 15: Roles of key stakeholder groups in implementing actions from prevention to control and costs
incurred by the different groups
Action or Strategy
Key stakeholders Occurrence Costs
DCP Local Gov’t Farmers, Traders,
Transporters
Prevention Lead role as per 2015 Act. Border controls, inspections, specific surveillance.
General surveillance; reporting of possible incursions
General surveillance; reporting of possible incursions; compliance with biosecurity regulations
Continuous Mainly government Farmers
Eradication Lead role as per Act. Border controls,
Participate in eradication.
Possible compulsory
Rare, but high
Mainly government.

Platform for Agricultural Risk Management | Crop pests and disease management in Uganda: status and investment needs
87
Full Report | October 2016
inspections. Might share costs.
actions intensity when attempted
Maybe some local government or private sector contribution – ideally as per a pre-agreed plan
Containment Lead coordination role; sometimes implementation
Major role in local implementation, depending on specific details; enforcing (making) regulations
Major role in complying with containment procedures
Uncommon, but might require sustained and moderately intense activity
Central or local government; farmers cost of compliance with any regulations
Control Regulation of inputs; monitoring overall plant health situation; plant health strategy; coordination of stakeholders; occasionally major role if area-wide control method used (eg Sterile insect technique for fruit flies), or major outbreak such as armyworm.
Major provider of advice to farmers. Monitoring local situation. Enforcement of regulations on inputs.
On-farm decision making and implementation. Compliance with regulations and standards for inputs and material movement.
Continuous Mainly farmers, unless area-wide approach.
Source: Adapted from ASDP 2015/16 to 2019/20
6.2 Intervention areas The GoU, under the ASSP took the commodity-based approach as a cost-effective way to spur and realise
agricultural production and productivity in the medium term. Among the selected priority commodities, nine
are crops - bananas, beans, cassava, coffee, cotton, fruits & vegetables, Irish potatoes, maize, rice and
tea. These commodities are also designated to each production zone. Agricultural planning and
investment is therefore based on the priority commodity crops. Based on this, it’s logical to tailor pest
management investment to the priority crops, but keeping in mind the need to monitor and respond to any
pest outbreaks affecting other crops, including potential migratory pests such as quelea birds. Participation
of other stakeholders in pest management will also vary depending on the value chain, economic
importance of the value chain, trade value, geographical location, and pest risk. Table 6.2 shows the
production and market arrangements of the key value chains that informs the nature of stakeholders to
engage in pest management.

Platform for Agricultural Risk Management | Crop pests and disease management in Uganda: status and investment needs
88
Tabella 16: Priority crops under the ASSP, their production and market arrangements and key stakeholders
Crop Production objective
Key production areas Production 2015 tons
Target 2019 tons
Value chain organization
2015/16 Export value million US$
Target 2019/20 million US$
Key stakeholders Pest risk
Banana Food security / cash South western farm lands 5,493,600 13,000,000 Mainly informal, internal
0.83 3.17 SH growers, local traders
High
Beans Food security North western savanna grasslands
1,011,000 10,000,000 Informal, internal 51.82 (incl. legumes)
62.98 (incl. legumes)
SH growers Medium
Cassava Food security North eastern dry lands, and savannah grasslands
2,925,208 3,579,800 Limited/none SH growers High
Coffee Cash North western, Lake Victoria crescent, mid-western, south western and highland ranges
254,246 595,890 Organized, mainly export
577.70 1,153.50 UCDA, Coffee cooperatives, SH growers, plantations, export traders
High
Cotton Cash Kyoga plains, western savannah
22,458 64,750 Organized, mainly export
84.00 355.51 CDO, export traders High
Citrus Cash Kyoga plains Mixed internal and export
32.70 (fruit and vegetables)
102.40 (fruit and vegetables)
SH farmers, export traders
High
Mango Cash Kyoga plains Mixed internal and export
SH farmers, export traders
High
Tomato Cash L. Victoria crescent, mid-western savannah
Mainly informal, internal
SH growers, local traders
High
Capsicum pepper
Cash L. Victoria crescent, mid-western savannah
Mainly export 0.80 3.07 SH farmers, export traders
High
Irish potatoes Food and cash Highland ranges, North western savanna grasslands
Mainly informal, internal
SH growers, local traders
High
Maize Food security / cash Kyoga plains, western savannah
3,513,300 10,000,000 Organized, mainly internal
55.90 105.40 SH growers, aggregators, millers, local traders, export traders
Medium

Platform for Agricultural Risk Management | Crop pests and disease management in Uganda: status and investment needs
89
Full Report | October 2016
6.3 Investment plan The proposed investment plan takes into cognizance the existing plans and efforts by MAAIF to address
pest problems in the country. As such, the plan focuses on areas deemed key for investment in the
medium term to ensure establishment of sustainable pest management systems.
6.3.1 Goal
The goal of this investment plan is: Crop losses due to pests and diseases reduced, leading to increased
production and productivity of key crops, and increased household level incomes for smallholder farmers.
This will directly contribute to ASSP priority areas 1 and 2.
6.3.2 Development Objective
In the medium term, the investment plan aims to strengthen capacity of agricultural institutions to establish
sustainable pest management systems and structures for effective pest management. This includes the
policies, frameworks and coordination mechanisms used by institutions to inform actions to reduce crop
losses.
6.3.3 Strategic Outcomes
The proposed investment plan is presented as a set of outputs and activities under three components or
strategic outcomes:
1. Cost-efficient information systems to detect and monitor plant pests and diseases established,
providing timely information to MAAIF (and other relevant stakeholders) to effectively respond to pest
situations;
2. Improved access to pest management services by smallholder farmers and other value chain actors to
effectively manage plant pests and diseases;
o) Strengthened capacity of MAAIF (and other relevant stakeholders) to monitor, analyse and combat the
threat of plant pests and diseases.
Strategic Outcome 1: Effective pest information system established
This strategic outcome covers activities that largely address root causes contributing to the introduction
and spread of new pests. For pests that are still not abundant and widespread within their potential range,
actions are needed to eradicate or contain them, where detected. This component also proposes that
contingency funds are set aside to cover costs of eradication or containment as well as to provide support
to managing outbreaks of specific pests seen as requiring collective action. Three priority interventions are
proposed under this outcome;
1. Emergency response plans operationalized,
p) Effective pest monitoring at borders points decreasing risk of new pest incursions and,
q) Pest surveillance system established providing early warning.
Strategic Outcome 2: Improved access to pest management services
This outcome covers activities that address the root causes of poor farm level management described in
section 2.3.2. Considerations are also made to ensure promotion of sustainable models to reach out to
farmers with pest management services. Two priority interventions are proposed;
1. Improved farmer awareness of pest and disease management
2. Improved access to high quality inputs (crop protection products and seed)
Strategic Outcome 3: Strengthened capacity to monitor and combat pests and diseases
The IPPC defines national phytosanitary as “The ability of individuals, organizations and systems of a
country to perform functions effectively and sustainably in order to protect plants and plant products from
pests and to facilitate trade, in accordance with the IPPC”. This is based on more general definitions of
capacity developed by UNDP and OECD, which high-light that capacity has many facets, and is much
more than the knowledge and skills of individuals (e.g. Land et al. 2009). In the proposed capacity
development activities, we therefore recommend that the above factors are taken into consideration,

Platform for Agricultural Risk Management | Crop pests and disease management in Uganda: status and investment needs
90
Full Report | October 2016
including the use of capacity diagnostics. The main focus of capacity development recommended here is
in relation to monitoring and combating pests and diseases as described in the previous two sections,
including implementation of a pest information system. As DCP is also mandated to regulate various inputs
important in pest management, we recommend capacity development in those areas too. DCP staff are
not the only ones involved in implementation of the pest information system. Training district and sub-
county extension staff to run plant clinics and collect and manage data is also required. Based on this, two
priority intervention areas are proposed;
3. Department of Crop Protection structure reviewed and staff trained
4. Improved infrastructure for pest and disease management
6.3.4 Priority interventions and cost implications
Strategic Outcome 1: Effective pest information system established
Output 1.1: Emergency response plans operationalised
Section 3.1.4 highlighted a provision in the Plant Protection and Health act for appointment of a Plant
Protection and Health Technical Committee to advise the Minister of Agriculture in a number of areas
including emergency response. It is proposed that investments build on this committee, bringing in
additional private sector and civil society participation as needed (the Act provides for the committee to co-
opt members as it sees fit). One key role for the committee would be in overseeing the development and
implementation of emergency response plans.
A1.1.1: Operationalise the plant protection and health technical committee: The Plant Protection and
Health Act 2015 establishes this committee to advise the Minister on “all technicalities arising from the
administration of the Act, and on any other related issues”. It is thus proposed that this committee
becomes the apex coordinating committee for plant protection in Uganda, and its effective
operationalization is therefore a high priority. The committee should meet regularly (e.g. quarterly) to over-
see development of plans and strategies developed by its appointed sub-committees tackling specific
tasks, including those described below. Thus a key role for the committee would be priority setting, which
needs to take place with involvement of stakeholders and needs to be an on-going process rather than a
one-off activity. Section 3.2.3 used the example of the floriculture sector to demonstrate the value of
private sector involvement in priority setting – though highlighted that the greater number of stakeholders
involved in priority value chains is likely to mean that priority setting and collaborative action is likely to be
a more complex process.
Costs required: Travel and allowances for quarterly working group meetings in year 1 &2 and biannually
in years 3-5 – 17 individuals, assumed to be based in Kampala
A1.1.2: Develop and operationalize pest emergency response plans: Under strategic action 6
(control diseases pests and vectors) of priority area 2 (Improving Access To Critical Farm Inputs) in the
ASDP, operationalization of the Emergency Preparedness Plans (EPP) is referenced. A sub-committee
would be established to review and update the overall plan for responding to pest emergencies, however
they might arise as well as a set of pest specific plans for priority pests. Pest specific plans will include pest
risk, likelihood of pest occurrence, response options, responsibilities and resources required. These plans
should consider endemic, introduced as well as migratory pests. The sub-committee would be led by DCP
with input from public and private stakeholders. Technical experts and local or international consultants
would analyse economic as well as biological data and integrate recommendations from sector specific
sub-committees (A1.1.3) that would ensure involvement of representatives of private sector industries.
District and other staff needed to implement the plan would also be represented. Response choices will
not be the same irrespective of the crop affected or the pest identified. For example, the cost of
maintaining a pest free area might be justifiable if it supports a high value export crop, but not for a lower
value staple.
The plan would describe actions to be taken in response to observations of new pests or outbreaks of

Platform for Agricultural Risk Management | Crop pests and disease management in Uganda: status and investment needs
91
Full Report | October 2016
existing ones. While not providing the level of detail to be found in the crop sector-specific plans (A1.1.3)
key elements will be roles and responsibilities of different stakeholders (including the private sector), and
financial responsibility for the actions to be taken under different circumstances. Certain pest species that
are already present but known to cause major damage during outbreaks may require collective and rapid
action to support individual actions by smallholder farmers.
Costs required: Travel and allowances for quarterly sub-committee meetings in year 1 and 2 and costs of
a lead consultant to lead plan preparation. Annual meetings in years 3-5, to review plans and reassess
key risks. Sub-committee to consist of appx 10 individuals
A1.1.3: Development of sector specific prevention strategies for high risk commodities: For the
four high risk priority crops (banana, cassava, cotton, coffee, fruits and vegetables) sector sub-committees
need to be established with a view to deliver prevention strategies by the end of year 1. In year 2, sub-
committees for other crops where risk is lower but still important would be established (e.g. maize and
beans) Stakeholder involvement would vary depending on the nature of the value-chain (see table 6.1).
The plans would be based on the generic plan, but provide as much detail as possible for the particular
sector, highlighting specific risks where known (see activity 1.2.1), and how they will be addressed
(including pests already present, as well as those known from elsewhere that could be introduced). The
plans would specify investments in actions to eradicate, contain and control, including expected private
sector contributions where organised private sector involvement is high. Where there is a high level of
public good, such as where the main production base consists of smallholder farmers and where private
sector involvement is less organized (e.g. banana or cassava), investments in responses are likely to be
primarily by the government, whereas actions for crops such as coffee, cotton and maize would be
expected to involve greater private-public sector partnership.
Costs required: Travel and allowances for quarterly sub-committee meetings for 5 sectors in year 1 to
lead preparation of sector-specific strategies aligned with the emergency response plan. Another 3 sector
sub-committees meet quarterly in year 2. Annual meetings for each sector once sector strategies
developed to review plans and reassess key risks. Sub-committees to consist of appx 20 individuals.
Sector expert to provide technical assistance to each sub-committee for 20 days in first year of sub-
committee and 5 days a year thereafter.
Output 1.2: Effective pest monitoring at border points decreasing risk of new pest incursions
Some insect pests may gradually spread by themselves as they move across a landscape – some vector
borne diseases can spread in a similar way. Another principal cause of new introductions is through
movement of produce – including seed across borders (see section 2.3.1). Strengthening monitoring at
border points is a first line of defense in prevention of new pests. Border points include both the land
borders with neighbouring countries, and international ports such as Entebbe Airport.
A1.2.1: Risk analysis: Pest risk analysis assesses the likelihood of a pest entering a country, and the
consequences if it did. It thus provides the basis for identifying and prioritizing risk management activities,
including import controls and border inspections. Often pest risk analysis is conducted when a new request
is made to import a commodity (representing a new potential pathway of introduction), or when a new pest
has been reported in a neighbouring country or trading partner, so is a new risk. This is the function of the
NPPO (DCP). Risk analyses will be conducted for the high priority value chains where the consequence of
a new pest introduction would be most serious.
However, risk-based approaches can also be adopted more generally to allocate risk management
resources, such as allocating staff and effort between different border posts. Currently there are 30
gazetted border points and around 15 ungazetted border points where produce is moved. With a limited
number of staff, it is appropriate to deploy staff where the risks are greatest. And at particular border
posts, risk-based approaches should be used in guiding which consignments to inspect, and what types of
pest to check for. Under the auspices of the plant protection and health committee, these various risk
analyses will be conducted. The information gathered and analyses underkaken will inform subsequent
investments in establishing DCP presence to monitor movements and check for quarantine pests. The
study would identify which are the key posts to be staffed, likely to be influenced by assessing the principal
Platform for Agricultural Risk Management | Crop pests and disease management in Uganda: status and investment needs
92
Full Report | October 2016
trade routes for priority value chains, volume of produce movement and highest risk crops/pests. For
example, it might be that the main border to manage effectively is the international airport, where people
bring commodities from distant countries, while at land borders, with large amounts of informal trade and
the possibility of natural pest spread, risk management might give less return on investment. There is
certainly scope for increasing controls at Entebbe, though the benefit of this needs to be demonstrated by
analysis. Complementary studies providing a greater level of detail for each value chain where a detailed
response plan is to be developed will also be carried out.
Costs required: Costs of an initial study to be implemented by a consultant and DCP, to deliver a report
to inform subsequent border risk management activities. Costs of follow up studies and analyses for the
priority value chains – a total of 8 sectoral studies will take place in years 1-3, starting with banana,
coffees, cassava and cotton.
A1.2.2: Re-establish DCP presence at gazetted border posts: Currently only 5 of the gazetted border
posts are manned with DCP staff. Investments should be made to recruit, train and deploy new
inspectors. A phased roll-out would initiate staff deployment at posts prioritized based on analysis of data
collected in activity 1.2.1.
Costs required: The budget assumes that an inspector would be recruited for at least 25 border posts by
year 4. Training costs are provided for under Outcome 3.
A1.2.3: Development of guidelines and materials to raise awareness of both public and border staff
on pest risks. As the general public probably represent a high risk pathway for pest introduction,
investment in development of public awareness materials is required. While DCP staff will receive
technical training other border agency staff (especially Uganda Revenue Authority) also need to be aware
so that where there are few or no DCP staff, some risk management can still be undertaken. Materials and
guidelines for other border agencies are therefore required, to ensure they are aware of the risks,
understand the role of DCP, and know what role they can play in monitoring and/or inspecting people and
consignments crossing borders.
Costs required: a) Costs of 6 workshops to be held with sub-groups of border post in years 2 and 3 (three
per year) to discuss and agree appropriate working practices and then review and amend approaches; b)
Costs of a local expert / consultant to facilitate the workshop and process, visiting border posts over the
course of a year to identify challenges etc. c) Costs of two communications write-shops (to both train staff
and draft materials) d) plus design and development of materials e) printing and distribution of information
materials.
Output 1.3: Pest surveillance systems established providing early warning
The Framework implementation plan (FIP) for statistics and risk management (MAAIF, 2015b)
recommends a national steering committee on agricultural risk management (ARM-NSC) involving
stakeholders and the ARM unit to coordinate tasks designed to streamline collection and use of
agricultural data. The FIP also mentions that the agricultural reporting service (where District staff take
responsibility for collecting statistics) is to be reinstated. Data to spot pest outbreaks or emerging pests
and estimate spread can potentially be collected by many different individuals engaged at ground level –
from field extension officers, other private and public agricultural service providers to individual farmers or
the general public. The system to be developed will need to be able to integrate data from different
stakeholder groups collected and shared in different formats. It is proposed that a working group is
established that reports to both the ARM-NSC and the plant protection and health committee (A1.1.1).
Both committees will have over-sight and inputs into designing a system to collect, manage and use data.
A system will be needed that can integrate data from different sources. As well as this “general
surveillance”, specific surveys are also needed to collect data in a more structured manner.
As explained in section 4.2.2, plant clinics represent an approach that – in terms of delivering advisory
services are expected to perform well alongside other approaches and have the added advantage of
collecting data that can be used for different purposes including contributing to early warning if they are
well placed. We propose a scale-up of clinics that aligns well with MAAIF plans for district staff to take
greater responsibility for agricultural data collection. It is also proposed that other ICT based data

Platform for Agricultural Risk Management | Crop pests and disease management in Uganda: status and investment needs
93
Full Report | October 2016
collection tools mentioned in section 5 are leveraged such as; an electronic system used by veterinary
authorities to report livestock disease outbreaks and; a youth chat-group U-report used to track cases of
BXW and share information on management. However it is also important that actions are taken to
develop a system that can integrate data from different sources that are delivered in different formats.
A1.3.1: Establish a working group to develop a pest information management system for early
warning and household level data: A sub-committee or working group would be established reporting to
both the Plant protection and health committee (A1.1.1) and the ARM-NSC and ARM unit. The group
would include representatives of the Department of Planning and Statistics, DCP and ARM as well as
invited participants from: national and international groups using ICT; representatives of district and
national staff likely to play an important role in data collection and with interest in data to inform their work
e.g. directorate of extension, district and zonal staff and; private sector representatives to ensure that the
system facilitates their contribution to monitoring and reporting.
Costs required: Quarterly meetings in years 1 and 2; biannual in year 3 and annual meetings
subsequently.
A1.3.2: Establish a network of plant health clinics: The ASDP (MAAIF, 2015b) refers to use of plant
clinics to contribute to advisory services (priority area 1, strategic action 2 - see A2.1.1) and “to provide
timely feedback.. on emerging pests and diseases” under strategic action 6 (control diseases, pests and
vectors) of priority 2 (improving access to critical farm inputs). A staged scaling up of clinics is proposed,
following a set of priorities identified by the working group in (A1.3.1). It is proposed that a clinic be sited in
areas of intensive crop production in each sub-county in all districts where crop production is important –
estimated as around 100 of the 116 districts. This would exclude Northern drier regions where crop
production is limited – as clinics in areas where cassava is grown would also be relevant. This would mean
establishment of around 1203 clinics in a phased manner over 4 years. Each clinic would be run twice a
month by extension officers trained as plant doctors rotating around a number of locations within their
mandate area. All sub-county extension officers would undergo two short training modules teaching field
diagnosis, how to give actionable recommendations and how to run plant clinics. A separate course in
monitoring plant clinic performance would also be taught. District staff would also be trained to supervise
establishment and running of clinics. Key partners include higher agricultural trainings institutions (e.g.
Makerere University, Uganda Christian University, Uganda Martyrs University and National Agricultural
Colleges). Backstopping by international consultants from CABI would also support roll-out in early years.
Plant clinics would be included in job descriptions as part of the duties of field extension officers, but once
trained would represent 2 days of their time per month.
Costs required: a) Training extension officers in all sub-counties in plant clinic modules to diagnose pests,
make recommendations, use data management system and monitor plant clinic performance b) Providing
basic set-up materials for clinics (table, chairs, umbrella, knife, information materials, magnifying glass
etc.). c) Providing allowances for staff to travel to clinics (with their clinic materials) Appx once a fortnight –
allow for 20 days/year. d) Technical support to plan rollout and backstop training
A1.3.3: Design and build a pest information system a) to collect and manage pest monitoring data:
To be able to collect and manage pest data effectively an organized system is needed. It is assumed that
the ARM-NSC will be developing an information system to serve multiple needs of the agricultural sector.
It is recommended that the sub-committee or working group established in A1.3.1 oversees the design,
building and piloting of data collection tools and a data management system serving as a pest early
warning system.
The pest early warning system would be complementary to other databases and tools being developed.
The system should allow data to be collected from different sources (extension staff, village-based
intermediaries, public etc.) both in an ad-hoc manner and through regular sessions of plant clinics (see
A1.3.2) and entered into a common database. The Plantwise data collection system could serve as a
starting point to customize a system for Uganda, integrated into government systems. Issues to consider
in designing the system would include:
identify a minimum data set that can easily be collected both during clinics and in day to day work of
Platform for Agricultural Risk Management | Crop pests and disease management in Uganda: status and investment needs
94
Full Report | October 2016
extension staff
incorporate capacity to manage additional data that may be relevant to delivery of advisory services
but not to a pest warning
start with consideration of standards and interoperability –with consistent fields used in data base
structures and controlled vocabularies.
penetration of smart phones remains low therefore, although tablets can be provided to extension
staff; crowd-sourced data from other actors e.g. farmers is most likely to come from SMS and IVR
channels and therefore not georeferenced. The value of crowd-sourced data is in its spatial data but
high levels of effort are needed if location is not automated and relies on place names
pre-existing systems where they exist – depending on what is popular in the country. An observation
in Uganda is that plant doctors already use Whatsapp networks to share information and photos to
seek assistance in diagnosis. If this is a common service used by agricultural staff across Uganda this
may be a good option.
quality assurance processes would be integrated into the system and automated data cleaning and
processing steps included
Systems should be integrated – therefore system requirements to capture and manage household
level data from farmers to be incorporated (see A1.3.4)
A data collection and management system requires both human and ICT actions. Data collection
processes should follow the decentralized system with district staff supervising sub-county extension
officers and MAAIF supervising DAOs. Systems would allow querying of data at district/zonal and national
level, with agreements being made around access to potentially sensitive data. It would need to be
recognised that different stakeholders would have interests in different parts of the database, so effective
processes to allow different individuals to query data in different ways would be needed. A staged process
would be needed to pilot, evaluate and review systems.
An important consideration in designing the system is to ensure appropriate incentives are in place for
different stakeholders to play their part. This may mean ensuring data collection is not time consuming or
cumbersome for those that have to collect it, and organisations responsible for data collection have access
and can easily use data for their own purposes. That data collection is included in performance contracts /
job descriptions.
Costs required: It is assumed that the basic IT infrastructure exists or is being acquired as part of the
strategy in the Department of Planning and statistics to increasingly use ICT tools to support data
collection. Costs proposed are focused on the pest information system that will include capacity to:
manage data on symptoms, diagnosis and recommendations collected at clinics and through other
interactions; to manage household level data (see A1.3.4) .
Consultants to design the system and manage stakeholder consultations during build and piloting
IT developers to build the software – costs can be high – an estimated cost of 5 million is used in the
budget
Training district and ZARDI staff to manage the system
Training MAAIF users of the pest information system
System maintenance, data analysis and reporting
Validation workshops to validate sub-sample of data collected (for M&E)
Travel and allowances for meetings with stakeholders
A1.3.4: Design and build a pest information system b) to collect and manage household level data:
The FIP (MAAIF, 2015b) on statistics and risk management notes that risks and shocks are first felt at
individual farm level and therefore the agricultural statistics system should be able to capture data at farm
level. In section 5 it was also noted that for effective ICT based services – farmer profiles are required to
allow information and content to be tailored to their geographic location and individual farm resources.
Therefore, a first step in both a) developing ICT based services and b) establishing a farm level data
capture system is to build a database of farmer household profiles. It is therefore recommended that
investment is made to design a database and collect a representative set of farmer profiles across the
country.

Platform for Agricultural Risk Management | Crop pests and disease management in Uganda: status and investment needs
95
Full Report | October 2016
The Directorate of extension is already planning a census of farmers to quantify numbers of farmers in
different categories – though it is not clear if a database of farmer profiles that can be built on and
expanded is also planned. Development of duplicate databases should be avoided – any database at
household level should be used across departments where there is a need for household level data. The
sub-committee or working group established in A1.3.1 will oversee the design, build and piloting of data
collection tools and a data management system for household level data capture as well as the monitoring
system described in A1.3.3.
Costs: As for A1.3.4, it is assumed that the basic IT infrastructure will be established. Final costs will need
to be aligned with investments already planned by the department of extension. Costs proposed are to
create a database for household level data and collect a set of farmer profiles distributed across the main
crop production areas and for regular data collection annually.
Consultants to design the system and manage stakeholder consultations during build and piloting –
covered in A1.3.3
IT consultants to build the software – covered in A1.3.3
Travel and allowances for meetings with stakeholders – covered in A1.3.3
Costs of collecting 5,000,000 farmer profiles – spread over a period of 4 years.
Annual data collection
Training of district staff as trainers to train sub-county staff – with training rolled out over years 1-3
A1.3.5: Equip all district agricultural officers and sub-county extension staff with tablets and tools:
All crop extension officers operating at sub-county level and DAOs involved in supervision should be
allocated a tablet to facilitate their participation in data collection - loaded with a set of data collection and
communication tools. Use of tablets would allow ease of communication within and between
administrative levels (national, zonal, district, sub-county). Other available tools such as access to pest
information including diagnostic support and recommendations for management could be loaded on to
tablets as well as content related to other responsibilities of extension officers.
Costs required: Purchase of tablets for 3,000 sub-county extension staff and 2 district staff from each
district – rolled out over 3 years. Cost of basic airtime annually
A1.3.6: Respond to early warning of pest outbreaks - Implement specific surveys and pest
surveillance: Where a new pest or pest outbreak is detected, specific surveys are needed to confirm the
occurrence and ascertain actual distribution. Funds should be set aside to fund such surveys – according
to priority setting and pest specific action plans. Such surveys need to be led/coordinated by DCP,
although other stakeholders such as universities, research organisations may contribute. New crowd-
sourcing approaches that capitalize on the increasing use of smart phones and ICT infrastructure could be
considered, for example U-report. A bespoke system would also be established that requests feedback
from sub-county extension staff. It is assumed that on average 6 specific surveys would be required each
year – for example to evaluate the extent of a new outbreak, to implement a de-limiting survey to assess
the extent of new pest distributions etc. Information from the early warning and specific surveys will be
used to inform responses.
Costs required: It is recommended that 60,000 USD is set aside each year to cover the costs of specific
surveys to establish extent and distribution of outbreaks
A1.3.7: Respond to early warning of pest outbreaks – contingency to eradicate, or contain: Although
rare, in some cases there may be a good case for eradication or containment of high risk pests. The Plant
Protection and Health Technical Committee (or its nominated sub-committee) would collect and review
evidence, and make a decision on whether to attempt eradication or not, according to the emergency plan.
An estimated contingency of 100,000 USD is proposed to be set aside that can be rolled over from year to
year if not used.
Costs required: 100K to be allocated as a contingency fund in years 1 and 3 assuming that it is unlikely
to be used every year.
A1.3.8: Respond to early warning of pest outbreaks – management in selected cases: Although new

Platform for Agricultural Risk Management | Crop pests and disease management in Uganda: status and investment needs
96
Full Report | October 2016
pest incursions and spread of pests within a country poses a high risk requiring prevention, eradication or
containment responses– the majority of key pests identified are already abundant and widespread
throughout their potential range. In this case, farmers must take the main responsibility for actions to
control pests, although in a few specific cases there may be a role for local or national government in
control. For example, for economically important value chains, particularly where pest management
methods require collective action over a wide area, government intervention is justified. An example is
BXW, where it is important that all farmers in an area employ a range of recommended cultural control
methods to avoid spread and rapid reinfection from farmers where control does not take place. Another
example of an outbreak in citrus plantations in Eastern Uganda is given in box 6.1.
Costs required: In the ASSP budget there is already provision for investments in management of banana
bacterial wilt and coffee pests (coffee export has the highest value of all export crops in Uganda) additional
contingency of $100K is proposed for other crops
Box 6.1: DCP involvement in management of a pest affecting a gazetted value chain:
Citrus leaf and fruit spot (CLFS) is an endemic fungal disease in the Teso region of Uganda. Farmers were
not too concerned about the disease during times when orange production was not a major enterprise.
Following gazetting of citrus as a key value chain for the region, large numbers of farmers invested in
citrus production and the disease started to become a problem. In 2011, local government extension staff
running plant clinics in Eastern Uganda observed large numbers of farmers bringing the problem to the
clinics. DCP staff sent samples to the CABI laboratory in UK where the fungi was confirmed and DCP
responded rapidly, procuring chemicals distributed to farmers for spraying through local government
extension staff. Raising awareness of CLFS continues to be a part of plant health rallies and community
awareness campaigns in the TESO region. Source: J Mulema, Personal Communication
A1.3.9: Develop systems for regional co-operation: Improved cooperation and coordination with other
countries is also key for managing pests across borders. This cooperation is already spelled under the
new EAC SPS protocol (which Uganda has already ratified). Uganda is also a member of the Desert
Locust Control Organisation for Eastern and Southern Africa (DLCO-EA), which addresses several
migratory pests, including desert locusts, armyworm and quelea bird. The role of DCP is to ensure that
timely surveillance is done to inform actions by these bodies. There is also need to designate staff
responsible for managing these regional links.
Costs required: Routine surveillance costs assumed to be already covered
A1.3.10: Build capacity of research It was noted that improved research capacity was needed and
creation of linkages to international organisations. However, this is already proposed and costed under
the ASSP
Costs required: Under ASSP
Strategic Outcome 2: Improved access to pest management services
Output 2.1: Improved farmer awareness of pest and disease management
The ASDP refers to strengthening the use of current dissemination pathways including “mass [media],
print and online media; joint ICT applications; scientific publications and conferences, plant clinics,
demonstration sites, trade shows and exhibitions; and the farmer field school approach (FFS)” (MAAIF,
2015b). As described in section 4, there is no “one-size fits all” approach to raising awareness.
Combinations of approaches are needed depending on various factors as explained in section 4.5 and a
mix of stakeholders need to be involved. Currently MAAIF is investing in increasing numbers of extension
staff across the country in a single spine extension system with a total of 3000 by the end of 2016 (also
see section 3.2.8. With an estimated number of farming households of 5.86 million1, this means each
extension officer will have responsibility for approx. 2,000 families. This means that while field extension
1 Figure estimated in January-2015 by CABI staff based on the following figures: a) total population in 2014 of 35.0 million (CIA, 2015);
83.2% of total population living in rural areas (FAO 2014) and average family size in 2011 of 5.1 (ICF International, 2015)

Platform for Agricultural Risk Management | Crop pests and disease management in Uganda: status and investment needs
97
Full Report | October 2016
officers will be key in providing services, they will still have a limited capacity to reach all farmers. In
discussions with stakeholders we estimate that around 50% of extension time is spent on organized
extension activities – 110 days if it is assumed that the working year involved 220 working days. If they
spent all 110 days using a single approach – by using extension agent visits, FFS, plant clinics, farmer
field days or plant health rallies, they would reach approx. 1500, 162, 1430, 1870 or 8250 farmers2 - with
greater depth and breadth of knowledge being shared where fewer farmers are reached. We would
recommend that extension implement a range of new and existing approaches into their working practices
according to table 6.3 below.
Tabella 17: Recommended time allocation to different interpersonal extension methods
Activity # of days # farmers reached
Rationale
Group training 44 600 Already an integrated part of practice. Usually 20-30 farmer groups in a sub-county
Plant clinics 24 312 Numbers reached are not very high and interaction is short. However – respond to farmer demand and have valuable role in contributing to early warning system. Can be planned to specifically target women
Field days 10 170 Field days require organization but are popular to facilitate interactions between farmers and other service providers including input suppliers
Plant health rallies 16 1200 Rallies are a useful way of reaching large numbers rapidly while allowing face-to-face interaction with members of farming families
Backstop other approaches
17 Variable Extension staff can be more effective through backstopping approaches implemented by other service providers e.g. village based intermediaries, providing input to radio,
Other ad hoc activities Response to requests, activities with NGOs, planning meetings, trainings, vaccinations etc.
Total 111 2342
Farmer field schools represent an educational approach - building skills of farmers and capacity to solve
problems. In a current proposal before the government of Uganda (MAAIF, 2014), $800,000 is included to
train farmers’ groups and extension staff in IPM using farmer field schools – with implementation to be
contracted out. Therefore, additional FFS are not recommended for this particular investment, although,
the interventions proposed are highly complementary to the FFS.
For organized value chains such as coffee, tea, cotton - and to some extent maize - value chain
approaches that are coordinated by aggregators, cooperatives etc. often incorporate some element of
extension delivery, often through village based intermediaries. Extension should work together with such
initiatives. Less formal value chains for crops where much of the production is as staples (such as cassava
and banana) rely more heavily on government extension and ICT approaches for these crops may be less
sustainable.
As well as investing in mainstreaming some new approaches into working practices of sub-county
extension officers, it is recommended that investments are made in additional approaches that capitalize
on mass media, initiatives using village based intermediaries (particularly those linked to value chains
where intermediaries provide advice and also can deliver other services). Some investment in ICT based
services is also recommended. As explained in section 5 currently there are few, if any examples of
services that do not still rely on donor investment. However, innovation in this area is rapid and there is
potential to link information provision with other services including financial services, input/output
brokerage, marketing and weather information, insurance etc.
Information on pests, including diagnostic support and control options is currently held in a number of
national and international databases (e.g. databases managed by the CABI Plantwise program, Gutsinda,
2 Numbers of farmers reached was estimated using the figures in table 4.3 of days of extension staff time invested (under variable costs)
and numbers of farmers reached. This gives an approximate estimate as some methods require more than one extension staff to be
involved. It also does not allow for spillover effects

Platform for Agricultural Risk Management | Crop pests and disease management in Uganda: status and investment needs
98
Full Report | October 2016
AGINSBA and Grameen mentioned in section 5. It is also important to consider: methods they use to be
most cost effective in reaching farmers; mechanisms to facilitate streamlined interactions with departments
such as DCP who do not have extensive presence at the field level and; complementarity of ICT methods
that can reach large numbers of farmers and service delivery (including advice) through market driven
closed value chains. Activities would include:
A2.1.1: Establish plant clinics: Clinics established that provide services on demand to communities
where the clinics are held. See A1.3.2.
Costs required: Costs are covered under A1.3.2 above
A2.1.2: Implement mixed media campaigns: A number of mass media campaigns should be anticipated
each year to support information sharing in cases of a new pest or pest outbreak and inform farmers of
actions that can be taken to protect their crop – 4 a year is proposed. A mix of methods would be
appropriate including radio/TV and mobile or rapid actions at community level such as plant health rallies
etc.
Costs required: The following costs should be anticipated for 4 different problems:
Campaign planning and design workshop – bringing together technical and communication experts to
develop key messages and develop content relevant for different media
Radio shows – e.g. three 30-minute talks shows, each repeated 3 times with associated jingles
sending key messages. Air same program on 4 stations to account for different languages
TV show - prepare a short 7-15 minute video about the problem, how to recognize it, treat it and
prevent it.
Costs of 20 plant health rallies to be carried out in key areas affected. Includes travel and allowances
– and workshop to plan and implement
Technical assistance to support development and design of content and contract out SMS delivery to
appropriate national organisations
A2.1.3: Improve access to information on effect of pests and how to manage them. Section 5.3
highlighted a number of existing international and national sources of information. Although many sources
are in theory open access – in practice databases can be difficult to query without good knowledge of
structure. Openness of databases can be increased using Application Programme Interfaces (API) which
can improve searchability and link relevant content from different open data sources. Using APIs would
make it easy for users to access information from multiple source databases can ensure that service
providers can easily access information on behalf of farmers – or even farmers themselves.
Costs required: Consultancy to review existing sources of national and international information and plan
to establish an open and linked set of databases. Costs would cover stakeholder consultations and IT
development time to set up appropriate APIs and build a user interface that can be accessed over the web
or via a mobile device.
A2.1.4: Enhance Extension staff skills: From the analysis, it was noted that often extension personnel
lack adequate knowledge and skills to effectively advise farmers on pest and disease management
especially emerging ones. Similarly, extension personnel may lack practical skills to administer the
proposed extension approaches e.g. plant clinics, farmer field days, FFS etc. Refresher trainings for
extension personnel particularly focusing on practical extension methods and new knowledge on pests
and disease management are proposed. Extension workers should also be trained or oriented on how to
use information technology to seek information from established data sources or share information across
their networks. The Plantwise e-clinics that are currently in pilot are expected to address this by allowing
plant doctor access to a rich database on plant pests and disease to help with diagnosis and
recommendations.
Costs required: Practical extension refresher training sessions done at zonal level at least once in 2
years. ZARDIs can facilitate the training sessions, including demonstrations on new pest management
approaches, new varieties and agronomic practices. Assume each individual receives training for 4 days
and that 2000 are trained over a period of 4 years at a cost of $150/person

Platform for Agricultural Risk Management | Crop pests and disease management in Uganda: status and investment needs
99
Full Report | October 2016
Output 2.2: Improved access to high quality inputs (crop protection products, seed)
Use of inputs in Uganda is low. Although data is not easily available, particularly for pesticides, data from
2005 reported by Roberts and Azzarri (2014) 3.4, 19.2 and 10% of agricultural households used inorganic
fertilizer, improved seed and pesticide respectively, with the proportion of households using inputs
increasing with increasing wealth categories. There are two key areas for consideration: quality of the
inputs and access to inputs by farmers at the right price at the right time. Key inputs impacting on pest
management include pesticides and seed. For seed a key issue related to quality is that seed can be a
source of transmission of pests, particularly vegetatively propagated material. NAADS is currently
responsible for distribution of seed and other inputs – because of difficulty of sourcing good quality clean
seed and high farmer demand, in some cases infected materials are used. For counterfeit pesticide and
illegal imports the issue is a criminal one with potential personal risks to regulators trying to tackle the
problem. A pest management plan developed under the auspices of the Agriculture Cluster Project is
currently before the government, with a $4.7 million investment proposed over 5 years.
A2.2.1 Improve quality of pesticides: Activities would include training regulatory officials and police
(particularly at border points), extension officers and farmers about the risk of pesticide misuse, how to
manage pesticides, the dangers of counterfeit products and how to identify them etc. Awareness
campaigns such as those implemented by CropLife would be implemented. However, detailed actions are
not considered here as a proposal is already before government (MAAIF, 2014) with a pest management
plan focused on misuse of pesticide including the use of FFS covering principles of pest management and
pesticide management and training of agrodealers in safer pesticide management. This work will be highly
complementary to the proposed investment and therefore additional investment is not part of the proposed
work presented.
Costs required: A total of $4.7 million over 5 years already proposed (MAAIF, 2014) and not included in
present proposal
A2.2.2: Improve quality of seed: A set of activities will take place to address the issue of poor quality
seed leading to infected seed being distributed to farmers and at the same time spreading pests. Actions
should be implemented together with USTA and link to the Integrated Seed Sector Development work
being carried out in Uganda linked to CDI in Netherlands. A combination of actions addressing seed
production as well as distribution would include the following:
a) Establish a working group to oversee plans to address seed quality. The working group would meet
twice a year and include representatives of the private sector, as well as of those responsible for seed
distribution and regulation. Including NAADS, District staff and representatives of DCP
b) As explained in section 2.3.4 community based seed production under a Quality Declared Seed label
can be used to support delivery of high quality seed for crops where seed supply does not offer high
returns for private sector seed companies (e.g. cassava, beans and banana). District staff will be
trained to inspect seed locally – initial operational costs of district staff visiting seed producers and of
seed testing of the final product will be covered with a view to farmers gradually taking over
responsibility for payment for services
c) An awareness raising campaign (using different media as in A2.1.2) would be carried out in year 2
and repeated in year 4 to highlight the importance of using good quality seed and clean planting
material. This should include activities with USTA to encourage self-inspection amongst members and
development of materials that can be used in seed distribution highlighting how to ensure against
counterfeit seed.
d) Develop standards for inspection of vegetatively propagated crops by District and ZARDI staff
responsible for inspections and integrate information on these crops in training of QDS inspectors
above.
e) Support strengthening of regulations and standards for material movement, and inspection of planting
materials distributed through various programmes. DAOs should be capacitated to undertake this role
and given mandate to arrest and confiscate suspected material. Piloting of new approaches proposed
by the work Actions would be undertaken as part of a
f) Monitoring of seed quality
Platform for Agricultural Risk Management | Crop pests and disease management in Uganda: status and investment needs
100
Full Report | October 2016
g)
Costs required: r) Costs of seed regulatory working group to meeting twice a year to plan and review actions. Group of
appx 30 individuals including representatives from DCP, Local Government, NAADS, private sector
seed companies, ISSD staff, farmer organisations etc. Half to come from outside Kampala
s) Training at least 2 staff from each district (appx 240 staff) together with ZARDI staff (Appx 10 staff) in a
series of 12 trainings – 4 in each of years 1, 2 and 3
t) Awareness campaign using same costs for planning and implementation of a range of methods as
described in A2.1.2
u) Consultancy to develop standards together with national partners
v) Costs of piloting, monitoring, reviewing by working group of new ways of working
w) Costs of sampling and testing seed distributed to support consultancy
x) Technical assistance to backstop and coordinate actions
Strategic Outcome 3: Strengthened capacity to monitor and combat pests and diseases
Output 3.1: Department of Crop Protection structure reviewed and staff trained
Although steps have been taken to separate The Department for Crop Protection into two departments,
the 2015 Plant Protection and Health Act, confers powers on the Commissioner for Crop Protection, as do
several of the other legal instruments described above. Making the split would therefore require a major
overhaul of the legal documents to reallocate the powers between the two new departments. In the long
term there might still be merit in such a split, but for the time being we recommend strengthening the
Department with its current mandates.
There might be some benefit in revisiting the internal structure of the Department for Crop Protection. The
current structure is reasonable, but some improvements could be most easily made through revising the
job descriptions of the principal inspectors. The principal inspector for phytosanitary and quarantine
services is currently under the assistant commissioner for certification and regulation, and certainly
phytosanitary work involves regulatory activities. However, it also has close connection to the work under
diagnostics and epidemiology. Consideration could therefore be given to moving phytosanitary and
quarantine services, and at the same time refining the roles of the principal inspectors in that half of the
Department.
However, the current structure is based entirely on technical functions, which may in part be because the
Department is part of a larger directorate, that can provide other non-technical services. Nevertheless, we
recommend that the DCP should have administrative, financial and other non-technical capacity within the
Department, dedicated to department functions.
An important part of institutional capacity is the ability to interact effectively with other organisations
through various mechanisms. These linkages are critical to the effective performance of an entire system,
and in the case of pest management, it is clearly important that DCP has the capacity to convene
stakeholders, facilitate multi-stakeholder interactions, provide leadership, and ensure crop protection
considerations are included in the work of other organisations where appropriate. For example, DCP has a
seat in the proposed ARM task force within MAAIF, allowing pest risks to be addressed in the wider
agricultural risk management context. Another key linkage or relationship is between DCP and local
government. DCP needs to be seen as legitimate and competent, so that it can effectively provide
guidance and direction to local government. Close links with the new Directorate of extension will be
essential as many of the tasks rely on effective participation of sub-county extension staff.
We therefore recommend the establishment of 2 new posts. One post would be responsible for
negotiating, maintaining partnerships and relationships with the large number of organisations that DCP
needs to work with to fulfil its mandate effectively. This would include partnerships within Uganda, but also
externally with regional and international partners. The other post (reporting to the first post) would be a
Platform for Agricultural Risk Management | Crop pests and disease management in Uganda: status and investment needs
101
Full Report | October 2016
communications officer.
As mentioned in section 2.3.1, the DCP departmental structure (presented in figure 3.1) provides for 70
staff, while currently only 39 posts are filled. Section 2.3.1 noted that of 30 gazetted border posts, only 5
are currently manned and; at a recent meeting of NPPO staff from East Africa – Tanzania was reported to
have 165 staff at 36 border posts. A detailed breakdown of current staff in post was not available, but it is
suggested that staffing is low and should be increased. A proper capacity needs assessment but should
be carried out – but we recommend that all 70 posts be filled and estimate an additional 50 posts be
created.
A3.1.1 Apply IPPC diagnostic tool to clarify training needs: IPPC’s Phytosanitary Capacity Evaluation
(PCE) tool should be used to assess existing capacity and develop a detailed training plan. IPPC is
currently training a number of facilitators who can lead application of the tool, including someone from the
Department of Crop Protection who would therefore be well placed to lead the process. Uganda previously
used the tool over 10 years ago, so a repeat diagnostic would provide more detail to the sections below.
Costs required: Most of the cost would be for an existing staff member to implement the tool. Additional
costs would include travel and allowances to visit laboratories, two 1-2 day workshops and consultancy to
support preparation of the final document
A3.1.2 Develop DCP strategy: Based on the outcome of the PCE, DCP would be supported to develop a
5 year strategy covering its various areas of operation. This would not need to be a complicated document,
but should set out clearly how it intends to more effectively fulfil its mandate. The IPPC has recently
produced a useful document titled “Operation of a national plant protection organisation: A guide to
understanding the principal requirements for operating an organization to protect national plant resources
from pests”. The need for a strategic plan, and the topics it could cover, are addressed further there.
However, given that DCP is mandated with tasks beyond the role of an NPPO, particularly in the areas of
input regulation, those areas would also need including. Another resource that would useful in this process
is the Performance, Vision and Strategy for National Plant Protection Organisations (IICA, 2007). This tool
provides a structure for a participatory approach for reviewing technical capability, human and financial
capital, interaction with the private sector, and access to markets.
Costs required: Consultant support to prepare the strategy in consultation with DCP staff and other key
stakeholders through face to face interviews and 3 workshops in years 1, 3 and 5 – to refine and then
review the strategy
A3.1.3 Recruit new DCP staff. An estimated 50 new posts to be created and staff recruited and 31 empty
posts to be filled. A phased recruitment would take place over a 3 year period and it is assumed that all
new recruits would be at inspector level allowing for some more senior and some more junior staff. In
addition, a senior partnership officer and communications officer would be recruited as explained above.
Costs required: Costs for an additional 81 staff are included at inspector level – to bring total staffing
from 39 to 120. Costs of a 3 other senior posts are also included. This is very much an estimate and actual
costs would need to be adjusted based on the results of the capacity diagnosis
A3.1.4 Implement training program to strengthen DCP skills required for effective pest
management: It is assumed that existing staff and new recruits will already have recommended academic
qualifications relevant for their jobs – but that short and long term vocational training will be needed to
improve capacity. Study tours, attachments, mentoring and coaching are also proposed. Some training
opportunities are available within the region (such as with the Centre of Phytosanitary Excellence in Kenya
(www.AfricaCOPE.org). Under the Australia-Africa Plant Biosecurity Partnership (which includes several
DCP staff), linkages have been established with Australian plant biosecurity agencies for
advice/mentoring, so we assume those relationships will continue and do not need to be funded A training
program will be rolled out over a number of years – and a final plan will depend on the result of A3.1.1 and
A3.1.2. However, table 6.4 below shows a number of areas where training is recommended for DCP staff
in the appropriate posts and costs are based on these recommendations. In addition, in view of the

Platform for Agricultural Risk Management | Crop pests and disease management in Uganda: status and investment needs
102
Full Report | October 2016
proposed development of information management systems, DCP training in data analysis on pests and
diseases, and development of appropriate actions to any identified threats will be paramount.
Costs required: Actual costs will be based on the analysis carried out in A3.1.1 However expected costs
are estimated based on table 6.4
A3.1.5 Obtain ISO 17025 accreditation: Part of the strategic plan should be to work towards obtaining
ISO 17025 accreditation. There are both management requirements and technical requirements for
achieving this accreditation, which demonstrates that a laboratory is competent in testing, and this
standard is widely used for phytosanitary laboratories. To become accredited a laboratory must have a
documented quality management system, and progress on this was made in a recent project implemented
by DCP to address phytosanitary problems in exported roses.
Costs required: Many of the costs are covered under the other capacity development activities. However,
provision is required for application fees, consultants to advise on the process, and for the final
accreditation.
Output 3.2: Improved infrastructure for pest and disease management
DCP needs facilities and equipment for providing a range of services. It does not have to provide all the
services covered by its mandate itself; some could be provided by other organisations such as NARO or
universities. However, DCP needs substantially more facilities and equipment than it currently has. As
noted above, modern diagnostic techniques are now available at much lower cost than previously, which
can provide quick results, allowing more appropriate and rapid response to potential or actual pest
problems. This does not preclude the need for the traditional approaches, but the new methods can
provide very significant opportunities. Many of the new techniques are based on the use of various
methods for analysing nucleic acids. For example, loop mediated isothermal amplification (LAMP) can
provide a quick present or absent diagnosis for known species, once the appropriate primers have been
developed and validated for local use. Thus LAMP is useful when the presence of a specific species needs
to be ascertained. This might be when conducting a specific survey as part of prevention or in response to
an incursion (the machines are small and robust so can be taken to the field). It can also be used in
ensuring planting material is free from a particular disease.
A3.2.1: Assess infrastructure needs and develop improvement plan: An assessment will take place
of existing laboratory facilities managed by MAAIF, Universities and NARO. Laboratories would be visited
and an inventory prepared of existing equipment, facilities and staff as well as of the capacity to diagnose
which pathogens. The assessment will include a review of whether laboratories operate services the
general public or serve only an internal clientele (e.g. laboratories in research organisations with a
mandate to serve their own researchers only). Processes and procedures, including current sample
throughput and time taken for service provision will be reviewed. Consultations with relevant stakeholders
representing both clients and service providers undertaken and a plan for laboratory refurbishment and
establishment of appropriate operating procedures developed. The assessment will also review existing
linkages with overseas laboratories. To be cost effective – it can make sense to send certain complex
samples to laboratories with better facilities. The activity relates closely to A3.1.1 so should be conducted
concurrently if possible.
Costs required: Cost of consultancy (including travel) to implement assessment and costs of 2 workshops
to consult stakeholders.
A3.2.2: Equip main laboratory. In section 2.3.1 it was noted that there was inadequate diagnostic
services needed to backstop pest management services and inadequate equipment. It is assumed that
there will be the need to refurbish laboratories – but not build new facilities or upgrade office space. It is
expected that 8 laboratory rooms will need to be refurbished and equipped – either in a single location or
distribution across several locations. Rooms will be required for: preparation/isolation/incubation of
pathogens (nematodes, fungi, bacteria); 1 for virology; 2 for insects and 2 others. Equipment needed
would include ELISA, PCR, LAMP and others as recommended from A3.2.1. It is proposed that plans are
included to refurbish at least 8 rooms
Costs required: a) Costs for refurbishment including equipment based on a cost of 50K per room – with
Platform for Agricultural Risk Management | Crop pests and disease management in Uganda: status and investment needs
103
Full Report | October 2016
refurbishment taking place over 2 years – starting at the end of the first year b) running costs.

Platform for Agricultural Risk Management | Crop pests and disease management in Uganda: status and investment needs
104
Tabella 18: Priority skills and areas of knowledge for training DCP staff
Skills/knowledge area Description
Staff to be trained Staff
Courses
Course type
Phytosanitary processes
Risk analysis Phytosanitary risk analysis in relation to imports. Senior and principal phytosanitary and quarantine inspectors 4 2 Two 5-day courses with COPE the second to follow-up on first-
Surveillance Designing and conducting specific surveys to determine pest distribution and abundance
Agricultural inspectors + senior inspectors who would be involved in designing and conducting surveys
10 2 Two 5-day courses with COPE the second to follow-up on first-
Import controls Based on risk analysis, setting appropriate controls on imports to manage the risks cost effectively. This would include negotiating import conditions with trade partners, inspection, post-entry quarantine.
Senior/principal or higher staff responsible for negotiation with trade partners
5 2 Two 5-day courses with COPE the second to follow-up on specific import issues
Export certification Supporting exporters to meet importers’ conditions, including negotiating market access, inspecting places of production, phytosanitary certification.
Senior/principal or higher staff responsible for engagements and negotiations with trade partners
5 2 Two 5-day courses with COPE the second to follow-up on specific import issues
Diagnostics Traditional and modern molecular techniques for diagnosing plant health problems and identifying causal agents
Agricultural inspectors (diagnostics) and; Laboratory technicians 4 4 4 mo vocational course per staff member
Information management
Database management Data entry, checking and cleaning; database security; development and implementation of protocols and operating procedures
IT & Data manager and data technicians 4 4 1 mo international training
Data analysis, modelling Using the data to answer questions, or to make forecasts, predictions, risk assessments.
IT & Data manager 2 2 1 mo international training
Presentation, visualization Communication of information in ways and formats suitable for different audiences
IT & Data manager, technicians and inspectors 20 2 1 week course delivered locally by national or international consultant-
Regulatory functions
Regulating pest control products Setting, implementing and enforcing regulations, preferably that support integrated pest management
Agricultural inspectors (pesticides) – together with senior/principal inspectors
3 3 Part-time distance learning course mixed with mentoring visits by international consultant(s)
Regulating seed systems Setting, implementing and enforcing regulations that allow farmers to access and use quality seed
Agricultural inspectors (seed) – together with senior/principal inspectors
3 3 Part-time distance learning course mixed with mentoring visits by international consultant(s)
Regulatory impact assessment and regulatory good practice
Assessing and monitoring regulatory impact and identifying opportunities for reducing negative impacts
Senior staff 5 1 1 week course delivered on-site by international consultant(s)

Platform for Agricultural Risk Management | Crop pests and disease management in Uganda: status and investment needs
105
Skills/knowledge area Description
Staff to be trained Staff
Courses
Course type
while achieving public policy goals
Monitoring (pesticide analysis, seed testing)
Technical methods for monitoring input quality Agricultural inspectors (seed/pesticides) 20 2 10 day course with COPE or other On seed testing and analysis
Management
Strategic planning Developing plans for the NPPO (DCP), based on actual and expected needs in the agriculture sector
Senior staff 5 1 Participation in international course/mentoring – study tours and on-site training
Financial management Budgeting, allocating finance based on strategic priorities and cost effectiveness
Finance staff (assume already in place) together with senior DCP staff
5 1 Finance course
Leadership Leading an organisation, such as the NPPO Senior staff - assume already in place 5 1 Participation in international course/mentoring – study tours and on-site training
Quality management setting up and monitoring procedures to ensure quality of all activities
All senior staff involved in managing NPPO related activities 10 1 Participate in setting up system related to clinics and work with ICT staff developing system
Communication, advocacy, policy influence
Communicating with stakeholders to influence change Senior staff - assume already in place 5 1 Participation in international course/mentoring
CoPE = Centre of Phytosanitary Excellence

Platform for Agricultural Risk Management | Crop pests and disease management in Uganda: status and investment needs
106
Full Report | October 2016
A3.2.3: Install and equip post-entry quarantine facilities. When importing planting material such as
seeds or vegetative material, a facility to test the material following import is particularly valuable. Usually
this would include a number of secure greenhouses where materials could be grown, and tested for any
diseases of concern. Namalere is the designated post-entry quarantine station, and it is recommended that
a set of greenhouses would be built there. However, a final decision will be determined under A3.2.1
Costs required: a) Installation of set of 3-5 greenhouses – estimated cost 50K b) running costs
A3.2.4: Equip border post laboratories. Border posts are a front line in the prevention of incursions by
new pests, and some equipment is required for sampling consignments, and undertaking any tests that
might be necessary. There will always be a need to send samples to a central diagnostic laboratory, but
given that this takes time, it is often not convenient or appropriate. Thus border posts should have at least
a small laboratory facility.
Costs required: a) Costs of installing some small equipment including sampling equipment, a microscope,
as well as IT equipment (see below)
A3.2.5: Equip laboratory for pesticide testing. To monitor and enforce regulations concerning
pesticides, laboratories are needed where the necessary analyses can be undertaken. Pesticide residue
analysis laboratories can also support exports by ensuring consignments meet maximum residue level
requirements.
Costs required: It is assumed that costs of laboratories to support pesticide regulations will be covered
under a current proposal already before government (MAAIF, 2014)
A3.2.6: Equip laboratory for seed testing. To monitor and enforce regulations concerning seeds,
capacity is needed to test for purity, germination, diseases etc. Seed regulation also requires a field site
and greenhouses to carry out distinctness, uniformity and stability (DUS) testing. It is expected that the
seed testing laboratory hosted at Kawanda will also require re-furbishing and new greenhouses. A final
decision will depend on the outcome of A3.2.1
Costs required: Costs of refurbishing facility and greenhouses in year 1 and running costs thereafter
A3.2.7: Install information technology (IT) to network DCP staff. Adequate IT equipment is essential
for the operation of a national plant protection organisation. Fundamental to this is good access to the
Internet; good bandwidth continuously available at all DCP premises. A few of the areas where IT
equipment and internet access can significantly enhance NPPO activities include:
Accumulation of data, supporting risk analysis and the adoption of risk-based approaches that
optimise resource use
Analysing risk and modelling risk management options
Electronic certification (the IPPC is currently developing a system that will allow any country that
wishes to use electronic phytosanitary certificates)
Digital keys and other diagnostic aids
Repositories for standard operating procedures
Rapid sharing of information, including alerts
Costs required: Computers and wifi access would be needed at each border post. Current position is not
known – it is assumed that 35 computers are needed for the border posts (for 35 gazetted posts); and 15
at HQ together with associated networking facilities. Technical assistance to set up a networked system
and operational costs to cover costs of installation and maintenance of wifi.
6.3.5 Logical framework
Indicators for supporting the monitoring and evaluation of the investment plan have been developed at the,
goal, outcome and output levels. These indicators address medium to long term results expected as a
result of this plan. In the long term, indicators include reduction in crop losses and increases in production
and yield at household level. In the medium term, indicators include; establishment of functional extension
system responding to pest management at local level, and systems for early detection and response. This
should be accompanied by appropriate skills in monitoring, analysis and response to pest situations as

Platform for Agricultural Risk Management | Crop pests and disease management in Uganda: status and investment needs
107
Full Report | October 2016
well as enforce regulations to ensure quality pest management services. At the farm level, increased
access to quality information and inputs will be measured by the proportion of farmers with appropriate
knowledge and applying recommended pest management practices. In the short term, performance
indicators will include personnel development, emergency response planning, harmonized pest monitoring
including border points, data collection and storage services, information dissemination and quality control.
These are summarized in the Table 6.5.
Tabella 19: Logical framework
Plan Detail Objectively verifiable indicators Sources of verifications
Goal: Crop losses due to pests and diseases reduced, leading to increased production and productivity of key crops, and increased household level incomes for smallholder farmers
1. % reduction in crop losses attributed to pests (key value chains)
2. % change in yield of key crops 3. Change in household incomes attributed to
crop
Impact case studies Evaluation reports (household level production data) National production statistics Agricultural information database Pest database and surveillance reports
Development Objective: Strengthened capacity of agricultural institutions to establish sustainable pest management systems and structures for effective pest management
4. Functional national extension system 5. Functional crop protection system 6. Systems for early detection and response
of pests operational
Internal monitoring and evaluation reports Internal impact assessment reports External evaluation reports
Strategic outcome 1: Cost-efficient information systems to detect and monitor plant pests and diseases established, providing timely information to MAAIF (and other relevant stakeholders) to effectively respond to pest situations
7. Updated pest database and management options
8. Rate of pest data transfer from plant clinics and other stakeholders
9. Household database used to collect pest data and share warnings and recommendations
MAAIF plans and reports Internal monitoring and evaluation reports Evaluation reports POMS – PW knowledge bank
Strategic outcome 2: Improved access to pest management services by smallholder farmers and other value chain actors to effectively manage plant pests and diseases
10. % of smallholder farmers accessing appropriate pest management information
11. Smallholder farmers and value chain actors adopt appropriate pest management strategies
Internal monitoring and evaluation reports Evaluation reports (household level production data) National statistics
Strategic outcome 3: Strengthened capacity of MAAIF (and other relevant stakeholders) to monitor, analyse and combat the threat of plant pests and diseases.
12. Relevant skills and personnel in MAAIF / DCP reaching 90% by year 5
13. Labs deliver diagnostic services etc.
MAAIF plans and reports
Outputs
Output 1.1: Emergency response plans operationalised
Emergency response plans improved and updated regularly (at least semi-annually)
Plant protection and health technical committee in place and providing oversight for pest management
MAAIF plans and reports
Output 1.2: Pest monitoring at border points decreasing risk of new pest incursions
Pest monitoring at border points decreasing risk of new pest incursions by 50% in 5 years
Monitoring reports of trade flows, sampling and inceptions
Output 1.3: Pest surveillance systems providing early warning
Routine pest surveillance (at least quarterly) Pest information system in place and
updated
MAAIF plans and reports Extension worker reports
Output 2.1: Improved farmer awareness Appropriate pest management information disseminated to farmers using various extension approaches
MAAIF plans and reports Extension worker reports
Output 2.2: Access to high quality inputs (crop protection products, seed, fertilizer) improved
% decrease in counterfeit inputs Instances of fake inputs reported at farmer
level % of certified agro-input dealers
MAAIF plans and reports Extension worker reports Farmer feedback
Output 3.1: Department of Crop Protection structure reviewed and staff trained
% of key positions filled according to MAAIF structure and proposed new staff
Number of staff equipped with skills in pest management
ISO accreditation by year 5
Staffing reports

Platform for Agricultural Risk Management | Crop pests and disease management in Uganda: status and investment needs
108
Full Report | October 2016
Plan Detail Objectively verifiable indicators Sources of verifications
Output 3.2: Improved infrastructure for pest and disease management
Equipped and staffed diagnostic laboratory Post-entry quarantine facilities equipped
Lab inventories; service procedures
6.4 Budget summary by result and activity
Costs of implementation are summarized below based on detail of the costs required. Note missing
Activities are where activities are covered under other funding sources or elsewhere in the budget. Some
of cost assumptions used to estimate the budget are given in the table below and a full detailed budget
with workings provided separately.
Year 1 Year 2 Year 3 Year 4 Year 5
Strategic Outcome 1: Effective pest information system established
Coordination
Salaries - coordination staff 14,500 14,500 14,500 14,500 14,500
Supplies/Equipment 22,000 2,000 12,000 2,000 2,000
Travel 5,000 5,000 5,000 5,000 5,000
Vehicles - including running costs 80,000 110,000 140,000 90,000 90,000
M&E1 600,000 600,000 600,000 600,000 600,000
Sub- total: Coordination 721,500 731,500 771,500 711,500 711,500
Output 1.1 Emergency response plans operationalised
Meetings/workshops 39,004 34,474 15,602 15,602 15,602
Technical assistance 72,000 57,000 24,000 24,000 24,000
Sub- total: Output 1.1 111,004 91,474 39,602 39,602 39,602
Output 1.2 Effective pest monitoring at border points decreasing risk of new pest incursions
Technical assistance - communication materials 6,000 29,806 12,000 - -
Technical assistance - risk analysis 72,000 54,000 36,000 - -
Meetings/workshops - 4,860 4,860 - -
Supplies/Equipment - 40,000 - - 40,000
Sub- total: Output 1.2 78,000 128,666 52,860 - 40,000
Output 1.3 Pest surveillance systems established providing early warning
Salaries - extension staff Uses current staff
Technical assistance - build data collection and management system2
280,000 280,000 140,000 - -
Technical assistance - collect farmer profiles3 1,500,000 1,500,000 1,500,000 500,000 -

Platform for Agricultural Risk Management | Crop pests and disease management in Uganda: status and investment needs
109
Full Report | October 2016
Year 1 Year 2 Year 3 Year 4 Year 5
Technical assistances - backstop training 80,000 80,000 56,000 56,000 44,000
Meetings/workshops 125,284 125,284 122,642 121,321 121,321
Supplies/Equipment
Clinic start-up equipment 90,000 60,000 60,000 60,000 90,900
IT system maintenance - - 70,000 70,000 70,000
Stakeholder consultations 5,000 5,000 5,000 - 5,000
Tablets for 3000 SC extension staff; 500 for district, zonal and DCP staff
220,000 220,000 220,000 110,000 -
Airtime and maintenance 120,000 240,000 360,000 420,000 420,000
Data collection from HH using SMS - 30,000 60,000 90,000 100,000
Travel 8,000 8,000 4,000 - 2,000
Training - data management 163,800 163,800 136,500 136,500 136,500
Training - plant doctors in modules 1 & 24 409,500 409,500 409,500 409,500 409,500
Training - plant doctors in MPCP5
Operation allowances6 231,750 386,250 540,750 695,250 929,318
Operational - surveys and pest surveillance 60,000 60,000 60,000 60,000 60,000
Contingency - pest eradication or containment 100,000 - - 100,000 -
Contingency - pest management 100,000 100,000 100,000 100,000 100,000
Sub- total: Output 1.3 3,493,334 3,667,834 3,844,392 2,928,571 2,488,539
Strategic Outcome 2: Improved access to pest management services
Output 2.1 Improved farmer awareness of pest and disease management
Salaries - Extension staff Based on existing/planned staff complement
Technical Assistance - Communications 72,000 72,000 72,000 72,000 72,000
Meetings/workshops 36,400 36,400 36,400 36,400 36,400
Supplies/Equipment 16,000 16,000 16,000 16,000 16,000
Training - 75,000 75,000 75,000 75,000
Operation allowances 2,400 2,400 2,400 2,400 2,400
Plant clinic establishment covered in Output 1.3
Contract - network information databases - 100,000 10,000 10,000 10,000
Contract - print media 12,000 12,000 12,000 12,000 12,000
Contract - radio 80,000 80,000 80,000 80,000 80,000

Platform for Agricultural Risk Management | Crop pests and disease management in Uganda: status and investment needs
110
Full Report | October 2016
Year 1 Year 2 Year 3 Year 4 Year 5
Contract - SMS to profiled farmers 30,600 60,600 90,600 100,600 100,600
Contract - TV 96,000 96,000 96,000 96,000 96,000
Sub- total: Output 2.1 345,400 550,400 490,400 500,400 500,400
Output 2.2 Improved access to high quality inputs (crop protection products, seed)
Technical assistance - seed regulation 132,000 132,000 132,000 132,000 132,000
Meetings/workshops 20,530 20,530 20,530 20,530 20,530
Supplies/Equipment 20,000 20,000 20,000 20,000 20,000
Training 36,400 72,800 72,800 36,400 -
Operation allowances 20,000 40,000 60,000 60,000 60,000
Contract - awareness on good quality seed - 75,850 - 85,850 -
Contract - awareness on pestcide use
Contract - develop standards 25,000 - - - -
Contract - piloting 100,000 100,000 100,000 100,000 100,000
Sub- total: Output 2.2 353,930 461,180 405,330 454,780 332,530
Strategic Outcome 3: Capacity to monitor and combat pests and diseases
Output 3.1 Department of Crop Protection structure reviewed and staff trained
Salaries - DCP senior staff* 24,000 24,000 24,000 24,000 24,000
Salaries - DCP inspectors* 80,000 240,000 324,000 324,000 324,000
Technical assistance - DCP strategy 18,000 - - - -
Technical assistance - training 66,000 66,000 24,000 24,000 24,000
Meetings/workshops 6,510 - 1,510 - 1,510
Training 104,940 212,700 66,300 11,360 11,360
Travel 2,000 - - - -
Contract - ISO 17205 accreditatioon - 13,000 1,000 - -
Contract - IPPC diagnostic 6,000 - - - -
Sub- total: Output 3.1 307,450 555,700 440,810 383,360 384,870
Output 3.2 Improved infrastructure for pest and disease management
Technical assistance - infrastructure 60,000 60,000 36,000 24,000 -
Technical assistance - IT 60,000 36,000 24,000 12,000 12,000
Meetings/workshops 18,200 - - - -
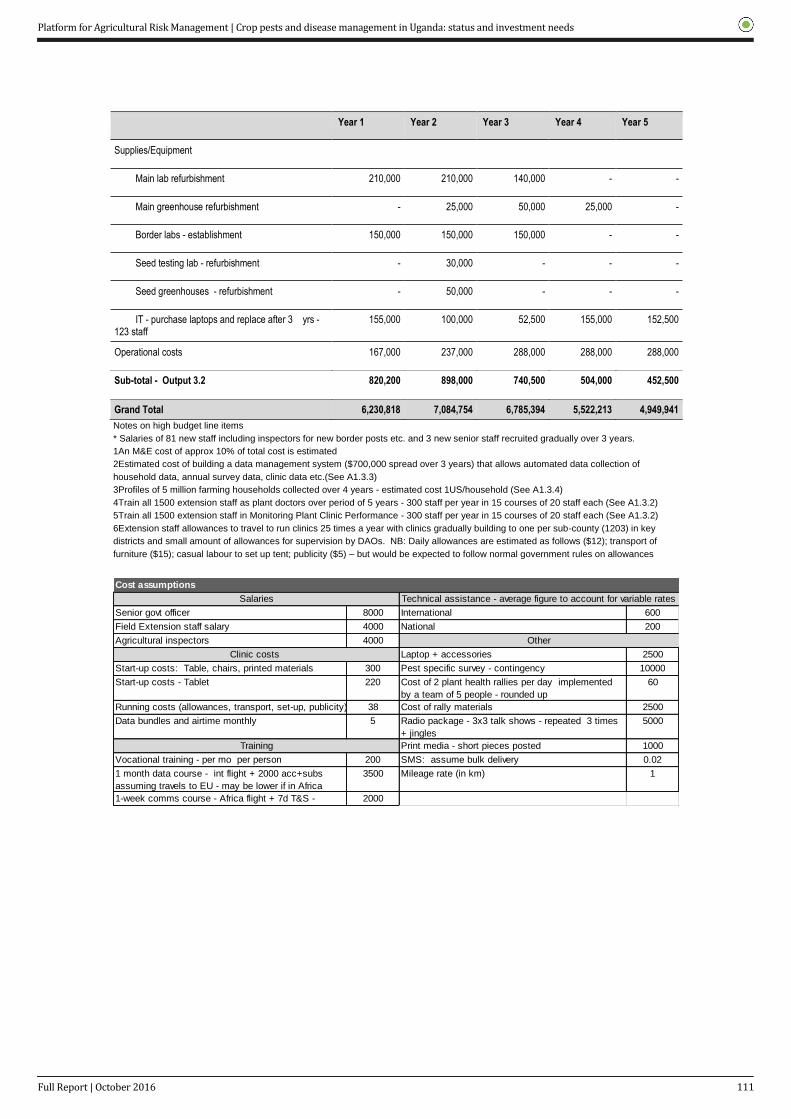
Platform for Agricultural Risk Management | Crop pests and disease management in Uganda: status and investment needs
111
Full Report | October 2016
Year 1 Year 2 Year 3 Year 4 Year 5
Supplies/Equipment
Main lab refurbishment 210,000 210,000 140,000 - -
Main greenhouse refurbishment - 25,000 50,000 25,000 -
Border labs - establishment 150,000 150,000 150,000 - -
Seed testing lab - refurbishment - 30,000 - - -
Seed greenhouses - refurbishment - 50,000 - - -
IT - purchase laptops and replace after 3 yrs - 123 staff
155,000 100,000 52,500 155,000 152,500
Operational costs 167,000 237,000 288,000 288,000 288,000
Sub-total - Output 3.2 820,200 898,000 740,500 504,000 452,500
Grand Total 6,230,818 7,084,754 6,785,394 5,522,213 4,949,941
Notes on high budget line items
* Salaries of 81 new staff including inspectors for new border posts etc. and 3 new senior staff recruited gradually over 3 years.
1An M&E cost of approx 10% of total cost is estimated
2Estimated cost of building a data management system ($700,000 spread over 3 years) that allows automated data collection of
household data, annual survey data, clinic data etc.(See A1.3.3)
3Profiles of 5 million farming households collected over 4 years - estimated cost 1US/household (See A1.3.4)
4Train all 1500 extension staff as plant doctors over period of 5 years - 300 staff per year in 15 courses of 20 staff each (See A1.3.2)
5Train all 1500 extension staff in Monitoring Plant Clinic Performance - 300 staff per year in 15 courses of 20 staff each (See A1.3.2)
6Extension staff allowances to travel to run clinics 25 times a year with clinics gradually building to one per sub-county (1203) in key
districts and small amount of allowances for supervision by DAOs. NB: Daily allowances are estimated as follows ($12); transport of
furniture ($15); casual labour to set up tent; publicity ($5) – but would be expected to follow normal government rules on allowances
Cost assumptions
Senior govt officer 8000 International 600
Field Extension staff salary 4000 National 200
Agricultural inspectors 4000
Laptop + accessories 2500
Start-up costs: Table, chairs, printed materials 300 Pest specific survey - contingency 10000
Start-up costs - Tablet 220 Cost of 2 plant health rallies per day implemented
by a team of 5 people - rounded up
60
Running costs (allowances, transport, set-up, publicity) 38 Cost of rally materials 2500
Data bundles and airtime monthly 5 Radio package - 3x3 talk shows - repeated 3 times
+ jingles
5000
Print media - short pieces posted 1000
Vocational training - per mo per person 200 SMS: assume bulk delivery 0.02
1 month data course - int flight + 2000 acc+subs
assuming travels to EU - may be lower if in Africa
3500 Mileage rate (in km) 1
1-week comms course - Africa flight + 7d T&S -
200/day
2000
Salaries
Clinic costs
Training
Other
Technical assistance - average figure to account for variable rates

Platform for Agricultural Risk Management | Crop pests and disease management in Uganda: status and investment needs
112
6.5 Work plan Plan detail Strategies Year 1 Year 2 Year 3 Year 4 Year 5
Strategic Outcome 1: Effective pest information system established
1Output 1.1: Emergency response plans improved
A1.1.1: Operationalise the plant protection and health technical committee (no. committee meetings)
4
4 2 2 2
A1.1.2: Develop pest emergency response plans (no. sub-committee meetings) 4 4 1 1 1
A1.1.3: Development of sector specific prevention strategies for high risk commodities (sector sub-committee meetings)
XXX XXX X X X
Output 1.2: Pest monitoring at border points decreasing risk of new pest incursions
A1.2.1: Risk analysis XXX XX XX
A1.2.2: Re-establish DCP presence at gazetted border posts XXX XXX
A1.2.3: Development of guidelines and materials to raise awareness of both public and border staff on pest risks
Output 1.3: Pest surveillance systems providing early warning
A1.3.1: Establish a working group to develop a pest information management system for early warning and household level data: (group meetings)
4
4 2 1 1
A1.3.2: Establish a network of plant health clinics (clinics running): 300 500 700 900 1203
A1.3.3: Design and build a pest information system a) to collect and manage pest monitoring data:
XXX XXX XX
A1.3.4: Design and build a pest information system b) to collect and manage household level data: (million profiles collected)
1.5
1.5
1.5
0.5
A1.3.5: Equip all district agricultural officers and sub-county extension staff with tablets and tools (nos. receiving tablets)
1000 1000 1000 500
A1.3.6: Respond to early warning of pest outbreaks - Implement specific surveys and pest surveillance
A1.3.7: Respond to early warning of pest outbreaks – contingency to eradicate, or contain:
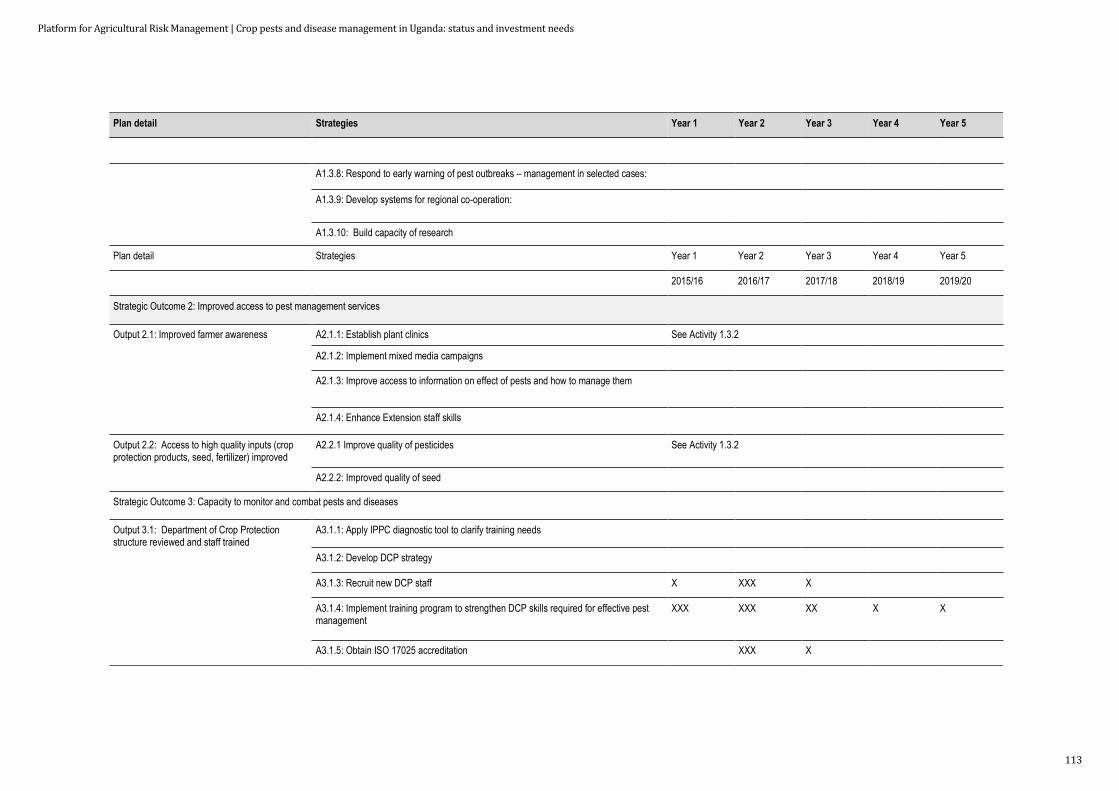
Platform for Agricultural Risk Management | Crop pests and disease management in Uganda: status and investment needs
113
Plan detail Strategies Year 1 Year 2 Year 3 Year 4 Year 5
A1.3.8: Respond to early warning of pest outbreaks – management in selected cases:
A1.3.9: Develop systems for regional co-operation:
A1.3.10: Build capacity of research
Plan detail Strategies Year 1 Year 2 Year 3 Year 4 Year 5
2015/16 2016/17 2017/18 2018/19 2019/20
Strategic Outcome 2: Improved access to pest management services
Output 2.1: Improved farmer awareness
A2.1.1: Establish plant clinics See Activity 1.3.2
A2.1.2: Implement mixed media campaigns
A2.1.3: Improve access to information on effect of pests and how to manage them
A2.1.4: Enhance Extension staff skills
Output 2.2: Access to high quality inputs (crop protection products, seed, fertilizer) improved
A2.2.1 Improve quality of pesticides See Activity 1.3.2
A2.2.2: Improved quality of seed
Strategic Outcome 3: Capacity to monitor and combat pests and diseases
Output 3.1: Department of Crop Protection structure reviewed and staff trained
A3.1.1: Apply IPPC diagnostic tool to clarify training needs
A3.1.2: Develop DCP strategy
A3.1.3: Recruit new DCP staff X XXX X
A3.1.4: Implement training program to strengthen DCP skills required for effective pest management
XXX XXX XX X X
A3.1.5: Obtain ISO 17025 accreditation XXX X
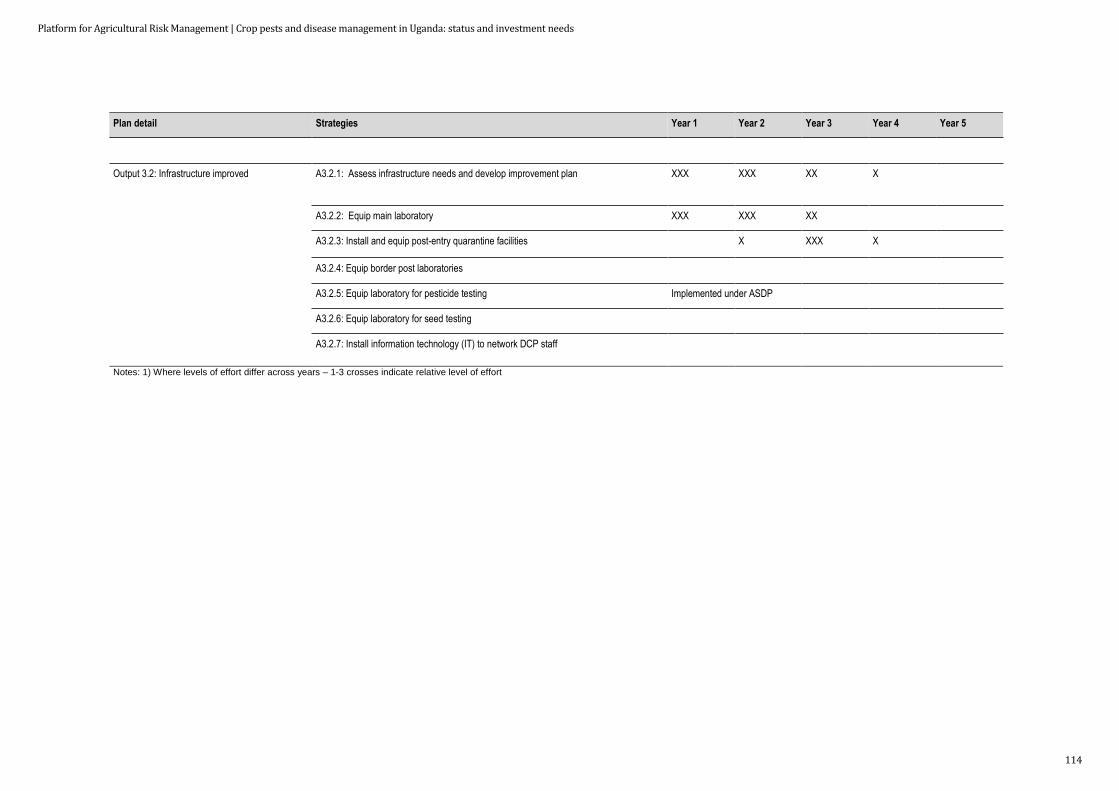
Platform for Agricultural Risk Management | Crop pests and disease management in Uganda: status and investment needs
114
Plan detail Strategies Year 1 Year 2 Year 3 Year 4 Year 5
Output 3.2: Infrastructure improved
A3.2.1: Assess infrastructure needs and develop improvement plan XXX XXX XX X
A3.2.2: Equip main laboratory XXX XXX XX
A3.2.3: Install and equip post-entry quarantine facilities X XXX X
A3.2.4: Equip border post laboratories
A3.2.5: Equip laboratory for pesticide testing Implemented under ASDP
A3.2.6: Equip laboratory for seed testing
A3.2.7: Install information technology (IT) to network DCP staff
Notes: 1) Where levels of effort differ across years – 1-3 crosses indicate relative level of effort
Platform for Agricultural Risk Management | Crop pests and disease management in Uganda: status and investment needs
115
Full Report | October 2016
6.6 Partnerships for sustainable implementation The interventions described and budgeted in previous sections aim to ensure Uganda has a robust and
reliable plant health system. Some initiatives are already in progress that contributes to this goal so are
not included or budgeted for here, such as the Pest Management Plan under the Agriculture Cluster
Development Project, currently awaiting parliamentary approval. Other activities that contribute will include
the proposed changes in extension and focus of NAADS on input delivery, and a number of other donor
funded initiatives such as delivery of information through ICT, Plantwise or radio, that we recommend are
scaled up. And in the future, other projects might be developed which while not explicitly designed to
contribute to the investment strategy described here, do contribute to the broad goal and so should be
brought under the strategy as appropriate.
Two things follow from this scenario. First there is need for partnership and coordination, with central
government playing a pivotal role. Second, financing will come from a variety of sources. In this chapter we
briefly discuss some aspects of implementation that need to be taken into account, including roles and
financing, as well as the recommended immediate next steps.
6.6.1 Partnerships
The investment strategy has made clear that multiple stakeholders will be involved in implementation. The
main categories of stakeholder and their roles were described in Chapter 3.2 and Table 6.1 also indicated
roles of some stakeholders in relation to prevention and control of pests at different stages of invasion.
Central government has a key role to play, as provided for in the legal and institutional framework. This
role involves providing national leadership in addressing crop pest and disease risks; implementing
specific activities (especially those delivering public goods); coordinating, guiding and overseeing the
inputs of the various stakeholders; and facilitating and managing the different partnerships entailed. The
importance of establishing and maintaining effective partnerships is reflected in the recommendation that a
new position is created in DCP for partnership management (Output 3.1).
It is not possible or appropriate in a complex system for one actor to attempt to exercise full control. But it
is important that the different actors engage with each other, share information, and have some concept of
how their activities contribute to and fit in to the overall system. Facilitating this engagement is an
appropriate role for DCP, and is why a post for partnership management is required. Some tasks that
would fall under a pest management strategy are implemented by other government ministries,
departments and agencies, and would require close cooperation. For example extension is in a separate
directorate but is in the frontline in terms of sharing pest management information and collecting
information from farmers. In order to ensure actions are complementary and integrated, effective
partnerships need to be established and maintained.
Other actors, particularly the private sector, and especially in those crops where value chains are more
organised, have key roles to play. However, while they are required to operate within the legal and
regulatory framework, they may have their own priorities and make decisions accordingly. Thus the role of
DCP is to ensure that such interventions are dovetailed with the overall strategy as far as possible, and
that different actors’ interventions are complementary rather than duplicative or contradictory.
6.6.2 Financing the investment strategy
Finance for the investment strategy is likely to come from a variety of sources. Some elements of the
strategy may be implemented as externally funded independent projects or private sector activities. Efforts
should be made to embed such projects within the overall strategy, particularly those that are still at the
planning stage.
As the key player in the strategy is central government, with many of the activities being for the public
good, government could be expected to be the primary financier. At the same time, the financial
Platform for Agricultural Risk Management | Crop pests and disease management in Uganda: status and investment needs
116
Full Report | October 2016
requirements for the strategy are considerably in excess of what the government is likely to be able to
provide in the short term.
A number of the required investments are one-time capital expenses or activities necessary to upgrade the
capacity of DCP to fulfil the expanded and enhanced role required. These include refurbishing laboratories
and facilities; setting up an IT system; collecting householder profiles that can be accessed in the
implementation of ICT based services; training extension staff as plant doctors. Such investments would
be appropriate for an external financier, with a long term impact to be expected from the short term
investment.
Conversely, recurring costs will be required on an ongoing basis, as part of organisations’ mandates, and
these should be funded through regular budget lines as soon as possible if not immediately. These include
the costs of additional staff to be recruited to fill the established vacancies, as well as to fill the additional
posts recommended.
As part of implementing the strategy, opportunities for cost recovery should therefore be identified, and for
public sector bodies be included in regulations where necessary. For example, fees can be levied for
services that benefit specific private sector stakeholders, such as import risk analyses, input (pesticide and
seeds) registration procedures, phytosanitary export certification, inspections at farms or packhouses.
Where such fees are already levied, fee rates should be reviewed and revised if necessary.
However, a more important issue may be the retention of fees by the agency providing the service. It is
common for fees to be remitted to the government treasury, with the regulatory agencies then having to
prepare and request annual budgets. An alternative approach is for the regulatory agencies to retain the
fees they generate, and this can be a more efficient and effective approach, provided it is used within the
context of good regulatory practice. This includes adhering to the provision of the WTO SPS Agreement,
for example, which specifies that such fees should not exceed costs of providing the services. The Trade
Facilitation Agreement also requires countries to review the number and diversity of feeds and reduce
them wherever practicable. Changes to fees must also be notified with a required interval before
implementation.
Apart from the payment of fees, as noted above, private sector actors can also be expected to support the
strategy especially as it relates to commodity value chains that are well organised and generating
substantial foreign export earnings (Table 6.2). Such finance would support their activities and involvement
in the implementation of the plan. Another specific area in which private sector funding could be expected
is in the implementation of emergency responses. As described in Output 1.1, emergency response plans
should detail, as far as possible, not only who does what in the event of an emergency, but how it will be
financed by the various stakeholders.
6.6.3 Way forward
The following immediate steps are recommended:
Operationalise the plant protection and plant health technical committee (A1.1.1), if not already done.
This committee should be the owner of the investment strategy and take all necessary steps to ensure
its implementation
Appoint a strategy implementation task-force or subcommittee. The technical committee should
constitute and define terms of reference for the sub-committee. It would be composed of selected
members of the technical committee plus additional staff from public and private sector organisations.
The sub-committee should have the job of identifying and executing the specific tasks to implement
the strategy as part of the ASSP. The ToR could include:
o Preparing an implementation plan, including a detailed inception phase for year 1.
o Preparation of detailed budgets for specific activities, within the overall framework of the
investment strategy.
o Engaging stakeholders and promoting the investment strategy

Platform for Agricultural Risk Management | Crop pests and disease management in Uganda: status and investment needs
117
Full Report | October 2016
o Mobilising resources.
o Ensuring coordination and dovetailing of different crop protection initiatives to strengthen the plant
health system, especially externally supported ones that might have been devised or designed
outside the ASSP framework.
o Providing regular reports to the technical committee
Platform for Agricultural Risk Management | Crop pests and disease management in Uganda: status and investment needs
118
Full Report | October 2016
References Adipala, E., Lipps, P.E. and Madden, L.V. (1993). Occurrence of Exserohilum turcicum on maize in
Uganda. Plant Diseases 77: 202-205
AfDB (African Development Bank) (2015). Uganda Rural Electricity Access Project, ONEC department.
24pp http://www.afdb.org/fileadmin/uploads/afdb/Documents/Boards-Documents/Uganda-_AR-
_Uganda_Rural_Electricity_Access_Project_-_09_2015.pdf
Ahmed M., 2012. Analysis of incentives and disincentives for coffee in Uganda. Technical notes series,
MAFAP, FAO, Rome.
Ahmed M., Ojangole S., 2012. Analysis of incentives and disincentives for cotton in Uganda. Technical
notes series, MAFAP, FAO, Rome.
Akello B. and Hillocks , R.J. (2002). Distribution and races of Xanthomonas campestris pv. malvacearum
on cotton (Gossypium hirsutum) in Uganda. Journal of Phytopathology 150, 65–69.
Alacho, F.O. and Akimanzi, D.R. (1993). Progress, achievements and constraints on bacterial wilt control
in Uganda. pp 32-41 In: Workshop on Bacterial wilt of potato caused by Pseudomonas
solanacearum, Bujumbura, Burundi, Feb.22-26, 1993.
Alicai, T., Omogo, C.A., Maruthi, M.N., Hillocks, R.J. and Baguma, Y. (2007). Reemergence of Cassava
Brown Streak Disease in Uganda. Plant Diseases, 91:24-29.
Alicai, T., Omongo, C. A., Maruthi, M.N., Hillocks, R.J., Baguma, Y., Kawuki, R., Bua, A., Otim-Nape,
G.W., and Colvin, J. (2007). Re-emergence of cassava brown streak disease in Uganda. Plant
Dis. 91:24-29.
Alicai, T., Omongo, C.A. and Maruthi, M.N. (2007). Re-emergence of cassava brown streak disease in
Uganda. Plant Disease: 91, 1, 24–29.
Altieri, M.A. and Nicholls, C.I. (2003). Soil fertility management and insect pests: harmonizing soil and
plant health in agroecosystems. Soil & Tillage Research, 72: 203–211
ASARECA (2010). Policy Brief on counterfeit and illegal plant protection products, and fake or expired
seeds, and fertilizers. Association for strengthening Agricultural Research in Eastern and Central
Africa (ASARECA). Entebbe, Uganda.
Asea, G., Bigirwa, G., Adipala, E., Owera, S.A.P., Pratt, R.C. and Lipps, P.E. (2002). Effect of Cercospora
zeae-maydis infested maize residue on progress and spread of grey leaf spot of maize in central
Uganda. Annals of Applied Biology 140: 177-185.
Bekunda M (1999). Farmers’ responses to soil fertility decline in banana-based cropping systems in
Uganda. Managing Africa’s soils. No. 4, Russell Publishers, Nottingham 2
Bekunda, M, Woomer P.L (1996). Organic resources management in banana-based cropping systems of
the Lake Victoria Basin, Uganda. Agric. Ecosys. Environ 59(3): 171-180.
Benin, S., Nkonya, E., Okecho, G., Pender, J., Nahdy, S., Mugarura, S., Kato, E. and Kayobyo, G.
(2007). Assessing the Impact of the National Agricultural Advisory Services (NAADS) in the
Uganda Rural Livelihoods. IFPRI Discussion Paper 00724 October 2007.
Benin, S., Nkonya, E., Okecho, G., Randriamamonjy, J., Kato, E., Lubade, G. and Kyotalimye, M. (2011).
Returns to spending on agricultural extension: the case of the National Agricultural Advisory
Services (NAADS) program of Uganda. Agricultural Economics 42: 249–267.
Berocan, J., Akol, A.M., Munyuli, T. (2014). Insecticide use and practices among cotton farmers in northern
Uganda, Uganda Journal of Agricultural Sciences, 15 (1): 51-61
Bigirwa, G., Kaaya, A.N., Sseruwu, G., Adipala, E. and Okanya, S. (2007). Incidence and severity of maize
ear rots and factors responsible for their occurrence in Uganda. Journal of Applied Sciences 7:
3780-3785.
Bigirwa, G., Sseruwu, G., Kaaya, A.N., Adipala, E. and Okanya, S. (2006) Fungal Microflora causing maize
ear rots in Uganda and associated aflatoxins. Journal of Biological Sciences, 6(3):540-546
Birikunzira, J.B. (2000). Recent advances in coffee berry disease (CBD) control in Uganda. Uganda
Journal of Agricultural Sciences, 5:57-60
Bonabana-Wabbi, J., Ayo, S., Mugonola, B., Taylor, D.B., Kirinya, J. and Tenywa, M. (2013). The
performance of potato markets in South Western Uganda. Journal of Development and
Agricultural Economics, 5(6): 225-235

Platform for Agricultural Risk Management | Crop pests and disease management in Uganda: status and investment needs
119
Full Report | October 2016
Brubaker, J., Danielsen, S., Olupot, M., Romney, D. and Ochatum, N. (2013). Impact Evaluation of Plant
Clinics: Teso, Uganda. CABI working paper 6, October 2013.
Bureau of Statistics in collaboration with the Ministry of Agriculture, Animal, Industry and Fisheries,
Kampala.
Byantwale, S. (2014). Uganda Experience of Banana Xanthomonas Wilt Control. In: E. Adenya & A.
Frenken (Eds). Proceedings of the Regional Platform on Plant pest and diseases, held in Nairobi
15 -17 April 2014. FAO
Bymolt R. (2015). The Joseph Initiative and Agricultural Transformation. Available from: http://common-
fund.org/fileadmin/user_upload/Publications/Special_Publications/CFC2014_Paper_Maize.pdf
Calandro, E., Stork, C. and Gillwald, A. (2012) Internet Going Mobile: Internet access and usage in eleven
African countries. [Online] Available at
http://www.researchictafrica.net/presentations/Presentations/2012%20Calandro%20Stork%20Gill
wald%20-%20Internet%20Going%20Mobile-
%20Internet%20access%20and%20usage%20in%20eleven%20African%20countries%20.pdf
[Accessed 1 Aug 2016]
Calatayud, P., Le Ru, B.P., Berg, J., Schulthess, F. (2014). Ecology of the African Maize Stalk Borer,
Busseola fusca (Lepidoptera: Noctuidae) with Special Reference to Insect-Plant Interactions.
Insects, 5:539-563
Chell, D. G. (2013). Uganda’s Cotton and Textile Sectors: Current Production Challenges, Motivations and
Effects on Development. Independent Study Project (ISP) Collection. Paper 1692.
CIA (2015). The World Factbook. [online] Available at: https://www.cia.gov/library/publications/the-world-
factbook/ [Accessed13 Jan. 2015].
CIAT. 2008. Highlights CIAT in Africa. The impact of improved bush bean varieties in Uganda. CIAT,
Kampala.
Collings, S. (2011) Phone Charging Micro-businesses in Tanzania and Uganda. Published by GVEP
International, London, UK, 26pp Available at
http://www.energy4impact.org/sites/default/files/phone_charging_businesses_report_with_gsma_fi
nal_for_web_0.pdf [Aug 1, 2016]
Danielsen, S. and Matsiko, F. (2016) Using a plant health system framework to assess plant clinic
performance in Uganda. Food Security. DOI: 10.1007/s12571-015-0546-6 [PDF]
Danielsen, S., Matsiko F.B., and Kjær A.M.. (2014). "Implementing Plant Clinics in the Maelstrom of Policy
Reform in Uganda." Food Security 6: (6): 807-818.
Danielsen, S., Matsiko, F.B., Mutebi, E., & Karubanga, G. (2012). Second generation plant health clinics in
Uganda: Measuring clinic performance from a plant health system perspective 2010–2011.
Working paper 2. Centre for Health Research and Development, Faculty of Health and Medical
Sciences, University of Copenhagen, Denmark.
http://curis.ku.dk/ws/files/38142206/Second_generation_plant_clinics_in_Uganda_2010_2011_W
ork_Paper_2.pdf.
Davis, K., Nkonya, E., Kato, E., Mekonnen, D.A., Odendo, M., Miiro, R. and Nkuba, J. (2010). Impact of
Farmer Field Schools on Agricultural Productivity and Poverty in East Africa. IFPRI Discussion
Paper 00992 June 2010.
Development Research and Social Policy Centre Ltd (2013). Final Report of The Uganda Communications
Commission’s 2nd National Electronic Media Performance Study (2012) for Eastern and Northern
Uganda regions. Available at
http://www.ucc.co.ug/files/downloads/NEMPS(N&E)%20final%20report.pdf
Ejeta, G. (2007). The Striga scourge in Africa: a growing pandemic. In: Ejeta G. and Gressel J. (eds).
Integrating New Technologies for Striga Control: Towards ending the witch-hunt. World Scientific
Publishing Co. Pte Ltd, 5 Tol Tuck Link, Singapore, 3-16.
Elliott R. (2015). Top radio stations in Uganda, May-July – Geopoll report: http://blog.geopoll.com/top-
radio-stations-in-uganda-may-july accessed 25 July 2016
FAO (2012). The international code of conduct on pest management (Revised Ed.). Rome: Food and
Agriculture Organisation of the United Nations.
FAO (2014) FAO Statistical Yearbook 2014. [Online] Available at: http://www.fao.org/economic/ess/ess-
publications/ess-yearbook/en/ [Accessed 13 Jan 2015]

Platform for Agricultural Risk Management | Crop pests and disease management in Uganda: status and investment needs
120
Full Report | October 2016
FAO (2014). The International Code of Conduct on Pesticide Management. World Health Organization
Food and Agriculture Organization of the United Nations. 52pp. E-ISBN 978-92-5-108549-3
(PDF).
Ferris, R.S.B., Okoboi, G., Crissman, C., Ewell, P. and Lemaga, G. (2002). Uganda’s Irish Potato
Sector. Report Prepared for the Government of Uganda’s Conference on Competitiveness of
Selected Strategic Exports.
Flood, J. and Brayford, D. (1997). The re-emergence of Fusarium wilt of coffee in Africa. Proceedings of
the International Scientific Colloquium on Coffee (ASIC) Conference. ASIC,Nairobi, Kenya. 9.
Flood, J. and Brayford, D. 1998. Fusarium wilt of coffee in Africa. Proceedings of the 7th
International
Congress of Plant Pathology, Edinburgh.
Gafishi K.M., Karungi, J., Asea, G. and Gibson, P. (2012). Determination of the heterotic groups of maize
inbred lines and the inheritance of their resistance to the maize weevil. African Crop Science
Journal, 20(1): 99-104
Gethi, J.G., Smith, M.E., Mitchell, S.E. and Kresovich, S. (2005). Genetic diversity of Striga hermonthica
and Striga asiatica population in Kenya. Weed Research, 45: 64-73.
Gold, C.S., Kagezi, G.H., Night, G., and Ragama, P.E. (2004). The effects of banana weevil, Cosmopolites
sordidus damage on highland banana growth, yield and stand duration in Uganda. Annals of
Applied Biology, 145 (3): 263–269.
Gold, C.S., Karamura, E.B., Kigundu, A., Bagamba, F. and Abera, M.K. (1999). Geographic shifts in the
highland cooking banana (Musa spp., group AAA-EA production in Uganda. International Journal
of Sustainable Development & World Ecology, 6:45-59.
Gold, C.S., Night G., Ragama, P.E., Kagezi, G.H., Tinzaara, W. and Abera, A.M.K. (2004). Field
distribution of banana weevil (Cosmopolites sordidus (Germar)) adults in cooking banana stands
in Uganda. Insect Science and its Application 24:242–248
GSMA (2009). Women & Mobile: A Global Opportunity A study on the mobile phone gender gap in low and
middle-income countries. 2013. Available from: URL: http://www.gsma.com/
mobilefordevelopment/wp-content/uploads/2013/01/GSMA_Women_and_Mobile-
A_Global_Opportunity.pdf
GSMA (2009). Women & Mobile: A Global Opportunity A study on the mobile phone gender gap in low and
middle-income countries. 2013. Available from: URL:
http://www.gsma.com/mobilefordevelopment/wp-
content/uploads/2013/01/GSMA_Women_and_Mobile-A_Global_Opportunity.pdf [Accessed 1
Aug, 2016]
GSMA (2016). Agricultural Value-Added Services (Agri VAS) Tolkit 2.0 How to design, develop and market
next generation VAS for the rural market. Printed by GSMA head office, London, UK. 98pp
Available from: http://www.gsma.com/mobilefordevelopment/programme/magri/agricultural-value-
added-services-agri-vas-toolkit-2-0
Habarurema, I., Edema, R., Gibson, P., Lamo, J., Asea, G., Sere, Y., Gasore, R. (2013), Population
diversity of rice bacterial leaf blight isolates in Uganda. Asian Journal of Plant Science &
Research, 3(1):1-9
Haggblade, S. and Dewina, R. (2010). Variation in staple food prices: Causes, consequence, and policy
options. COMMESA Policy Seminar, Maputo, Mozambique, 25-26 January 2010
Harris, L.M. Norton, G.W. Rezaul Karim A.N.M., Alwang, J. and Taylor D.B. (2013). Bridging the
Information Gap with Cost-Effective Dissemination Strategies: The Case of Integrated Pest
Management in Bangladesh. Journal of Agricultural and Applied Economics, 45 (4):639–654
Hillocks, R.J. (1992). Fusarium wilt. In: Hillocks RJ (ed) Cotton diseases. CAB International, Wallingford,
pp 127–160
Hillocks, R.J. (2013). A century of cotton research and development in sub-Saharan Africa. Natural
Resources Institute, University of Greenwich, UK, 93 pp.
Horna, D., Kyotalimye, M. and Falck-Zepeda, J. (2009). Cotton Production in Uganda: Would GM
technologies be the Solution? International Association of Agricultural economists Conference,
Beijing, China, August 16-22, 2009

Platform for Agricultural Risk Management | Crop pests and disease management in Uganda: status and investment needs
121
Full Report | October 2016
ICEIDA (2014), Uganda Country Strategy Paper 2014-2017.
http://www.iceida.is/media/pdf/Uganda_CSP_2014-2017.pdf Kroschel, J., Okonya, J.S., Juarez,
H., Forbes, G., Kreuze, J., Beed, F., Blomme, G. and Legg J. (2014). Project Planning Workshop.
Management of critical pests and diseases in RTB crops under changing climates, through risk
assessment, surveillance and modeling.29 - 31 January, 2014, Kabale, Uganda
ICF International (2015) 2008-2013.Demographic and Health Surveys (various) [Datasets]. Calverton,
Maryland
IITA. Banana and Plantain. (2016). Retrieved September, from http://www.iita.org/banana
Isabirye, B.E., Akol, A.M., Muyinza, H., Masembe, C., Rwomushana, I. and Nankinga, C.K. (2016) Fruit Fly
(Diptera: Tephritidae) host status and relative infestation of selected mango cultivars in three agro
ecological zones in Uganda. International Journal of Fruit Science, 16(1):23-41
Jassogne, L., Van Asten, P., Laderach, P. 2012. Impact of climate change on coffee in Uganda. Lessons
from a case study on Arabica coffee in the Rwenzori Mountains. Oxfam Report. Oxford, UK:
Oxfam-UK; Ibadan, Nigeria: International Institute of Tropical Agriculture (IITA).
Kagezi, G.H., Kangire, A., Tushemereirwe, W., Bagamba, F., Kikulwe, E., Muhangi, J., Gold, C.S. and
Ragama, P. (2006). Banana bacterial wilt incidence in Uganda. African Crop Science Journal,
14(2): 83-91
Kagezi, H., Gkucel, P., Egony, P.J., Nakibuule, L., Kobusinge, J., Ahumuza, G., Matovu, R., Nakendo, S.,
Luzinda, H., Musoli, C.P., Kangire, A. and Chesang, B.F. (2014). Impact of the black coffee twig
borer and farmers’ coping mechanisms in Uganda. In: Proceedings of African Crop Science
Conference, Vol. 11. pp. 285 – 292. ISSN 1023-070X/2013
Kagezi, H.G., Kucel, P., Egonyu, P.J., Nakibuule, L., Kobusingye, J., Ahumuza, G., Matovu, R., Nakendo,
S., Luzinda, H., Musoli, C.P.., kangire, A. and Chesanga, B.F. (2013). Impact of the black coffee
twig borer and farmers’ coping mechanisms in Uganda. African Crop Science Conference
Proceedings, 11:285-292
Kaguongo, W., Gildemacher, P., Demo, P., Wagoire, W., Kinyae, P., Andrade, J., Forbes, G., Fuglie, K.
and Thiele, G. (2008) Farmer practices and adoption of improved potato varieties in Kenya and
Uganda. International Potato Center (CIP), Lima, Peru. Social Sciences Working Paper 2008-5.
85p.
Kansiime, K.M., Karanja, D.K. and Chacha, D. (2015). Common Challenges in Promoting Seed
Entrepreneurship in Africa: A Case Study of Tanzania. CAB International (unpublished report).
Karamura D.A., Karamura E.B. and Tinzaara W. (editors) 2012. Banana cultivar names, synonyms and
their usage in Eastern Africa, Bioversity International, Uganda.
Kashaija, I., Speijer, P.R., Gold, C.S. and Gowen, S.R. (1993). Occurrence, distribution and abundance of
plant parasatic nematodes of banana inn Uganda. African Crop Science Journal, 2(1): 99-104
Kaweesi, T., Kawuki, R., Kyaligonza, V., Baguma, Y., Tusiime, G. and Ferguson, M. E. (2014). Field
evaluation of selected cassava genotypes for cassava brown streak disease based on symptom
expression and virus load Virology Journal , 11:216
Kiiza, B., Abele, S., and Kalyebara, R. (2004). Market opportunities for Ugandan banana products:
National, regional and global perspectives, Uganda Journal of Agricultural Sciences, 9:743-749
Kijima, Y. and Sserunkuuma, D. (2013). The adoption of NERICA rice varieties at the initial stage of the
diffusion process in Uganda African Journal of Agricultural and Resource, Economics, 8(1):45-56
Kroschel J., Okonya, J.S. Juarez, H., Forbes, G., Kreuze, J., Beed, F., Blomme, G., and Legg J. (2014)
Management of critical pests and diseases in RTB crops under changing climates, through risk
assessment, surveillance and modeling: RTB Workshop Report, Kabale, Uganda 29-31 Jan 2014.
CGIAR Research Program on Roots, Tubers & Bananas. Available online at: www.rtb.cgiar.org
Kubiriba, J., Karamura, E.B., Jogo, W., Tushemereirwe, W.K. and Tinzaara W. (2012). Community
mobilization: A key to effective control of banana Xanthomonas wilt. Journal of Development and
Agricultural Economics, 4(5): 125-131
Kumakech, A., Acipa, A., Tumwine, V. and Maiteki, G.A. (2013). Knowledge on cassava disease
management: The case of cassava brown streak disease awareness in Northern Uganda. African

Platform for Agricultural Risk Management | Crop pests and disease management in Uganda: status and investment needs
122
Full Report | October 2016
Journal of Plant Science, 7(12):597-601.
Land, T., Hauck, V., Baser, H. 2009. Capacity development: Between planned interventions and emergent
processes. (Policy Management Brief 22). Maastricht: ECDPM.
http://ecdpm.org/publications/capacity-development-planned-interventions-emergent-processes/
Legg, J.P. and Thresh, J.M. (2000). Cassava mosaic virus disease in East Africa: a dynamic disease in a
changing environment. Virus Research, 71 (2000) 135–149
Lemaga, B., Kanzikwera, R.C., Kakuhenzire, R. Hakiza,J.J. and Manzi, G. (2001) The effect of crop
rotation on bacterial wilt incidence and potato tuber yield. African Crop Science Journal, 9, 257–
266
Luzinda, H., Nelima, M., H., Wabomba, A., Kangire, A., Musoli, P.C. and Musebe R. (2015). Farmer
awareness, coping mechanisms and economic implications of coffee leaf rust disease in Uganda.
Uganda Journal of Agricultural Sciences, 16 (2): 207-217
MAAIF (2010). Agriculture Sector Development Strategy and Investment Plan: 2010/11-2014/15. Ministry
of Agriculture, Animal Industry and Fisheries, Entebbe Uganda. July, 2010.
MAAIF (2014). Pest Management Plan. Ministry of Agriculture Animal Industry and Fisheries. Kampala,
Uganda.
MAAIF (2015a). Policy Statement for the Ministry of Agriculture, Animal Industry and Fisheries Votes
010/121/125/142/152/155/160/501-850 for the Financial Year 2015/16.
MAAIF (2015a). Review of the Agriculture Sector Development Strategy and Investment Plan 2010/11 -
2014/15. Pests & Disease Control Thematic Area. Ministry of Agriculture, Animal Industry and
Fisheries, Entebbe Uganda. March 2015.
MAAIF (2015b) Agriculture sector development plan 2014/16-2019/20: The revised/new FIP aligned to
SIP for the agricultural statistics, ICT and agricultural risk management (Draft plan shared with
team confidentially)
Matama-Kauma, T., Schulthess, F., Ogwang, J. A., Mueke, J. M., Omwega, C. O. (2007). Distribution and
relative importance of lepidopteran cereal stemborers and their parasitoids in Uganda.
Phytoparasitica, 35:27-36
Matovu R.J., Kangire A., Phiri N.A., Hakiza G.J., Kagezi G.H. and Musoli P.C., (2013). Ecological factors
influencing incidence and severity of Coffee Leaf Rust and Coffee Berry Disease in major Arabica
coffee growing districts of Uganda. Uganda Journal of Agricultural Sciences, 2013, 14 (1): 87 –
100
MDRAT. 2012. The Status of Maize Lethal Necrosis Disease and General Maize Performance in Kenya.
Multi-Disciplinary Rapid Assessment Team, Ministry of Agriculture, Kenya.
Mukalazi, J., Adipala, E., Sengooba, T., Hakiza, J.J., Olanya, M., Kidanemariam, H.M. (2001). Metalaxyl
resistance, mating type and pathogenicity of Phytophthora infestans in Uganda. Crop Protection,
20(5): 379-388.
Mulema, J.M.K., Adipala, E. and Olanya, O.M. (2005). Significance of tuber blight in late blight epidemics
in Uganda. African Crop Science Society Proceedings, 6:329-334.
Nabbumba R. and Bahiigwa, G. (2003). Agricultural productivity constraints in Uganda: implications for
investment. Economic Policy Research Centre, Research, Series No.31
Nankinga C. and Okasaai, O. (2005). Community approaches used in managing BXW in Uganda. In
Karamura, E., Osiru, M., Blomme, G., Lusty, C. and Picq, C. (Eds). Developing a regional strategy
to address the outbreak of banana Xanthomonas wit in East and Central Africa. Proceedings of
the banana Xanthomonas wilt regional preparedness workshop held in Kampala, Uganda, 14-18
February 2005
Nankinga, C.M., Isabirye, B.E., Muyinza, H., Rwomushana, I., Stevenson, P.C., Mayamba, A., Aool, W.
and Akol, A.M. (2014). Fruit fly infestation in mango: A threat to the Horticultural sector in Uganda.
Uganda Journal of Agricultural Sciences, 15(1):1-14
Nkalubo, S., Melis, R., Laing, M.D. and Opio, F. (2007). Yield loss associated with anthracnose disease on
Uganda market-class dry bean cultivars. African Crop Science Conference Proceedings, 8:869-
874
Nyende P. (2015) Sourcing from smallholders. Case study format. AgriNet Uganda Ltd. Available from:
https://africaagribusinessacademy.files.wordpress.com/2015/11/case-study-agrinet-uganda-ltd.pdf
Ochola D., Issaka S., Rakotomalala M., Pinel-Galzi A., Ndikumana I., Hubert J., Hébrard E., Séré Y.,

Platform for Agricultural Risk Management | Crop pests and disease management in Uganda: status and investment needs
123
Full Report | October 2016
Tusiime G., Fargette D. (2015). Emergence of rice yellow mottle virus in eastern Uganda: Recent
and singular interplay between strains in East Africa and in Madagascar. Virus Research, 195:64-
72.
Ochwo, M.K.N., Kamoun, S., Adipala, E., Rubayihayo, P.R., Lamour, K. and Olanya M. (2002). Genetic
diversity of Phytophthora infestans (Mont.) de Bary in the eastern and eestern Highlands of
Uganda. Journal of Phytopathology, 150:541-524
Okech, S.H.O., Gold, C.S., Abele, S., Nankinga, C.M., Wetala, P.M., van Asten, P. and Nambuye, A. and
Ragama, P. (2004). Agronomic, pests and economic factors influencing sustainability of banana-
coffee systems of Western Uganda and potentials for improvement. Uganda Journal of
Agricultural sciences, 9:415-427
Okoboi, G. (2010). Of what merit is improved inputs use in Uganda’s maize productivity? Joint 3rd
African
Association of Agricultural Economists (AAAE) and 48th
Agricultural Economists Association of
South Africa (AEASA) Conference, Cape Town, South Africa, September 19-23, 2010
Okori, P., Fahleson, J., Rubaihayo, P.R., Adipala, E. and Dixelius, C. (2003). Assessment of genetic
variation among east African cercospora zeae-maydis populations. African Crop Science Journal
11: 75-85.
Olupot J.R, D.S.O. Osiru, J. Oryokot and B. Gebrekidan, 1999. Development of an integrated striga
management strategy for Ugandan conditions. 17th East African Biennial Weed Science
conference proceedings, pp. 131-136.
Onaga, G. and Asea, G. (2016). Occurrence of rice blast (Magnaporthe oryzae) and identification of
potential resistance sources in Uganda. Crop Protection, 80:65-72.
Opio, F., Ugen, M.A., Kyamanywa, S., David, S., Mugisa-Mutetikka, M. (2001): Beans. P.162-191. In J.K.
Mukiibi (ed.) Agriculture in Uganda: Crops II, Fountain Publishers, Kampala.
Osiru, D. 2006. FAO transboundary agro-ecosystem management program (TAMP): A report on
crop/farming systems and PARA. Food and Agriculture Organisation of the United Nations (FAO),
Rome, Italy.
Osiru, S.O. (2014). Climate-smart agriculture report on comprehensive scoping and assessment study in
Uganda
Otim-Nape, G.W. & Zziwa, S. 1990. Cassava as a major staple food crop in Uganda. Working Paper No. 1.
Collaborative study of Cassava in Africa. Namulonge Research station, Kampala, Uganda.
Otim-Nape, G.W. (1980). Cassava Bacterial Blight in Uganda. Tropical Pest Management, 26:3, 274-277,
DOI: 10.1080/09670878009414412
Otim-Nape, G.W. and Sengooba, T. (1980). Cassava Bacterial Blight in Uganda. In Terry E.R., A.K. Oduro
and F. Caveness, (Eds.). Tropical Root Crops. Proceeding, 1st Symposium of the international
society for the Tropical Root Crops, Africa Branch (ISTRC-AB) Ibadan, Nigeria.pp.61-65.
Pamela, P. Mawejje, D. and Ugen, M. (2014). Severity of angular leaf spot and rust diseases on common
beans in Central Uganda. Uganda Journal of Agricultural Sciences, 15:63-72
Paparu, P., Katafiire, M. Mcharo, M. and Ugen, M. 2014. Evaluation of fungicide application rates, spray
schedules and alternative management options for rust and angular leaf spot of snap beans in
Uganda. International Journal of Pest Management 60(1):82-89.
Parizat, R., Hilten, J., Wunderlich, C., Nsibirwa, R. (2011). Ugandan coffee supply chain risk assessment.
Washington D. C; World Bank.
PARM (Platform for Agricultural Risk Management (2015) Agricultural risk assessment study, Uganda
Pastor-Corrales, M.A. (1995). Enfermedades del frijol causadas por hongos. In: Lopez, M.,Fernadez, F.
and Schoonhoven, A. (eds). FRIJOL: Investigacion y Produccion Pp 172-180. PNUD-Centro
Internacional de Agricultura Tropical, (CIAT). Cali, Columbia
Perkins K, Ward D. and Leclair M. (2011) Participatory Radio Campaigns and food security. How radio can
help farmers make informed decisions. African Farm Radio Research Initiatives. Available from:
URL http://bit.ly/farmradioprc
Phiri and Baker (2009)
Phiri, N. and Baker, P. (2009). Coffee wilt in Africa: Final Technical Report of the Regional Coffee Wilt
Programme (2000-2007). 233pp.
Platform for Agricultural Risk Management | Crop pests and disease management in Uganda: status and investment needs
124
Full Report | October 2016
Plan for Modernization of Agriculture (PMA). 2009. Cotton Value Chain Study in Lango and Acholi
Subregions. PMA Secretariat. MAAIF. Kampala.
Plantwise (2016). ICT for Agriculture (ICT4AG) Stakeholders’ Workshop. 7-8th July, July 2016, Protea
Hotel, Kololo, July 2016. Currently internal report
Poushter J and Stewart R. (2016) Smartphone Ownership and Internet Usage Continues to Climb in
Emerging Economies. Pew Research Center, February, 2016 Available from:
http://www.pewglobal.org/2016/02/22/smartphone-ownership-and-internet-usage-continues-to-
climb-in-emerging-economies/ [Accessed 31 July 2016]
Pratt, C.F., Constantine, K.L. and Murphy, S.T (2016). Estimation of the economic impact of invasive alien
species on smallholder livelihoods: the case of mixed maize farming in eastern Africa (In Press)
Roberts, C.; Azzarri, C. (2014) "Uganda Agricultural Snapshot 2009/10," HarvestChoice - International
Food Policy Research Institute (IFPRI).Rutherford, M. A. 2006. Current knowledge of coffee wilt
disease, a major constraint to coffee production in Africa. Phytopathology 96:663-666.
Rukazambuga, N., Gold, C.S. and Gowen, S.R. 1998. Yield loss in East African highland banana (Musa
spp., AAA-EA group) caused by the banana weevil, Cosmopolites sordidus Germar. Crop
Protection 17:581-589.
Rwakakamba, M. (2012). Fixing Uganda's Extension System. Global Forum on Food Security and
Nutrition.Available: http://www.fao.org/fsnforum/forum/have-your-say/fixing-ugandas-extension-
system
Rwakakamba, M. (2012). Fixing Uganda's Extension System. Global Forum on Food Security and
Nutrition.Available: http://www.fao.org/fsnforum/forum/have-your-say/fixing-ugandas-extension-
system
Sabune, J. (2005). The Cotton Sector in Uganda: Progress made and recommendations for achieving
further progress. 64th Plenary Meeting of the IACC, Liverpool, United Kingdom, 25-30 September
2005
Settle, W.; Hama Garba, M. Sustainable crop production intensification in the Senegal and Niger River
Basins of francophone West Africa. International Journal of Agricultural Sustainability, 9: 171–
185.
Settumba, M. (2012). Advances in cassava research in management of Cassava Brown Streak Virus
Disease in Uganda . In: Proceedings of 3rd
RUFORUM Biennial Meeting 24 - 28 September 2012,
Entebbe, Uganda
Silva, M.C., Varzea, V., Guimaraes, L.G., Azinheira, H.G., Fernandez, D., Petitot, A.S., Lashermes, P.,
Nicole, M. and Bertrand, B. (2006). Coffee resistance to the main diseases: Leaf rust and coffee
berry disease. Brazilian Journal of Plant physiology, 18 (1):119-147.
Sones, K.R., Oduor, G.I., Watiti, J.W. and Romney, D. (2015) Communicating with smallholder farming
families - a review with a focus on agro-dealers and youth as intermediaries in sub-Saharan
Africa. CAB Reviews 10(030), 1–6.
Sones, K.R., Oduor, G.I., Watiti, J.W. and Romney, D. (2015) Communicating with smallholder farming
families - a review with a focus on agro-dealers and youth as intermediaries in sub-Saharan
Africa. CAB Reviews 10(030), 1–6.
Soniia D, (2003). Growing beans in the city: a case study in Kampala, Uganda. Network on Bean
Research in Africa, Occasional Publications Series, No. 39. CIAT, Kampala, Uganda
Soniia, D., Kirkby, R. and Kasozi, S. (1997). Assessing the impact of bush bean varieties on poverty
reduction in Sub-Saharan Africa: evidence from Uganda. Occasional Publication Series, N0. 31.
Tumuhaise V., Khamis, F.M., Agona, A., Sseruwu, G. and Mohamed S.A. (2016). First Record of Tuta
absoluta (Lepidoptera: Gelechiidae) in Uganda. International Journal of Tropical Insect Science,
36(3): 135-139
Tushemereirwe W. (1996). Factors influencing expression of leaf spot diseases of highland bananas in
Uganda. PhD Thesis, University of Reading, UK.
Tushemereirwe, W.K. Holderness, M., Gold, C.S. and Deadman, M. (2000). Effects of the leaf spot
complex and leaf pruning on growth and yield in highland banana. Results of the first ratoon crop.
Acta Horticulture, 450:335-341
Tushemereirwe, W.K., Kangire, A., Kubiriba, J. Nakyanzi, M. and Gold, C. S. (2004). Diseases threatening
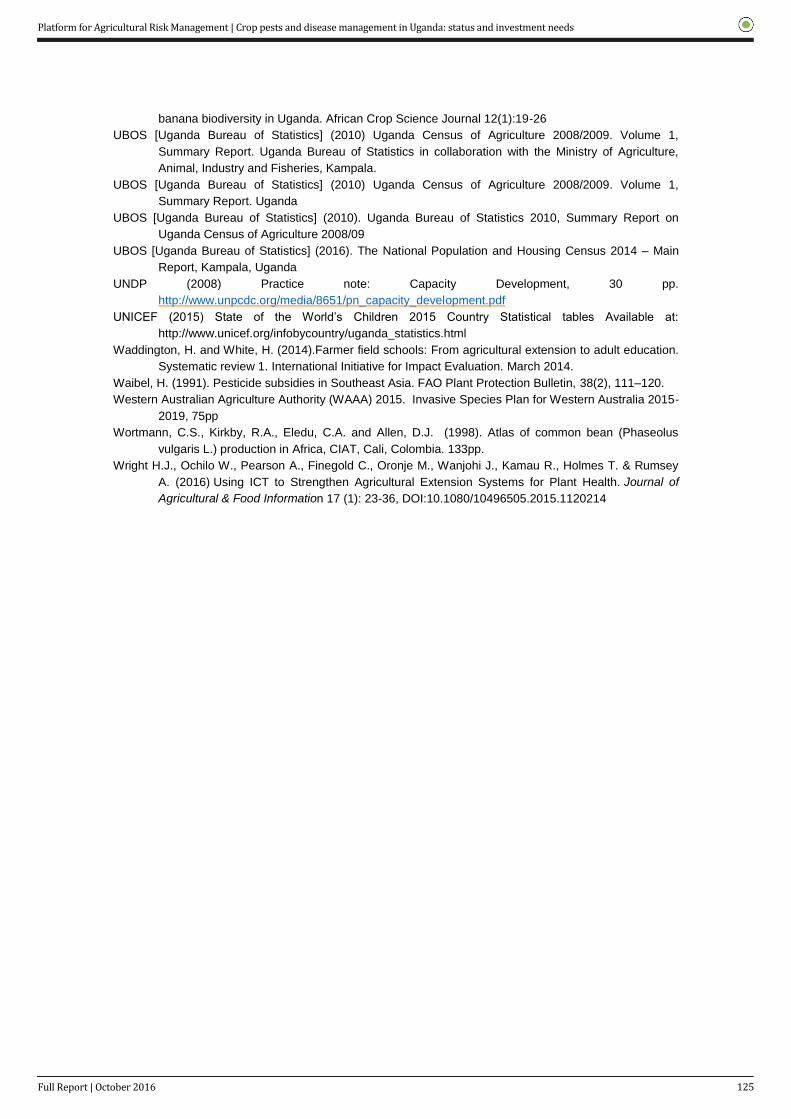
Platform for Agricultural Risk Management | Crop pests and disease management in Uganda: status and investment needs
125
Full Report | October 2016
banana biodiversity in Uganda. African Crop Science Journal 12(1):19-26
UBOS [Uganda Bureau of Statistics] (2010) Uganda Census of Agriculture 2008/2009. Volume 1,
Summary Report. Uganda Bureau of Statistics in collaboration with the Ministry of Agriculture,
Animal, Industry and Fisheries, Kampala.
UBOS [Uganda Bureau of Statistics] (2010) Uganda Census of Agriculture 2008/2009. Volume 1,
Summary Report. Uganda
UBOS [Uganda Bureau of Statistics] (2010). Uganda Bureau of Statistics 2010, Summary Report on
Uganda Census of Agriculture 2008/09
UBOS [Uganda Bureau of Statistics] (2016). The National Population and Housing Census 2014 – Main
Report, Kampala, Uganda
UNDP (2008) Practice note: Capacity Development, 30 pp.
http://www.unpcdc.org/media/8651/pn_capacity_development.pdf
UNICEF (2015) State of the World’s Children 2015 Country Statistical tables Available at:
http://www.unicef.org/infobycountry/uganda_statistics.html
Waddington, H. and White, H. (2014).Farmer field schools: From agricultural extension to adult education.
Systematic review 1. International Initiative for Impact Evaluation. March 2014.
Waibel, H. (1991). Pesticide subsidies in Southeast Asia. FAO Plant Protection Bulletin, 38(2), 111–120.
Western Australian Agriculture Authority (WAAA) 2015. Invasive Species Plan for Western Australia 2015-
2019, 75pp
Wortmann, C.S., Kirkby, R.A., Eledu, C.A. and Allen, D.J. (1998). Atlas of common bean (Phaseolus
vulgaris L.) production in Africa, CIAT, Cali, Colombia. 133pp.
Wright H.J., Ochilo W., Pearson A., Finegold C., Oronje M., Wanjohi J., Kamau R., Holmes T. & Rumsey
A. (2016) Using ICT to Strengthen Agricultural Extension Systems for Plant Health. Journal of
Agricultural & Food Information 17 (1): 23-36, DOI:10.1080/10496505.2015.1120214
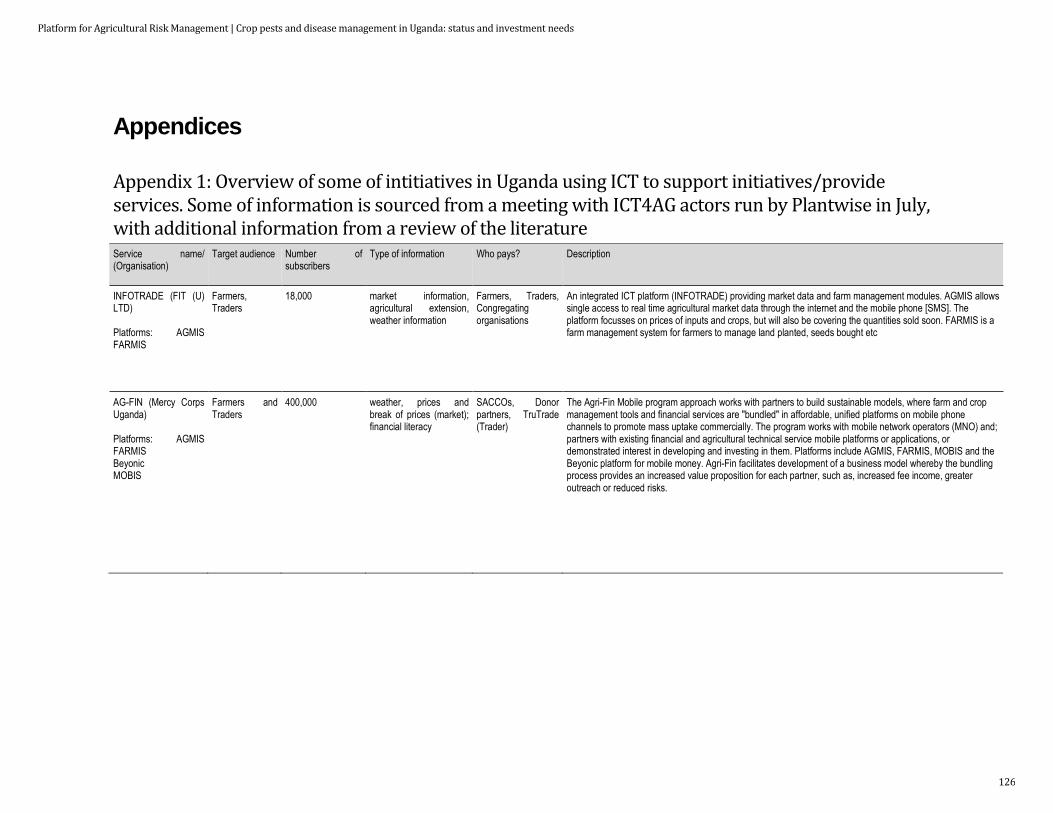
Platform for Agricultural Risk Management | Crop pests and disease management in Uganda: status and investment needs
126
Appendices
Appendix 1: Overview of some of intitiatives in Uganda using ICT to support initiatives/provide services. Some of information is sourced from a meeting with ICT4AG actors run by Plantwise in July, with additional information from a review of the literature Service name/ (Organisation)
Target audience Number of subscribers
Type of information Who pays? Description
INFOTRADE (FIT (U) LTD) Platforms: AGMIS FARMIS
Farmers, Traders
18,000 market information, agricultural extension, weather information
Farmers, Traders, Congregating organisations
An integrated ICT platform (INFOTRADE) providing market data and farm management modules. AGMIS allows single access to real time agricultural market data through the internet and the mobile phone [SMS]. The platform focusses on prices of inputs and crops, but will also be covering the quantities sold soon. FARMIS is a farm management system for farmers to manage land planted, seeds bought etc
AG-FIN (Mercy Corps Uganda) Platforms: AGMIS FARMIS Beyonic MOBIS
Farmers and Traders
400,000 weather, prices and break of prices (market); financial literacy
SACCOs, Donor partners, TruTrade (Trader)
The Agri-Fin Mobile program approach works with partners to build sustainable models, where farm and crop management tools and financial services are "bundled" in affordable, unified platforms on mobile phone channels to promote mass uptake commercially. The program works with mobile network operators (MNO) and; partners with existing financial and agricultural technical service mobile platforms or applications, or demonstrated interest in developing and investing in them. Platforms include AGMIS, FARMIS, MOBIS and the Beyonic platform for mobile money. Agri-Fin facilitates development of a business model whereby the bundling process provides an increased value proposition for each partner, such as, increased fee income, greater outreach or reduced risks.
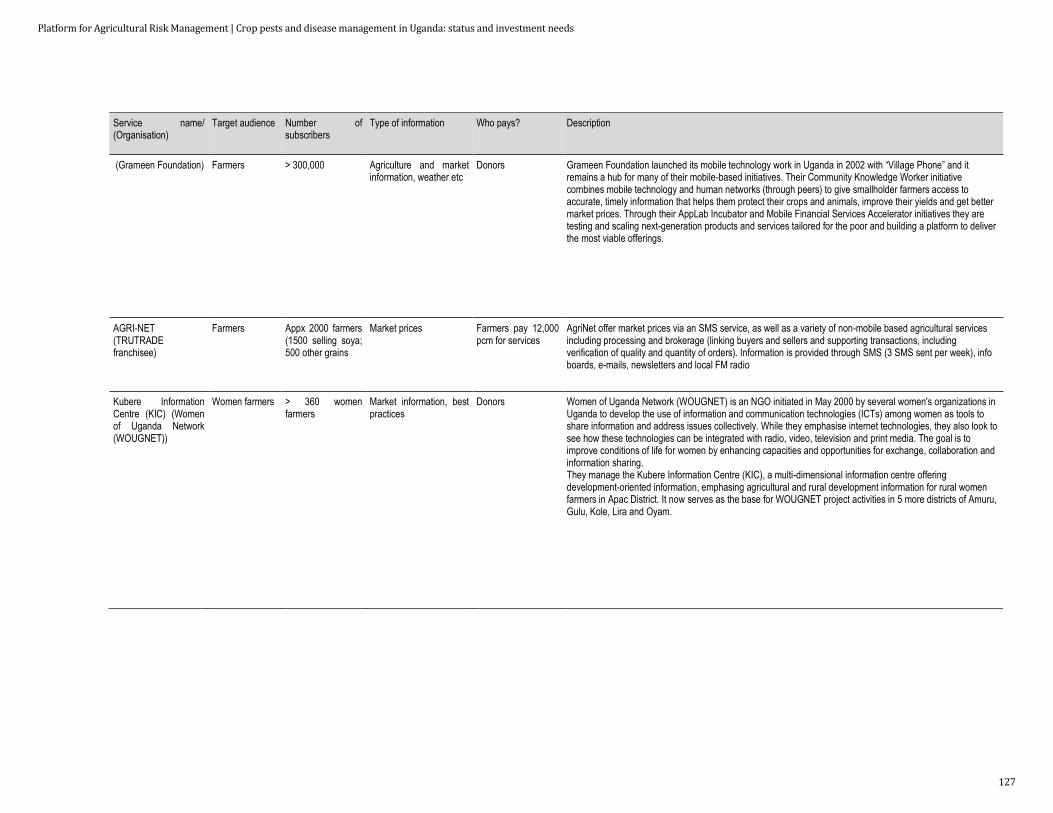
Platform for Agricultural Risk Management | Crop pests and disease management in Uganda: status and investment needs
127
Service name/ (Organisation)
Target audience Number of subscribers
Type of information Who pays? Description
(Grameen Foundation) Farmers > 300,000 Agriculture and market information, weather etc
Donors Grameen Foundation launched its mobile technology work in Uganda in 2002 with “Village Phone” and it remains a hub for many of their mobile-based initiatives. Their Community Knowledge Worker initiative combines mobile technology and human networks (through peers) to give smallholder farmers access to accurate, timely information that helps them protect their crops and animals, improve their yields and get better market prices. Through their AppLab Incubator and Mobile Financial Services Accelerator initiatives they are testing and scaling next-generation products and services tailored for the poor and building a platform to deliver the most viable offerings.
AGRI-NET (TRUTRADE franchisee)
Farmers Appx 2000 farmers (1500 selling soya; 500 other grains
Market prices Farmers pay 12,000 pcm for services
AgriNet offer market prices via an SMS service, as well as a variety of non-mobile based agricultural services including processing and brokerage (linking buyers and sellers and supporting transactions, including verification of quality and quantity of orders). Information is provided through SMS (3 SMS sent per week), info boards, e-mails, newsletters and local FM radio
Kubere Information Centre (KIC) (Women of Uganda Network (WOUGNET))
Women farmers > 360 women farmers
Market information, best practices
Donors Women of Uganda Network (WOUGNET) is an NGO initiated in May 2000 by several women's organizations in Uganda to develop the use of information and communication technologies (ICTs) among women as tools to share information and address issues collectively. While they emphasise internet technologies, they also look to see how these technologies can be integrated with radio, video, television and print media. The goal is to improve conditions of life for women by enhancing capacities and opportunities for exchange, collaboration and information sharing. They manage the Kubere Information Centre (KIC), a multi-dimensional information centre offering development-oriented information, emphasing agricultural and rural development information for rural women farmers in Apac District. It now serves as the base for WOUGNET project activities in 5 more districts of Amuru, Gulu, Kole, Lira and Oyam.

Platform for Agricultural Risk Management | Crop pests and disease management in Uganda: status and investment needs
128
Service name/ (Organisation)
Target audience Number of subscribers
Type of information Who pays? Description
(Beyonic) Farmers, Traders
Partners Mobile money transaction support. Beyonic, which currently operates in Uganda and Kenya, partners with mobile network operators and digital financial service providers to allow businesses to make and track mobile money payments on a single platform regardless of carrier
MOBIS (Ensibuuko) SACCOS Partners Financial record keeping. MOBIS is a robust core-banking software that enables rural-based financial institutions to manage information and reporting; while efficiently delivering financial services on a mobile wallet MOBIS is designed to enable the digitalisation at the SACCO level of their financial record keeping and membership management thereby bringing more transparency and effective management of funds and speedy transactions while putting SACCOs at the same level as regulated banks. Key Features include: - Integrated accounting - Real-time inter-branch connectivity - Mobile VSLA wallet - Enhanced cloud storage and security - SMS alerts and financial literacy content
Platform for Agricultural Risk Management | Crop pests and disease management in Uganda: status and investment needs
129
Service name/ (Organisation)
Target audience Number of subscribers
Type of information Who pays? Description
Gutsinda Development Group
Farmers, Extension workers, cooperatives and partners
6 partners; 14,000 farmers
Agricultural extension, crop conditions
Partners Provide ICT solutions including: e-extension and data collection and saving solutions on the mobile phone. Gutsinda built the Kulima Content Platform to disseminate information and facilitate knowledge transfer. The Kulima application features an agricultural library with information on organic and non-organic farming techniques, across different value chains. The database describes Best Agricultural Practices for production and post-harvest handling, information on common pests and diseases and strategies to combat them, and recommendations based on local knowledge and traditional agricultural practices. The platform integrates image and voice capture to assist in diagnosing problems and explaining practical solutions. Gutsinda works with partners to package information for delivery over mobile phones, using simple language, photos, and other design elements to improve usability. Mobile surveys using a data collection tool are designed with partners to enhance their M&E systems. By pairing technology with a human network of Village Enterprise agents, they help partners extend their reach, increase the frequency of interactions with target groups, and collect insights that allow for mid-course correction. They aim to accelerate partners impact measurement and improve returns on investment.
(FARMGAIN) Farmgain Africa is currently running an agricultural market information service for commodities produced in Uganda and this system is linked to market intelligence networks within the East African region. Farmgain Africa Ltd boasts of ample knowledge and skills in the functioning agro-commodity markets in the region due to its involvement in market information systems

Platform for Agricultural Risk Management | Crop pests and disease management in Uganda: status and investment needs
130
Service name/ (Organisation)
Target audience Number of subscribers
Type of information Who pays? Description
Plantwise (CABI) Extension, farmers
3,500 recorded users – not all use recorded
Mainly on crop pests and diseases but covers any crop any problem
Donor – with local governments and MAAIF taking over responsibility
Plantwise (PW) operates through a network of nationally operated plant clinics, held in public places and managed by Local Government, NGOs and other partners. Trained plant doctors answer farmers questions and give advice. An open access web-based database, the Knowledge Bank, provides access to information on pests and diseases. A factsheet app delivers information to android phones. Use of tablets at clinics to collect data electronically on crop problems brought, diagnosis and recommendation is being introduced
JI Technology Platform “Grains Chain” (Joseph Initiative)
Joseph village agents, farmers
15,000 supplied JI in 2014 with 50,000 expected in 2015
Information on value chain transactions
Costs covered by the business (grain trading)
The customised software ‘Grains Chain’ is designed to run on smartphones and tablets in the field. It allows JI to update prices, track transactions with smallholders, monitor inventory across all 60 Joseph Centres, monitor stocks in the JI processing and storage facility, and quickly compile company reports for analysis. When farmers bring their maize to the Joseph Centre for the first time they are registered in the system on smartphones. The purchase order includes the number of kilograms sold, the moisture content of the maize (as measured with moisture meters on site) and several other data points. The software then calculates how much the farmer should be paid based on the number of bags, the current market price, and the maize quality (particularly relating to a low moisture content).The Joseph Initiative’s supply network is coordinated entirely on the Joseph Initiative Technology Platform. JI is now rapidly integrating advanced management practices including mobile payments, forward contracting capabilities, and biometric identification
FEWSNET National decision makers in Uganda and other African countries
Monitors vegetation condition and rainfall, localized data such as food prices
USAID FtF programme
FEWSNET analysts, working in more than 35 countries, continuously gather evidence of the current food security situation in areas of concern. They collect data from a variety of sources, including US science agencies, national ministries of trade and agriculture, international organizations, and NGOs. NASA and NOAA collect and process satellite data that are used to monitor the vegetation condition (Normalized Difference Vegetation Index, or NDVI) and rainfall (RainFall Estimate, or RFE) across the entire African continent. In Uganda, the focus is on the Karamjoa region. There is collection of data on cross-border trade and informal commodity flows in and out of the country. A paper system is now transferring to an android based system. It is led by Chemonics. All data is open access.
AGINSBA (Makerere University)
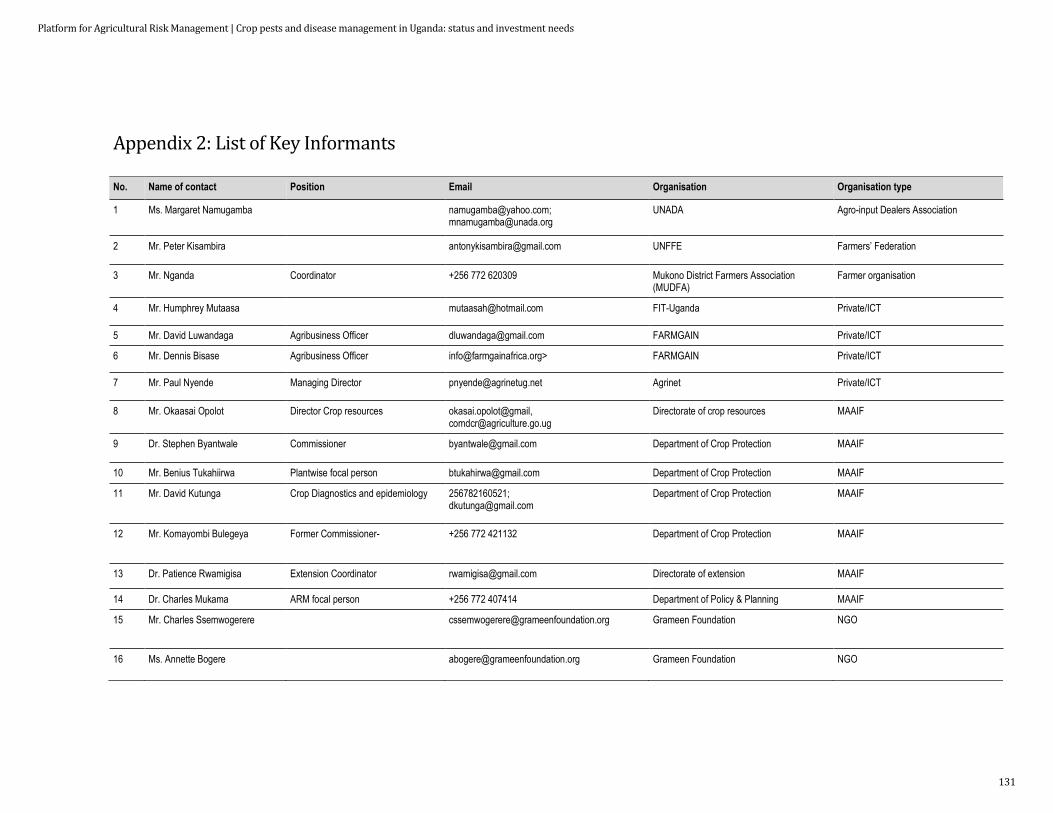
Platform for Agricultural Risk Management | Crop pests and disease management in Uganda: status and investment needs
131
Appendix 2: List of Key Informants No. Name of contact Position Email Organisation Organisation type
1 Ms. Margaret Namugamba [email protected]; [email protected]
UNADA Agro-input Dealers Association
2 Mr. Peter Kisambira [email protected] UNFFE Farmers’ Federation
3 Mr. Nganda Coordinator +256 772 620309 Mukono District Farmers Association (MUDFA)
Farmer organisation
4 Mr. Humphrey Mutaasa [email protected] FIT-Uganda Private/ICT
5 Mr. David Luwandaga Agribusiness Officer [email protected] FARMGAIN Private/ICT
6 Mr. Dennis Bisase Agribusiness Officer [email protected]> FARMGAIN Private/ICT
7 Mr. Paul Nyende Managing Director [email protected] Agrinet Private/ICT
8 Mr. Okaasai Opolot Director Crop resources okasai.opolot@gmail, [email protected]
Directorate of crop resources MAAIF
9 Dr. Stephen Byantwale Commissioner [email protected] Department of Crop Protection MAAIF
10 Mr. Benius Tukahiirwa Plantwise focal person [email protected] Department of Crop Protection MAAIF
11 Mr. David Kutunga Crop Diagnostics and epidemiology 256782160521; [email protected]
Department of Crop Protection MAAIF
12 Mr. Komayombi Bulegeya Former Commissioner- +256 772 421132 Department of Crop Protection MAAIF
13 Dr. Patience Rwamigisa Extension Coordinator [email protected] Directorate of extension MAAIF
14 Dr. Charles Mukama ARM focal person +256 772 407414 Department of Policy & Planning MAAIF
15 Mr. Charles Ssemwogerere [email protected] Grameen Foundation NGO
16 Ms. Annette Bogere [email protected] Grameen Foundation NGO
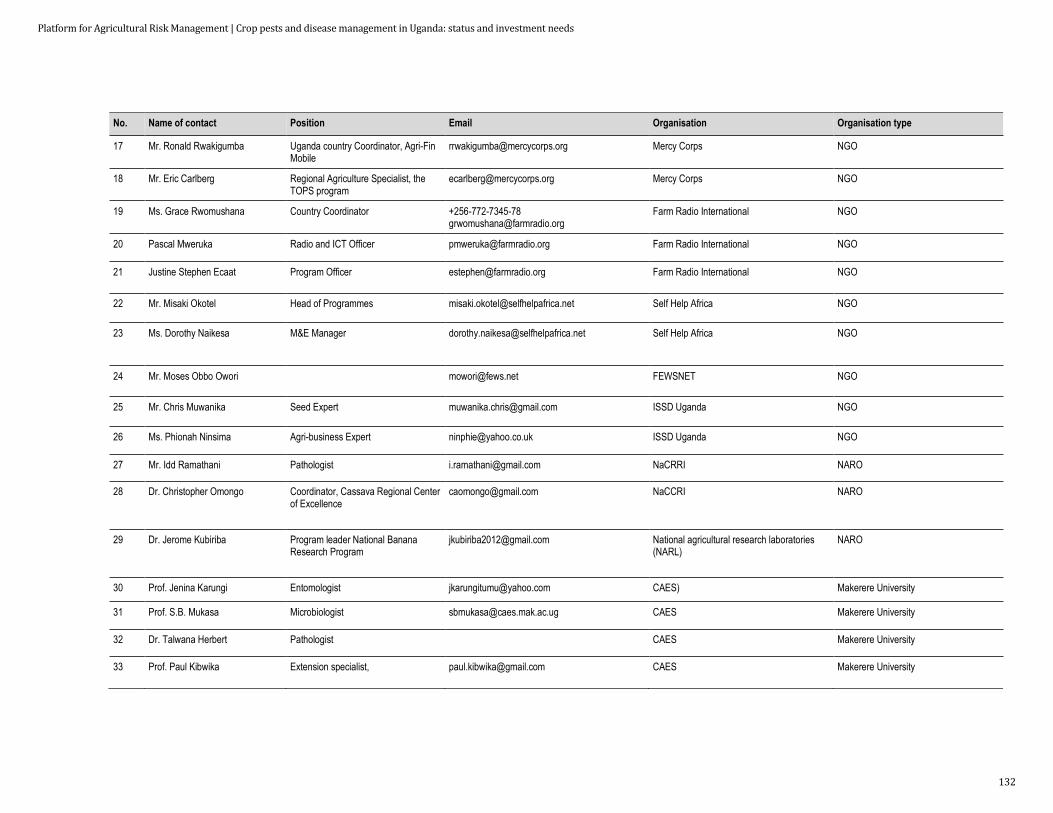
Platform for Agricultural Risk Management | Crop pests and disease management in Uganda: status and investment needs
132
No. Name of contact Position Email Organisation Organisation type
17 Mr. Ronald Rwakigumba Uganda country Coordinator, Agri-Fin Mobile
[email protected] Mercy Corps NGO
18 Mr. Eric Carlberg Regional Agriculture Specialist, the TOPS program
[email protected] Mercy Corps NGO
19 Ms. Grace Rwomushana Country Coordinator
+256-772-7345-78 [email protected]
Farm Radio International NGO
20 Pascal Mweruka Radio and ICT Officer [email protected] Farm Radio International NGO
21 Justine Stephen Ecaat Program Officer [email protected] Farm Radio International NGO
22 Mr. Misaki Okotel Head of Programmes [email protected] Self Help Africa NGO
23 Ms. Dorothy Naikesa M&E Manager [email protected] Self Help Africa NGO
24 Mr. Moses Obbo Owori [email protected] FEWSNET NGO
25 Mr. Chris Muwanika Seed Expert [email protected] ISSD Uganda NGO
26 Ms. Phionah Ninsima Agri-business Expert [email protected] ISSD Uganda NGO
27 Mr. Idd Ramathani Pathologist [email protected] NaCRRI NARO
28 Dr. Christopher Omongo Coordinator, Cassava Regional Center of Excellence
[email protected] NaCCRI NARO
29 Dr. Jerome Kubiriba Program leader National Banana Research Program
[email protected] National agricultural research laboratories (NARL)
NARO
30 Prof. Jenina Karungi Entomologist [email protected] CAES) Makerere University
31 Prof. S.B. Mukasa Microbiologist [email protected] CAES Makerere University
32 Dr. Talwana Herbert Pathologist CAES Makerere University
33 Prof. Paul Kibwika Extension specialist, [email protected] CAES Makerere University

Platform for Agricultural Risk Management | Crop pests and disease management in Uganda: status and investment needs
133
No. Name of contact Position Email Organisation Organisation type
34 Ms Prossy Mutumba Crops Coordinator [email protected] NAADS Quasi-government
35 Mr. Tom Mugisa National focal person PARM
36 Dr. Mukuru District Production and Marketing Officer
+256 772 418384 Mukono district LG
37 Mr. Mabira Stephen DAO +256 772 460235 Mukono district LG
38 Mr. Gideon Badagawa Excecutive director [email protected] Private sector foundation Uganda Private sector
39 Mr. Chris Kaijuka Chairman +256 783 657910 Uganda grain council, National Maize platform
Private sector

Platform for Agricultural Risk Management | Crop pests and disease management in Uganda: status and investment needs
134
Full Report | October 2016
Appendix 3: Crop queries from Ugandan clinics illustrating main crops brought to clinics in different regions and difference between men and women
Crop Women Men Total
Central (2093 queries, 36% women)
Bananas 17.0 19.6 18.8
Cassava 20.9 15.7 17.7
Coffee 9.1 16.7 14.2
Maize 13.4 14.5 14.2
Beans 11.8 5.4 7.6
Groundnut 6.7 3.2 4.4
Tomatoes 2.2 5.5 4.3
East (2536 queries, 18% women)
Citrus 25.2 30.9 29.9
Tomatoes 2.7 10.6 9.1
Groundnuts 17.6 7.2 9.0
Maize 7.3 7.0 7.1
Cassava 7.6 5.4 5.8
Cowpea 6.5 4.6 4.9
Mid-West (372 queries, 39% women)
Cassava 21.7 17.4 18.8
Bananas 13.0 17.4 15.9
Coffee 9.4 15.1 13.7
Mangoes 10.1 10.5 9.9
Maize 10.9 5.9 7.8
Cocoa 4.3 7.3 5.9
South West (269 queries, 33% women)
Coffee 19.0 30.6 26.6
Bananas 16.4 15.7 15.4
Tomatoes 9.3 7.0 7.7
Cassava 10.8 5.7 7.5
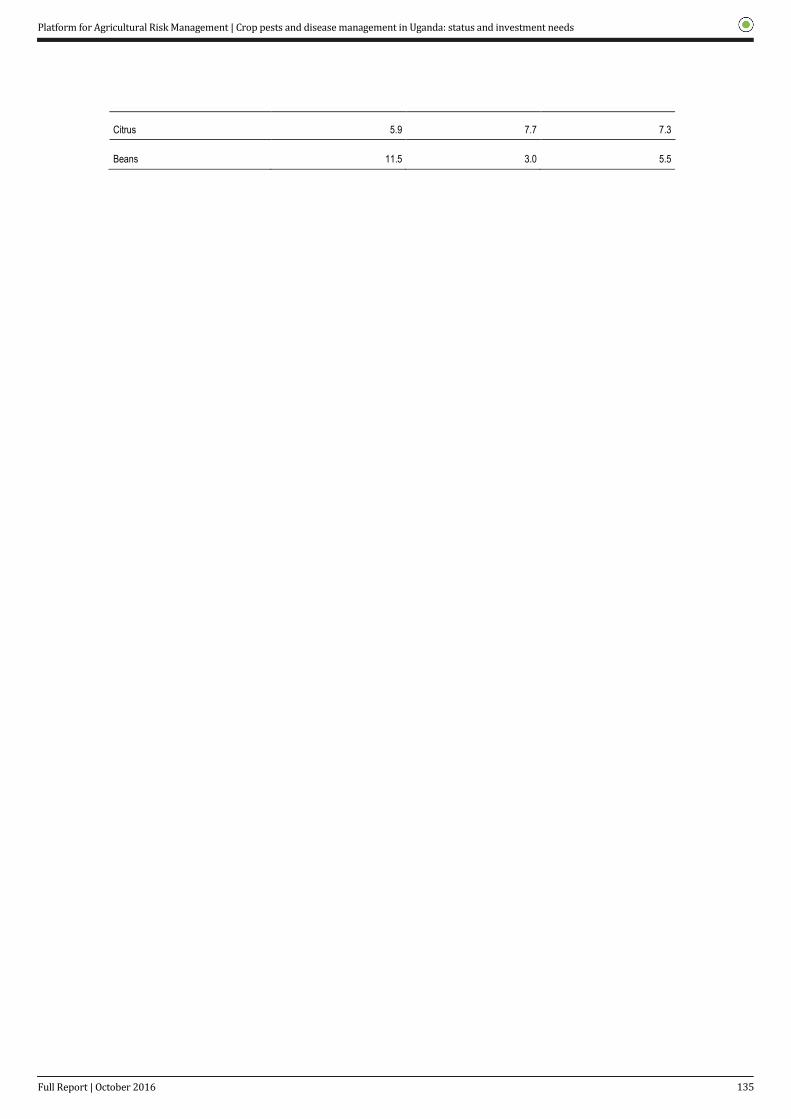
Platform for Agricultural Risk Management | Crop pests and disease management in Uganda: status and investment needs
135
Full Report | October 2016
Citrus 5.9 7.7 7.3
Beans 11.5 3.0 5.5

Platform for Agricultural Risk Management | Crop pests and disease management in Uganda: status and investment needs
136
Full Report | October 2016
Appendix 4: Detailed budget Output Activi
ty Item Y1 Y2 Y3 Y4 Y5 Total
PMP, M&E and reporting
Coordination
PMP Staffing - senior staff 8,000 8,000 8,000 8,000 8,000 40,000
Coordination
PMP Staffing - regular staff 4,000 4,000 4,000 4,000 4,000 20,000
Coordination
PMP Staffing - junior 2,500 2,500 2,500 2,500 2,500 12,500
Coordination
PMP Coordination office set-up
20,000 - 10,000 - - 30,000
Coordination
PMP Coordination travel budget
5,000 5,000 5,000 5,000 5,000 25,000
Coordination
PMP Coordination consumables
2,000 2,000 2,000 2,000 2,000 10,000
Coordination
PMP Vehicles 50,000 50,000 50,000 - - 150,000
Coordination
PMP Running costs 30,000 60,000 90,000 90,000 90,000 360,000
Coordination
M&E Estimate appx 10% of costs for M&E - assuming total of 30 million
800,000 800,000 800,000 800,000 800,000 4,000,000
Outcome 1: Effective pest information system established
Output 1.1 Emergency response plans improved
Output1.1. A1.1.1 Operationalise the plant protection and health technical committee
5,284 5,284 2,642 2,642 2,642 18,494
Output1.1. A1.1.2 Sub-committee to revise and update pest emergency response plans
3,520 3,520 880 880 880 9,680
Output1.1. A1.1.2 Lead plan preparation and prepare reports
12,000 6,000 - - - 18,000
Output1.1. A1.1.3 Develop sector specific prevention strategies
30,200 25,670 12,080 12,080 12,080 92,110
Output1.1. A1.1.3 Lead strategy preparation and prepare reports
60,000 51,000 24,000 24,000 24,000 183,000
Output 1.2 Pest monitoring at border points
Output1.2. A1.2.1 General risk analysis (single study - 30d)
18,000 - - - - 18,000
Output1.2. A1.2.1 Sectoral risk analysis (8 studies - 1 per sector - 30d each)
54,000 54,000 36,000 - - 144,000
Output1.2. A1.2.2.
Recruit 25 new inspectors to be posted at border posts
60,000 100,000 100,000 100,000 100,000 460,000
Output1.2. A1.2.3 Discuss and agree working practices and then review
- 4,860 4,860 - - 9,720
Output1.2. A1.2.3 Develop communication materials
- 10,006 - - - 10,006
Output1.2. A1.2.3 Design specialist - 1,800 - - - 1,800
Output1.2. A1.2.3 Print and distribute materials
- 40,000 - - 40,000 80,000
Output1.2. A1.2.3 Consultants to support border post workshops; lead writeshops; design materials
6,000 18,000 12,000 - - 36,000
Output 1.2 Pest monitoring at border points

Platform for Agricultural Risk Management | Crop pests and disease management in Uganda: status and investment needs
137
Full Report | October 2016
Output Activity
Item Y1 Y2 Y3 Y4 Y5 Total
Output1.3. A1.3.1 Sub-commiteee to oversee development of a pest information system
5,284 5,284 2,642 1,321 1,321 15,852
Output1.3. A1.3.2.
Assume extension staff and CBO/NGO staff in place
- - - - - -
Output1.3. A1.3.2.
Train in module 1 and 2 273,000 273,000 273,000 273,000 273,000 1,365,000
Output1.3. A1.3.2.
Train in MPCP 136,500 136,500 136,500 136,500 136,500 682,500
Output1.3. A1.3.2.
Train in data management
136,500 136,500 136,500 136,500 136,500 682,500
Output1.3. A1.3.2.
Povide basic setup materials (ex tablets)
90,000 60,000 60,000 60,000 90,900 360,900
Output1.3. A1.3.2.
Allowances and travel to run clinic sessions
396,000 660,000 924,000 1,188,000 1,587,960 4,755,960
Output1.3. A1.3.2.
Allowances and travel for DAO to supervise
3,750 6,250 8,750 11,250 15,038 45,038
Output1.3. A1.3.2.
National technical assistance to support and backstop plant doctor training
20,000 20,000 20,000 20,000 20,000 100,000
Output1.3. A1.3.2.
International technical assistance to support and backstop plant doctor training
60,000 60,000 36,000 36,000 24,000 216,000
Output1.3. A1.3.3.
Stakeholder consultations / designand build system
2,800,000 2,800,000 1,400,000 - - 7,000,000
Output1.3. A1.3.3.
Annual system maintenance
- - 700,000 700,000 700,000 2,100,000
Output1.3. A1.3.3.
Stakeholder consultations - travel and allowance
5,000 5,000 5,000 - 5,000 20,000
Output1.3. A1.3.3.
Flights for international consultants (TA embedded in IT build)
8,000 8,000 4,000 - 2,000 22,000
Output1.3. A1.3.3.
Train district (110), ZARDI (9) and DCP staff (10) [Total 129] - 6 workshops of appx 20 people
27,300 27,300 - - - 54,600
Output1.3. A1.3.3.
Validation of data (nos of workshops)
120,000 120,000 120,000 120,000 120,000 600,000
Output1.3. A1.3.4 Collection of 5 million farmer profiles
1,500,000 1,500,000 1,500,000 500,000 - 5,000,000
Output1.3. A1.3.4 Collection of data - using SMS
- 30,000 60,000 90,000 100,000 280,000
Output1.3. A1.3.5 Tablets for 3000 sub-county extension; 500 for district, zonal, DCP staff
220,000 220,000 220,000 110,000 - 770,000
Output1.3. A1.3.5 Airtime and maintenance 120,000 240,000 360,000 420,000 420,000 1,560,000
Output1.3. A1.3.6 Routine surveillance- assume covered
- - - - - -
Output1.3. A1.3.7 Contingency for pest eradication or containment - assume used x1 every 3 years
100,000 - - 100,000 - 200,000
Output1.3. A1.3.7 Contingency for pest management - assume used x1 every 3 years
100,000 - - 100,000 - 200,000
Outcome 2: Effective pest information system established
Output 2.1 Improved farmer awareness
Output2.1. A2.1.1 Establish plant clinics (see 1.3.2)
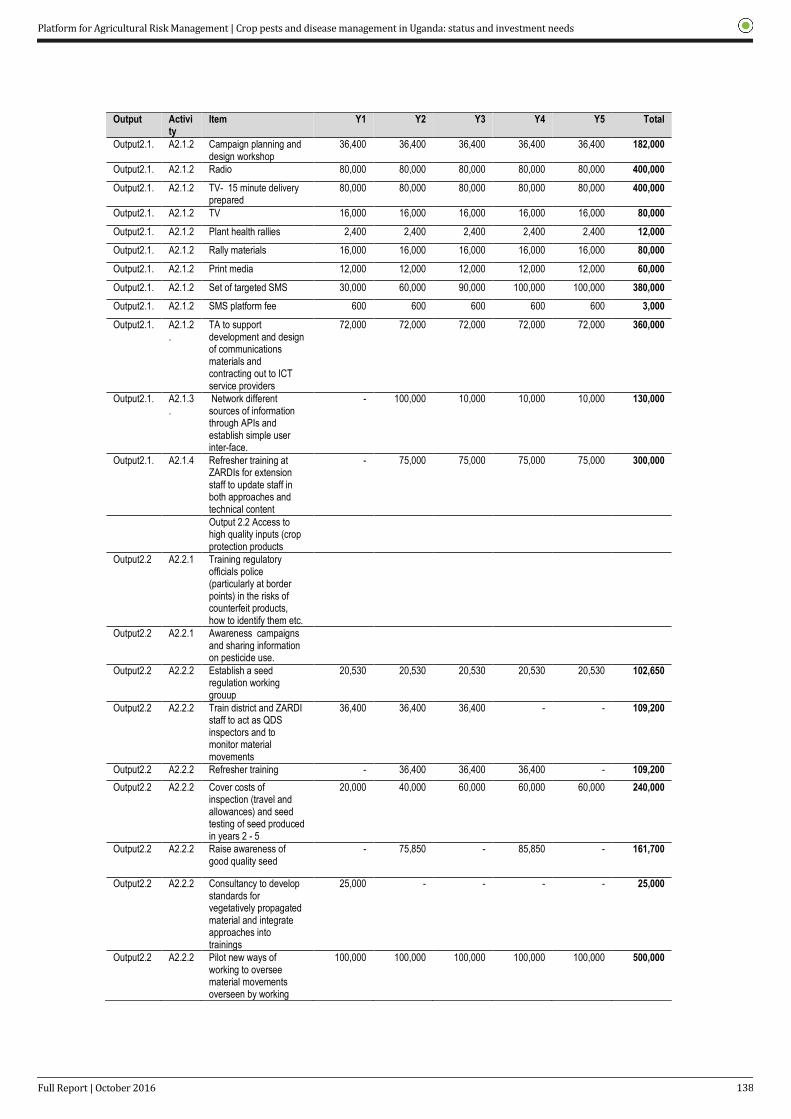
Platform for Agricultural Risk Management | Crop pests and disease management in Uganda: status and investment needs
138
Full Report | October 2016
Output Activity
Item Y1 Y2 Y3 Y4 Y5 Total
Output2.1. A2.1.2 Campaign planning and design workshop
36,400 36,400 36,400 36,400 36,400 182,000
Output2.1. A2.1.2 Radio 80,000 80,000 80,000 80,000 80,000 400,000
Output2.1. A2.1.2 TV- 15 minute delivery prepared
80,000 80,000 80,000 80,000 80,000 400,000
Output2.1. A2.1.2 TV 16,000 16,000 16,000 16,000 16,000 80,000
Output2.1. A2.1.2 Plant health rallies 2,400 2,400 2,400 2,400 2,400 12,000
Output2.1. A2.1.2 Rally materials 16,000 16,000 16,000 16,000 16,000 80,000
Output2.1. A2.1.2 Print media 12,000 12,000 12,000 12,000 12,000 60,000
Output2.1. A2.1.2 Set of targeted SMS 30,000 60,000 90,000 100,000 100,000 380,000
Output2.1. A2.1.2 SMS platform fee 600 600 600 600 600 3,000
Output2.1. A2.1.2.
TA to support development and design of communications materials and contracting out to ICT service providers
72,000 72,000 72,000 72,000 72,000 360,000
Output2.1. A2.1.3.
Network different sources of information through APIs and establish simple user inter-face.
- 100,000 10,000 10,000 10,000 130,000
Output2.1. A2.1.4 Refresher training at ZARDIs for extension staff to update staff in both approaches and technical content
- 75,000 75,000 75,000 75,000 300,000
Output 2.2 Access to high quality inputs (crop protection products
Output2.2 A2.2.1 Training regulatory officials police (particularly at border points) in the risks of counterfeit products, how to identify them etc.
Output2.2 A2.2.1 Awareness campaigns and sharing information on pesticide use.
Output2.2 A2.2.2 Establish a seed regulation working grouup
20,530 20,530 20,530 20,530 20,530 102,650
Output2.2 A2.2.2 Train district and ZARDI staff to act as QDS inspectors and to monitor material movements
36,400 36,400 36,400 - - 109,200
Output2.2 A2.2.2 Refresher training - 36,400 36,400 36,400 - 109,200
Output2.2 A2.2.2 Cover costs of inspection (travel and allowances) and seed testing of seed produced in years 2 - 5
20,000 40,000 60,000 60,000 60,000 240,000
Output2.2 A2.2.2 Raise awareness of good quality seed
- 75,850 - 85,850 - 161,700
Output2.2 A2.2.2 Consultancy to develop standards for vegetatively propagated material and integrate approaches into trainings
25,000 - - - - 25,000
Output2.2 A2.2.2 Pilot new ways of working to oversee material movements overseen by working
100,000 100,000 100,000 100,000 100,000 500,000

Platform for Agricultural Risk Management | Crop pests and disease management in Uganda: status and investment needs
139
Full Report | October 2016
Output Activity
Item Y1 Y2 Y3 Y4 Y5 Total
group
Output2.2 A2.2.2 Seed sampling and testing of distributed materials to monitor change and inform actions
20,000 20,000 20,000 20,000 20,000 100,000
Output2.2 A2.2.2 To backstop and coordinate actions to improve seed regulation
132,000 132,000 132,000 132,000 132,000 660,000
Outcome 3: Capacity to monitor and combat pests and diseases
Output 3.1 Department of Crop Protection structure reviewed and staff trained
Output3.1 A3.1.1 Funds for workshops, travel and allowances for DCP staff to implement tool
5,000 - - - - 5,000
Output3.1 A3.1.1 Consultancy to support DCP in applying IPPC diagnostic tool
6,000 - - - - 6,000
Output3.1 A3.1.2 Develop DCP strategy - consultant support
18,000 - - - - 18,000
Output3.1 A3.1.2 Develop DCP strategy - Travel and allowances for stakeholder consultations
2,000 - - - - 2,000
Output3.1 A3.1.2 Develop DCP strategy - 3 workshops in years 1, 3 and 5
1,510 - 1,510 - 1,510 4,530
Output3.1 A3.1.3 3 new senior posts recruited
24,000 24,000 24,000 24,000 24,000 120,000
Output3.1 A3.1.3 81 staff recruited at inspector level
80,000 240,000 324,000 324,000 324,000 1,292,000
Output3.1 A3.1.4 5-day COPE courses (2-5 people)
38,040 38,040 - - - 76,080
Output3.1 A3.1.4 5-day COPE courses (10 people)
19,260 19,260 - - - 38,520
Output3.1 A3.1.4 4 mo vocational course - 11,360 11,360 11,360 11,360 45,440
Output3.1 A3.1.4 1 mo international training
- 11,140 11,140 - - 22,280
Output3.1 A3.1.4 1 week course delivered locally
- 56,040 28,020 - - 84,060
Output3.1 A3.1.4 10-day COPE course 31,860 31,860 - - - 63,720
Output3.1 A3.1.4 International course/training/study tours
15,780 15,780 15,780 - - 47,340
Output3.1 A3.1.4 Finance course - 21,220 - - - 21,220
Output3.1 A3.1.4 Distance learning and mentoring
- 8,000 - - - 8,000
Output3.1 A3.1.4 TA to support planning and provision of training
66,000 66,000 24,000 24,000 24,000 204,000
Output3.1 A3.1.5 Consultant to advise on process of ISO 17205 accreditation
- 12,000 - - - 12,000
Output3.1 A3.1.5 ISO 17205 accreditation fees
- 1,000 1,000 - - 2,000
Output 3.2 Infrastructure approved
Nos. of DCP staff
Output3.2 A3.2.1 Assess infrastructure needs, develop and oversee implementation
60,000 60,000 36,000 24,000 - 180,000
Output3.2 A3.2.1 Stakeholder workshops and travel
18,200 - - - - 18,200
Output3.2 A3.2.2 Refurbish and equip main lab
210,000 210,000 140,000 - - 560,000

Platform for Agricultural Risk Management | Crop pests and disease management in Uganda: status and investment needs
140
Full Report | October 2016
Output Activity
Item Y1 Y2 Y3 Y4 Y5 Total
Output3.2 A3.2.2 Running costs main lab 30,000 30,000 30,000 30,000 30,000 150,000
Output3.2 A3.2.3 Install secure greenhouses - main lab
- 25,000 50,000 25,000 - 100,000
Output3.2 A3.2.3 Running costs main greenhouses
15,000 15,000 15,000 15,000 15,000 75,000
Output3.2 A3.2.4 Establish small lab facilities at border posts
150,000 150,000 150,000 - - 450,000
Output3.2 A3.2.4 Running costs border post labs
30,000 60,000 90,000 90,000 90,000 360,000
Output3.2 A3.2.6 Refurbish and equip seed testing lab
- 30,000 - - - 30,000
Output3.2 A3.2.6 Refurbish secure greenhouses - seed lab
- 50,000 - - - 50,000
Output3.2 A3.2.6 Running costs seed lab 15,000 15,000 15,000 15,000 15,000 75,000
Output3.2 A3.2.6 Running costs seed greenhouses
15,000 15,000 15,000 15,000 15,000 75,000
Output3.2 A3.2.7 IT equipment for staff - replaced after 3 years
155,000 100,000 152,500 155,000 252,500 815,000
Output3.2 A3.2.7 IT Support per staff member - 1000 pa = including wifi
62,000 102,000 123,000 123,000 123,000 533,000
Output3.2 A3.2.7 Set up networked system
60,000 36,000 24,000 12,000 12,000 144,000
Total 9,118,818 10,024,754 9,307,394 6,896,213 6,493,621 41,840,800

Platform for Agricultural Risk Management | Crop pests and disease management in Uganda: status and investment needs
141
Full Report | October 2016