plastic industry: brazil and us market challenges …
TRANSCRIPT

PLASTIC INDUSTRY: BRAZIL AND US MARKET CHALLENGES AND OPPORTUNITIES
Overview of the Plastic Converting Industry in Brazil

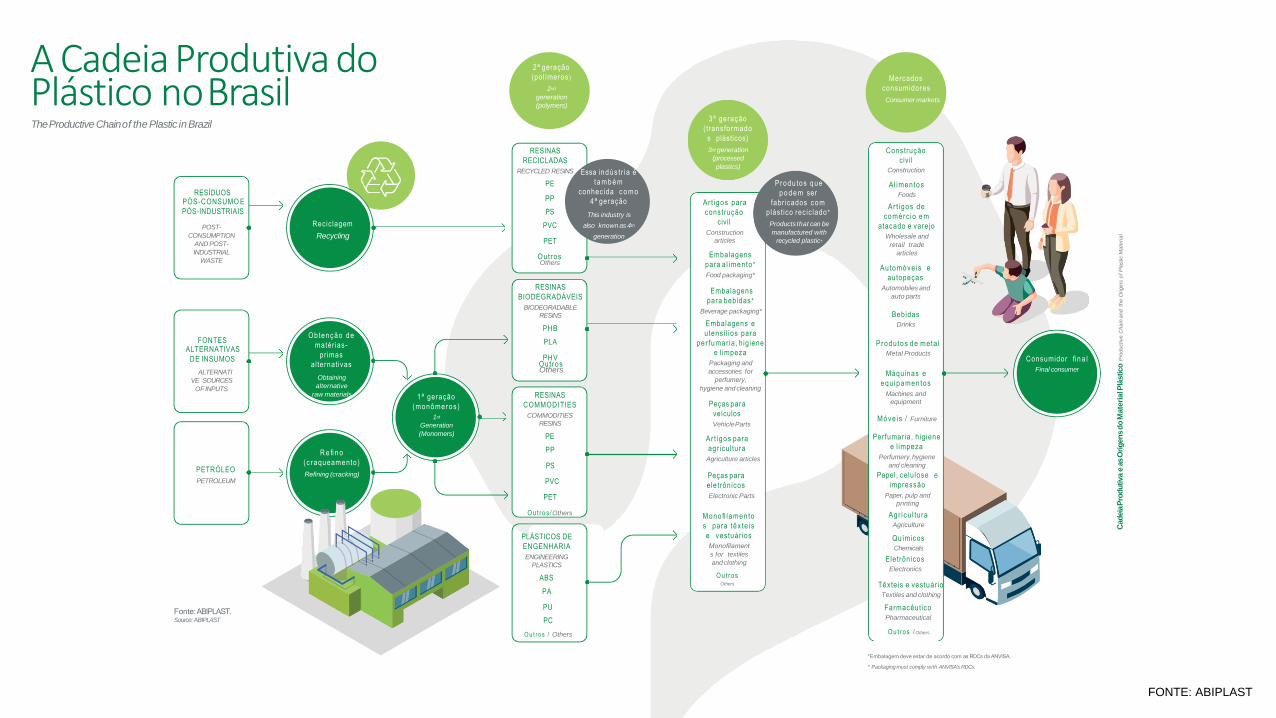
A Cadeia Produtiva do Plástico noBrasilTheProductive Chainof the Plastic inBrazil
Cad
eia
Pro
du
tiva
eas
Ori
gen
sd
oM
ate
rialP
lástico
Pro
du
ctive
Ch
ain
an
dth
eO
rig
ins
of
Pla
stic
Ma
teri
al
RESÍDUOSPÓS-CONSUMO E
PÓS-INDUSTRIAIS
POST-
CONSUMPTION
AND POST-
INDUSTRIAL
WASTE
PETRÓLEO
PETROLEUM
FONTESALTERNATIVAS
DE INSUMOS
ALTERNATI
VE SOURCES
OFINPUTS
Recic lagem
Recycling
RESINAS
RECICLADAS
RECYCLED RESINS
Obtenção de
matér ias-
pr imas
a l ternativas
Obtaining
alternative
raw materials
R e fi n o
( c raqueamento )
Refining (cracking)
PE
PP
PS
PVC
PET
OutrosOthers
Ar t igos para
construção
civil
Construction
articles
Embalagens
para a l imen to *
Food packaging*
Embalagens
para bebidas *
Beverage packaging*
Embalagens e
utensíl ios para
pe r fumar ia , hig iene
e l impeza
Packaging and
accessories for
perfumery,
hygiene and cleaning
Peças para
veículos
VehicleParts
Ar t igos para
agr icultura
Agriculture articles
Peças para
e letrônicos
Electronic Parts
Monofi lamento
s para têx te is
e vestuár ios
Monofilament
s for textiles
andclothing
O u t ro sOthers
Construção
civil
Construction
Al imentos
Foods
Ar t igos de
comérc io e m
atacado e varejo
Wholesale and
retail trade
articles
Automóveis e
autopeças
Automobiles and
auto parts
Bebidas
Drinks
Produ tos d e meta l
Metal Products
Máquinas e
equ ipamentos
Machines and
equipment
Móve is / Furniture
Perfumar ia, hig iene
e l impeza
Perfumery,hygiene
and cleaning
Papel, celulose e
impressão
Paper, pulp and
printing
Agr icu l tu ra
Agriculture
Químicos
Chemicals
Eletrônicos
Electronics
Têxteis e vestuár io
Textiles and clothing
Farmacêutico
Pharmaceutical
RESINAS
BIODEGRADÁVEIS
BIODEGRADABLE
RESINS
PHB
PLA
PHV
RESINAS
COMMODITIES
COMMODITIES
RESINS
PE
PP
PS
PVC
PET
O u t ro s /Others
1ª geração
(monômeros )
1st
Generation
(Monomers)
Consumidor fi n a l
Final consumer
Essa indús t r ia é
t a m b é m
conhecida c o m o
4ª geração
This industry is
also known as 4th
generation
Produ tos que
p o d e m ser
fabr icados com
plástico rec ic lado *
Products that can be
manufactured with
recycled plastic*
2ª geração
(polímeros )
2nd
generation
(polymers)
3ª geração
( transformado
s plásticos)
3rd generation
(processed
plastics)
Mercados
consumidores
Consumer markets
Fonte:ABIPLAST.Source:ABIPLAST
PLÁSTICOS DE
ENGENHARIA
ENGINEERING
PLASTICS
ABS
PA
PU
PC
O ut ros / Others
*Embalagem deve estar de acordo com as RDCs da ANVISA.
* Packaging must comply with ANVISA's RDCs.
FONTE: ABIPLAST
OutrosOthers
O u t ro s / Others

Cad
eia
Pro
du
tiva
eas
Ori
gen
sd
oM
ate
rialP
lástico
Pro
du
ctive
Ch
ain
an
dth
eO
rig
ins
of
Pla
stic
Ma
teri
al
Tendências demercadoMarket trends
•Segundo a McKinsey, em pesquisa divulgada em
maio de 2020, há expectativa de mudanças no com-
portamento do consumo para o “novo normal”,
sendo dois deles o consumo seguro e a sustentabili-
dade redefinida. A pesquisa aponta que a preocupa-
ção com saúde e contaminação deve continuar no
topo de prioridades para os consumidores, além das
máscaras que serão parte do “novo normal” e devem
afetar o uso de algumas categorias. No caso da
sustentabilidade redefinida, verifica-se que 2/3
acham mais importante do que antes limitar impac-
tos de mudanças climáticas e cerca de 60% estão
fazendo mudanças significativas de estilo de vida
para reduzir o impacto no meio ambiente. A poten-
cial implicação, portanto, neste caso, é repensar
como sustentabilidade deve ser incorporada à
proposta de valor de marcas e negócios.
•Segundo a pesquisa “How is COVID-19 Affecting the
Top 10 Global Consumer Trends 2020”, divulgada em
abril de 2020 pela Euromonitor, em um cenário
pré-COVID-19, os consumidores estavam em busca
de produtos com maior vida útil, reduzindo o volume
de resíduos. Palavras como dividir, reutilizar e alugar
estavam emergindo e, por isso, empresas educavam
seus consumidores sobre segurança e opções reutili-
záveis. Por outro lado, com a crise do coronavírus, o
estudo aponta que o foco está em “foco está na
segurança sanitária, em relação a fatores priorizados
anteriormente. No curto prazo, apontou-se que os
consumidores têm mudado seu foco para segurança
e saúde e se preocupado com o tema “contamina-
ção”. No longo prazo, por fim, espera-se um retorno
lento dos produtos reutilizáveis.
•According to McKinsey, in a survey released in May 2020,
changes in consumption behavior are expected for the “new
normal”, two of which are safe consumption and redefined
sustainability. The research points out that the concern with health
and contamination must remain a top priority for consumers, in
addition to the masks that will be part of the "new normal" and
should affect the use of some categories. In the case of defined
sustainability, it appears that 2/3 think it is more important than
before to limit impacts of climate change and about 60% are
making significant lifestyle changes to reduce the impact on the
environment. The potential implication, therefore, in this case, is
how sustainability should be incorporated into the value
proposition of brands and businesses.
Source: “Winning the Recovery: The new consumer COVID post”/ McKinsey
•According to the survey "How is COVID-19 Affecting the Top 10
Global Consumer Trends 2020", released in April 2020 by
Euromonitor, in a pre-COVID-19 scenario, consumers were looking for
products with a longer useful life, reducing the volume of waste.
Words like dividing, reusing and renting were emerging and,
therefore, companies educated their consumers about safety and
reusable options. On the other hand, with the coronavirus crisis, the
study points out that the focus is on health safety in relation to
previously prioritized factors. In the short term, it was pointed out
that consumers have shifted their focus to safety and health and are
concerned with the “contamination” topic. Finally, in the long run, a
slow return of reusable products is expected.
Source: “How is COVID-19 Affecting the Top 10 Global Consumer Trends 2020”/
Euromonitor and “Winning the Recovery: The new consumer COVID”/ McKinsey
Dow
“We believe that the circular economy and recycling will
transform our sector. We are investing and advancing in
mechanical and chemical recycling processes, and we
understand that this movement is also undergoing
improvements in the collection and sorting processes that exist
today. By valuing the actors in this chain, the new plastic
economy is capable of promoting environmental sustainability,
with social impact and value creation.
This is the model that will allow us to solve the current and
future challenges of the chain and the planet, such as climate
change and greenhouse gasemissions”.
Source: Dow Testimony.
Vedacit
“We have seen an increase in the concern of governments,
companies and society with the destination of plastic. Due to
the importance of proper packaging disposal, we believe that
there will be greater movement by the business sector to
increase the circularity of plastic. Through partnerships, there
will be mobilization for the creation of a reverse logistics
structure and for the greater incorporation of recycled resins
in the supply chain”.
Source: VedacitTestimony
Fonte: “How is COVID-19Affecting the Top10 GlobalConsumer
Trends2020”/ Eu romon i to r e “Winn ing t h e Recovery:
O novo consumidor pós COVID” / McKinsey
Acredi tamos que a economia circular
e a reciclagem i rão t ransformar
nosso setor.
Estamos invest indo e avançando
e m processos d e reciclagem mecânica
e química, e en t endemos que este
mov imen t o t a m b é m passa po r
melhor ias nos processos d e coleta
e separação que existem hoje.
A o valorizar os atores desta cadeia,
a nova economia d o plást ico é capaz
d e p romover sustentabi l idade
ambiental , com impacto social e
geração d e valor.
É este o mode lo que nos permi t i rá
solucionar os desafios atuais e f u t u ros
da cadeia e d o planeta, como a
mudança cl imát ica e as emissões de
gases d e e f e i t o estufa” .
“ “
Fon te : Depoimento Dow
(abril de 2020)
Observamos o aum ent o da
preocupação d e governos, empresas
e sociedade com o dest ino d o plástico.
Devido à importância d o descarte
adequado das embalagens,
en t endemos que haverá maior
movimentação d o setor empresarial
para aument a r a circularidade
d o plást ico. At ravés d e parcerias,
haverá mobi l ização para a criação
d e est rutura d e logíst ica reversa
e para a ma io r incorporação de
resinas recicladas pela
cadeia d e fornecimento” .
Fon te : Depoimento Vedacit
(abril de 2020)
FONTE: ABIPLAST

Aplic
ações d
o M
ate
rial P
lástico
Ap
plic
atio
ns o
f P
lastic M
ate
ria
l
Setores consumidores de transformados plásticos emvalorde consumo(2017)
Consumerssectorsof processed plastics– in valueof consumption (2017)
Ciclo longode vida (acimade 5 anos)–49%Longuseful life (over 5 years)– 49%
3,0%
1,0%
0,0% 5,0% 10,0% 20,0%15,0% 25,0%
3,1%
8,1%
0,0%
0,6%
1,8%
4,6%
5,2%
5,6%
8,6%
22,5%
5,0% 15,0%10,0% 20,0% 25,0%
Construção civil Construction
Automóveis e autopeçasAutomobiles and auto parts
Produtos de meta l Metal products
Máquinas e equipamentosMachinery and equipment
Móveis Furniture
Eletrônicos Eletronics
Outros equip. de transporteOther transportequipments
Ciclomédio de vida (entre 1 e 5 anos)–15,2%Average useful life (between 1 and 5 years)–15,2%
Ciclocurtode vida (até 1 ano)–35,8%Shortuseful life (up to 1 year) – 35,8%
0,0%
20,3%
5,0% 10,0% 15,0% 25,0%20,0%
Art igos de comércio em atacado e varejoWholesale and retail goods
AgriculturaAgriculture
Papel, celulose e impressãoPaper, pulp and printing
Têxteis e vestuárioTextiles andclothing
AlimentosFood
BebidasBeverages
6,1%
P e r f u m a r i a , h i g i e n e e l i m p e z aToiletry, hygiene and cleaning products
3 ,3%
QuímicosChemicals
DescartáveisDisposable
Farmacê u t i coPharmaceutical
2 ,7%
2,5%
0,9%
FONTE: ABIPLAST

Extrusão:Consiste em forçar a passagem controlada do
material plástico fundido através de um cilindro e na
sua saída, o material é comprimido em uma matriz
com a forma desejada do produto. Por meio desse
processo são fabricados, por exemplo, chapas, perfis
ou filmes, para posterior acabamento.
Aplic
ações d
o M
ate
rial P
lástico
Ap
plic
atio
ns o
f P
lastic M
ate
ria
l
Extrusion: Consists of forcing the controlled passage of the
cast plastic material through a cylinder and upon its exit, the
material is compressed in a matrix into the desired shape of the
product. This process is used to make, for instance, sheets, profiles,
of films for later finish.
Fi lms extrusion: Produces very fine, mono and multilayer films that
will be later used to make flexible packanging.
Profiles extrusion: Used to make pipes, coated cables, wires, and
hoses for civil construction.
Monofilam ent s extrusion: To make contínuos and fine filaments,
such as fishing lines, brush and broom bristles, and when braided
they originate products such as ropes, cables, fishing nets, screens
in general, etc. Fibres for the textile industry can also be made.
Sheets extrusion: Used to make sheets and plates that will be used as
input for the production of thermoformed packaging and White
line accessories, such as refrigerators and microwave ovens.
Blow moulding: Consists in the extrusion of a “house” commonly
known as parison wich is inserted into a mould and by compressed
air injected inside
forms a hollow product. It is the process used to make bottles,
gallons, packaging for foods, cosmetics, cleaning products, and
automotive tanks.
Injection: This process gives very specific details to the
products such as threads, holes, and perfect fitting, and is very
much used in the auto parts industry (such as car dashboards)
making intermediate products that serve as inputs for the
automotive industry and also to produce household items
intended for the end consumer.
Rotational moulding: Use to make hollow products such as toy
pieces (doll heads and parts) or large parts such as agricultural
machine and water tanks. Vacuum thermoforming: Process to
mould parts by using plates os sheets (made by extrusion).
Consists of heating the sheet wich receives vacum to remove
the air caught between the sheet and the mould to enable the
forming of the final part. This technique is used to manufacture
products such as disposable utensils, trays,autoparts, etc.
Other process: The blown injection is a variation very much used
to make PET bottles, combining both injection (pre-mould) and
blown (PET bottles) processes in the same machine.
Processosprodutivospara fabricação de transformadosplásticosProductive processesfor manufacturing processed plastics
Extrusão sopro: Consiste na extrusão de uma “man-
gueira” comumente chamada de parison que é
inserida em um molde e com a injeção de ar compri-
mido em seu interior forma um produto oco. É o
processo utilizado na fabricação de garrafas, garra-
fões, frascos para alimentos, cosméticos, produtos
de limpeza e tanques automotivos.
Extrusão de per fi l : Utilizada para a fabricação de
tubos, cabos revestidos, fios e mangueiras para a
construção civil.
Extrusão de m onofi lam en tos : Para fabricação de
filamentos contínuos e finos, como linhas de pesca,
cerdas para escovas e vassouras e quando tramados
originam produtos como cordas, cabos, redes de
pesca, telas em geral, etc. Existe ainda a fabricação
de fibras para a indústria têxtil.
Extrusão de chapas: Utilizada para a fabricação das
chapas e lâminas que serão insumos para a produção
de embalagens termoformadas e acessórios de linha
branca, como geladeiras e micro-ondas.
Extrusão de fi lmes : Produz filmes, películas muito
finas, mono e multicamadas que serão utilizados
para posterior confecção de embalagens flexíveis.
Injeção:Esse processo confere detalhes muito específicos
aos produtos como roscas, furos e encaixes perfei-
tos sendo muito utilizado na indústria de autopeças
(como painéis de carros) fabricando produtos
intermediários que servem como insumos para a
indústria automotiva e também na produção de
utilidades domésticas que se destinam ao consumi-
dor final.
Rotomoldagem:Utilizada para a fabricação de produtos ocos como
peças de brinquedos (cabeças e partes de bonecas)
ou peças de grandes dimensões como tanques para
máquinas agrícolas e caixas d’água.
Termoformação a vácuo:Processo de moldagem de peças a partir de lamina-
dos ou chapas (obtidos por extrusão). Consiste no
aquecimento da chapa sendo essa submetida ao
vácuo o qual elimina o ar existente entre a chapa e o
molde permitindo a formação da peça final. Com
esta técnica são fabricados produtos como utensí-
lios descartáveis, bandejas, autopeças, etc.
Outros processos:Uma variação muito utilizada para a fabricação dos
frascos em PET é a injeção sopro, que combina em
uma mesma máquina os dois processos de injeção
(pré-forma) e sopro (frasco ou garrafa).
Injeção
Injection
32,9%
Rotomoldagem
Rotational moulding
0,5%
Extrusão
Extrusion
65,9%
Termoformação a vácuo
Vacuum thermoforming
0,7%
Extrusão de chapas
Sheets extrusion
23%
Extrusão de filmes
Films extrusion
47%
Extrusão sopro
Blow moulding
13%
Extrusão de perfis
Profiles extrusion
15%
Extrusão de monofilamen tos
Monofilaments extrusion
1%
Fontes: Pesquisa Industrial Anual – Produto 2016 e
Pesquisa Industrial Mensal – Produção Física.
Elaboração ABIPLAST.
Sources: Annual Industrial Survey - Product 2016and Monthly Industrial Survey- Physical Production.
Prepared by: ABIPLAST
6PERFIL 2019 |ABIPLAST
FONTE: ABIPLAST

A In
dú
str
ia d
e T
ransfo
rmados P
lásticos n
o B
rasil
Th
e P
rocessed P
lastics In
du
str
y i
n B
razil
Tota l de
Empregos: 314.784Total of Jobs
Tota l de
Empresas: 11.018Total of Companies
52
Pará
957
M a t o Grosso
Goiás
Paraná
Rio Grande d o Sul
0 a 49 50 a 199 200 a 499 500 a 999 >1000
Sources: RAIS, Caged/Ministry of Economy, Monthly Industrial Survey – Physical
Production and Annual Industrial Survey– Company/IBGE. Preparedby ABIPLAST.
F o n te s : RAIS, C a g e d / M in i s té r io d a E co n o mia , Pesqu isa In d u s t r i a l
M e n sa l – P ro d u çã o Física e Pesqu isa In d u s t r i a l A n u a l – E m p re sa /
IBGE. E laboração: ABIPLAST.
Localizaçãode empresase empregosno setor de transformadosplásticosno Brasil, por Estado.Empresas(2018), Empregos(2019)Location of companiesand jobs of the processed plastics sector, by Sate.Companies (2018), Jobs(2019)
1
Rora ima
2
113
Amazonas
7.765
7
Acre
106
24
Rondôn ia
274
601.703
2824.824
M a t o Grosso d o Sul
1.921 56
92623.721
1.18726.470
1.001
Santa Cata r ina
38.778
4.693
São Pau lo
136.287
79020.346
90
M i nas Gera is
2.903
D i s t r i t o Federa l
59617
Espí r i t o S an t o
Alagoas
773.515
Pernambuco
2729.879
Ceará
2193.823
Piauí
26287
Maranhão
23308
Tocan t ins
1175
Rio Grande d o N o r te
1.244 69
Paraiba
1102.692
Serg ipe
33857Bahia
31811.016
Rio d e Jane i ro
14.414 519
7PERFIL 2019 |ABIPLASTPROFILE 2019 | ABIPLAST
Indústria de transformados plásticos no Brasil
FONTE: ABIPLAST
A In
dú
str
ia d
e T
ransfo
rmados P
lásticos n
o B
rasil
Th
e P
rocessed P
lastics In
du
str
y i
n B
razil
2019Empregos
2019 Jobs
Participação noBrasil
Participation on
Brazil
Part i c ipação
n o Brasi l
Participation on
Brazil
UF
State
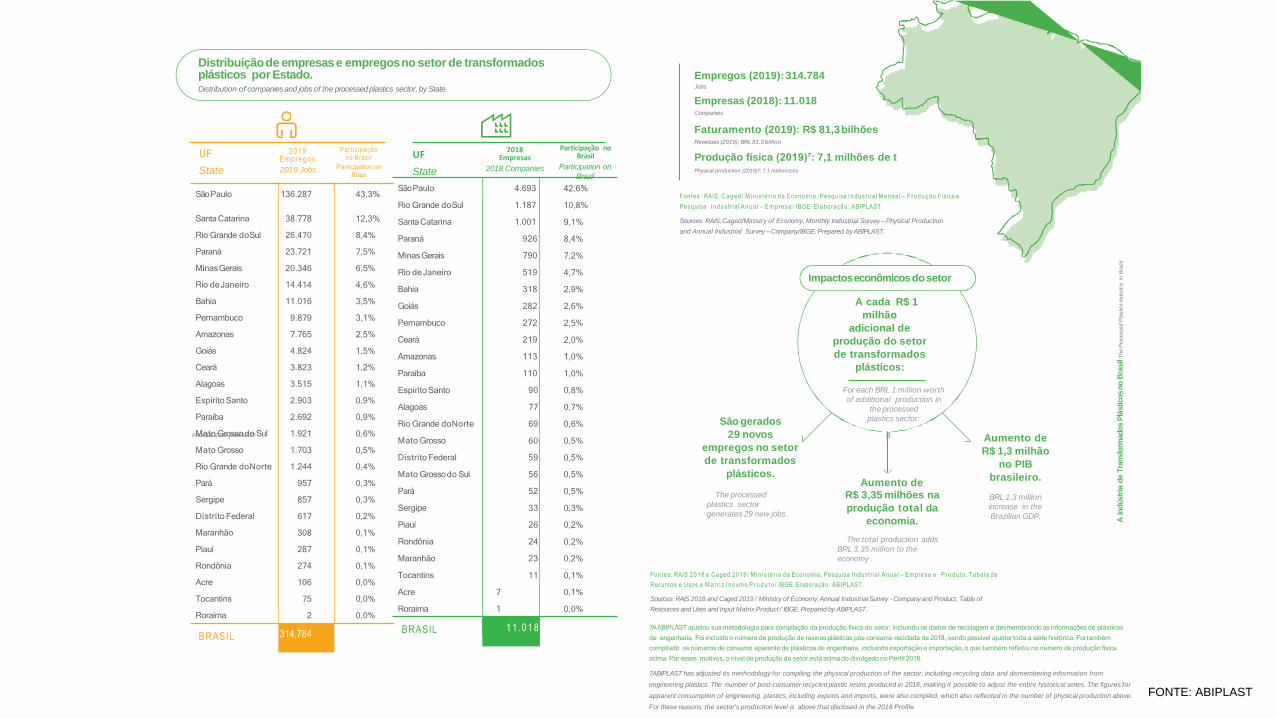
SãoPaulo 4.693 42,6%
Rio Grande doSul 1.187 10,8%
SantaCatarina 1.001 9,1%
Paraná 926 8,4%
MinasGerais 790 7,2%
Rio deJaneiro 519 4,7%
Bahia 318 2,9%
Goiás 282 2,6%
Pernambuco 272 2,5%
Ceará 219 2,0%
Amazonas 113 1,0%
Paraíba 110 1,0%
Espírito Santo 90 0,8%
Alagoas 77 0,7%
Rio Grande doNorte 69 0,6%
Mato Grosso 60 0,5%
Distrito Federal 59 0,5%
Mato Grossodo Sul 56 0,5%
Pará 52 0,5%
Sergipe 33 0,3%
Piauí 26 0,2%
Rondônia 24 0,2%
Maranhão 23 0,2%
Tocantins 11 0,1%
Acre 7 0,1%
Roraima 1 0,0%
BRASIL 11 .018
SãoPaulo 136.287 43,3%
SantaCatarina 38.778 12,3%
Rio Grande doSul 26.470 8,4%
Paraná 23.721 7,5%
MinasGerais 20.346 6,5%
Rio deJaneiro 14.414 4,6%
Bahia 11.016 3,5%
Pernambuco 9.879 3,1%
Amazonas 7.765 2,5%
Goiás 4.824 1,5%
Ceará 3.823 1,2%
Alagoas 3.515 1,1%
Espírito Santo 2.903 0,9%
Paraíba 2.692 0,9%
Mato Grossodo Sul 1.921 0,6%
Mato Grosso 1.703 0,5%
Rio Grande doNorte 1.244 0,4%
Pará 957 0,3%
Sergipe 857 0,3%
Distrito Federal 617 0,2%
Maranhão 308 0,1%
Piauí 287 0,1%
Rondônia 274 0,1%
Acre 106 0,0%
Tocantins 75 0,0%
Roraima 2 0,0%
BRASIL 314.784
UF
State
2018Empresas
2018 Companies
Faturamento (2019): R$ 81,3bilhõesRevenues (2019): BRL 81.3 billion
Empregos (2019): 314.784Jobs
Empresas (2018): 11.018Companies
Produção física (2019)⁷: 7,1 milhões de tPhysical production (2019)7: 7.1 milliontons
For each BRL 1 million worth
of additional production in
the processed
plastics sector:
Aumento deR$ 3,35 milhões na
produção total da
economia.
The total production adds
BRL 3.35 million to the
economy .
São gerados
29 novos
empregos no setor
de transformados
plásticos.
The processed
plastics sector
generates 29 new jobs.
Aumento de
R$ 1,3 milhão
no PIB
brasileiro.
BRL 1.3 million
increase in the
Brazilian GDP.
Distribuiçãode empresase empregosno setor de transformadosplásticos por Estado.Distribution of companiesand jobs of the processed plastics sector, by State.
Fontes: RAIS, C aged / M i n i s té r i o d a Economia, Pesquisa I ndust r ia l M ensa l – P rodução Física e
Pesquisa I ndust r ia l A nua l – E m presa / IBGE. Elaboração: ABIPLAST.
Sources: RAIS, Caged/Ministry of Economy, Monthly Industrial Survey – Physical Production
and Annual Industrial Survey – Company/IBGE. Prepared byABIPLAST.
Fontes: RAIS 2 0 1 8 e Caged 2 0 1 9 / M i n i s té r io d a Economia, Pesquisa Indust r ia l A nua l – Empresa e P rodu t o, Tabela d e
Recursos e Usos e M a t r i z I nsumo P r o d u t o / IBGE. Elaboração: ABIPLAST.
Sources: RAIS 2018 and Caged 2019 / Ministry of Economy,Annual Industrial Survey - Companyand Product, Table of
Resources and Uses and Input Matrix Product / IBGE. Prepared by ABIPLAST.
7A ABIPLAST ajustou sua metodologia para compilação da produção física do setor, incluindo os dados de reciclagem e desmembrando as informações de plásticos
de engenharia. Foi incluído o número de produção de resinas plásticas pós-consumo reciclada de 2018, sendo possível ajustar toda a série histórica. Foi também
compilado os números de consumo aparente de plásticos de engenharia, incluindo exportação e importação, o que também refletiu no número de produção física
acima. Por esses motivos, o nível de produção do setor está acima do divulgado no Perfil 2018.
7ABIPLAST has adjusted its methodology for compiling the physical production of the sector, including recycling data and dismembering information from
engineering plastics. The number of post-consumer recycled plastic resins produced in 2018, making it possible to adjust the entire historical series. The figures for
apparent consumption of engineering plastics, including exports and imports, were also compiled, which also reflected in the number of physical production above.
For these reasons, the sector's production level is above that disclosed in the 2018 Profile.
Impactoseconômicosdosetor
A cada R$ 1
milhão
adicional de
produção do setor
de transformados
plásticos:
8PERFIL 2019 |ABIPLASTPROFILE 2019 | ABIPLAST
FONTE: ABIPLAST
AIn
dú
str
iad
aR
ecic
lagem
de
Mate
rialP
lástico
Pós-c
onsum
on
oB
rasil
Th
eP
ost-
co
nsu
me
rP
lastic
Re
cyclin
gIn
du
str
yin
Bra
zil
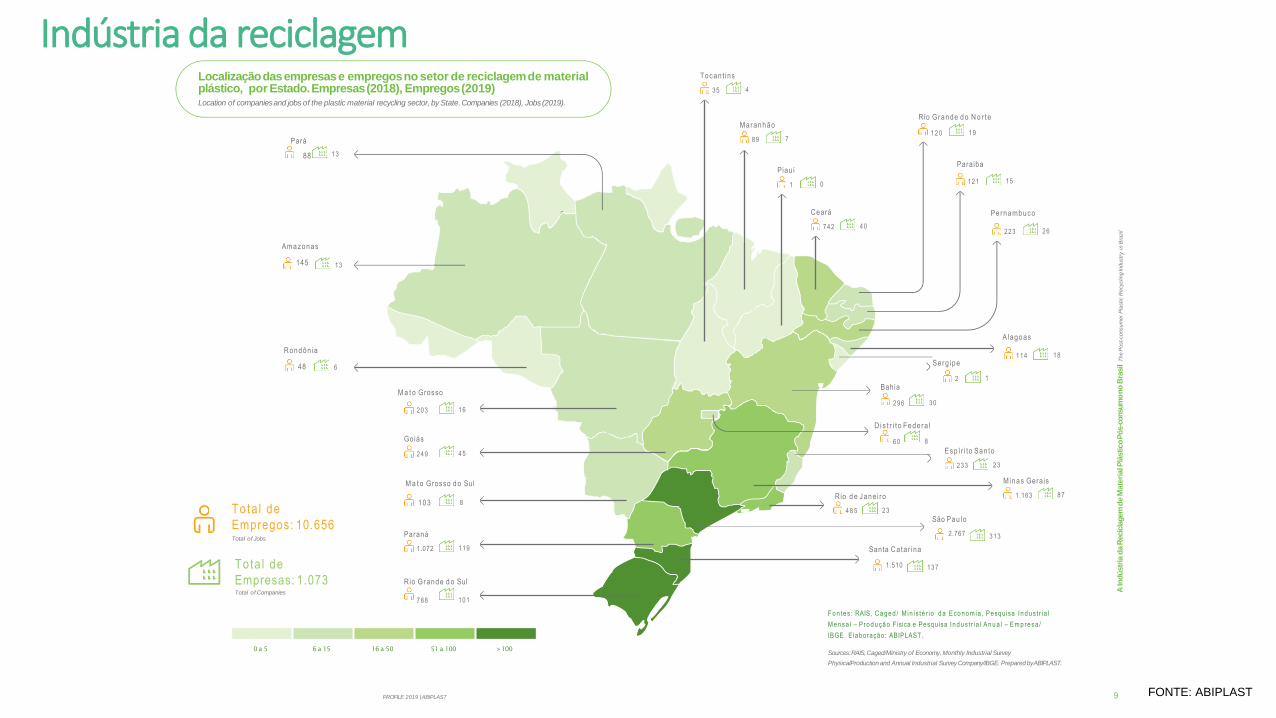
Tota l de
Empregos: 10.656Total of Jobs
Tota l de
Empresas: 1.073Total of Companies
13
Pará
88
M a t o Grosso
Goiás
Paraná
Minas Gerais
Localizaçãodasempresase empregosno setor de reciclagemde materialplástico, por Estado.Empresas(2018), Empregos(2019)Location of companiesand jobs of the plastic material recycling sector, by State.Companies (2018), Jobs(2019).
13
Amazonas
145
6
Rondôn ia
48
16203
45249
M a t o Grosso d o Sul
103 8
1191.072
Rio Grande d o Sul
788 101
137
Santa Cata r ina
1.510
313
São Pau lo
2.767
871.163
Espír i to San to
23233
Alagoas
18114
Pernambuco
26223
Ceará
40742
Piauí
01
Maranhão
789
Tocan t ins
435
Rio Grande d o N o r te
1 2 0 19
Paraiba
15121
Serg ipe
12
Bahia
296 30
D i s t r i t o Federa l
60 8
Rio d e Jane i ro
4 8 5 23
0 a 5 6 a 15 16 a 50 51 a 100 >100Sources:RAIS,Caged/Ministry of Economy, Monthly Industrial Survey
PhysicalProduction and Annual Industrial Survey Company/IBGE. Prepared byABIPLAST.
9PERFIL 2019 |ABIPLAST PROFILE 2019 | ABIPLAST
F o n te s : RAIS, C a g e d / M in i s té r io d a E co n o mia , Pesqu isa In d u s t r i a l
M e n sa l – P ro d u çã o Física e Pesqu isa In d u s t r i a l A n u a l – E m p re sa /
IBGE E laboração: ABIPLAST.
Indústria da reciclagem
FONTE: ABIPLAST

Resumo da cadeia produtiva doplástico
Summaryof the plasticproductivechain in Brazil
Principais resinas
consumidas
Main resinsconsumed
PP | 21,0%
PVC | 13,6%
PEAD | 12,7%
HDPE
PEBDL | 11,9%
LLDPE
Plásticos
reciclados (2018) | 10,6%
Recycled plastics (2018)
PEBD | 8,8%
LDPE
Plásticos de
engenharia | 6,9%
Engineeringplastics
PS | 6,0%
PET | 5,4%
EPS | 2,1%
EVA | 1,0%
Construção civil | 22,5%
Construction
Alimentos |20,3%
Food
Automóveis e autopeças | 8,6%
Vehicles and parts
Artigos decomércio em
atacado e varejo 8,1%
Wholesale and retailgoods
Bebidas |6,1%
Beverages
Produtosde metal | 5,6%
Metal products
Máquinas e equipamentos| 5,2%
Machinery and equipment
Móveis4,6%
Furniture
Perfumaria, higiene e limpeza | 3,3%
Perfumary, toiletryand cosmetics
Agricultura |3,1%
Agriculture
Papel, celulosee impressão | 3%
Pulp, papper andprinting
Químicos | 2,7%
Chemical
Descartáveis | 2,5%
Disposable
Eletrônicos |1,8%
Electronics
Têxteis e vestuários| 1%
Textiles and clothes
Farmacêutico |0,9%
Pharmaceutical
Outros equipamentos
transportes | 0,6%
Other transport equipment
Exportações de resinas
termoplásticas
Exports ofthermoplastic resins
Produção de transformados
plásticos
Production ofprocessed plastics
Reciclagem pós-
industrial
Post-industrialrecycling
US$
1,8bilhãoUSD 1,8billion
Consumo aparente
de transformados
plásticos
Apparent consumption of
processedplastics
R$
91,7bilhõesBRL 91,7billion
Reciclagem mecânica
de material plástico
pós-consumo(2018)
Mechanical recycling ofpost-consumption
plastic material (2018)
757,6 mil
toneladas757,6 thousand tons
Importações de resinas
termoplásticas
Imports of thermoplastic resins
US$
2,5bilhõesUSD 2.5billion
Exportações de
transformados plásticos
Exports ofprocessed plastics
US$ 1,1 bilhãoUSD 1,1 billion
R$
82 bilhõesBRL 82 billion
Importações de
transformados plásticos
Imports ofprocessed plastics
US$
3,5bilhõesUSD 3.5billion
Parcela exportada
Portionexported
5,2%
Parcela Importada:Portion imported
15,2%
Setores consumidores
de produtosplásticos (2017)Consumer sectors of plastic articles (2017)
ConsumidorfinalFinal consumer
FONTE: ABIPLAST

Empresasna indústria de transformadosplásticosCompanies in the processedplastics industry
315
360
347
345 344
356 356353
330
325
306
300
312 314315
2010 2011 2012 2013 2014 2015 2016 2017 2018 2019
Fonte: RAIS, Caged/ Min is tér io da Economia.
Source:RAIS,Caged/Ministry of Economy.
Empregosna indústria de transformadosplásticos–em mil empregosJobsin the processed plastics sector – in thousandjobs
2
4
6
12
10
8
0
2010 2011 2012 2013 2014 2015 2016 2017 2018 2019
Fonte: Pesquisa Indust r ia l Anual – Produto, Pesquisa Indust r ia l Mensal – Produção Física/ PIM-PF, Comexstat / M in is tér io
da Economia. Elaboração: ABIPLAST.
Source:Annual IndustrialSurvey - Product, Monthly IndustrialSurvey -PhysicalProduction / PIM-PF,Comexstat / Ministry of Economy. Preparedby
ABIPLAST.
Produçãode transformadosplásticos9–em milhõesde toneladasProductionof processedplastics9 – in million tons
11.250
11.000
11.750
12.000
11.524
11.690 11.67011.590
11.559
11.459
11.312
11.500 11.127
11.018
2010 2011
Fonte: RAIS/ Min is tér io da Economia.
Source:RAIS/Ministry of Economy
2012 2013 2014 2015 2016 2017 2018
8,7
11PERFIL 2019 |ABIPLAST
PROFILE 2019 | ABIPLAST
8,6 8,6 8,68,4
7,6
7,07,1 7,2 7,1
FONTE: ABIPLAST

Produçãode transformadosplásticos–em R$ bilhões–preçosconstantes
de 2019.Productionof processedplastics – in BRL billion –constantprices of 2019
Consumoaparente de transformadosplásticos–em milhõesde toneladas10Apparent consumption of processedplastics – in million of tons10
PERFIL 2019 |ABIPLAST
10,0
20,0
30,0
40,0
50,0
60,0
70,0
90,0
80,0
100,0
0,0
2010 2011 2012 2013 2014 2015 2016 2017 2018 2019
Fonte: Pesquisa Indust r ia l Anual – Produto, Pesquisa Indust r ia l Mensal – Produção Física/ PIM-PF/ IBGE. Elaboração: ABIPLAST.
Source:Annual IndustrialSurvey-Product, Monthly IndustrialSurvey-PhysicalProduction / PIM-PF/IBGE.PreparedbyABIPLAST.
81,485,8
91,6
84,7 84,579,6 80,9
82,9 82,0
93,41,0
2,0
3,0
4,0
5,0
6,0
8,0
7,0
9,0
10,0
0,0
2010 2011 2012 2013 2014 2015 2016 2017 2018 2019
Fonte: Pesquisa Indust r ia l Anual – Produto, Pesquisa Indust r ia l Mensal – Produção Física/ PIM-PF,
Comexstat / M in is tér io da Economia. Elaboração: ABIPLAST.
Source:Annual IndustrialSurvey - Product, Monthly IndustrialSurvey -PhysicalProduction / PIM-PF,Comexstat / Ministry of Economy. Preparedby
ABIPLAST.
9,0 9,0 9,1 9,1
8,0
7,37,6 7,7 7,6
8,9
Consumoaparente de transformados plásticos–emR$bilhões–preços
constantesde 2019Apparent consumption of processedplastics – in BRL billion –constantprices of 2019
80,0
85,0
95,0
90,0
75,0
2010 2011 2012 2013 2014 2015 2016 2017 2018 2019
Fonte: Pesquisa Indust r ia l Anual – Produto, Pesquisa Indust r ia l Mensal – Produção Física/ PIM-PF, Comexstat / M in is tér io
da Economia. Elaboração: ABIPLAST.
Source:Annual IndustrialSurvey - Product, Monthly IndustrialSurvey -PhysicalProduction / PIM-PF,Comexstat / Ministry of Economy. Preparedby
ABIPLAST.
85,4 85,787,1
91,191,7
89,6
92,3 92,1
105,0
101,2
100,0 99,0
43 FONTE: ABIPLAST

Exportaçõese importaçõesde transformadosplásticos (em mil toneladas)Processedplastics exportsand imports (in thousandtons)
Fonte: Comexst at / M in is tér io da Economia
Source:Comexstat/ Ministry of Economy
Exportaçõese importaçõesde transformadosplásticos (nominalem US$
milhões)Processedplastics exportsand imports (nominal in USDmillion)
Fonte: Comexst at / M in is tér io da Economia.
Source:Comexstat/ Ministry of Economy.
200
0
400
600
800
615,9
309,8
659,7
267,8
708,5
237,9
731,9
246,2
768,8
235,9
659,4
256,6
585,6
256,0
685,8
264,9
747,1
278,6
770,7
283,8
2010 2011 2012 2013 2014
Exportações
Exports
2015 2016 2017 2018 2019
Importações
Imports
2.834,1
1.474,7 1.512,2
1.283,6
3.228,8
3.001,0
1.206,7 1.213,1
3.389,4 3.366,2
1.083,5
3.542,1
1.112,3
1.338,3 1.394,6 1.345,91.000
0
1.500
500
2.000
3.000 2.707,4
2.500
3.500
4.000 3.844,5 3.888,1
3.590,1
2010 2011 2012 2013 2014 2015 2016 2017 2018 2019
Exportações Importações
Exports Imports
Faturamento de transformadosplásticos–em R$ bilhões–preçosconstantes
de 2019Revenuesof processedplastics – in BRL billion –constant pricesof 2019
Exportaçõese importaçõesde transformadosplásticos
(nominalem R$milhões)Processedplastics exportsand imports (nominal in BRL million)
Fonte: Comexst at / M in is tér io da Economia.
Source:Comexstat/ Ministry of Economy.
2.000
4.000
6.000
8.000
10.000
12.000
14.000
9.154,2
10.782,0
3.012,6 3.168,8
4.286,5
9.579,8
3.852,1
12.304,9
4.434,6
13.976,5
4.275,2
9.367,9
3.848,7
8.305,0
7.017,6
5.674,7
4.983,9
2.593,3 2.531,9 2.615,9
0
2010 2011 2012 2013 2014 2015 2016 2017 2018 2019
Exportações Importações
Exports Imports
85
75
80
95
70
2010 2011 2012 2013 2014 2015 2016 2017 2018 2019
Fonte: Pesquisa Indust r ia l Anual – Produto, Pesquisa Indust r ia l Mensal – Produção Física/ PIM-PF/ IBGE. Elaboração: ABIPLAST.
Source:Annual IndustrialSurvey-Product, Monthly IndustrialSurvey-PhysicalProduction / PIM-PF/IBGE.PreparedbyABIPLAST.
13PERFIL 2019 |ABIPLASTPROFILE 2019 | ABIPLAST
80,3
83,684,6
90,8
90
83,3
79,380,2
82,281,3
92,7
FONTE: ABIPLAST

Saldocomercial de transformadosplásticos (em mil toneladas)Commercialbalance of processedplastics (in thousandtons)
2010
0-150-300
2011
2012
2013
2014
2015
2016
2017
2018
2019
-600 -450
Fonte: Comexst at / M in is tér io da Economia.
Source:Comexstat/ Ministry of Economy.
-306,0
-392,0
-470,7
-485,7
-532,8
-402,8
-329,6
-420,9
-468,5
-486,9
0-2500-5000
Saldocomercial de transformadosplásticos (nominalem R$milhões)Commercialbalance of processedplastic (nominal in BRLmillion)
2010
2011
2012
2013
2014
2015
2016
2017
2018
2019
-10.000 -7.500
Fonte: Comexst at / M in is tér io da Economia.
Source:Comexstat/ Ministry of Economy.
-2.390,6
-3.142,8
-4.401,7
-5.292,4
-5.985,4
-6.495,5
-5.519,2
-5.727,7
-7.870,3
0-650
-1.300
Saldocomercial de transformadosplásticos (nominalem US$milhões)Commercialbalance of processedplastics (nominal in USDmillion)
2010
2011
2012
2013
2014
2015
2016
2017
2018
2019
-2.600 -1.950
Fonte: Comexst at / M in is tér io da Economia.
Source:Comexstat/ Ministry of Economy.
-486-4.-9264.4845.4,588,63,4
-1.359,4
-1.877,1
-2.251,8
-2.450,0
-2.542,2
-1.945,2
-1.595,1
-1.794,3
-2.153,0
PERFIL 2019 |ABIPLAST
PROFILE 2019 | ABIPLAST
FONTE: ABIPLAST
-9.701,3
www.cbplastico.com.br

Informações confidenciais e de uso restrito da Abiplast e Braskem (Equipe PICPlast), sendo proibida a sua reprodução, salvo com autorização prévia e expressa dessas instituições.
OBRIGADO