plasma gasification performances of various raw and
TRANSCRIPT
Delft University of Technology
Plasma gasification performances of various raw and torrefied biomass materials usingdifferent gasifying agents
Kuo, Po Chih; Illathukandy, Biju; Wu, Wei; Chang, Jo Shu
DOI10.1016/j.biortech.2020.123740Publication date2020Document VersionFinal published versionPublished inBioresource Technology
Citation (APA)Kuo, P. C., Illathukandy, B., Wu, W., & Chang, J. S. (2020). Plasma gasification performances of variousraw and torrefied biomass materials using different gasifying agents. Bioresource Technology, 314,[123740]. https://doi.org/10.1016/j.biortech.2020.123740
Important noteTo cite this publication, please use the final published version (if applicable).Please check the document version above.
CopyrightOther than for strictly personal use, it is not permitted to download, forward or distribute the text or part of it, without the consentof the author(s) and/or copyright holder(s), unless the work is under an open content license such as Creative Commons.
Takedown policyPlease contact us and provide details if you believe this document breaches copyrights.We will remove access to the work immediately and investigate your claim.
This work is downloaded from Delft University of Technology.For technical reasons the number of authors shown on this cover page is limited to a maximum of 10.
Contents lists available at ScienceDirect
Bioresource Technology
journal homepage: www.elsevier.com/locate/biortech
Plasma gasification performances of various raw and torrefied biomassmaterials using different gasifying agents
Po-Chih Kuoa,⁎, Biju Illathukandyb, Wei Wuc, Jo-Shu Changc,d,e
a Process and Energy Department, Faculty of 3mE, Delft University of Technology, Leeghwaterstraat 39, 2628, CB, Delft, The Netherlandsb Centre for Rural Development & Technology, Indian Institute of Technology, Delhi, Indiac Department of Chemical Engineering, National Cheng Kung University, Tainan 70101, TaiwandDepartment of Chemical and Materials Engineering, Tunghai University, Taichung 407, Taiwane Research Center for Smart Sustainable Circular Economy, Tunghai University, Taichung 407, Taiwan
G R A P H I C A L A B S T R A C T
A R T I C L E I N F O
Keywords:Plasma gasificationTorrefied biomassThermodynamic analysisNOx and SOx precursorsPlasma energy to syngas production ratio (PSR)Plasma gasification efficiency (PGE)
A B S T R A C T
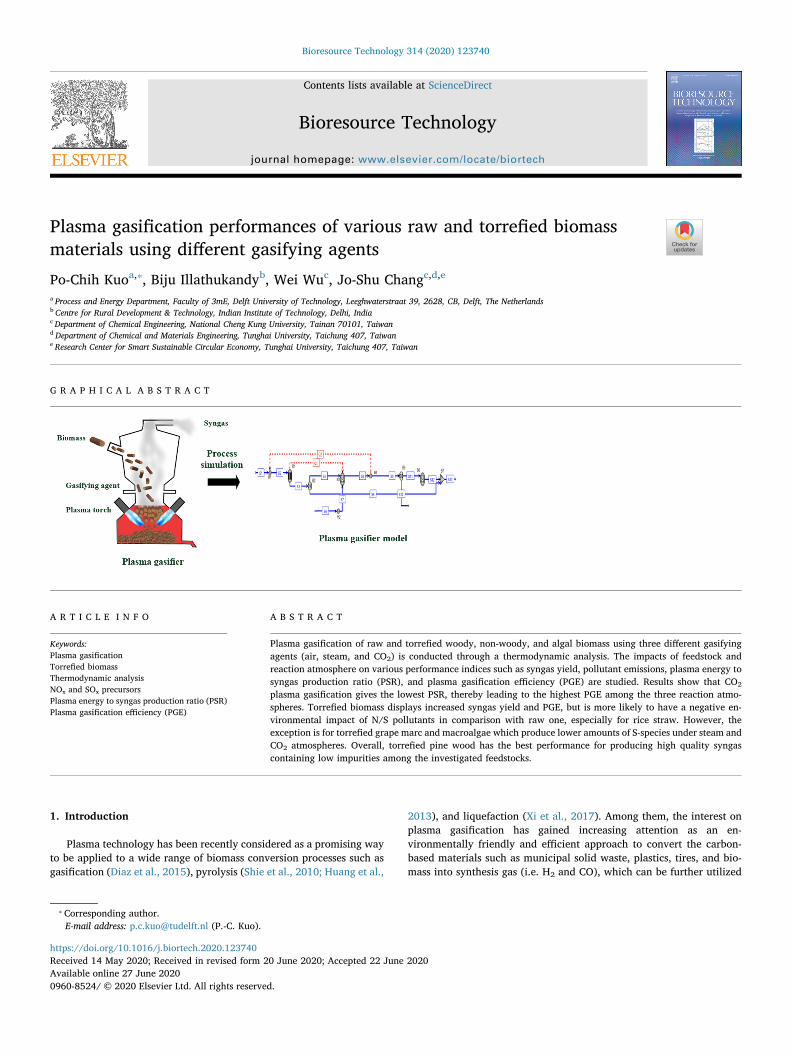
Plasma gasification of raw and torrefied woody, non-woody, and algal biomass using three different gasifyingagents (air, steam, and CO2) is conducted through a thermodynamic analysis. The impacts of feedstock andreaction atmosphere on various performance indices such as syngas yield, pollutant emissions, plasma energy tosyngas production ratio (PSR), and plasma gasification efficiency (PGE) are studied. Results show that CO2
plasma gasification gives the lowest PSR, thereby leading to the highest PGE among the three reaction atmo-spheres. Torrefied biomass displays increased syngas yield and PGE, but is more likely to have a negative en-vironmental impact of N/S pollutants in comparison with raw one, especially for rice straw. However, theexception is for torrefied grape marc and macroalgae which produce lower amounts of S-species under steam andCO2 atmospheres. Overall, torrefied pine wood has the best performance for producing high quality syngascontaining low impurities among the investigated feedstocks.
1. Introduction
Plasma technology has been recently considered as a promising wayto be applied to a wide range of biomass conversion processes such asgasification (Diaz et al., 2015), pyrolysis (Shie et al., 2010; Huang et al.,
2013), and liquefaction (Xi et al., 2017). Among them, the interest onplasma gasification has gained increasing attention as an en-vironmentally friendly and efficient approach to convert the carbon-based materials such as municipal solid waste, plastics, tires, and bio-mass into synthesis gas (i.e. H2 and CO), which can be further utilized
https://doi.org/10.1016/j.biortech.2020.123740Received 14 May 2020; Received in revised form 20 June 2020; Accepted 22 June 2020
⁎ Corresponding author.E-mail address: [email protected] (P.-C. Kuo).
Bioresource Technology 314 (2020) 123740
Available online 27 June 20200960-8524/ © 2020 Elsevier Ltd. All rights reserved.
T
for the synthesis of liquid fuels via the Fischer Tropsch (FT) technology(Kim et al., 2013) or power generation through combustion or fuel celltechnologies (Liu and Aravind, 2014).
In recent years, plasma gasification of biomass has been consideredas an alternative to the traditional biomass gasification technologiesbecause it is featured by higher operating temperature (up to ~5000 °C)and heating rate, thereby improving the gasification reaction rates andgas productivity (Favas et al., 2017; Shie et al., 2010). Another im-portant merit accompanied by plasma gasification of biomass is that theextent of tar cracking reaction can be intensified to completely destroytars under high temperature plasma, thereby leading to low con-centration of tars, especially heavy components, in the product gas(Shie et al., 2010; Favas et al., 2017; Munir et al., 2019). This implies,therefore, that the production of syngas from a plasma gasifier is pos-sible to be directly applied for internal combustion engine and solidoxide fuel cell (SOFC) without additional tar removal processes (Liuand Aravind, 2014; Rios et al., 2018).
In reviewing past literature, it could be seen that there were fewexperimental studies performed by various researchers to evaluate theperformance of biomass plasma gasification. For example, Hlina et al.(2006) conducted a plasma gasification of wood by using a plasmatorch with DC electric arc to produce plasma. The tar content in syngasfrom the plasma gasifier was found to be lower than 10 mg Nm−3.Hlina et al. (2014) also studied plasma gasification of wood sawdust(spruce) and wood pellets under a reaction temperature between 1200and 1400 °C. It was reported that high-quality syngas (~51 vol% COand 42% H2) with negligible content of tars were produced from thewood sawdust and wood pellets, and the wood sawdust had the highestplasma gasification efficiency (PGE) (~50%). Diaz et al. (2015) com-pared the performance of six different types of biomass materials intwo-stage plasma gasification with steam. It was indicated that theconcentration of H2 in the syngas exceeding 52 vol% with low contentof hydrocarbons (lower than 0.4%) was obtained and the PGE wasbetween 24 and 51%. Apart from the experimental works, attempts inthermodynamic modeling of biomass plasma gasification have alsobeen investigated. To illustrate, Janajreh et al. (2013) simulated theplasma gasifier with a DC arc plasma torch under an air–steam en-vironment in Aspen Plus and evaluated its performance for variousbiomass samples. Based on this simulation, the obtained values of PGEfrom highest to lowest were: pine needles (47.00%) > treated wood(46.20%) > untreated wood (43.50%) > plywood(40.51%) > algae (38.27%). Favas et al. (2017) performed the plasmagasification of three kinds of biomass materials with air and steam,using Aspen Plus. The results revealed that the higher the equivalenceratio (ER), the lower the lower heating value (LHV) of the product gas,and the same trend was also found when the steam plasma gasificationwas conducted. More recently, Ismail et al. (2019) numerically devel-oped a Eulerian model for simulating the plasma gasification of forestresidues with air and steam. It was shown that higher ERs had a ne-gative impact on the formation of syngas and its LHV, but a positive oneon the carbon conversion efficiency due to a greater extent of the oxi-dation reaction.
These earlier works show that converting biomass into syngas bythermal plasma is favorable for high quality syngas production with afairly low-level concentration of tars. Nevertheless, some unfavorablecharacteristics inherently exist in raw biomass such as high moisturecontent, hygroscopic nature, low calorific values, low bulk and energydensity, and poor grindability, etc. (Guo et al., 2017; Chen and Kuo,2011), thereby making raw biomass impractical for utilization, storage,and transportation. As a result, torrefied biomass, which is produced bya torrefaction pretreatment, has recently become an attractive alter-native to the raw one. Torrefaction is a mild pyrolysis process carriedout at a temperature between 200 and 300 °C under an inert or mini-mized oxidative atmosphere (Kuo et al., 2014). Many researchers haveinvestigated the applications of torrefied biomass for gasificationtechnology (Kuo et al., 2014; Marcello et al., 2017; Pinto et al.,
2017a,b; Weiland et al., 2014; Xue et al., 2014) and their results ver-ified that torrefied biomass has benefits for gasification performance.However, to this end, an examination of the past literature reveals thatno works have been done to evaluate the utilization of torrefied bio-mass in a plasma gasifier, nor those that compare the performance ofplasma gasification between raw and torrefied biomass. For the fore-going reasons, the purpose of this study is to first develop the plasmagasifier in an Aspen Plus simulator and then analyze the plasma gasi-fication characteristics of various types of raw and torrefied biomassunder three reaction atmospheres, namely air, steam, and CO2.
On the other hand, nitrogenous and sulfur-containing species suchas NH3, HCN, H2S, and COS are poisons for catalysts in the chemicalsynthesis reactors or mainly precursors to lead to the formation of NOX
and SOX during the syngas combustion (Ren et al., 2017). An initialunderstanding of the release of nitrogenous and sulfur-containing pol-lutants during gasification is helpful for choosing a suitable fuel tofurther syngas combustion applications. Therefore, the formation ofNH3, HCN, H2S, and COS from raw and torrefied biomass during theplasma gasification is also explored and compared in detail. The impactof ER, steam to carbon ratio (S/C), and CO2 to carbon ratio (CO2/C) onthe various performance indices of the plasma gasification such as LHVof the product gas, plasma energy to syngas production ratio (PSR), andPGE are investigated to find the optimal operating conditions andfeedstocks.
2. Materials and methods
2.1. System description
The simulation model is carried out using Aspen Plus V8.8. Thefollowing assumptions are considered: (1) the process is in state-steady;(2) the solid and gaseous phases are in a state of thermodynamicequilibrium (Kuo et al., 2014); (3) the product gas comprises H2, CO,CO2, H2O, CH4, N2, NH3, HCN, H2S, and COS (Mazzoni and Janajreh,2017; Kuo et al., 2014); (4) the heat losses of the plasma gasifier areneglected (Mazzoni and Janajreh, 2017); and (5) char is assumed asgraphitic carbon (Janajreh et al, 2013; Kuo et al., 2014). The Peng-Robinson equation of state with the Boston-Mathias alpha function (PR-BM) model is selected as property methods (Kuo et al., 2014). Thefeedstock is established as a non-conventional component based onproximate and elemental analyses. The HCOALGEN model is selected toestimate the heat of combustion, heat of formation, and heat capacity ofthe feedstock, while the DCOALIGT model is used to calculate thedensity of the feedstock (Kuo et al., 2014). As shown in the process flowdiagram for the plasma gasifier, the feedstock (S1) enters the system atambient conditions (i.e. 25 °C and 1 atm). It is then fed to a RYieldblock (B1) where the non-conventional fuel is decomposed to conven-tional components, including C, H2, N2, O2, S, ash, and moisture (S2) byusing a calculator, which is implemented by the FORTRAN statement.Both the conventional components and plasma gas (S6) are then sent toa RGibbs reactor (B3) at a high temperature of 2500 °C (Minutillo et al.,2009; Janajreh et al, 2013; Mazzoni and Janajreh, 2017), in which thechemical and multiphase equilibrium calculations are solved by theGibbs free energy minimization, which is reported elsewhere in a pre-vious study (Kuo et al., 2014). Meanwhile, the plasma gas is heated upto 4000 °C in a heater (H2) in which a DC plasma torch is simulated(Minutillo et al., 2009; Janajreh et al, 2013; Mazzoni and Janajreh,2017). A separator (B5) is then used to remove the residual slag fromthe product gas. The product gas subsequently flows to another RGibbsreactor (B6) at a temperature of around 1000 °C to complete the gasi-fication reaction. The key chemical reactions occurring in the plasmagasifier are listed in Table 1 (Park et al., 2008; Gai et al., 2014; Kuoet al., 2014).
P.-C. Kuo, et al. Bioresource Technology 314 (2020) 123740
2

2.2. Model validation
The simulation model of the plasma gasifier is validated by com-paring it with the results obtained from Minutillo et al. (2009) andJanajreh et al. (2013). In the study of Minutillo et al. (2009), the refusederived fuel was used as the feedstock for plasma gasification with airas the medium, while various feedstocks were gasified under a mixtureof air–steam environment in the study of Janajreh et al. (2013). Table 2shows a comparison of the product gas composition and plasma torchpower between the present model and the published literature underthe same operating conditions and it is clear that the predicted valuesfrom the developed plasma gasifier at different plasma gas to fuel ratiosare in good agreement with the data available from the literature. Thepresent model can thus be utilized to predict the performance of theplasma gasification process for various raw and torrefied biomass ma-terials.
2.3. Biomass materials
Five raw (R) and torrefied (T) biomasses, i.e. pine wood chips (PW),rice straw (RS), forest residues (FR), grape marc (GM), and macroalgae(MA) (Oedogonium intermedium) are selected as the feedstock in thiswork. The property data of PW, RS, FR is collected from the studies ofPhanphanich and Mani (2011), Kai et al. (2019), and Li et al. (2015)respectively, while that of GM and MA is obtained from the work of Guoet al. (2017). The torrefaction temperature and residence time of 275 °Cand 30 min, respectively, are chosen for plasma gasification of torrefied
biomass in this work (Misljenovic et al., 2014; Huang et al., 2019). Theproximate analysis, elemental analysis, and place of origin of raw andtorrefied biomass are presented in Table 3.
2.4. Process parameters and performance indices
Three different operating parameters (i.e. gasifying agents: air,steam, and CO2), including equivalence ratio (ER), steam-to-carbon(mass flow rate) ratio (S/C), and CO2-to-carbon (mass flow rate) ratio(CO2/C) are used for biomass plasma gasification. In this study, op-erational parameters in the plasma gasifier with respect to the ER, S/C,and CO2/C are 0.2–0.4 (interval: 0.02), 1–4 (interval: 0.25), and 1–4(interval: 0.25), respectively. They are defined as follows:
=ER m mm m
( )( )
air biomass actual
air biomass stoichiometric (1)
=
×
S C my m
steam
c biomass (2)
=
×
Cm
y mCO
c biomass
2CO2
(3)
where m m m m , , , biomass air steam CO2 are the mass flow rate of biomass, air,steam, and carbon dioxide (kg s−1), respectively, and yc is the carboncontent in the feedstock (wt%).
To evaluate and compare the performance of plasma gasificationbetween raw and torrefied biomass, different performance indices such
Table 1A list of key chemical reactions occurring during the plasma gasification (Park et al., 2008; Gai et al., 2014; Kuo et al., 2014).
Reaction name Chemical reaction Reaction number
Devolatilization → +CH O N S char volatilesx y z w R1Oxidation + → = −
−C O CO H kJ mol0.5 , Δ 2682 0 1 R2
+ → = −−C O CO H kJ mol, Δ 4062 2 0 1 R3
Water gas reaction + → + =−C H O CO H H kJ mol, Δ 131.42 2 0 1 R4
Water gas shift reaction + ↔ + = −−CO H O CO H H kJ mol, Δ 422 2 2 0 1 R5
Boudouard reaction + → =−C CO CO H kJ mol2 , Δ 172 . 62 0 1 R6
Methanation reaction + ↔ = −−C H CH H kJ mol2 , Δ 752 4 0 1 R7
Steam methane reforming + ↔ + =−CH H O CO H H kJ mol3 , Δ 2064 2 2 0 1 R8
Nitrogenous species formation + →N H NH3 22 2 3 R9
→Char N HCN‐H R10
+ → +HCN H O NH CO2 3 R11Sulphur species formation + → +H S CO COS H O2 2 2 R12
+ → +H S CO COS H2 2 R13
Table 2The comparison of predicted results with the data from literature for model validation.
Feedstock Gasifying agents Plasma gas/fuel ratio Source Gas composition (vol. %) Torch power (MW)
H2 CO CO2 CH4 H2O N2 H2S COS HCl
RDFa Air 0.782 Minutillo et al. (2009) 21.04 33.79 0 5.97 11.68 26.97 0.22 0.02 0.32 4.26Present model 21.02 33.79 0 5.99 11.69 26.96 0.22 0.02 0.32 4.25
RDFa O2 (vol 40%) 0.643 Minutillo et al. (2009) 31.49 38.73 0.42 0 12.50 16.32 0.22 0.01 0.31 3.44N2 (vol 60%) Present model 31.51 38.71 0.44 0 12.47 16.31 0.22 0.01 0.31 3.43
RDFa Air 0.505 Minutillo et al. (2009) 28.65 37.37 1.41 0 14.91 17.12 0.22 0.01 0.31 2.75O2 0.207 Present model 28.85 37.18 1.60 0 14.71 17.12 0.22 0.01 0.31 2.75
Coal Air 1.31 Janajreh et al. (2013) 50.28 40.89 0.05 0 0.72 7.83 0.20 0.01 0 16.65Steam 0.7 Present model 50.35 40.75 0.07 0 0.79 7.82 0.20 0.01 0 16.69
MSWb Air 0.36 Janajreh et al. (2013) 43.50 34.50 0.03 0.01 16.22 5.63 0.09 0 0 4.06Steam 0.56 Present model 43.50 34.40 0.05 0.01 16.27 5.69 0.08 0 0 4.07
Wood Air 1.38 Janajreh et al. (2013) 22.68 36.45 0.65 0 5.31 34.90 0 0 0 7.84Present model 22.74 36.43 0.64 0 5.30 34.89 0 0 0 7.85
a RDF: refused-derived fuel.b MSW: municipal solid waste.
P.-C. Kuo, et al. Bioresource Technology 314 (2020) 123740
3
as syngas yield (Nm3 kg-fuel−1), lower heating value (LHV) of theproduct gas, plasma energy to syngas production ratio (PSR), plasmagasification efficiency (PGE) are calculated as follows (Kaewluan andPipatmanomai, 2011):
= + +LHV Y Y Y10.79 12.62 35.81gas H CO CH2 4 (4)
=PSREm
plasma
syngas (5)
=
×
E Wη ηplasma
torch
torch electric (6)
=
×
× +
×PGEG LHV
m LHV E(% )
( )100%P product gas
biomass biomass plasma (7)
where YH2, YCO, YCH4 are the volume fractions of H2, CO, CH4, respec-tively in the product gas based on a dry basis. Eplasma is the plasmaenergy (MW), GP is the yield of product gas (Nm3 kg-fuel−1), LHVbiomass
and LHVgas are the LHV of biomass (MJ kg−1) and product gas (MJNm−3), respectively. Wtorch is the plasma torch power (MW). ηtorch andηelectric represent the plasma torch efficiency (90%) (Minutillo et al.,2009) and electrical efficiency (39%) (Oh et al., 2018), respectively.
3. Results and discussion
3.1. Characterization of product gas from the plasma gasification
A comparison of product gas characteristics from the plasma gasi-fication under three different atmospheres, namely, air, steam, and CO2,
between several types of biomass (RPW, TPW, RRS TRS, RGM, TGM,RFR, TFR, RMA, and TMA) is first investigated. The syngas compositionfrom each feedstock is shown in Fig. 1, while the emissions of ni-trogenous (NH3 and HCN) and sulfur (H2S and COS) impurities areshown in Figs. 2 and 3, respectively.
3.1.1. Syngas compositionFig. 1 depicts the dry-basis concentrations of H2 and CO from the
plasma gasification as a function of ER, S/C ratio, and CO2/C ratio. Forthe air plasma gasification, H2 concentration decreases with increasingER for all types of raw and torrefied biomass. This is because a higherER means more oxygen supplied to the plasma gasifier, causing agreater extent of the combustion reaction. Similar to the trend of H2
concentration, CO concentration drops along with ER for all types ofraw biomass. These trends of H2 and CO for raw biomass are consistentwith the results reported by Favas et al. (2017). Notably, for TGM, TFR,and TMA, the trend of CO concentration is first insensitive to ER (at
lower ERs) and then declines in a significant way, thereby resulting in arise in CO2 concentration. For instance, as the ER increases from 0.2 to0.28, 0.2–0.24, and 0.2–0.28, the CO concentration only decreases from33.19 to 33.10% for TGM, 37.73 to 37.35% for TFR, and 32.51 to31.31% for TMA, respectively.
It is well known that the chemical and physical properties of rawbiomass are changed after torrefaction. The carbon–hydrogen–oxygen(C–H-O) ternary and the van Krevelen diagrams can be used to un-derstand how torrefaction affects the elemental compositions of bio-mass. When the raw biomass undergoes torrefaction at 275 °C for30 min, the C–H-O ternary diagram shows that torrefaction results in anincrease in the carbon content and a decrease in the hydrogen andoxygen contents in the feedstock, while the van Krevelen diagramclearly demonstrates that torrefied biomasses have lower atomic hy-drogen to carbon (H/C) and the atomic oxygen to carbon (O/C) ratios.As a result, it can be seen that air plasma gasification from all types ofraw biomass produces higher H2 concentration as compared to torrefiedone due to a higher moisture and hydrogen content (Table 3). In con-trast, using torrefied biomass as the feedstock gives a higher CO con-centration because of higher carbon content. The exception is for TGMwhen ER ranges from 0.2 to 0.24.
In examining the syngas composition of steam plasma gasificationfrom raw and torrefied biomass, both the concentrations of H2 and COare very dependent on S/C ratio, no matter what fuels are examined. Byvirtue of involving both water gas reaction (R4) and water–gas shiftreaction (R5) in the plasma gasifier, increasing the S/C ratio leads tohigher H2 concentration, whereas it results in lower CO concentrationand higher CO2 concentration. These results are in accordance with thephenomenon in steam plasma gasification of three different biomassesfound by Favas et al. (2017). It is worth noting that using torrefiedbiomass to replace raw biomass as a fuel in the plasma gasification withsteam could not improve the H2 concentration except for TGM, inwhich its H2 concentration is somewhat improved by factors of0.08–0.96% when the S/C ratio is larger than 1.25. As a whole, H2
concentration ranges from 52.30 to 63.25% within the investigated S/Cratio range. In contrast to the H2 concentration, CO concentration of alltorrefied biomass types is considerably enhanced up to 3.10–14.76%due to the enrichment of carbon through torrefaction.
Once the raw and torrefied biomasses are gasified in the CO2 at-mosphere, the Boudouard reaction (R6) and reverse water–gas shiftreaction (R5) will be dominant in the plasma gasifier. The rise in CO2/Cratio is found to decrease H2 formation as a result of (R5), while COconcentration first increases substantially until it reaches a maximumvalue, and then it decreases with further increases in the CO2/C ratio.This arises from the fact that R6 is mainly driven in the plasma gasifier
Table 3Chemical properties of raw and torrefied biomass (at 275 °C for 30 min) materials used in the simulation.
Feedstocks RPW TPW RRS TRS RGM TGM RFR TFR RMA TMA
Proximate analysis (wt%, dry basis)Moisture 6.69 2.46 4.35 1.75 2.87 2.59 6.30 4.20 7.55 3.38Volatile matter 85.98 76.40 78.26 72.60 66.56 52.83 74.71 64.30 72.50 50.59Fixed carbon 13.75 23.25 12.09 16.42 27.67 39.32 22.95 32.88 19.08 35.54Ash 0.27 0.35 9.65 10.98 5.77 7.85 2.35 2.82 8.42 13.87
Elemental analysis (wt%, dry-ash-free)C 47.31 55.20 42.57 49.02 53.65 64.93 52.10 59.50 49.13 63.86H 6.65 6.23 5.84 5.16 6.80 6.55 6.10 5.60 7.22 6.24N 0.17 0.20 2.13 5.20 2.32 2.85 0.50 0.60 4.61 6.76O 45.87 38.37 49.33 40.46 37.10 25.55 41.30 34.30 38.88 23.00S – – 0.13 0.16 0.14 0.12 – – 0.15 0.14HHV (MJ kg−1) 18.46 21.82 16.60 18.82 21.51 25.47 20.86 23.67 19.59 22.93LHV (MJ kg−1) 16.83 20.39 15.21 17.64 20.02 24.07 19.36 22.33 17.95 21.67Reference Phanphanich and Mani, (2011) Kai et al. (2019) Guo et al. (2017) Li et al. (2015) Guo et al. (2017)Place of origin Oglethorpe, Georgia Shenyang, China Adelaide, Australia – Queensland, Australia
Note: RPW: raw pine wood chips; TPW: torrefied pine wood chips; RRS: raw rice straw; TRS: torrefied rice straw; RGM: raw grape marc;TGM: torrefied grape marc; RFR: raw forest residues; TFR: torrefied forest residues; RMA: raw macroalgae; TMA: torrefied macroalgae
P.-C. Kuo, et al. Bioresource Technology 314 (2020) 123740
4
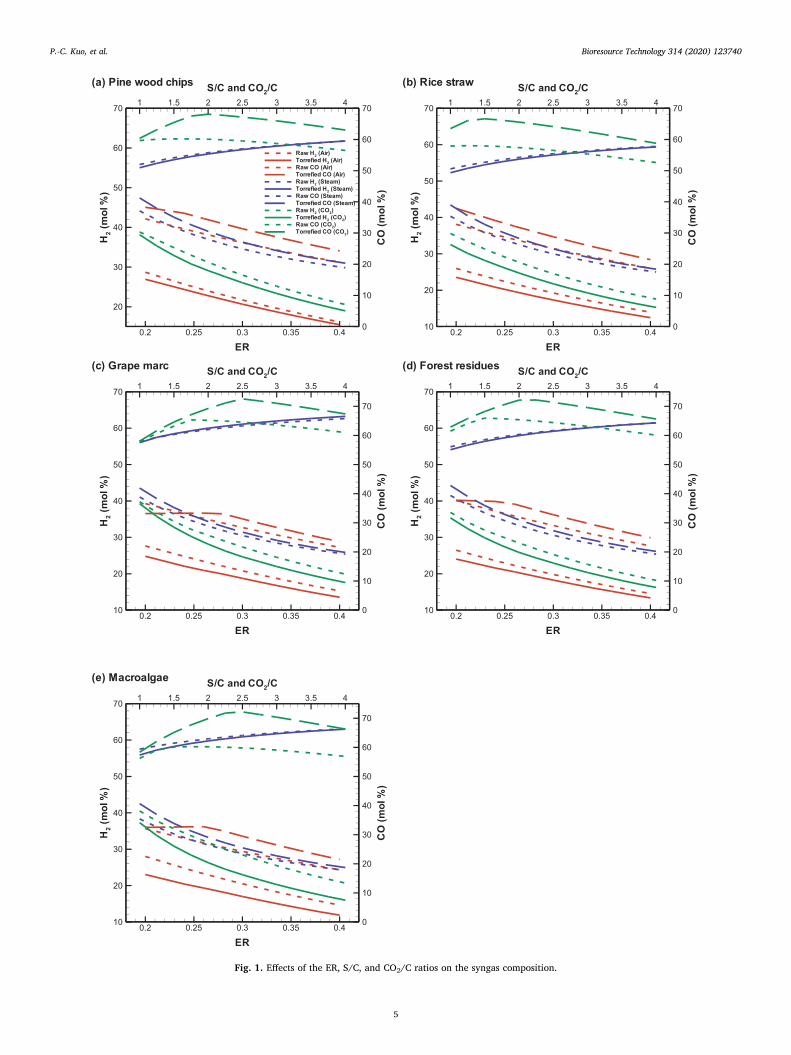
Fig. 1. Effects of the ER, S/C, and CO2/C ratios on the syngas composition.
P.-C. Kuo, et al. Bioresource Technology 314 (2020) 123740
5
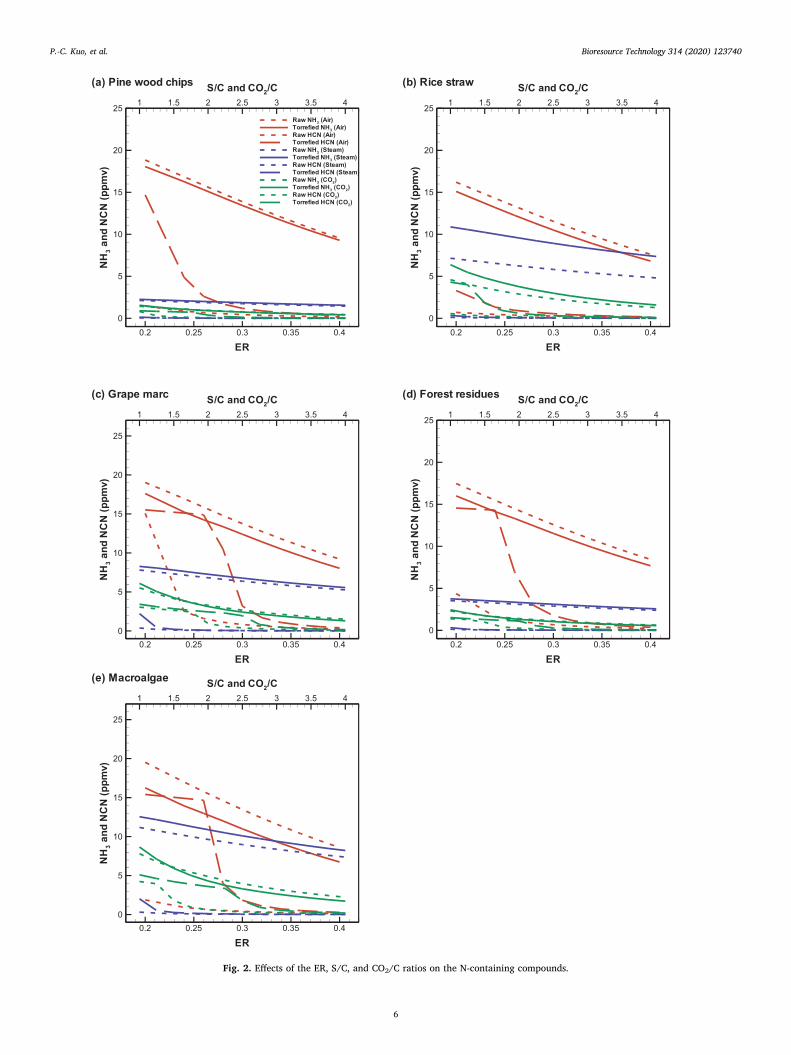
Fig. 2. Effects of the ER, S/C, and CO2/C ratios on the N-containing compounds.
P.-C. Kuo, et al. Bioresource Technology 314 (2020) 123740
6
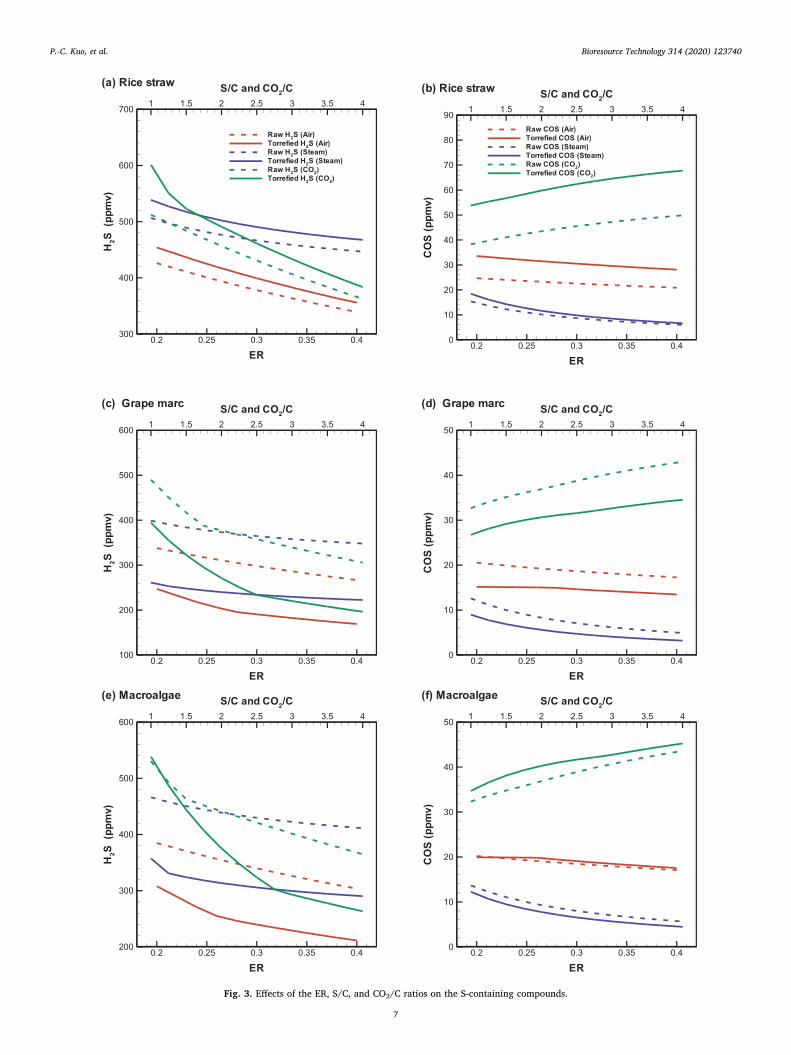
Fig. 3. Effects of the ER, S/C, and CO2/C ratios on the S-containing compounds.
P.-C. Kuo, et al. Bioresource Technology 314 (2020) 123740
7

Fig. 4. Effects of the ER, S/C, and CO2/C ratios on the syngas yield and LHV of the product gas.
P.-C. Kuo, et al. Bioresource Technology 314 (2020) 123740
8

at lower CO2/C ratios. Nevertheless, the excess CO2 fed to the plasmagasifier not only makes R5 more dominant but also dilutes the productgas, causing a significant decrease and increase in CO and CO2 con-centrations, respectively. Similar trends have also been found in thestudies of Salaudeen et al. (2018) and Wang et al. (2019). Overall, TGMproduces the highest CO concentration of 72.59% at CO2/C ratio of 2.5,followed by TFR and TMA which are equally 72.17%, at CO2/C ratios of2.25 and 2.5, respectively. As mentioned earlier, the maximum valuesof CO concentration are found at certain CO2/C ratios where the carbonis completely reacted with CO2 through R6. Apparently, for the torre-fied biomass materials, to achieve a complete carbon-CO2 reaction,more CO2 is required to inject into the plasma gasifier. Moreover, thecomparative results between raw and torrefied biomass indicate thatthe H2 concentration of the former is higher than that of the latter,whereas the CO concentration of the latter is amplified by factors of0.43–20.64%.
3.1.2. NH3 and HCN emissionsFig. 2 plots the distributions of NH3 and HCN as a function of ER, S/
C ratio, and CO2/C ratio for various raw and torrefied biomass types.The N-containing compounds released from the plasma gasification arehighly dependent on the nitrogen content in the feedstock due to thevarious char-nitrogen reactions (Broer and Brown, 2015). According tothe elemental analysis (Table 3), it can be observed that the nitrogencontent in the feedstock is increased after torrefaction by about0.03–3.07 wt%. For the air plasma gasification, it is indicated that NH3
concentration of all torrefied biomass types is lower than that of rawbiomass with the rise of ER, whereas HCN concentration exhibits op-posite trends in which its values are increased after torrefaction, espe-cially at lower ERs. The formation of NH3 and HCN are mainly domi-nated by R9-R11 during the plasma gasification. These might be due tolow hydrogen and high carbon content in the torrefied biomass. It isworthy of note that the extent of decrease in concentration of NH3 wasrelatively lower for TPW (by factors of 2.72–4.19%) among the fivetorrefied biomass samples, while the TMA has the highest reduction inNH3 emissions (by factors of 16.78–21.69%). Besides, it is apparent thatthe distributions of HCN formation show two reaction stages, especiallyfor TGM, TFR, and TMA. For example, the concentration of HCN inTGM almost kept constant (i.e. the first stage) in the ER range of0.2–0.26. This might be attributed to the unconverted char in theplasma gasifier. After completing char conversion, as a result, a sharpdecreasing trend of HCN concentration is observed when ER is larger
than 0.26 (i.e. the second stage).Unlike the plasma gasification with air, under steam environment,
NH3 emissions from torrefied biomass are higher than those of rawbiomass. Similar results were also found in the study of Pinto et al.(2017b) where the release of NH3 and H2S were increased by 54–139%and 91–130%, respectively, during the steam gasification of eucalyptusglobulus stumps. The influences of torrefaction on the enhancementfactor of NH3 emissions are ranked as: TRS (52.03–53.36%) > TMA(11.42–13.06%) > TPW (5.94–7.30%)≅TFR (6.18–7.08%) > TGM(5.45–6.69%). However, HCN concentration is barely affected by tor-refaction and it is less than 0.3 ppmv when the S/C ratio is larger than1.5, regardless of what kind of biomass is examined. As regard to theNH3 emissions under the CO2 environment, torrefaction has more in-fluence on rice straw and macroalgae. It should be underlined thattorrefied biomass has lower NH3 emissions at higher CO2/C ratios,except for TMA. For instance, NH3 emissions from TMA are reduced byfactors of 2.03–22.67% when the CO2/C ratio is operated between 1.5and 4. As for HCN concentration, torrefied biomass is by far higher thanthat of a raw one. The enhancement factor of HCN concentration isranked as: TRS > TMA > TPW > TFR > TGM.
3.1.3. H2S and COS emissionsThe sulfur content in the biomass results in the formation of gaseous
sulfides and it is mainly released as H2S. Non-woody biomass generallycontains higher amounts of fuel-S than those of woody biomass (Gaiet al., 2014). Similar observations listed in Table 3 shows that only non-woody biomass (RS, GM, and MA) contains significant amounts ofsulfur. Fig. 3 shows their distributions of H2S and COS before and aftertorrefaction. It is observed that most profiles, with the exception of anopposite trend for COS concentration under CO2 plasma gasification,decline linearly with process parameters. Furthermore, the effect ofthree gasifying agents on the sulfur species reveals that for the forma-tion of H2S during the plasma gasification, using air as a gasifying agentproduces the lowest among the three reaction atmospheres, except forRGM and RMA. On the contrary, the formation of COS is the lowestunder steam atmosphere, whereas it is the highest under CO2 atmo-sphere, as a consequence of the enhanced intensity of R12-R13, thusleading to more COS formation in the product gas
For a comparison of the emissions of H2S between raw and torrefiedmaterials, the values for the latter are much lower than those of theformer. The exception is for TRS, for which torrefaction makes theformation of H2S and COS increase by factors of 4.87–6.52% and
Table 4Comparison of LHV of the product gas of the plasma and conventional gasification at various S/C ratios.
Operating conditions Plasma gasification LHV (MJ Nm−3)
S/C RPW TPW RRS TRS RGM TGM RFR TFR RMA TMA
0.5 11.43 11.66 10.91 11.44 11.54 11.48 11.66 11.64 11.44 11.291 10.72 11.17 10.23 10.58 11.01 11.47 10.91 11.28 10.69 11.241.5 10.23 10.59 9.76 10.01 10.47 10.77 10.36 10.63 10.21 10.572 9.87 10.17 9.41 9.61 10.08 10.32 9.96 10.17 9.85 10.122.5 9.60 9.86 9.15 9.31 9.78 9.98 9.65 9.83 9.58 9.793 9.38 9.60 8.94 9.08 9.54 9.72 9.41 9.57 9.37 9.533.5 9.19 9.40 8.77 8.89 9.35 9.50 9.22 9.36 9.19 9.334 9.04 9.23 8.63 8.73 9.19 9.33 9.06 9.18 9.04 9.16
Operating conditions Conventional gasification LHV (MJ Nm−3)
S/C RPW TPW RRS TRS RGM TGM RFR TFR RMA TMA0.5 11.05 11.14 10.71 10.60 11.12 11.29 11.04 11.10 11.02 11.061 10.79 11.08 10.00 10.65 11.07 11.18 11.00 11.05 10.92 11.021.5 9.97 10.54 9.34 9.73 10.39 10.97 10.17 10.62 10.02 10.672 9.46 9.87 8.91 9.18 9.76 10.13 9.58 9.88 9.49 9.882.5 9.11 9.43 8.62 8.81 9.35 9.62 9.18 9.40 9.14 9.403 8.86 9.11 8.40 8.56 9.06 9.27 8.90 9.08 8.88 9.083.5 8.67 8.88 8.24 8.36 8.84 9.02 8.70 8.84 8.70 8.844 8.52 8.71 8.11 8.22 8.68 8.83 8.53 8.66 8.55 8.67
P.-C. Kuo, et al. Bioresource Technology 314 (2020) 123740
9

Fig. 5. Effects of the ER, S/C, and CO2/C ratios on the PGE.
P.-C. Kuo, et al. Bioresource Technology 314 (2020) 123740
10

34.81–35.83% in the air atmosphere, 4.69–6.39% and 10.50–19.73% inthe steam atmosphere, and 5.78–17.38% and 35.93–40.59% in the CO2
atmosphere, respectively. These trends were also observed in the studyof Pinto et al. (2017a), where H2S was increased by 100% when tor-refied rice husk at 250 °C was gasified. For grape marc, lower amountsof COS are formed after torrefaction, regardless of reaction environ-ment. However, for macroalgae, the amount of COS formation is almostsimilar for both the RMA and TMA under the air environment, less fromTMA in the steam environment, whereas more COS is produced in theCO2 environment.
3.2. Performance indices of plasma gasification
3.2.1. Syngas yield and LHV of the product gasFig. 4 plots the distributions of syngas yield and LHV of the product
gas for each biomass along with ER, S/C, and CO2/C ratios. For airplasma gasification, the values of syngas yield decrease as the ER in-creases for all types of raw biomass, while those increase and thendecrease for torrefied biomass, mainly as a result of an incomplete charreaction. The exception is for TRS which has the lowest carbon contentamong the five torrefied biomasses. For the steam plasma gasification,the syngas yield is independent of the S/C ratio for all types of biomass.For instance, the syngas yield of RPW and RRS is around 1.73 and 1.33Nm3 kg-fuel−1, respectively, no matter what the S/C ratio is. Similartrends are also observed for RPW and RRS under the CO2 atmosphere(around 1.73 Nm3 kg-fuel−1 for RPW and 1.33 Nm3 kg-fuel−1 for RRS),whereas an increasing trend initially at lower CO2/C ratios and thenalmost constant for other biomass materials. From the above observa-tions, it is concluded that the syngas yield is marginally promoted byadding excess steam or CO2 into the plasma gasifier. As a whole, plasmagasification of biomass with air gives the lowest syngas yield, ap-proximately ranging from 0.71 to 1.71 Nm3 kg-fuel−1, while it is from1.15 to 2.51 Nm3 kg-fuel−1 in the steam atmosphere and from 0.96 to2.50 Nm3 kg-fuel−1 in the CO2 atmosphere. Basically, the syngas yieldof raw biomass can be enhanced by factors of 7.42–28.90% in the airatmosphere, 17.34–29.47% in the steam atmosphere, and 5.46–29.48%in the CO2 atmosphere, when biomass is torrefied. Notably, TMA hasthe highest enhancement factor of syngas yield, regardless of what thegasifying agent is used.
In examining the LHV of the product gas, it decreases linearly alongwith the ER and S/C ratio for all types of biomass, which is consistentwith the observations from the studies of (Favas et al., 2017) and(Ismail et al., 2019). The values of LHV of the product gas ranges from3.84 to 7.78 MJ Nm−3 in the air atmosphere and 8.63–11.47 MJ Nm−3
in a steam atmosphere. For the air plasma gasification, the LHV of theproduct gas for TPM and TRS is higher than that of RPM and RRS, as a
result of higher syngas yield, while it happens when the ER is largerthan 0.26 for TGM, 0.22 for TFR, and 0.24 for TMA. For the steamplasma gasification, the LHV of the product gas for torrefied biomass isobviously superior to that of raw biomass, no matter which biomass isexamined. Moreover, a comparison of the LHV of the product gas be-tween plasma and conventional (700 °C) gasification of various types ofbiomass is tabulated in Table 4. It is indicated that the values of LHV ofthe product gas of raw and torrefied biomass from plasma gasificationare higher than those from conventional gasification due to the up-graded quality of syngas. These trends are in line with the observationsof Janajreh et al., (2013). As regard to the plasma gasification with CO2,it is found that the distributions of LHV first increase and then decreasesubstantially. This is due to the fact that the LHV of the product gas ismainly contributed by H2 and CO, especially the latter (Eq. (4)).Meanwhile, the higher the CO2/C ratio, the lower the CO concentrationin the product gas (Fig. 1). When two factors are concerned together,therefore, the LHV of the product gas goes down after reaching amaximum value. Overall, the LHV of the product gas ranges from 8.54to 11.94 MJ Nm−3 in the CO2 atmosphere.
3.2.2. PSR and PGEFig. 5 shows the plasma gasification efficiency (PGE), and plasma
energy to syngas production ratio (PSR) of each biomass material. Asexpected, the profiles of the PGE are similar to those of LHV of theproduct gas (Fig. 4). During the plasma gasification, the plasma torchpower is also an important input energy source, which will affect thePGE. The values of the PSR of all types of biomass are summarized inTable 5. It can be seen that the values of PSR increase with increasingthe process parameters, and those are the lowest under CO2 atmosphere(1.43–5.44 kWh kg−1), followed by air atmosphere (4.18–14.71 kWhkg−1) and steam atmosphere (4.49–37.83 kWh kg−1). Notably, thevalues of PSR for some cases are decreased after torrefaction. For ex-ample, for TPW, PSR can be reduced by factors of 5.64–14.21%,10.00–11.39%, and 9.89–11.07%, corresponding to air, steam, and CO2
atmosphere, respectively. Furthermore, it should be noted that thelowest value of PSR and the highest value of LHV of the product gas areobtained in the CO2 atmosphere, thereby leading to the highest valuesin the PGE among the three reaction atmospheres, irrespective of whichfuel is used. Although the values of the PSR for steam plasma gasifi-cation is the highest, the higher syngas yield causes higher LHV of theproduct gas, which, in turn, results in the higher PGE as compared tothe case of air plasma gasification.
A comparison of PGE between raw and torrefied biomass, for the airplasma gasification, indicates that the values of PGE are increased byfactors of 2.79–16.88% for TPW and 8.21–8.59% for TRS. However,TFR and TMA have higher values of PGE when ER is larger than 0.24
Table 5Plasma energy to syngas production ratio of raw and torrefied biomass materials.
Operating conditions Plasma energy to syngas production ratio (kWh kg−1)
RPW TPW RRS TRS RGM TGM RFR TFR RMA TMA
ER0.2 4.43 4.18 4.79 4.32 4.40 5.74 4.25 4.68 5.17 6.070.3 7.62 6.61 8.38 7.52 7.53 7.21 7.32 6.66 9.09 8.000.4 11.96 10.26 13.47 12.04 11.87 11.41 11.54 10.45 14.71 12.99
S/C1 5.18 4.59 6.05 5.47 4.57 4.49 5.09 4.72 4.92 4.592 12.35 11.02 14.58 13.37 10.89 10.19 12.28 11.48 11.69 10.083 21.25 19.05 25.26 23.34 18.76 17.66 21.29 20.02 20.07 17.484 31.69 28.52 37.83 35.15 27.99 26.48 31.90 30.12 29.88 26.22
CO2/C1 1.43 1.67 1.62 1.63 1.67 2.10 1.61 1.86 1.57 2.152 2.62 2.33 2.99 2.68 2.33 2.60 2.54 2.41 2.48 2.643 3.72 3.33 4.25 3.84 3.31 3.05 3.62 3.37 3.51 3.014 4.75 4.28 5.44 4.95 4.24 3.92 4.65 4.34 4.48 3.88
P.-C. Kuo, et al. Bioresource Technology 314 (2020) 123740
11
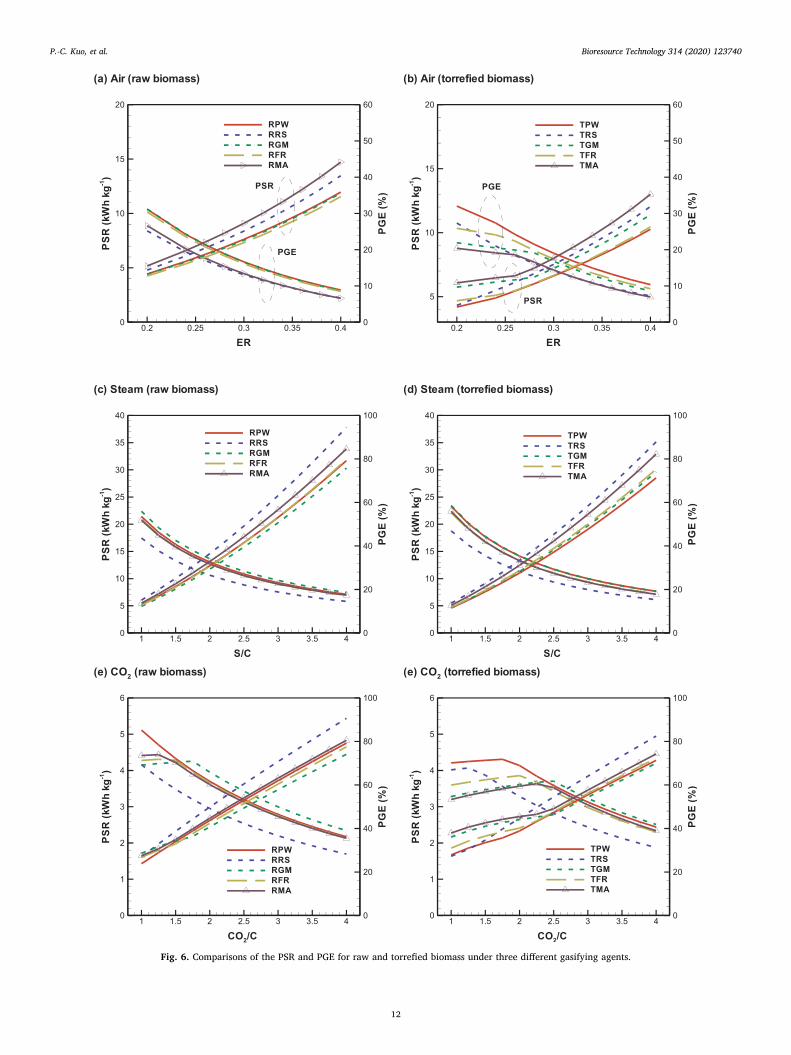
Fig. 6. Comparisons of the PSR and PGE for raw and torrefied biomass under three different gasifying agents.
P.-C. Kuo, et al. Bioresource Technology 314 (2020) 123740
12
and 0.26, respectively, whereas the value of PGE for TGM is lower ascompared to RGM. For the plasma gasification with steam, using tor-refied biomass can improve the PGE by factors of 2.31–8.86%. As far asthe plasma gasification with CO2 is concerned, the PGE is higher thanthat of raw biomass, when CO2/C ratio is larger than 1.75 for TPW, 1.25for TRS, 2.5 for TGM, 2 for TFR, and 2.25 for TMA. It should also benoted that a maximum distribution of PGE is found. This is because anincreased syngas yield is observed until it reaches a constant value atcertain CO2/C ratios (Fig. 4), except for RPW and RRS, in which theirsyngas yield is kept constant throughout the investigated CO2/C ratiorange.
From the above observations, it can be concluded that plasma ga-sification of raw and torrefied biomass with air is not recommendedbecause of low PGE. In contrast, torrefied biomass is an appropriate fuelfor the steam plasma gasification to produce H2-rich syngas due to itshigher syngas yield, LHV of the product gas, and PGE. However, if thePGE, nitrogenous, and sulfur impurities are considered together, TRS isnot recommended as a fuel due to higher pollutant emissions. As for theCO2 plasma gasification, although the maximum value of PGE fromtorrefied biomass is lower than raw one, TGM and TMA (except forTPW and TFR) are also a promising alternative fuel to replace RGM andRMA as a result of significant reduction in the emissions of total sulfurimpurities. It is thus possible to reduce the economic cost of acid gasremoval procedures in order to achieve the desired quality of syngas indownstream applications.
3.3. Effect of the biomass type on the plasma gasification performance
In order to find proper feedstocks for the plasma gasification,comparative results in terms of PSR and PGE for five types of raw andtorrefied biomass under three different reaction atmospheres areplotted in Fig. 6. For the air plasma gasification, although RFR has thelowest value of PSR, the values of PGE for RPW and RGM are betterthan RFR. In contrast to raw biomass, TPW has the lowest value of PSRand the highest value of PGE among the five torrefied biomass mate-rials, followed by TFR. For the steam plasma gasification, the values ofPGE from the highest to lowest are ranked as RGM > RPW >RFR≅RMA > RRS for raw biomass, while those for torrefied biomassit is TGM≅TPW > TMA≅TFR > TRS. It is noteworthy that the per-formance of pine wood chips is close to grape marc after torrefaction.With regard to the CO2 plasma gasification, RPW has the best perfor-mance in the CO2/C ratio range of 1–1.5. Once the CO2/C ratio is largerthan 1.5, RGM is notably superior to other raw biomass materials. Si-milarly, TPW is better than other torrefied ones when the CO2/C ratio iscontrolled between 1 and 2.25, whereas TGM gives the best PGE whenthe CO2/C ratio is larger than 2.25. It is thus concluded that pine woodchips have the greatest potential as a fuel for the plasma gasification,whereas rice straw is the least one among the five types of biomass.
In summary, although the combination of biomass torrefaction withplasma gasification is a promising technology to upgrade syngasquality, more investigation with respect to the economic and environ-mental feasibility of this technology is needed due to an energy-in-tensive system, and this will be carried out in detail during future re-search.
4. Conclusions
Different types of raw and torrefied biomass are selected for plasmagasification using three gasifying agents to assess their performances interms of syngas yield, LHV of the product gas, and PGE. The steamplasma gasification of torrefied biomass is recommended to generateH2-rich syngas, despite relatively higher amounts of nitrogenous speciesemitted. Notably, TGM and TMA even have lower sulfur impuritiescompared to raw state. Moreover, CO2 plasma gasification suggests thehighest value of PGE, whereas using air it is the lowest. From theviewpoints of energy and environment, TPW has the greatest potential
for plasma gasification of biomass.
CRediT authorship contribution statement
Po-Chih Kuo: Conceptualization, Writing - review & editing,Funding acquisition. Biju Illathukandy: Conceptualization, Writing -review & editing. Wei Wu: Conceptualization, Resources, Writing -review & editing. Jo-Shu Chang: Conceptualization, Writing - review &editing.
Declaration of Competing Interest
The authors declare that they have no known competing financialinterests or personal relationships that could have appeared to influ-ence the work reported in this paper.
Acknowledgments
The authors would like to thank the Ministry of Science andTechnology, Taiwan for the financial support of this research under thegrant MOST 108-2917-I-564-039.
Appendix A. Supplementary data
Supplementary data to this article can be found online at https://doi.org/10.1016/j.biortech.2020.123740.
References
Broer, K.M., Brown, R.C., 2015. The role of char and tar in determining the gas-phasepartitioning of nitrogen during biomass gasification. Appl. Energy 158, 474–483.
Chen, W.H., Kuo, P.C., 2011. Torrefaction and co-torrefaction characterization of hemi-cellulose, cellulose and lignin as well as torrefaction of some basic constituents inbiomass. Energy 36, 803–811.
Diaz, G., Sharma, N., Leal-Quiros, E., Munoz-Hernandez, A., 2015. Enhanced hydrogenproduction using steam plasma processing of biomass: Experimental apparatus andprocedure. Int. J. Hydrogen Energy 40, 2091–2098.
Favas, J., Monteiro, E., Rouboa, A., 2017. Hydrogen production using plasma gasificationwith steam injection. Int. J. Hydrogen Energy 42, 10997–11005.
Gai, C., Dong, Y., Zhang, T., 2014. Distribution of sulfur species in gaseous and condensedphase during downdraft gasification of corn straw. Energy 64, 248–258.
Guo, P., Saw, W.L., van Eyk, P.J., Stechel, E.B., de Nys, R., Ashman, P.J., et al., 2017.Gasification reactivity and physicochemical properties of the chars from raw andtorrefied wood, grape marc, and macroalgae. Energy Fuels 31, 2246–2259.
Hlina, M., Hrabovsky, M., Kopecky, V., Konrad, M., Kavka, T., Skoblja, S., 2006. Plasmagasification of wood and production of gas with low content of tar. In: In: 22ndSymposium on Plasma Physics and. Technology, pp. B1179–B1184.
Hlina, M., Hrabovsky, M., Kavka, T., Konrad, M., 2014. Production of high quality syngasfrom argon/water plasma gasification of biomass and waste. Waste Manag. 34,63–66.
Huang, J., Qiao, Y., Wei, X., Zhou, J., Yu, Y., Xu, M., 2019. Effect of torrefaction on steamgasification of starchy food waste. Fuel 253, 1556–1564.
Huang, X., Cheng, D.G., Chen, F., Zhan, X., 2013. Reaction pathways of b-D-glucopyr-anose pyrolysis to syngas in hydrogen plasma: A density functional theory study.Bioresource Technol. 143, 447–454.
Ismail, T.M., Monteiro, E., Ramos, A., El-Salam, M.A., Rouboa, A., 2019. An Eulerianmodel for forest residues gasification in a plasma gasifier. Energy 182, 1069–1083.
Janajreh, I., Raza, S.S., Valmundsson, A.S., 2013. Plasma gasification process: Modeling,simulation and comparison with conventional air gasification. Energy Convers.Manage. 65, 801–809.
Kaewluan, S., Pipatmanomai, S., 2011. Potential of synthesis gas production from rubberwood chip gasification in a bubbling fluidised bed gasifier. Energy Convers. Manage.52, 75–84.
Kai, X., Meng, Y., Yang, T., Li, B., Xing, W., 2019. Effect of torrefaction on rice strawphysicochemical characteristics and particulate matter emission behavior duringcombustion. Bioresource Technol. 278, 1–8.
Kim, K., Kim, Y., Yang, C., Moon, J., Kim, B., Lee, J., et al., 2013. Long-term operation ofbiomass-to-liquid systems coupled to gasification and Fischer-Tropsch processes forbiofuel production. Bioresource Technol. 127, 391–399.
Kuo, P.C., Wu, W., Chen, W.H., 2014. Gasification performances of raw and torrefiedbiomass in a downdraft fixed bed gasifier using thermodynamic analysis. Fuel 117,1231–1241.
Li, T., Wang, L., Ku, X., Guell, B.M., Løvås, T., Shaddix, C.R., 2015. Experimental andmodeling study of the effect of torrefaction on the rapid devolatilization of biomass.Energy Fuels 29, 4328–4338.
Liu, M., Aravind, P.V., 2014. The fate of tars under solid oxide fuel cell conditions: A
P.-C. Kuo, et al. Bioresource Technology 314 (2020) 123740
13

review. Appl. Therm. Eng. 70, 687–693.Marcello, M.D., Tsalidis, G.A., Spinelli, G., de Jong, W., Kiel, J.H.A., 2017. Pilot scale
steam-oxygen CFB gasification of commercial torrefied wood pellets. The effect oftorrefaction on the gasification performance. Biomass Bioenergy 105, 411–420.
Mazzoni, L., Janajreh, I., 2017. Plasma gasification of municipal solid waste with variablecontent of plastic solid waste for enhanced energy recovery. Int. J. Hydrogen Energy42, 19446–19457.
Minutillo, M., Perna, A., Bona, D.D., 2009. Modelling and performance analysis of anintegrated plasma gasification combined cycle (IPGCC) power plant. Energy Convers.Manage. 50, 2837–2842.
Misljenovic, N., Bach, Q.V., Tran, K.Q., Salas-Bringas, C., Skreiberg, O., 2014.Torrefaction influence on pelletability and pellet quality of norwegian forest residues.Energy Fuels 28, 2554–2561.
Munir, M.T., Mardon, I., Al-Zuhair, S., Shawabkeh, A., Saqib, N.U., 2019. Plasma gasi-fication of municipal solid waste for waste-to-value processing. Renew. Sustain.Energy Rev. 116 109461.
Oh, S.Y., Yun, S., Kim, J.K., 2018. Process integration and design for maximizing energyefficiency of a coalfired power plant integrated with amine-based CO2 capture pro-cess. Appl. Energy 216, 311–322.
Park, D.C., Day, S.J., Nelson, P.F., 2008. Formation of N-containing gas-phase speciesfrom char gasification in steam. Fuel 87, 807–814.
Phanphanich, M., Mani, S., 2011. Impact of torrefaction on the grindability and fuelcharacteristics of forest biomass. Bioresource Technol. 102, 1246–1253.
Pinto, F., Gominho, J., Andre, R.N., Gonçalves, D., Miranda, M., Varela, F., et al., 2017a.Effect of rice husk torrefaction on syngas production and quality. Energy Fuels 31,
5183–5192.Pinto, F., Gominho, J., Andre, R.N., Gonçalves, D., Miranda, M., Varela, F., et al., 2017b.
Improvement of gasification performance of Eucalyptus globulus stumps with tor-refaction and densification pre-treatments. Fuel 206, 289–299.
Ren, X., Sun, R., Meng, X., Vorobiev, N., Schiemann, M., Levendis, Y.A., 2017. Carbon,sulfur and nitrogen oxide emissions from combustion of pulverized raw and torrefiedbiomass. Fuel 310–323.
Rios, M.L.V., González, A.M., Lora, E.E.S., Olmo, O.A.A.D., 2018. Reduction of tar gen-erated during biomass gasification: A review. Biomass Bioenergy 108, 345–370.
Salaudeen, S.A., Acharya, B., Heidari, M., Arku, P., Dutta, A., 2018. Numerical in-vestigation of CO2 valorization via the steam gasification of biomass for producingsyngas with flexible H2 to CO ratio. J. CO2 Util. 27, 32–41.
Shie, J.L., Tsou, F.J., Lin, K.L., Chang, C.Y., 2010. Bioenergy and products from thermalpyrolysis of rice straw using plasma torch. Bioresource Technol. 101, 761–768.
Wang, M., Mao, M., Zhang, M., Wen, G., Yang, Q., Su, B., et al., 2019. Highly efficienttreatment of textile dyeing sludge by CO2 thermal plasma gasification. WasteManage. 90, 29–36.
Weiland, F., Nordwaeger, M., Olofsson, I., Wiinikka, H., Nordin, A., 2014. Entrained flowgasification of torrefied wood residues. Fuel Process. Technol. 125, 51–58.
Xi, D., Zhou, R., Zhou, R., Zhang, X., Ye, L., Li, J., et al., 2017. Mechanism and optimi-zation for plasma electrolytic liquefaction of sawdust. Bioresource Technol. 241,545–551.
Xue, G., Kwapinska, M., Horvat, A., Kwapinski, W., Rabou, L.P.L.M., Dooley, S., et al.,2014. Gasification of torrefied Miscanthusgiganteus in an air-blown bubbling flui-dized bed gasifier. Bioresource Technol. 159, 397–403.
P.-C. Kuo, et al. Bioresource Technology 314 (2020) 123740
14