plasma acylcarnitine levels increase with healthy aging
TRANSCRIPT

Plasma acylcarnitine levels increase with healthyagingZachery R. Jarrell, Emory UniversityM. Ryan Smith, Emory UniversityXin Hu, Emory UniversityMichael Orr, Emory UniversityKen H. Liu, Emory UniversityArshed Quyyumi, Emory UniversityDean Jones, Emory UniversityYoung-Mi Go, Emory University
Journal Title: Aging USVolume: Volume 12, Number 13Publisher: Impact Journals | 2020-07-15, Pages 13555-13570Type of Work: Article | Final Publisher PDFPublisher DOI: 10.18632/aging.103462Permanent URL: https://pid.emory.edu/ark:/25593/vgzjx
Final published version: http://dx.doi.org/10.18632/aging.103462
Copyright information:© Jarrell et al.This is an Open Access work distributed under the terms of the CreativeCommons Attribution 3.0 Unported License(https://creativecommons.org/licenses/by/3.0/).
Accessed November 25, 2021 10:39 PM EST

www.aging-us.com 13555 AGING
INTRODUCTION
Age is the number one risk factor for several human
health issues, those referred to as age-related diseases
[1, 2]. These age-related diseases grow in importance as
the median age of the world’s population continues to
increase [3, 4]. As a result, the molecular mechanisms
influencing aging have long been a topic of interest for
study [5–7]. Recent developments in the study of the
human metabolome have allowed for wide-spread study
of changes in the metabolome in association with aging
and age-related disease [1, 8, 9].
Acylcarnitines are carrier forms of fatty acids required
for import of long-chain (LC) fatty acids into mito-
chondria for β-oxidation to occur [10]. The most common
reported changes is an increase in blood concentration of
LC acylcarnitines in individuals with age-related diseases
[11–14]. Dysregulation of acylcarnitine homeostasis has
been tied to a variety of age-related diseases, including
cardiovascular disease [11, 12, 15], type II diabetes
mellitus [13, 16, 17], osteoarthritis [18], chronic
obstructive pulmonary disease [19], macular degeneration
[14], glaucoma [20] and Alzheimer’s disease [21–23]. In
addition to the association with age-related diseases,
abnormal acylcarnitine levels are associated with
activation of inflammation [24] and mitochondrial
dysfunction [25, 26]. Loss of mitochondrial function both
contributes to the process of aging and is, itself, an
indirect result of aging. Mitochondrial dysfunction has
been documented to play a role in development of most
age-related diseases; however, it occurs independently of
www.aging-us.com AGING 2020, Vol. 12, No. 13
Research Paper
Plasma acylcarnitine levels increase with healthy aging
Zachery R. Jarrell1, M. Ryan Smith1, Xin Hu1, Michael Orr1, Ken H. Liu1, Arshed A. Quyyumi2, Dean P. Jones1, Young-Mi Go1 1Division of Pulmonary, Allergy and Critical Care Medicine, Atlanta, GA 30322, USA 2Division of Cardiology, Emory University School of Medicine, Atlanta, GA 30322, USA Correspondence to: Dean P. Jones, Young-Mi Go; email: [email protected], [email protected] Keywords: aging, carnitine, lipid metabolism, mitochondria Received: February 21, 2020 Accepted: May 27, 2020 Published: June 16, 2020 Copyright: Jarrell et al. This is an open-access article distributed under the terms of the Creative Commons Attribution License (CC BY 3.0), which permits unrestricted use, distribution, and reproduction in any medium, provided the original author and source are credited.
ABSTRACT
Acylcarnitines transport fatty acids into mitochondria and are essential for β-oxidation and energy metabolism. Decreased mitochondrial activity results in increased plasma acylcarnitines, and increased acylcarnitines activate proinflammatory signaling and associate with age-related disease. Changes in acylcarnitines associated with healthy aging, however, are not well characterized. In the present study, we examined the associations of plasma acylcarnitines with age (range: 20-90) in 163 healthy, non-diseased individuals from the predictive medicine research cohort (NCT00336570) and tested for gender-specific differences. The results show that long-chain and very long-chain acylcarnitines increased with age, while many odd-chain acylcarnitines decreased with age. Gender-specific differences were observed for several acylcarnitines, e.g., eicosadienoylcarnitine varied with age in males, and hydroxystearoylcarnitine varied in females. Metabolome-wide association study (MWAS) of age-associated acylcarnitines with all untargeted metabolic features showed little overlap between genders. These results show that plasma concentrations of acylcarnitines vary with age and gender in individuals selected for criteria of health. Whether these variations reflect mitochondrial dysfunction with aging, mitochondrial reprogramming in response to chronic environmental exposures, early pre-disease change, or an adaptive response to healthy aging, is unclear. The results highlight a potential utility for untargeted metabolomics research to elucidate gender-specific mechanisms of aging and age-related disease.
www.aging-us.com 13556 AGING
disease [27–29]. Additionally, healthy older individuals
require more time to reestablish acylcarnitine homeostasis
after stimulation with insulin, and higher acylcarnitine
levels are found in aged men with reduced physical ability
when compared with similarly aged men with normal
physical ability [30, 31]. Gender differences in
acylcarnitine associations with age have not been well
studied, but some differences between men and women
have been reported [32, 33]. Additionally, gender
differences in lipid metabolites related to lifespan have
been reported [34].
Neither LC acyl-CoA nor free LC fatty acids can
migrate across the inner membrane of the mitochondria,
so the formation of acylcarnitines is critical to
metabolism of LC fatty acids [35]. This system, termed
the carnitine shuttle [see Reuter & Evans [25] for
review], normally maintains carnitine and acylcarnitine
within a narrow range [35]. This ensures normal
functioning of fatty acid β-oxidation as well as adequate
availability of CoA. Acylcarnitines are also transported
into plasma [25], and as a consequence, plasma acyl-
carnitine levels can serve as an indicator of mito-
chondrial function [36].
Despite the known relationship between acylcarnitine
homeostasis and mitochondrial function, investigations
of acylcarnitines have focused primarily on diseased
populations, and little attention has been given to
differences in acylcarnitine homeostasis between
healthy men and women. The current study was
designed to test whether acylcarnitines vary by age and
gender in a healthy, non-diseased population. Results
from high-resolution metabolomics (HRM) analyses
show that LC and very long-chain (VLC) acylcarnitines
increase with age and have gender-specific differences
in healthy individuals.
RESULTS
Study population demographics
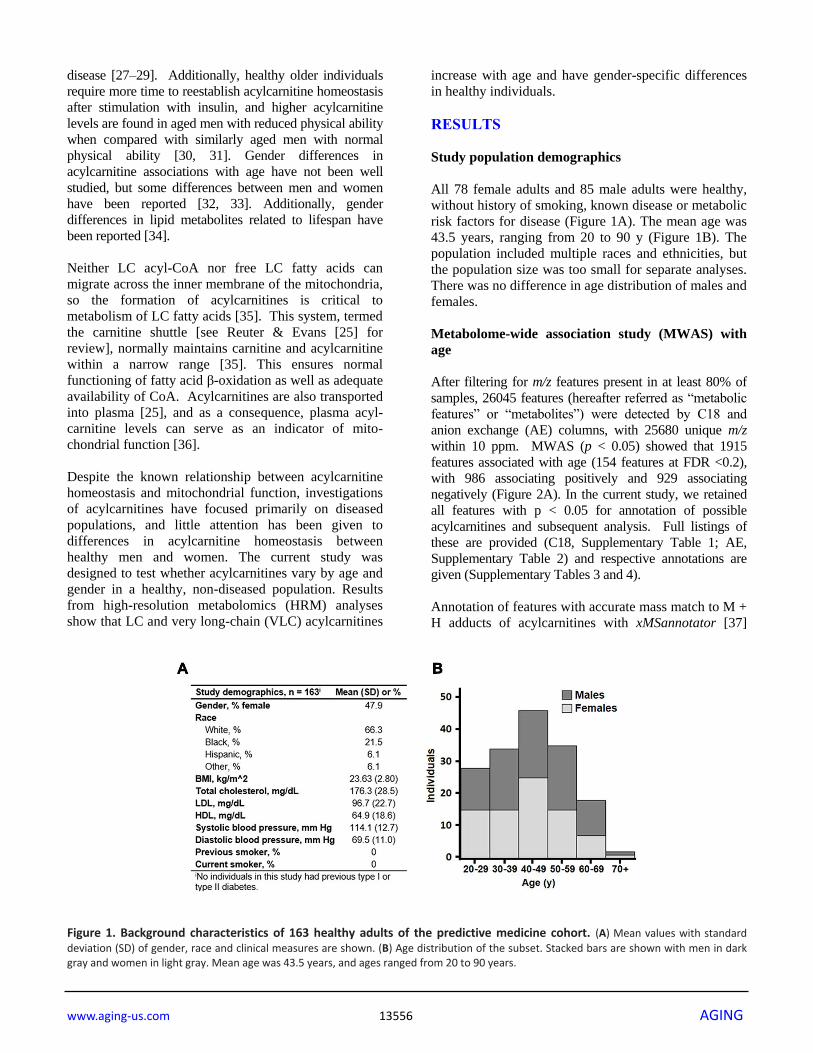
All 78 female adults and 85 male adults were healthy,
without history of smoking, known disease or metabolic
risk factors for disease (Figure 1A). The mean age was
43.5 years, ranging from 20 to 90 y (Figure 1B). The
population included multiple races and ethnicities, but
the population size was too small for separate analyses.
There was no difference in age distribution of males and
females.
Metabolome-wide association study (MWAS) with
age
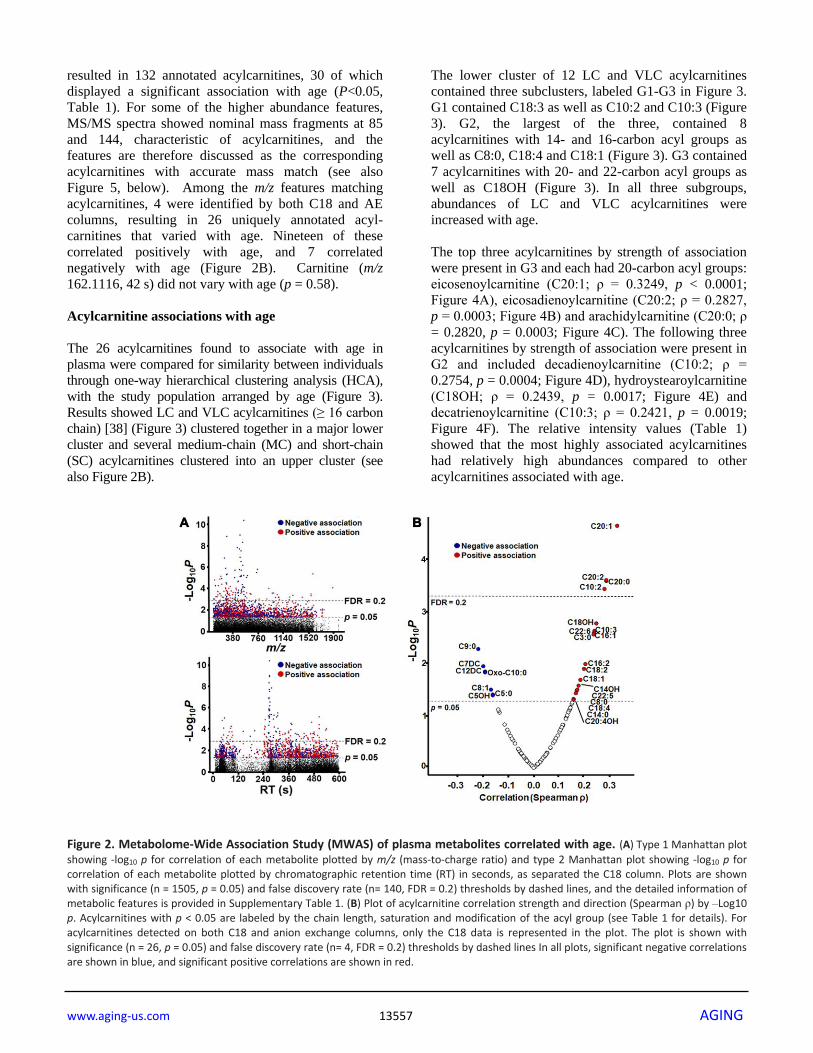
After filtering for m/z features present in at least 80% of
samples, 26045 features (hereafter referred as “metabolic
features” or “metabolites”) were detected by C18 and
anion exchange (AE) columns, with 25680 unique m/z
within 10 ppm. MWAS (p < 0.05) showed that 1915
features associated with age (154 features at FDR <0.2),
with 986 associating positively and 929 associating
negatively (Figure 2A). In the current study, we retained
all features with p < 0.05 for annotation of possible
acylcarnitines and subsequent analysis. Full listings of
these are provided (C18, Supplementary Table 1; AE,
Supplementary Table 2) and respective annotations are
given (Supplementary Tables 3 and 4).
Annotation of features with accurate mass match to M +
H adducts of acylcarnitines with xMSannotator [37]
Figure 1. Background characteristics of 163 healthy adults of the predictive medicine cohort. (A) Mean values with standard
deviation (SD) of gender, race and clinical measures are shown. (B) Age distribution of the subset. Stacked bars are shown with men in dark gray and women in light gray. Mean age was 43.5 years, and ages ranged from 20 to 90 years.
www.aging-us.com 13557 AGING
resulted in 132 annotated acylcarnitines, 30 of which
displayed a significant association with age (P<0.05,
Table 1). For some of the higher abundance features,
MS/MS spectra showed nominal mass fragments at 85
and 144, characteristic of acylcarnitines, and the
features are therefore discussed as the corresponding
acylcarnitines with accurate mass match (see also
Figure 5, below). Among the m/z features matching
acylcarnitines, 4 were identified by both C18 and AE
columns, resulting in 26 uniquely annotated acyl-
carnitines that varied with age. Nineteen of these
correlated positively with age, and 7 correlated
negatively with age (Figure 2B). Carnitine (m/z
162.1116, 42 s) did not vary with age (p = 0.58).
Acylcarnitine associations with age
The 26 acylcarnitines found to associate with age in
plasma were compared for similarity between individuals
through one-way hierarchical clustering analysis (HCA),
with the study population arranged by age (Figure 3).
Results showed LC and VLC acylcarnitines (≥ 16 carbon
chain) [38] (Figure 3) clustered together in a major lower
cluster and several medium-chain (MC) and short-chain
(SC) acylcarnitines clustered into an upper cluster (see
also Figure 2B).
The lower cluster of 12 LC and VLC acylcarnitines
contained three subclusters, labeled G1-G3 in Figure 3.
G1 contained C18:3 as well as C10:2 and C10:3 (Figure
3). G2, the largest of the three, contained 8
acylcarnitines with 14- and 16-carbon acyl groups as
well as C8:0, C18:4 and C18:1 (Figure 3). G3 contained
7 acylcarnitines with 20- and 22-carbon acyl groups as
well as C18OH (Figure 3). In all three subgroups,
abundances of LC and VLC acylcarnitines were
increased with age.
The top three acylcarnitines by strength of association
were present in G3 and each had 20-carbon acyl groups:
eicosenoylcarnitine (C20:1; ρ = 0.3249, p < 0.0001;
Figure 4A), eicosadienoylcarnitine (C20:2; ρ = 0.2827,
p = 0.0003; Figure 4B) and arachidylcarnitine (C20:0; ρ
= 0.2820, p = 0.0003; Figure 4C). The following three
acylcarnitines by strength of association were present in
G2 and included decadienoylcarnitine (C10:2; ρ =
0.2754, p = 0.0004; Figure 4D), hydroystearoylcarnitine
(C18OH; ρ = 0.2439, p = 0.0017; Figure 4E) and
decatrienoylcarnitine (C10:3; ρ = 0.2421, p = 0.0019;
Figure 4F). The relative intensity values (Table 1)
showed that the most highly associated acylcarnitines
had relatively high abundances compared to other
acylcarnitines associated with age.
Figure 2. Metabolome-Wide Association Study (MWAS) of plasma metabolites correlated with age. (A) Type 1 Manhattan plot
showing -log10 p for correlation of each metabolite plotted by m/z (mass-to-charge ratio) and type 2 Manhattan plot showing -log10 p for correlation of each metabolite plotted by chromatographic retention time (RT) in seconds, as separated the C18 column. Plots are shown with significance (n = 1505, p = 0.05) and false discovery rate (n= 140, FDR = 0.2) thresholds by dashed lines, and the detailed information of metabolic features is provided in Supplementary Table 1. (B) Plot of acylcarnitine correlation strength and direction (Spearman ρ) by –Log10 p. Acylcarnitines with p < 0.05 are labeled by the chain length, saturation and modification of the acyl group (see Table 1 for details). For acylcarnitines detected on both C18 and anion exchange columns, only the C18 data is represented in the plot. The plot is shown with significance (n = 26, p = 0.05) and false discovery rate (n= 4, FDR = 0.2) thresholds by dashed lines In all plots, significant negative correlations are shown in blue, and significant positive correlations are shown in red.

www.aging-us.com 13558 AGING
Table 1. Correlation of acylcarnitines with age.
m/z RT (s)
SLC Database Common name Median intensity
Correlation (ρ)
p-value
C18 positive 162.1116 42 2b HMDB00062 Carnitine (C0) 3.60E6 -0.0437 0.5797 454.3869 470 3 LMFA07070010 Eicosenoylcarnitine (C20:1) 2.60E5 0.3249 2.32E-5 452.3712 391 3 LMFA07070011 Eicosadienoylcarnitine (C20:2) 1.78E5 0.2827 2.56E-4 456.4025 465 3 HMDB06460 Arachidyl carnitine (C20:0) 9.27E4 0.282 2.65E-4 312.2154 93 3 HMDB13325 Decadienoylcarnitine (C10:2) 3.01E5 0.2754 3.73E-4 444.3665 348 3 LMFA07070028 Hydroxystearoylcarnitine (C18OH) 7.27E4 0.2439 1.70E-3 310.1998 76 3 LMFA07070016 Decatrienoylcarnitine (C10:3)* 1.03E6 0.2363 2.39E-3 472.3387 335 3 HMDB06510 Docosahexaenoylcarnitine (C22:6) 2.42E4 0.2344 2.60E-3 398.3245 334 3 HMDB06317 Hexadecenoylcarnitine (C16:1)* 6.73E5 0.2341 2.63E-3 218.1375 258 2b HMDB00824 Propionylcarnitine (C3:0) 5.14E4 0.2327 2.79E-3 396.3088 313 3 HMDB13334 Hexadecadienoylcarnitine (C16:2)* 2.30E5 0.2005 0.0103 422.3244 323 3 HMDB06318 Octadecatrienoylcarnitine (C18:3) 2.19E5 0.1947 0.0128 388.3037 286 3 HMDB13166 Hydroxymyristoylcarnitine (C14OH) 1.21E5 0.1735 0.0268 474.3564 347 3 HMDB06321 Docosapentaenoylcarnitine (C22:5) 4.26E4 0.1683 0.0318 420.3089 314 3 HMDB06463 Octadecatetraenoylcarnitine (C18:4) 2.62E4 0.1553 0.0478
464.3352 309 3 LMFA07070036 Hydroxyicosatetraenoylcarnitine
(C20:4OH) 4.94E3 0.1539 0.0498
262.1637 258 2b LMFA07070041 Hydroxyvalerylcarnitine (C5OH) 1.51E4 -0.1602 0.0411 246.1687 265 2b HMDB13128 Valerylcarnitine (C5:0)* 5.07E4 -0.1612 0.0398 374.2519 311 3 HMDB13327 Dodecanedioylcarnitine (C12DC) 8.53E4 -0.1914 0.0144 304.1741 257 3 HMDB13328 Pimelylcarnitine (C7DC) 2.97E4 -0.1976 0.0114 302.231 301 3 HMDB13288 Nonanoylcarnitine (C9:0) 6.07E4 -0.2174 5.30E-3
Anion exchange 310.2014 57 3 LMFA07070016 Decatrienoylcarnitine (C10:3)* 3.30E5 0.2421 1.85E-3 398.3265 76 3 HMDB13207 Hexadecenoylcarnitine (C16:1)* 3.68E5 0.1945 0.0128 426.3576 111 3 HMDB06351 Octadecenoylcarnitine (C18:1) 2.55E6 0.1808 0.0209 396.3108 65 3 HMDB13334 Hexadecadienoylcarnitine (C16:2)* 1.21E5 0.1723 0.0279 369.2828 59 3 HMDB13331 Tetradecadienoylcarnitine (C14:2) 1.20E5 0.1682 0.0318 288.2169 63 2b HMDB00791 Octanoylcarnitine (C8:0) 5.17E5 0.1632 0.0374 372.3109 71 3 HMDB05066 Myristoylcarnitine (C14:0) 2.51E5 0.1547 0.0486 286.2013 570 2b HMDB13324 Octenoylcarnitine (C8:1) 2.72E4 -0.1681 0.032 246.1698 581 2b HMDB13128 Valerylcarnitine (C5:0)* 7.13E3 -0.1778 0.0232 330.2272 584 3 HMDB13202 Ketodecanoylcarnitine (Oxo-C10) 2.08E3 -0.1905 0.0149
Correlation analyzed by Spearman (ρ) and significance of correlation (p-value) are shown for each acylcarnitine detected on both C18 and anion exchange columns. Mass-to-charge ratio (m/z), retention time (RT), Schymanski level of confidence (SLC), and Human Metabolome Database (HMDB) or Lipid Maps (LMFA) database identifier are given for each acylcarnitine. Although no significant correlation was found for free carnitine (C0), values are given for reference. A SLC of 3 indicates a putative identification using LCMS data, whereas a SLC of 2b indicates a probable match using additional diagnostic MS/MS data. All acylcarnitines were detected as an M + H adduct. *, acylcarnitine identified by both C18 and anion exchange.
In contrast to the pattern of the LC and VLC
acylcarnitines, which increased with age, the MC and SC
cluster decreased in association with age (Figures 2B, 3).
These were all relatively low abundance signals (Table
1). The MC and SC cluster included odd-chain (OC; C5,
C7, C9) acylcarnitines, all of which decreased in
association with age (Figure 3). The MC and SC cluster
also contained features matching acylcarnitine
derivatives of two dicarboxylic acids (DC) (Figures 2B,
3). Propionylcarnitine (C3:0) was present in the MC and
SC cluster but did not decrease with age unlike the other
OC acylcarnitines (see also Figure 2B). MS/MS
fragmentation supported the identity of valerylcarnitine
(C5:0; Figure 5A), hydroxyvalerylcarnitine (C5OH;
Figure 5B), octenoylcarnitine (C8:1; Figure 5C) and
octanoylcarnitine (C8:0; Figure 5D) relative to database
spectra for methylbutyroylcarnitine. C5:0 matched
several fragments for methylbutyroylcarnitine (Figure
5A). C5OH, C8:1 and C8:0 matched with methyl-
butyroylcarnitine, with the exception of one major
fragment. The mass difference for fragments matched the
mass differences present between the given acylcarnitine
and methylbutyroylcarnitine (Figure 5B–5D).
Tests for correlations among the acylcarnitines in
Figure 3 showed that the high-abundance LC and VLC
metabolites in G3 were highly positively correlated
with each other, with the one exception of C22:6,
which did not correlate with any other LC or VLC
acylcarnitines (Supplementary Table 5). In contrast, these
LC and VLC acylcarnitines were not correlated, either
positively or negatively, with carnitine or acetylcarnitine.

www.aging-us.com 13559 AGING
Figure 3. Heat map of one-way hierarchical clustering analysis (HCA) of the 26 acylcarnitines significantly associating with age. Along the x-axis, individuals are organized by age, with youngest on the left. The y-axis is comprised of the one-way HCA of
acylcarnitines. Each column represents an individuals’ metabolic profile of the 35 acylcarnitines. Degree of deviation of acylcarnitine concentration below the mean of the study population are indicated by saturation of blue coloration, and degree of deviation of acylcarnitine concentration above the mean of the study population are indicated by saturation of red coloration. Short-chain and medium-chain acylcarnitines are labeled in gray, and long-chain and very-long-chain acylcarnitines are highlighted by labeling in black. For acylcarnitines detected on both C18 and anion exchange columns, only the C18 data was included in the HCA. The lower major acylcarnitine cluster is labeled by its subgroups, G1-3.
Figure 4. Highest correlations of acylcarnitines with age in human plasma. Log2 transformed intensity values for ions, identified by
mass-to-charge ratio (m/z) and retention time (RT) for individual plasma samples are plotted against individual ages. Confidence intervals (95%) are shown in gray. (A) Eicosenoylcarnitine (C20:1), (B) eicosadienoylcarnitine (C20:2), (C) arachidylcarnitine (C20:0) and (D) decadienoylcarnitine (C10:2) were significant at FDR = 0.2. (E) Hydroxystearoylcarnitine (C18OH) and (F) decatrienoylcarnitine (C10:3) were significant at p < 0.05.
www.aging-us.com 13560 AGING
Propionylcarnitine was associated with arachidylcarnitine
C20:0 (ρ = 0.2968, p = 0.0001). Few associations
occurred among MC and SC acylcarnitines (Sup-
plementary Table 5). Acylcarnitines with a 10-carbon acyl
group as well as C14OH had associations with LC and
VLC acylcarnitines (Supplementary Table 5). OC acyl-
carnitines had few correlations; only C9:0 correlated with
C5:0 (ρ = 0.3561, p < 0.0001) and C7DC (ρ = 0.3583, p <
0.0001; Supplementary Table 5). Hydroxyvalerylcarnitine
(C5OH) showed no correlation with any other OC
acylcarnitines.
Gender differences in acylcarnitine associations with
age
The 6 acylcarnitines with greatest positive rho value
were examined for their associations with age when
individuals were separated by gender. This separation
by gender did not show stronger correlation of
acylcarnitines with age (Table 2) than observed for the
combined analyses (Fig 5). Comparisons of genders
show that C20:1 and C20:2 exhibited stronger
correlations with age in males than females while
C20:0, C10:2, C18OH and C10:3 exhibited slightly
stronger correlations with age in females than males.
The xMWAS analysis of these 6 acylcarnitines against
the remainder of the metabolome in each gender
resulted in different clustering within each network (Fig
6). The female network grouped into 5 distinct clusters,
with separate clusters for C18OH, C20:0, C20:1 and
C20:2 (Clusters 1, 2, 4 and 5, respectively), and C10:2
and C10:3 (Cluster 3) were consolidated into one cluster
of metabolites (Figure 6A). Relative to females, the
male network grouped more tightly resulting in 4
clusters, with C20:1 and C20:2 in Cluster 4 (Figure 6B).
Additionally, the three 20 carbon acylcarnitines showed
associations with more metabolites in the males
compared to females.
Metabolites associated with these 6 acylcarnitines
shared little commonality between females and males,
with less than 11% of those metabolites included in the
female network also being present in the male network.
Annotations of the features in the female and male
xMWAS networks are provided in Supplementary
Tables 6 and 7, respectively. Pathway enrichment
analyses of the metabolic features associated in both
the female and male xMWAS networks resulted in
distinctly different pathways associating with age-
associated acylcarnitines in women and in men.
Figure 5. Identification of acylcarnitines by MS/MS. Experimental MS/MS fragmentations of (A) valerylcarnitine, (B)
hydroxyvalerylcarnitine, (C) octenoylcarnitine and (D) octanoylcarnitine are juxtaposed below a library MS/MS fragmentation of methylbutyroylcarnitine. Diagnostic fragments common between library and experimental fragmentations are labeled. Pertinent MS/MS peaks are labeled for mass-to-charge ratio (m/z) by broken line. Additionally, distinctive fragments equivalent in mass difference to that of the mass difference between the represented acylcarnitine and methylbutyroylcarnitine are labeled with proposed fragment structure displayed. MS/MS peaks and matching proposed fragment structure are labeled by dotted line.

www.aging-us.com 13561 AGING
Table 2. Comparison of correlations of acylcarnitines with age by gender.
Name Structure Female
(ρ, p)
Male
(ρ, p)
Eicosenoylcarnitine C20:1 0.2828, 0.0121 0.3551, 8.55E-4
Eicosadienoylcarnitine C20:2 0.1344, 0.2409 0.3693, 5.04E-4
Arachidylcarnitine C20:0 0.3078, 6.11E-3 0.2397, 0.0271
Decadienoylcarnitine C10:2 0.3194, 4.37E-3 0.2323, 0.0324
Hydroxystearoylcarnitine C18OH 0.3455, 2.95E-3 0.1457, 0.1845
Decatrienoylcarnitine C10:3 0.2456, 0.0330 0.2304, 0.0365
For the 6 acylcarnitines with the highest correlation with age in the whole population, correlation with age by gender was tested. Spearman’s ρ and p-value are shown for correlations in females and males.
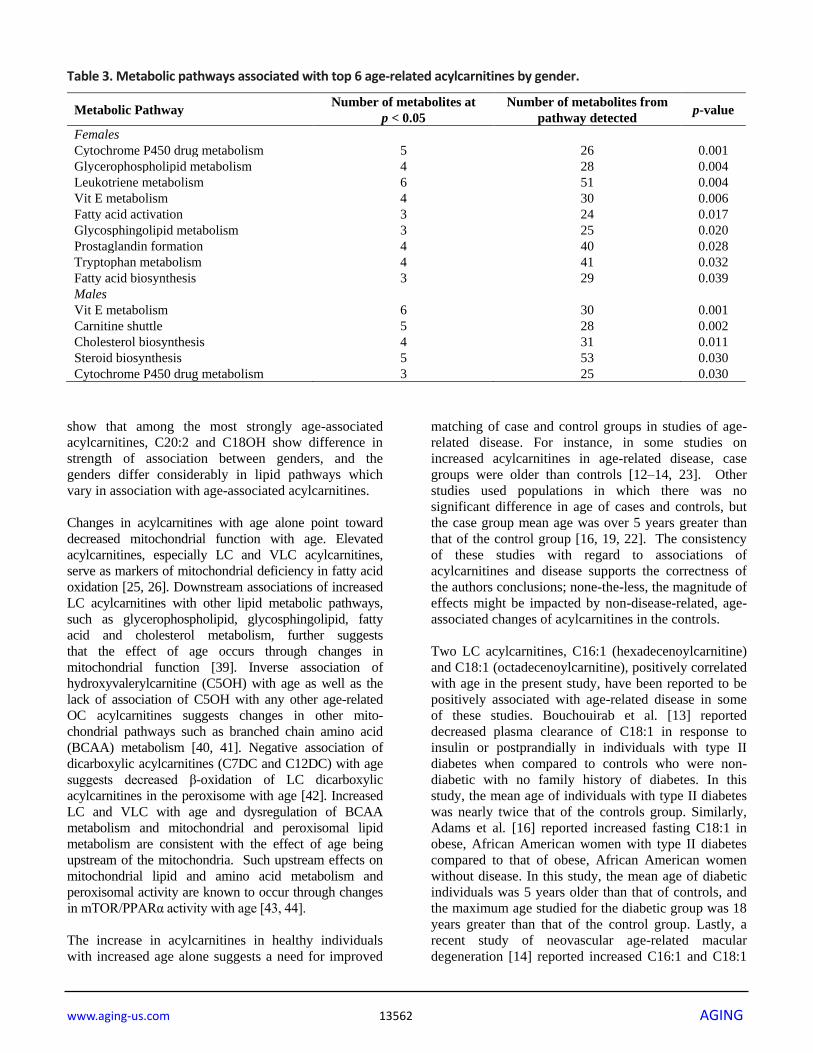
Cytochrome P450 metabolism (females: p = 0.001;
males: p = 0.030) and vitamin E metabolism (females: p
= 0.006; males: p = 0.001) changed in association with
age-associated acylcarnitines in both genders (Table 3).
In females, glycerophospholipid metabolism (p =
0.004), leukotriene metabolism (p = 0.004), fatty acid
activation (p = 0.017), glycosphingolipid metabolism (p
= 0.020), prostaglandin formation (p = 0.028),
tryptophan metabolism (p = 0.032) and fatty acid
biosynthesis (p = 0.039) changed in association with
age-associated acylcarnitines (Table 3). In males, the
carnitine shuttle (p = 0.002), cholesterol biosynthesis (p
= 0.011) and steroid biosynthesis (p = 0.030) changed in
association with age-associated acylcarnitines (Table 3).
DISCUSSION
Our results show that plasma LC and VLC
acylcarnitines increase with age in healthy individuals.
In individuals with no age-related disease nor metabolic
risk factors, all age-associated acylcarnitines with acyl
groups of carbon chains 16 carbons or longer increased
in association with age. All OC acylcarnitines except
for C3:0 were decreased with age. The results also
Figure 6. Association of top 6 age-associated acylcarnitines with metabolome. (A) xMWAS network of top 6 age-associated
acylcarnitines as associated with metabolome within females. Cluster 1 (orange) has features predominantly associated with hydroxystearoylcarnitine (C18OH). Cluster 2 (green) is comprised of features associated most closely with arachidylcarnitine (C20:0). Cluster 3 (yellow) contains features clustered around decadienoylcarnitine (C10:2) and decatrienoylcarnitine (C10:3). Cluster 4 (dark blue) has features mainly associated with eicosenoylcarnitine (C20:1). Cluster 5 (light blue) has features mainly associated with eicosadienoylcarnitine (C20:2). See Supplementary Table 6 for detailed annotation of metabolites included in the female network. (B) xMWAS network of top 6 age-associated acylcarnitines as associated with metabolome within males. Clusters 1-3 form around the same acylcarnitines as their respective acylcarnitines in the female subset. Cluster 4 (blue) has features mainly associated with both C20:1 and C20:2. See Supplementary Table 7 for detailed annotation of metabolites included in the male network. Positive associations are shown in red, while negative associations are shown with blue lines.
www.aging-us.com 13562 AGING
Table 3. Metabolic pathways associated with top 6 age-related acylcarnitines by gender.
Metabolic Pathway Number of metabolites at
p < 0.05
Number of metabolites from
pathway detected p-value
Females
Cytochrome P450 drug metabolism 5 26 0.001
Glycerophospholipid metabolism 4 28 0.004
Leukotriene metabolism 6 51 0.004
Vit E metabolism 4 30 0.006
Fatty acid activation 3 24 0.017
Glycosphingolipid metabolism 3 25 0.020
Prostaglandin formation 4 40 0.028
Tryptophan metabolism 4 41 0.032
Fatty acid biosynthesis 3 29 0.039
Males
Vit E metabolism 6 30 0.001
Carnitine shuttle 5 28 0.002
Cholesterol biosynthesis 4 31 0.011
Steroid biosynthesis 5 53 0.030
Cytochrome P450 drug metabolism 3 25 0.030
show that among the most strongly age-associated
acylcarnitines, C20:2 and C18OH show difference in
strength of association between genders, and the
genders differ considerably in lipid pathways which
vary in association with age-associated acylcarnitines.
Changes in acylcarnitines with age alone point toward
decreased mitochondrial function with age. Elevated
acylcarnitines, especially LC and VLC acylcarnitines,
serve as markers of mitochondrial deficiency in fatty acid
oxidation [25, 26]. Downstream associations of increased
LC acylcarnitines with other lipid metabolic pathways,
such as glycerophospholipid, glycosphingolipid, fatty
acid and cholesterol metabolism, further suggests
that the effect of age occurs through changes in
mitochondrial function [39]. Inverse association of
hydroxyvalerylcarnitine (C5OH) with age as well as the
lack of association of C5OH with any other age-related
OC acylcarnitines suggests changes in other mito-
chondrial pathways such as branched chain amino acid
(BCAA) metabolism [40, 41]. Negative association of
dicarboxylic acylcarnitines (C7DC and C12DC) with age
suggests decreased β-oxidation of LC dicarboxylic
acylcarnitines in the peroxisome with age [42]. Increased
LC and VLC with age and dysregulation of BCAA
metabolism and mitochondrial and peroxisomal lipid
metabolism are consistent with the effect of age being
upstream of the mitochondria. Such upstream effects on
mitochondrial lipid and amino acid metabolism and
peroxisomal activity are known to occur through changes
in mTOR/PPARα activity with age [43, 44].
The increase in acylcarnitines in healthy individuals
with increased age alone suggests a need for improved
matching of case and control groups in studies of age-
related disease. For instance, in some studies on
increased acylcarnitines in age-related disease, case
groups were older than controls [12–14, 23]. Other
studies used populations in which there was no
significant difference in age of cases and controls, but
the case group mean age was over 5 years greater than
that of the control group [16, 19, 22]. The consistency
of these studies with regard to associations of
acylcarnitines and disease supports the correctness of
the authors conclusions; none-the-less, the magnitude of
effects might be impacted by non-disease-related, age-
associated changes of acylcarnitines in the controls.
Two LC acylcarnitines, C16:1 (hexadecenoylcarnitine)
and C18:1 (octadecenoylcarnitine), positively correlated
with age in the present study, have been reported to be
positively associated with age-related disease in some
of these studies. Bouchouirab et al. [13] reported
decreased plasma clearance of C18:1 in response to
insulin or postprandially in individuals with type II
diabetes when compared to controls who were non-
diabetic with no family history of diabetes. In this
study, the mean age of individuals with type II diabetes
was nearly twice that of the controls group. Similarly,
Adams et al. [16] reported increased fasting C18:1 in
obese, African American women with type II diabetes
compared to that of obese, African American women
without disease. In this study, the mean age of diabetic
individuals was 5 years older than that of controls, and
the maximum age studied for the diabetic group was 18
years greater than that of the control group. Lastly, a
recent study of neovascular age-related macular
degeneration [14] reported increased C16:1 and C18:1
www.aging-us.com 13563 AGING
in diseased individuals compared to controls. Their
study controlled for age in the analysis, and the mean
age for both groups was above 70 years old. Our
present study mostly had individuals 20-70 years of age,
and this limits conclusions which may be drawn from
comparisons.
The difference in direction of association of C3:0
compared to all other OC acylcarnitines may be a result
of decreased flux with age because propionyl-CoA is a
product of OC fatty acid β-oxidation [45]. Increased
C3:0 with age may be indicative of an age-related
change in metabolism of OC LC fatty acids, which have
been shown to associate negatively with heart disease
and type II diabetes [46, 47]; however, we observed no
association of OC LC acylcarnitines with age.
Alternatively, the decrease in C5:0, C7DC and C9:0
with age may be a result of decreased dairy
consumption with age, as dairy products are an
important source of OC fatty acids in the diet [48, 49].
This increase in C3:0 with age could also be due to age-
related differences in composition of the microbiome or
in dietary fiber intake [50]; these parameters were not
assessed in our study population. Future study of
metabolic flux using stable isotope-labeled OC fatty
acids could shed light on whether this observation is
due to an age-related change in metabolism or an
external factor such as dietary fiber or dairy intake.
As with previously noted differences in acylcarnitine
association with age in men and women, we also found
differences in strength of association of several
acylcarnitines with age between genders. Previously,
Muilwijk et al. [33] reported an increase in concentrations
of several acylcarnitines with age in individuals who were
without age-related disease but whose clinical measures
were not controlled. They noted that increases observed in
acylcarnitines with age were higher in women, and
several more significant changes in acylcarnitines with
age were reported for women than were for men. Yu et al.
[32] reported C18:1 as a correlate with age in both men
and women; however, in women the relationship was
much stronger. In neither of these studies were the
differences in strengths of correlation a focus. Similarly,
our data show that there is difference between the genders
in how strongly acylcarnitines associate with age. Our
study shows different associations of acylcarnitines with
the remainder of metabolism. Generally, women exhibited
more lipid metabolic pathways which were altered in
association with age-associated acylcarnitines. In addition
to this, women exhibited changes in leukotriene
metabolism, prostaglandin formation and tryptophan
metabolism in association with age-associated acyl-
carnitines. Association of these inflammatory-related
pathways with age-associated acylcarnitines in women
but not in men support previous findings that gender
differences in inflammatory pathways tend to magnify in
old age [51–54].
The present study used stringent selection criteria for
health of individuals studied; however, the population
was small and cannot be considered representative of
the general population, especially for racial and ethnic
comparisons. Additionally, this was a cross-sectional
study of individuals at different ages and does not
address longitudinal changes within individuals as a
result of aging. Studies are needed to evaluate changes
in acylcarnitines which occur as a result of loss of
mitochondrial function and other physiological
measures of aging, such as telomeric shortening, loss of
proteostasis, deregulated nutrient-sensing or physical
frailty [55, 56].
In summary, the present results show that abundant
acylcarnitines increase in plasma with age in healthy
individuals. The results emphasize the importance of
strict control for age in metabolomic studies of age-
related diseases in order to account for metabolic
alterations which occur as an adaptive response in
healthy aging regardless of disease state. The study also
shows important gender differences in glycerolipids and
other metabolic networks linked to acylcarnitines that
vary by age. Thus, the results provide justification for
detailed studies of lipid metabolism in aging,
specifically to understand gender differences which
could impact underlying gender-specific disease
mechanisms.
MATERIALS AND METHODS
Chemicals
HPLC grade acetonitrile and methanol, LC-MS water and
98% formic acid were obtained from Sigma-Aldrich (St.
Louis, MO). A mixture of 14 stable isotopic chemicals
used as an internal standard [57] included [13C6]-D-
glucose, [15N]-indole, [2-15N]-L-lysine dihydrochloride,
[13C5]-L-glutamic acid, [13C7]-benzoic acid, [3,4-13C2]-
cholesterol, [15N]-L-tyrosine, [trimethyl-13C3]-caffeine,
[15N2]-uracil, [3,3-13C2]-cystine, [1,2-13C2]-palmitic acid,
[15N,13C5]-L-methionine, [15N]-choline chloride and 2’-
deoxyguanosine-15N2,13C10-5’-monophosphate from
Cambridge Isotope Laboratories, Inc (Andover, PA).
Human plasma samples
A subset of samples (n = 163) from the Predictive
Medicine Research (PREMED) cohort (ClinicalTrials.gov
Identifier: NCT00336570) was used; the subset
represented all available samples and did not appear to
have selection bias. The study was reviewed and approved
by the Emory University Investigational Review Board

www.aging-us.com 13564 AGING
(IRB00024767). PREMED subjects were healthy
individuals between 20 and 90 years of age. Participants
were originally studied to define a “normal” clinical value
or range of values for plasma contents in healthy
individuals to evaluate methods for detecting early
multiorgan disease (NCT00336570). Included participants
possessed low BMI, LDL cholesterol and blood pressure
as well as no history of smoking. Participants were
excluded by use of lipid lowering medication, presence of
any number of chronic or acute diseases or disorders,
listed in full detail at ClinicalTrials.gov. Blood plasma
was collected with EDTA, and samples were stored at -
80°C prior to LC-MS analysis.
High-resolution metabolomics (HRM)
Plasma samples were analyzed as described previously
[58]. Briefly, 50 µL plasma samples were treated 2:1
(v/v) with acetonitrile, and 2.5 µL internal standard of a
mixture of 14 stable isotope standards was added.
Proteins were precipitated and pelleted by incubation at
4°C for 30 min followed by centrifugation for 10 min at
21000 x g at 4°C. Supernatants were placed in
autosampler vials and maintained at 4°C in an
autosampler. Samples were analyzed by liquid
chromatography-Fourier transform mass spectrometry
at 60,000 resolution (Accela-LTQ Velos Orbitrap; m/z
range from 85-2000) in triplicate. A dual
chromatography setup was utilized, using AE and C18.
Electrospray ionization was performed in positive ion
mode. Data collection occurred continuously throughout
10 min of chromatographic separation.
Raw files were converted to .cdf files using Xcalibur file
converter from Thermo Fisher (San Diego, CA). Data
extraction was performed using apLCMS [59] and
xMSanalyzer [60], generating m/z features, a m/z feature
consisting of mass-to-charge ratio (m/z), retention time
(RT) and ion intensity. Feature and sample filtering
retained features with a median CV of 50% or less, a
minimum mean Pearson correlation coefficient of 0.7
between technical replicates of each sample, and which
were detected in at least 30% of samples. Two pooled
human reference plasma samples were concurrently
analyzed, as described by [61]. Briefly, NIST SRM1950
was analyzed at the beginning and end of the study. A
second pooled reference sample (Q-Standard 3; Qstd3)
was analyzed at the beginning of each batch of 20
samples. Qstd3 was prepared from plasma pooled from 2
separate lots from Equitech-Bio, Inc (Kerrville, Texas).
Metabolite annotation and identification
The m/z features were annotated for possible identities
against the Human Metabolome Database (http://www.
hmdb.ca/) and the LIPID MAPS Lipidomics Gateway
(http://www.lipidmaps.org/) using xMSannotator [37],
which scores annotations based on correlation
modularity clustering and isotopic, adduct and mass
defect grouping. This provides annotation at a
confidence equivalent to a Schymanski level of
confidence (SLC) 3 as defined by Schymanski et al.
[62]. All metabolites were matched at < 10 ppm
accuracy. All acylcarnitines were detected in the form
of a M + H adduct. All age-associated acylcarnitines
were tested for probable structure using MS/MS
fragmentation with the Accela-LTQ Velos Orbitrap.
Acylcarnitines for which probable structure could be
identified by diagnostic fragments compared against
values from the METLIN MS/MS metabolite database
[63] were designated as SLC 2b as defined by
Schymanski et al. [62].
Metabolome-wide association study of age
Using the R package, xmsPANDA (https://github.com/
kuppal2/xmsPANDA), a metabolome-wide association
study (MWAS) was performed to identify m/z features
which associate with age in healthy individuals.
Intensities for m/z features from xMSanalyzer, which had
intensities for at least 80% of samples were log2
transformed and quantile normalized. Missing values
were replaced by half of the minimum reported intensity
for that feature. Normalized m/z features were tested by
Spearman’s rank correlation for association with age, with
a p < 0.05 considered significant. A Benjamini/Hochberg
false discovery rate (FDR) method was used to correct for
multiple comparisons, with an FDR threshold of 0.2 [64].
Hierarchical clustering analysis (HCA) was performed
using MetaboAnalyst [65].
All acylcarnitines found to associate with age from the
C18 column were analyzed for correlation between
acylcarnitine subtypes. Age-associated acylcarnitines
from the C18 column were chosen over those from the
AE column due to greater coverage of acylcarnitines. In
addition to those found to be age-associated, free
carnitine (C0) and acetylcarnitine (C2) were included
for analysis. Correlations were analyzed using
Spearman’s rank correlation test, and a Bonferroni
correction was applied [66], resulting in p < 1.98 * 104
being considered significant.
The top 6 age-associated acylcarnitines were tested for
associations with other components of the metabolome
in each gender using xMWAS based on partial least-
squares regression [67]. After using the data
normalization and filtering methods described above,
the top 6 age-associated acylcarnitines were tested for
associations with 26040 metabolites within both female
(n = 78) and male (n = 85) subsets of the population. In
generation of both networks, metabolites were filtered

www.aging-us.com 13565 AGING
so that the 10000 metabolites with the lowest relative
standard deviation were included in the partial least
squares analysis. Thresholds for inclusion in the
network were |r| > 0.30 and p < 0.01. Pairwise results
from MWAS of the metabolites used for generation of
network structures were used for pathway enrichment
analysis using mummichog (v1) [68]. For each gender,
enriched pathways were filtered for those that included
at least 3 significantly associated metabolites at p <
0.05.
Abbreviations
AE: anion exchange; BCAA: branched-chain amino
acid; CoA: coenzyme A; FDR: false discovery rate;
HCA: hierarchical clustering analysis; HRM: high
resolution metabolomics; LC: long-chain; MC:
medium-chain; MWAS: metabolome-wide association
study; m/z: mass-to-charge ratio; OC: odd-chain; RT:
retention time; SLC: Schymanski level of confidence;
SC: short-chain; VLC: very long-chain.
ACKNOWLEDGMENTS
Dr. Young-Mi Go and Dr. Dean P. Jones share equal
senior authorship in this collaborative research.
CONFLICTS OF INTEREST
The authors declare no conflicts and interest.
FUNDING
This work was funded by NIEHS Grants R01 ES023485
(DPJ and YMG) and P30 ES019776 (DPJ), and NIH
S10 OD018006 (DPJ).
REFERENCES 1. Hoffman JM, Lyu Y, Pletcher SD, Promislow DE.
Proteomics and metabolomics in ageing research: from biomarkers to systems biology. Essays Biochem. 2017; 61:379–88.
https://doi.org/10.1042/EBC20160083 PMID:28698311
2. Franceschi C, Garagnani P, Morsiani C, Conte M, Santoro A, Grignolio A, Monti D, Capri M, Salvioli S. The continuum of aging and age-related diseases: common mechanisms but different rates. Front Med (Lausanne). 2018; 5:61.
https://doi.org/10.3389/fmed.2018.00061 PMID:29662881
3. World Population Ageing 2015 (ST/ESA/SER.A/390). United Nations, Department of Economic and Social Affairs, Population Division. 2015.
4. Jaul E, Barron J. Age-related diseases and clinical and public health implications for the 85 years old and over population. Front Public Health. 2017; 5:335.
https://doi.org/10.3389/fpubh.2017.00335 PMID:29312916
5. Cristofalo VJ, Gerhard GS, Pignolo RJ. Molecular biology of aging. Surg Clin North Am. 1994; 74:1–21.
https://doi.org/10.1016/s0039-6109(16)46225-0 PMID:8108762
6. Johnson FB, Sinclair DA, Guarente L. Molecular biology of aging. Cell. 1999; 96:291–302.
https://doi.org/10.1016/s0092-8674(00)80567-x PMID:9988222
7. Jones DP, Mody VC Jr, Carlson JL, Lynn MJ, Sternberg P Jr. Redox analysis of human plasma allows separation of pro-oxidant events of aging from decline in antioxidant defenses. Free Radic Biol Med. 2002; 33:1290–300.
https://doi.org/10.1016/s0891-5849(02)01040-7 PMID:12398937
8. Mishur RJ, Rea SL. Applications of mass spectrometry to metabolomics and metabonomics: detection of biomarkers of aging and of age-related diseases. Mass Spectrom Rev. 2012; 31:70–95.
https://doi.org/10.1002/mas.20338 PMID:21538458
9. Bakula D, Ablasser A, Aguzzi A, Antebi A, Barzilai N, Bittner MI, Jensen MB, Calkhoven CF, Chen D, Grey AD, Feige JN, Georgievskaya A, Gladyshev VN, et al. Latest advances in aging research and drug discovery. Aging (Albany NY). 2019; 11:9971–81.
https://doi.org/10.18632/aging.102487 PMID:31770722
10. Bremer J. Carnitine—metabolism and functions. Physiol Rev. 1983; 63:1420–80.
https://doi.org/10.1152/physrev.1983.63.4.1420 PMID:6361812
11. Kalim S, Clish CB, Wenger J, Elmariah S, Yeh RW, Deferio JJ, Pierce K, Deik A, Gerszten RE, Thadhani R, Rhee EP. A plasma long-chain acylcarnitine predicts cardiovascular mortality in incident dialysis patients. J Am Heart Assoc. 2013; 2:e000542.
https://doi.org/10.1161/JAHA.113.000542 PMID:24308938
12. Koh AS, Gao F, Liu J, Fridianto KT, Ching J, Tan RS, Wong JI, Chua SJ, Leng S, Zhong L, Keng BM, Huang FQ, Yuan JM, et al. Metabolomic profile of arterial stiffness in aged adults. Diab Vasc Dis Res. 2018; 15:74–80.
https://doi.org/10.1177/1479164117733627 PMID:28976207
13. Bouchouirab FZ, Fortin M, Noll C, Dubé J, Carpentier AC. Plasma palmitoyl-carnitine (AC16:0) is a marker of
www.aging-us.com 13566 AGING
increased postprandial nonesterified incomplete fatty acid oxidation rate in adults with type 2 diabetes. Can J Diabetes. 2018; 42:382–88.e1.
https://doi.org/10.1016/j.jcjd.2017.09.002 PMID:29129455
14. Mitchell SL, Uppal K, Williamson SM, Liu K, Burgess LG, Tran V, Umfress AC, Jarrell KL, Cooke Bailey JN, Agarwal A, Pericak-Vance M, Haines JL, Scott WK, et al. The carnitine shuttle pathway is altered in patients with neovascular age-related macular degeneration. Invest Ophthalmol Vis Sci. 2018; 59:4978–85.
https://doi.org/10.1167/iovs.18-25137 PMID:30326066
15. Rizza S, Copetti M, Rossi C, Cianfarani MA, Zucchelli M, Luzi A, Pecchioli C, Porzio O, Di Cola G, Urbani A, Pellegrini F, Federici M. Metabolomics signature improves the prediction of cardiovascular events in elderly subjects. Atherosclerosis. 2014; 232:260–64.
https://doi.org/10.1016/j.atherosclerosis.2013.10.029 PMID:24468136
16. Adams SH, Hoppel CL, Lok KH, Zhao L, Wong SW, Minkler PE, Hwang DH, Newman JW, Garvey WT. Plasma acylcarnitine profiles suggest incomplete long-chain fatty acid beta-oxidation and altered tricarboxylic acid cycle activity in type 2 diabetic african-american women. J Nutr. 2009; 139:1073–81.
https://doi.org/10.3945/jn.108.103754 PMID:19369366
17. Mihalik SJ, Goodpaster BH, Kelley DE, Chace DH, Vockley J, Toledo FG, DeLany JP. Increased levels of plasma acylcarnitines in obesity and type 2 diabetes and identification of a marker of glucolipotoxicity. Obesity (Silver Spring). 2010; 18:1695–700.
https://doi.org/10.1038/oby.2009.510 PMID:20111019
18. Tootsi K, Kals J, Zilmer M, Paapstel K, Ottas A, Märtson A. Medium- and long-chain acylcarnitines are associated with osteoarthritis severity and arterial stiffness in end-stage osteoarthritis patients: a case-control study. Int J Rheum Dis. 2018; 21:1211–18.
https://doi.org/10.1111/1756-185X.13251 PMID:29314768
19. Novotna B, Abdel-Hamid M, Koblizek V, Svoboda M, Hejduk K, Rehacek V, Bis J, Salajka F. A pilot data analysis of a metabolomic HPLC-MS/MS study of patients with COPD. Adv Clin Exp Med. 2018; 27:531–39.
https://doi.org/10.17219/acem/68763 PMID:29943523
20. Leruez S, Marill A, Bresson T, de Saint Martin G, Buisset A, Muller J, Tessier L, Gadras C, Verny C, Gohier P, Amati-Bonneau P, Lenaers G, Bonneau D, et al. A metabolomics profiling of glaucoma points to
mitochondrial dysfunction, senescence, and polyamines deficiency. Invest Ophthalmol Vis Sci. 2018; 59:4355–61.
https://doi.org/10.1167/iovs.18-24938 PMID:30193307
21. Ciavardelli D, Piras F, Consalvo A, Rossi C, Zucchelli M, Di Ilio C, Frazzini V, Caltagirone C, Spalletta G, Sensi SL. Medium-chain plasma acylcarnitines, ketone levels, cognition, and gray matter volumes in healthy elderly, mildly cognitively impaired, or alzheimer’s disease subjects. Neurobiol Aging. 2016; 43:1–12.
https://doi.org/10.1016/j.neurobiolaging.2016.03.005 PMID:27255810
22. Cristofano A, Sapere N, La Marca G, Angiolillo A, Vitale M, Corbi G, Scapagnini G, Intrieri M, Russo C, Corso G, Di Costanzo A. Serum levels of acyl-carnitines along the continuum from normal to alzheimer’s dementia. PLoS One. 2016; 11:e0155694.
https://doi.org/10.1371/journal.pone.0155694 PMID:27196316
23. Lin CN, Huang CC, Huang KL, Lin KJ, Yen TC, Kuo HC. A metabolomic approach to identifying biomarkers in blood of alzheimer’s disease. Ann Clin Transl Neurol. 2019; 6:537–45.
https://doi.org/10.1002/acn3.726 PMID:30911577
24. Rutkowsky JM, Knotts TA, Ono-Moore KD, McCoin CS, Huang S, Schneider D, Singh S, Adams SH, Hwang DH. Acylcarnitines activate proinflammatory signaling pathways. Am J Physiol Endocrinol Metab. 2014; 306:E1378–87.
https://doi.org/10.1152/ajpendo.00656.2013 PMID:24760988
25. Reuter SE, Evans AM. Carnitine and acylcarnitines: pharmacokinetic, pharmacological and clinical aspects. Clin Pharmacokinet. 2012; 51:553–72.
https://doi.org/10.1007/BF03261931 PMID:22804748
26. McGill MR, Li F, Sharpe MR, Williams CD, Curry SC, Ma X, Jaeschke H. Circulating acylcarnitines as biomarkers of mitochondrial dysfunction after acetaminophen overdose in mice and humans. Arch Toxicol. 2014; 88:391–401.
https://doi.org/10.1007/s00204-013-1118-1 PMID:23979652
27. Shigenaga MK, Hagen TM, Ames BN. Oxidative damage and mitochondrial decay in aging. Proc Natl Acad Sci USA. 1994; 91:10771–78.
https://doi.org/10.1073/pnas.91.23.10771 PMID:7971961
28. Ames BN, Shigenaga MK, Hagen TM. Mitochondrial decay in aging. Biochim Biophys Acta. 1995; 1271:165–70.

www.aging-us.com 13567 AGING
https://doi.org/10.1016/0925-4439(95)00024-x PMID:7599204
29. Lesnefsky EJ, Chen Q, Hoppel CL. Mitochondrial metabolism in aging heart. Circ Res. 2016; 118:1593–611.
https://doi.org/10.1161/CIRCRESAHA.116.307505 PMID:27174952
30. Consitt LA, Koves TR, Muoio DM, Nakazawa M, Newton CA, Houmard JA. Plasma acylcarnitines during insulin stimulation in humans are reflective of age-related metabolic dysfunction. Biochem Biophys Res Commun. 2016; 479:868–74.
https://doi.org/10.1016/j.bbrc.2016.09.116 PMID:27693789
31. Lum H, Sloane R, Huffman KM, Kraus VB, Thompson DK, Kraus WE, Bain JR, Stevens R, Pieper CF, Taylor GA, Newgard CB, Cohen HJ, Morey MC. Plasma acylcarnitines are associated with physical performance in elderly men. J Gerontol A Biol Sci Med Sci. 2011; 66:548–53.
https://doi.org/10.1093/gerona/glr006 PMID:21367961
32. Yu Z, Zhai G, Singmann P, He Y, Xu T, Prehn C, Römisch-Margl W, Lattka E, Gieger C, Soranzo N, Heinrich J, Standl M, Thiering E, et al. Human serum metabolic profiles are age dependent. Aging Cell. 2012; 11:960–67.
https://doi.org/10.1111/j.1474-9726.2012.00865.x PMID:22834969
33. Muilwijk M, Vaz FM, Celis-Morales C, Peters RJ, van Valkengoed IG. The association of acylcarnitines and amino acids with age in dutch and south-asian Surinamese living in amsterdam. J Clin Endocrinol Metab. 2018; 103:3783–91.
https://doi.org/10.1210/jc.2018-00809 PMID:30113646
34. Ma S, Yim SH, Lee SG, Kim EB, Lee SR, Chang KT, Buffenstein R, Lewis KN, Park TJ, Miller RA, Clish CB, Gladyshev VN. Organization of the mammalian metabolome according to organ function, lineage specialization, and longevity. Cell Metab. 2015; 22:332–43.
https://doi.org/10.1016/j.cmet.2015.07.005 PMID:26244935
35. Longo N, Frigeni M, Pasquali M. Carnitine transport and fatty acid oxidation. Biochim Biophys Acta. 2016; 1863:2422–35.
https://doi.org/10.1016/j.bbamcr.2016.01.023 PMID:26828774
36. Peng KY, Watt MJ, Rensen S, Greve JW, Huynh K, Jayawardana KS, Meikle PJ, Meex RC. Mitochondrial dysfunction-related lipid changes occur in nonalcoholic
fatty liver disease progression. J Lipid Res. 2018; 59:1977–86.
https://doi.org/10.1194/jlr.M085613 PMID:30042157
37. Uppal K, Walker DI, Jones DP. xMSannotator: an R package for network-based annotation of high-resolution metabolomics data. Anal Chem. 2017; 89:1063–67.
https://doi.org/10.1021/acs.analchem.6b01214 PMID:27977166
38. Beermann C, Jelinek J, Reinecker T, Hauenschild A, Boehm G, Klör HU. Short term effects of dietary medium-chain fatty acids and n-3 long-chain polyunsaturated fatty acids on the fat metabolism of healthy volunteers. Lipids Health Dis. 2003; 2:10.
https://doi.org/10.1186/1476-511X-2-10 PMID:14622442
39. Aon MA, Bhatt N, Cortassa SC. Mitochondrial and cellular mechanisms for managing lipid excess. Front Physiol. 2014; 5:282.
https://doi.org/10.3389/fphys.2014.00282 PMID:25132820
40. Adeva-Andany MM, López-Maside L, Donapetry-García C, Fernández-Fernández C, Sixto-Leal C. Enzymes involved in branched-chain amino acid metabolism in humans. Amino Acids. 2017; 49:1005–28.
https://doi.org/10.1007/s00726-017-2412-7 PMID:28324172
41. Shao D, Villet O, Zhang Z, Choi SW, Yan J, Ritterhoff J, Gu H, Djukovic D, Christodoulou D, Kolwicz SC Jr, Raftery D, Tian R. Glucose promotes cell growth by suppressing branched-chain amino acid degradation. Nat Commun. 2018; 9:2935.
https://doi.org/10.1038/s41467-018-05362-7 PMID:30050148
42. Ferdinandusse S, Denis S, Van Roermund CW, Wanders RJ, Dacremont G. Identification of the peroxisomal beta-oxidation enzymes involved in the degradation of long-chain dicarboxylic acids. J Lipid Res. 2004; 45:1104–11.
https://doi.org/10.1194/jlr.M300512-JLR200 PMID:15060085
43. Pawlak M, Lefebvre P, Staels B. Molecular mechanism of PPARα action and its impact on lipid metabolism, inflammation and fibrosis in non-alcoholic fatty liver disease. J Hepatol. 2015; 62:720–33.
https://doi.org/10.1016/j.jhep.2014.10.039 PMID:25450203
44. Nofal M, Zhang K, Han S, Rabinowitz JD. mTOR inhibition restores amino acid balance in cells dependent on catabolism of extracellular protein. Mol Cell. 2017; 67:936–46.e5.

www.aging-us.com 13568 AGING
https://doi.org/10.1016/j.molcel.2017.08.011 PMID:28918901
45. Pfeuffer M, Jaudszus A. Pentadecanoic and heptadecanoic acids: multifaceted odd-chain fatty acids. Adv Nutr. 2016; 7:730–34.
https://doi.org/10.3945/an.115.011387 PMID:27422507
46. Khaw KT, Friesen MD, Riboli E, Luben R, Wareham N. Plasma phospholipid fatty acid concentration and incident coronary heart disease in men and women: the EPIC-norfolk prospective study. PLoS Med. 2012; 9:e1001255.
https://doi.org/10.1371/journal.pmed.1001255 PMID:22802735
47. Santaren ID, Watkins SM, Liese AD, Wagenknecht LE, Rewers MJ, Haffner SM, Lorenzo C, Hanley AJ. Serum pentadecanoic acid (15:0), a short-term marker of dairy food intake, is inversely associated with incident type 2 diabetes and its underlying disorders. Am J Clin Nutr. 2014; 100:1532–40.
https://doi.org/10.3945/ajcn.114.092544 PMID:25411288
48. Sebastian RS, Goldman JD, Enns CW, LaComb RP. Fluid Milk Consumption in the United States: What We Eat In America, NHANES 2005-2006 (Dietary Data Brief No. 3). United States Department of Agriculture, Agricultural Research Service. 2010.
49. Jenkins B, West JA, Koulman A. A review of odd-chain fatty acid metabolism and the role of pentadecanoic acid (c15:0) and heptadecanoic acid (c17:0) in health and disease. Molecules. 2015; 20:2425–44.
https://doi.org/10.3390/molecules20022425 PMID:25647578
50. Weitkunat K, Schumann S, Nickel D, Hornemann S, Petzke KJ, Schulze MB, Pfeiffer AF, Klaus S. Odd-chain fatty acids as a biomarker for dietary fiber intake: a novel pathway for endogenous production from propionate. Am J Clin Nutr. 2017; 105:1544–51.
https://doi.org/10.3945/ajcn.117.152702 PMID:28424190
51. Funk CD. Prostaglandins and leukotrienes: advances in eicosanoid biology. Science. 2001; 294:1871–75.
https://doi.org/10.1126/science.294.5548.1871 PMID:11729303
52. Sorgdrager FJ, Naudé PJ, Kema IP, Nollen EA, Deyn PP. Tryptophan metabolism in inflammaging: from biomarker to therapeutic target. Front Immunol. 2019; 10:2565.
https://doi.org/10.3389/fimmu.2019.02565 PMID:31736978
53. Nevalainen T, Kananen L, Marttila S, Jylhä M, Hervonen A, Hurme M, Jylhävä J. Transcriptomic and epigenetic
analyses reveal a gender difference in aging-associated inflammation: the vitality 90+ study. Age (Dordr). 2015; 37:9814.
https://doi.org/10.1007/s11357-015-9814-9 PMID:26188803
54. Das A. “Inflammaging” and estradiol among older U.S. Women: a nationally representative longitudinal study. Biodemography Soc Biol. 2017; 63:295–308.
https://doi.org/10.1080/19485565.2017.1403304 PMID:29199869
55. López-Otín C, Blasco MA, Partridge L, Serrano M, Kroemer G. The hallmarks of aging. Cell. 2013; 153:1194–217.
https://doi.org/10.1016/j.cell.2013.05.039 PMID:23746838
56. Braganza A, Corey CG, Santanasto AJ, Distefano G, Coen PM, Glynn NW, Nouraie SM, Goodpaster BH, Newman AB, Shiva S. Platelet bioenergetics correlate with muscle energetics and are altered in older adults. JCI Insight. 2019; 5:e128248.
https://doi.org/10.1172/jci.insight.128248 PMID:31120438
57. Go YM, Kim CW, Walker DI, Kang DW, Kumar S, Orr M, Uppal K, Quyyumi AA, Jo H, Jones DP. Disturbed flow induces systemic changes in metabolites in mouse plasma: a metabolomics study using ApoE⁻/⁻ mice with partial carotid ligation. Am J Physiol Regul Integr Comp Physiol. 2015; 308:R62–72.
https://doi.org/10.1152/ajpregu.00278.2014 PMID:25377480
58. Go YM, Walker DI, Soltow QA, Uppal K, Wachtman LM, Strobel FH, Pennell K, Promislow DE, Jones DP. Metabolome-wide association study of phenylalanine in plasma of common marmosets. Amino Acids. 2015; 47:589–601.
https://doi.org/10.1007/s00726-014-1893-x PMID:25526869
59. Yu T, Park Y, Johnson JM, Jones DP. apLCMS—adaptive processing of high-resolution LC/MS data. Bioinformatics. 2009; 25:1930–36.
https://doi.org/10.1093/bioinformatics/btp291 PMID:19414529
60. Uppal K, Soltow QA, Strobel FH, Pittard WS, Gernert KM, Yu T, Jones DP. xMSanalyzer: automated pipeline for improved feature detection and downstream analysis of large-scale, non-targeted metabolomics data. BMC Bioinformatics. 2013; 14:15.
https://doi.org/10.1186/1471-2105-14-15 PMID:23323971
61. Go YM, Walker DI, Liang Y, Uppal K, Soltow QA, Tran V, Strobel F, Quyyumi AA, Ziegler TR, Pennell KD, Miller GW, Jones DP. Reference standardization for mass
www.aging-us.com 13569 AGING
spectrometry and high-resolution metabolomics applications to exposome research. Toxicol Sci. 2015; 148:531–43.
https://doi.org/10.1093/toxsci/kfv198 PMID:26358001
62. Schymanski EL, Jeon J, Gulde R, Fenner K, Ruff M, Singer HP, Hollender J. Identifying small molecules via high resolution mass spectrometry: communicating confidence. Environ Sci Technol. 2014; 48:2097–98.
https://doi.org/10.1021/es5002105 PMID:24476540
63. Guijas C, Montenegro-Burke JR, Domingo-Almenara X, Palermo A, Warth B, Hermann G, Koellensperger G, Huan T, Uritboonthai W, Aisporna AE, Wolan DW, Spilker ME, Benton HP, Siuzdak G. METLIN: a technology platform for identifying knowns and unknowns. Anal Chem. 2018; 90:3156–64.
https://doi.org/10.1021/acs.analchem.7b04424 PMID:29381867
64. Benjamini Y, Hochberg Y. Controlling the False Discovery Rate: A Practical and Powerful Approach to Multiple Testing. Journal of the Royal Statistical Society: Series B (Methodological). 1995; 57:289–300.
https://doi.org/10.1111/j.2517-6161.1995.tb02031.x
65. Chong J, Soufan O, Li C, Caraus I, Li S, Bourque G, Wishart DS, Xia J. MetaboAnalyst 4.0: towards more transparent and integrative metabolomics analysis. Nucleic Acids Res. 2018; 46:W486–94.
https://doi.org/10.1093/nar/gky310 PMID:29762782
66. Sedgwick P. Multiple hypothesis testing and bonferroni’s correction. BMJ. 2014; 349:g6284.
https://doi.org/10.1136/bmj.g6284 PMID:25331533
67. Uppal K, Ma C, Go YM, Jones DP, Wren J. xMWAS: a data-driven integration and differential network analysis tool. Bioinformatics. 2018; 34:701–02.
https://doi.org/10.1093/bioinformatics/btx656 PMID:29069296
68. Li S, Park Y, Duraisingham S, Strobel FH, Khan N, Soltow QA, Jones DP, Pulendran B. Predicting network activity from high throughput metabolomics. PLoS Comput Biol. 2013; 9:e1003123.
https://doi.org/10.1371/journal.pcbi.1003123 PMID:23861661

www.aging-us.com 13570 AGING
SUPPLEMENTARY MATERIAL
Supplementary Tables
Please browse Full Text version to see the data of Supplementary Tables 1 to 7.
Supplementary Table 1. Age-associations of metabolites from C18 column.
Supplementary Table 2. Age-associations of metabolites from anion exchange column.
Supplementary Table 3. Annotations of age-associated metabolites from C18 column.
Supplementary Table 4. Annotations of age-associated metabolites from anion exchange column.
Supplementary Table 5. Correlations between acylcarnitines.
Supplementary Table 6. Annotations of metabolites included in female network of metabolome-wide associations with the top 6 age-associated acylcarnitines (Figure 6A).
Supplementary Table 7. Annotations of metabolites included in male network of metabolome-wide associations with the top 6 age-associated acylcarnitines (Figure 6B).