plants, food and health: back to the future? - fapesp
TRANSCRIPT
Systems biology:
gateway to novel discoveries
Rob Verpoorte
Pharmacognosy, Section of Metabolomics, IBL, Leiden Universit
PO Box 9502, 2300 RA Leiden,
The Netherlands. Fax +31+71 5274511, tel 5274528
Some food for thought and discussions the
coming days

Plants may
• Kill you fast, e.g. cyanide, strychnine
• Kill you slowly, e.g. opium
• Please you, e.g. colour and scent of flowers
• Dress you
• Feed you
• Cure you

Natural products are everywhere
• In your cars: natural fibers used in various materials
• In your printer ink: terpenoids
• In your clothing
• In dye of your jeans
• In your medicines
• In your shoes
– So they are at the basis of our life

Plants are at the basis of all human
activities: food, medicine, fuel, shelter
• Ca. 30 species for our staple food
• Ca. 100 species for fruits
• Ca. 100 species for vegetables
• Ca. 50 for isolation pure compounds
• Ca. 40,000-70,000 for medicinal use
• Many others (fibers, paper, wood, fuel,
spices, ornamentals, etc.)
An important heritage of our ancestors!

Definition
Bioprospecting is the systematic search for:
- organisms
- genes
- biomolecules
- other compounds
- designs
that might have a potential use.

An impertinent question?
How many novel products have
been developed in Brazil in the
past decennia from your very rich
biodiversity?

Our ancestors were excellent
explorers: the Caffeine case

2 out of 50.000 plant species were
selected for the preparation of curare

Curare? Ancient high
throughput screening?
• From about 50.000 plant species the
Indians found two that contain products that
are very toxic upon injection, but are non-
toxic orally
• Similar plants also used in Central Africa
and Malaysia

Why did we not find many new
products?
• Our ancestors found already everything of
interest
• We did not made a real effort
• We think we do better with synthetic
chemistry
• We did not use the right approach
• …………

877 Novel Small Molecules (NCEs) 1981-2002N: natural products; ND: N-derived;
S: synthetics; S*: N-based S
New
man
et
al. J.
Nat
. P
rod
. 6
6(2
00
3)1
022

Drug development 2009
The good news
• About half of all novel
drugs are natural
products or natural
products derived!
The bad news
• The number of novel
drugs is decreasing
dramatically!

Drug Development 1995-present
• High throughput screening (up to 100,000
samples per 24 hrs) using known targets
• Very small amount compound needed
• Combinatorial chemistry for producing
large numbers of compounds
• Suited for bioassay-guided fractionation
• Extracts of e.g. plants possible
• No new modes of action

Paradigm of modern drug
development:
Single compound single target

Lead discovery
Lead optimization
Identification clinical candidate
Investigational New Drug (IND) filing
Clinical studies (phase I-III)
New Drug Application (NDA)
1-2 years
1-2 years
1-3 years
3-6 years
registration
--
2-3 years
Screening
10,000-100,000
compounds
2003: 21 novel drugs
Ca. 7% of IND
pass clinical trials

Lead discovery
• Screen large number of compounds in
simple and fast assays for activity
- pure compounds
- combinatorial chemistry mixtures
- extracts of plants, microorganisms, etc

Reductionist approach in studying
(medicinal) plants
• Bioassay guided fractionation to isolate
active compound
– Chromatographic separation
– Measure activity with simple bioassay
– Repeat until pure active compound
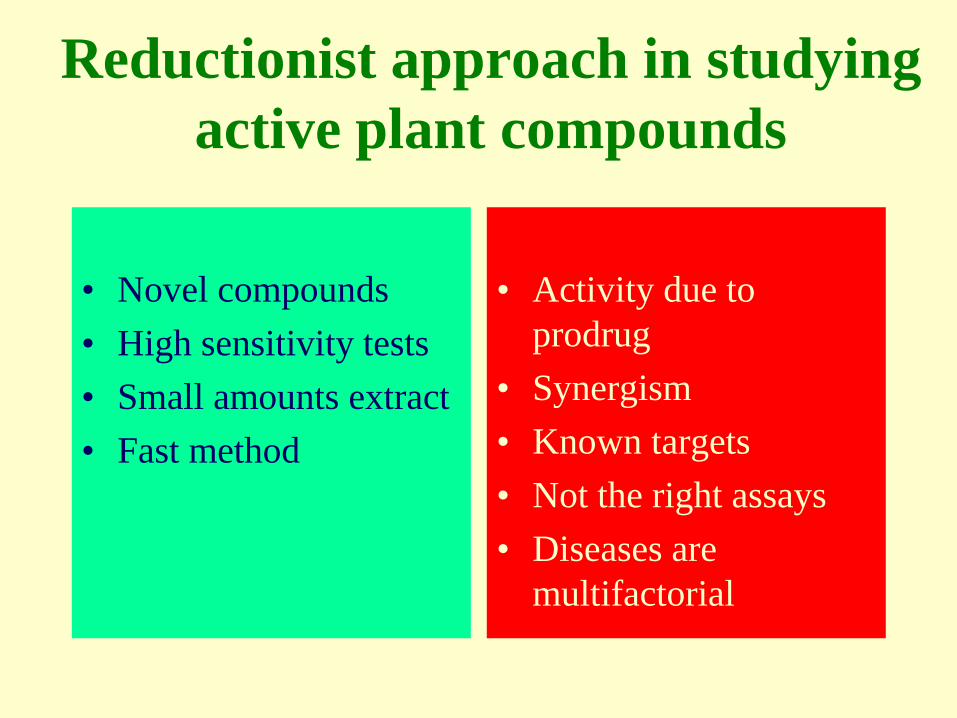
Reductionist approach in studying
active plant compounds
• Novel compounds
• High sensitivity tests
• Small amounts extract
• Fast method
• Activity due to
prodrug
• Synergism
• Known targets
• Not the right assays
• Diseases are
multifactorial

Looking for the needle in the haystack
To find a novel drug is like:

Is there an other way to
find the needle?
We have to rethink drug
development!

JPA Ioannidis:
“Why most published Research Findings
are False”PLoSMedicine 2(2005)696-701
(www.plosmedicine.org)
• “For many current scientific research fields,
claimed research findings may often be simple
accurate measures of the prevailing bias”
• “Simulations show that for most study designs and
settings, it is more likely for a research claim to be
false than true”
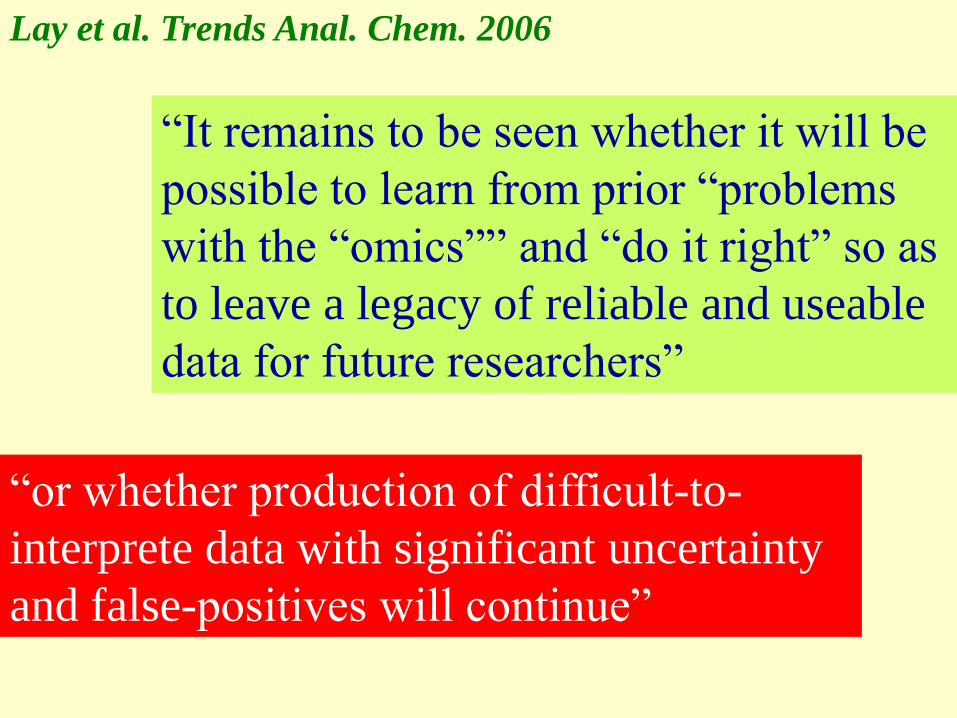
“It remains to be seen whether it will be
possible to learn from prior “problems
with the “omics”” and “do it right” so as
to leave a legacy of reliable and useable
data for future researchers”
“or whether production of difficult-to-
interprete data with significant uncertainty
and false-positives will continue”
Lay et al. Trends Anal. Chem. 2006

MC
Esc
her
(1961) Models can be
beautiful but are
not always right.
Is this an as
good or an as
bad solution for
the energy
crisis as
biofuel?

Science, October 2008
Wrong model for
Adenosine A2A
receptor drug
development in
past 20 years
So what is the problem?
Scientific communication is too much
focused on:
Explaining our observations as part of
starting hypothesis
(a model)
instead of
Describing our observations itself
(the raw data)

Observations are the basis of
all science
• Observations are made with our senses and
tools that can make things visible for our
senses (“-scopy”)
• Models are made to explain the
observations, and often become dogmas
• Observations need to be stored in an
“eternal” format for future reuse

Yogi the bear?

Anecdotic examples
• Discovery of penicillin
– Growth inhibition zones
• Discovery of vinblastine and vincristin
– Testing for antidiabetes, observing effect on leucocytes
• Discovery Omeprazole (Losec) no 1 best sold drug worldwide for some 15 years
– Not active but pro-drug

Time for the good news!
Systems biology as an unbiased
approach, is a great opportunity for
life sciences
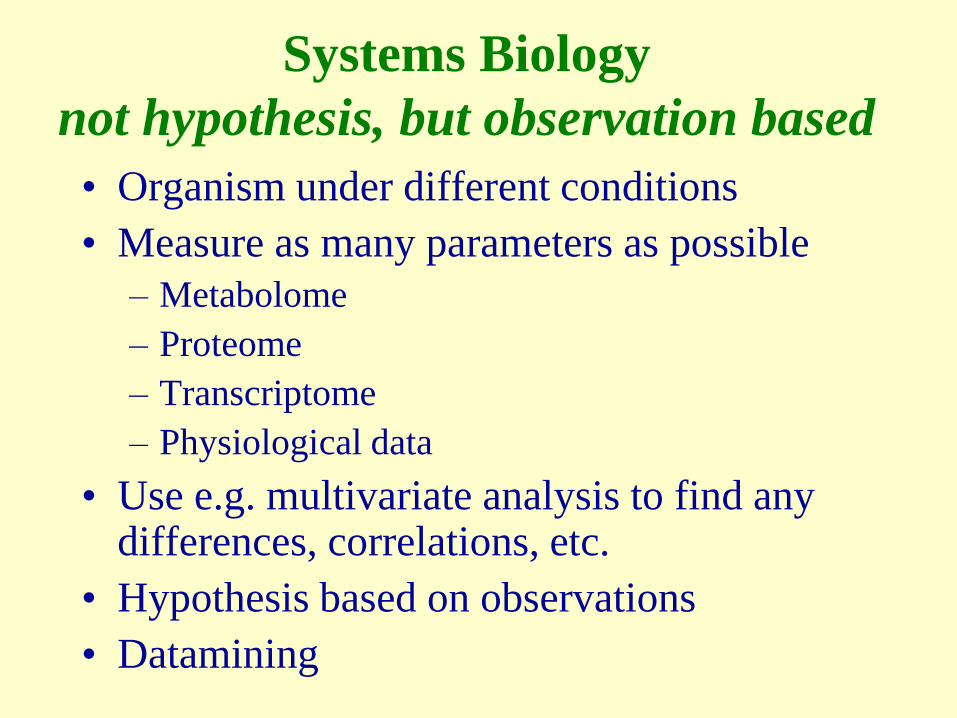
Systems Biology
not hypothesis, but observation based
• Organism under different conditions
• Measure as many parameters as possible
– Metabolome
– Proteome
– Transcriptome
– Physiological data
• Use e.g. multivariate analysis to find any differences, correlations, etc.
• Hypothesis based on observations
• Datamining

Systems biology
Measure as many parameters as possible

How did our ancestors find
medicinal plants?

Drug Development
Holistic Approach
Reductionist
Approach
HumansAnimals
OrgansCells
Molecules
presentpast
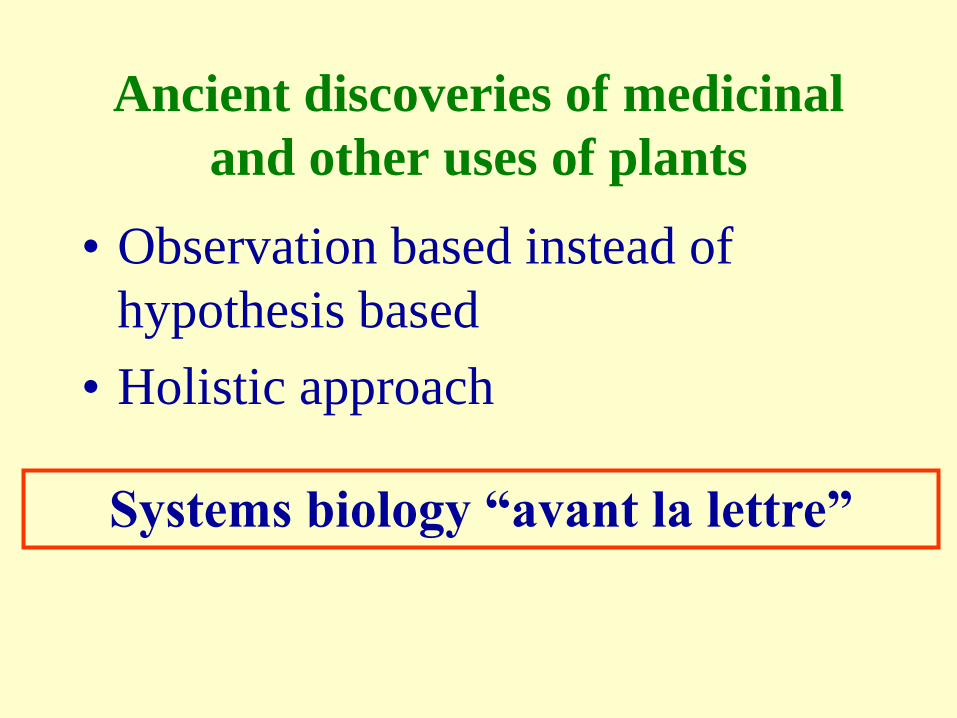
Ancient discoveries of medicinal
and other uses of plants
• Observation based instead of
hypothesis based
• Holistic approach
Systems biology “avant la lettre”

Back to 2010: Is there no other
way to find the needle?
• Go back to our ancestors approach of observation based discoveries
• Natural processes involve many factors, i.e. most diseases have multifactorial causes and multifactorial responses
• Use all the scientific tools as an extension of our senses, e.g. measure metabolite profiles, proteome and transcriptome
Systems biology!

Observations needs to stored
• Become information
• Sharing and comparing observations
• Datamining
• Requires high reproducibility
• Eternally understandable logic format

Information from
5000 years ago

Co
mm
un
icati
on
an
no 2
00
7
What will people understand
of our hieroglyphics in 7007?

Observations
• Should be made in an unbiased way
– E.g. is an HPLC chromatogram unbiased when only retention times are used for identification?
• Should be stored in an unbiased way for future use
– E.g. is a table with results of a chromatogram unbiased?
• Models should be chosen without bias
– E.g. if you select one out of a series of transformed plants, is this unbiased?

What type of information is most
suited for datamining?
A. Chemical structure of compound
B. Raw data of NMR spectra compound
C. Table with assigned NMR spectra
compound
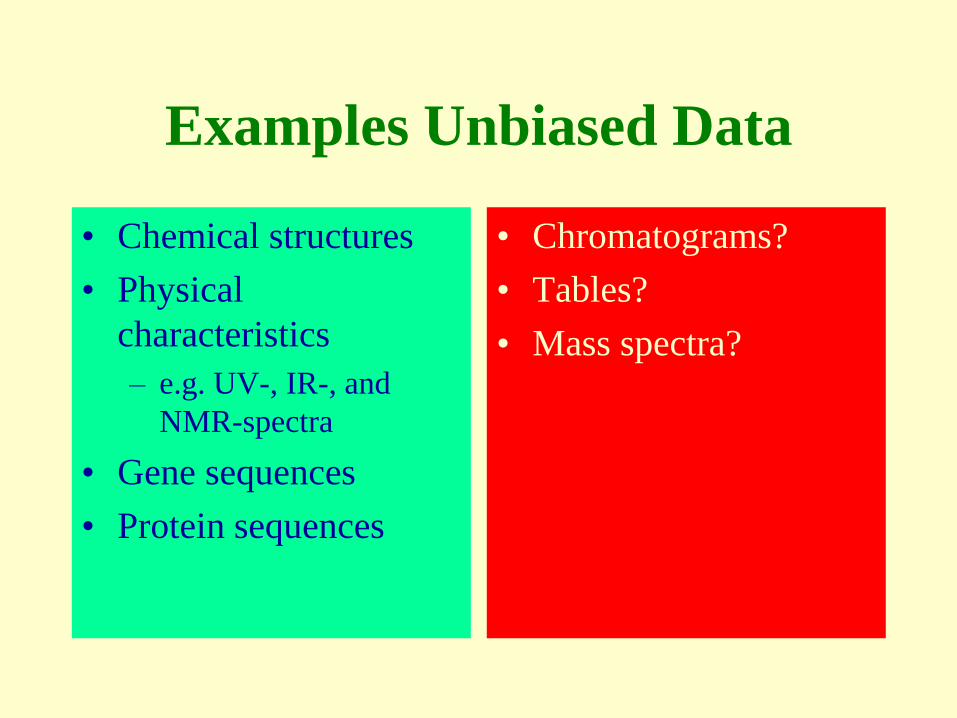
Examples Unbiased Data
• Chemical structures
• Physical
characteristics
– e.g. UV-, IR-, and
NMR-spectra
• Gene sequences
• Protein sequences
• Chromatograms?
• Tables?
• Mass spectra?
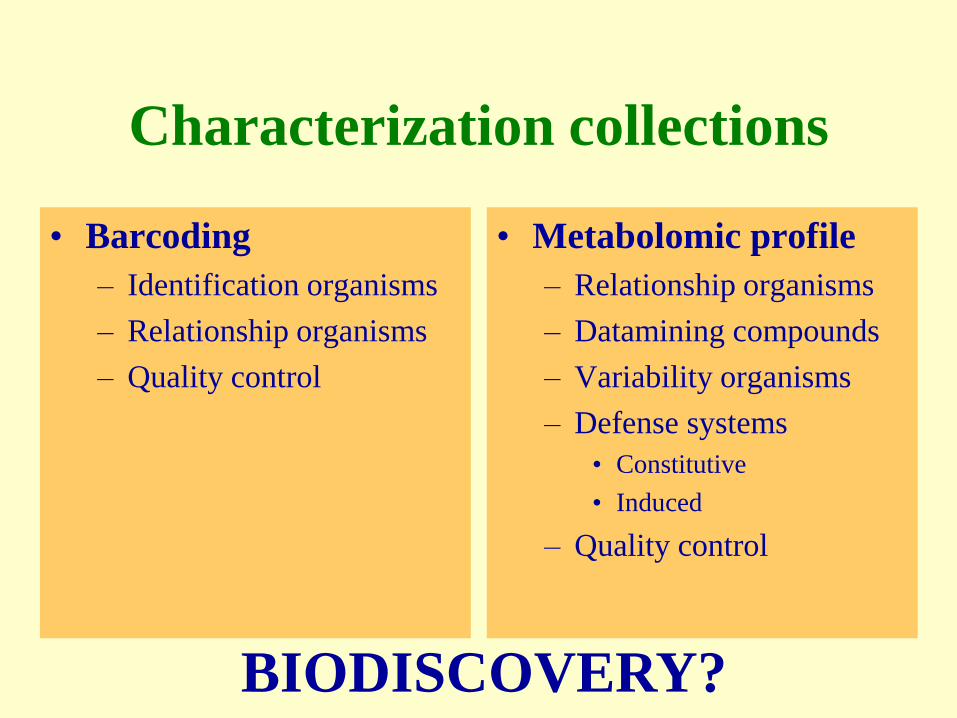
Characterization collections
• Barcoding
– Identification organisms
– Relationship organisms
– Quality control
• Metabolomic profile
– Relationship organisms
– Datamining compounds
– Variability organisms
– Defense systems
• Constitutive
• Induced
– Quality control
BIODISCOVERY?

What have these in common?
Storage of GB of information

Systems biology, plants and biodiscovery• Activity Medicinal plants
– New leads
– New targets
• Health affecting compounds in Food
• Interaction plants and Environment– Biopesticides
– Resistance genes
• Elucidation biosynthetic pathways– Genes for metabolic engineering
• Functional genomics– Genes for major traits plants, diseases, etc.
• Quality control
Key technology: metabolomics, the chemical
characterization of a phenotype

Aim Metabolomics
• Identification and quantification of
all metabolites in an organism

•About 30,000 compounds
•Large range of relative quantities
•Broad polarity range
•Unstable compounds
Plant metabolome

Methods metabolomics
• Chromatography
– LC-MS
– GC-MS
• Mass Spectrometry (MS)
• Nuclear Magnetic Resonance
Spectrometry (NMR)
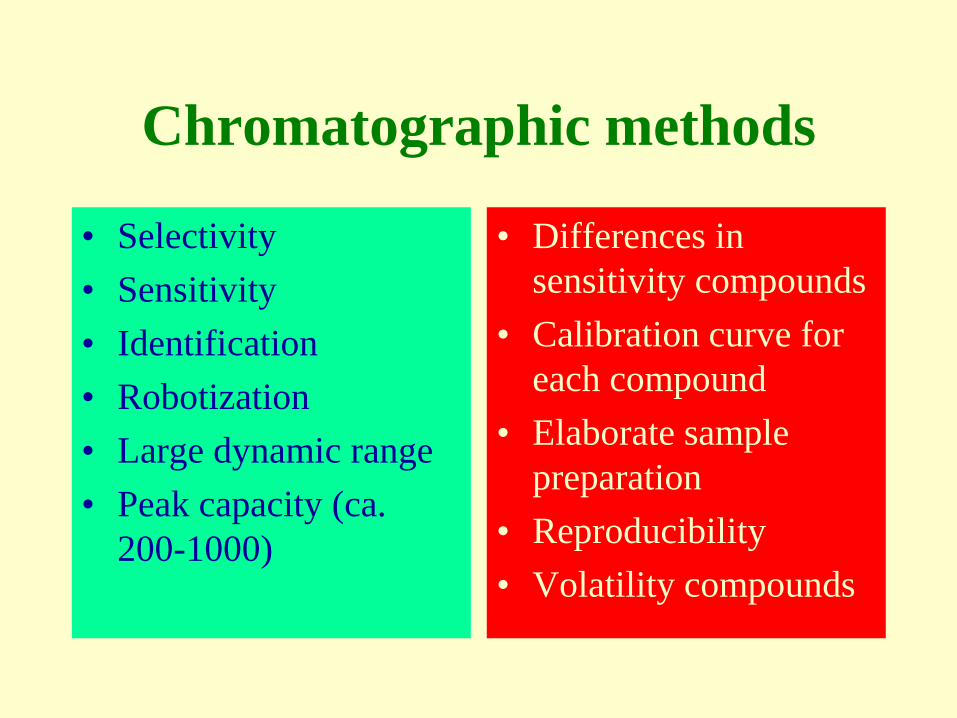
Chromatographic methods
• Selectivity
• Sensitivity
• Identification
• Robotization
• Large dynamic range
• Peak capacity (ca.
200-1000)
• Differences in
sensitivity compounds
• Calibration curve for
each compound
• Elaborate sample
preparation
• Reproducibility
• Volatility compounds

MS(-MS)
• Selectivity (molecular
weight based)
• Sensitivity for part of
compounds
• Identification
• Robotization
• Large peak capacity
• Very different
sensitivity for
compounds
• Reproducibility

1HNMR
• Very selective
(physical data)
• Direct comparison
amounts of
compounds without
internal standards
• Reproducibility
• Fast
• Compounds not
separated
• Polarity range
• Sensitivity
• Dynamic range
(1:100)
• Peak capacity (ca. 50-
100)

Comparison metabolomic tools
LC-MS GC-MS TLC MS-MS NMR
Sample prep - -- ++ + +++
Reproducible - + - + +++
Absolute qnt - - - - +++
Relative qnt + ++ + ++ +++
Identity ++ ++ + ++ ++
Compound No ++ +++ + +++ +
Sensitive ++ ++ + +++ -

Metabolomics describes the
phenotype on the level of molecules
Macroscopic level, total metabolome: NMR
Lower level: LC-MS, GC-MS, MS(-MS), etc.

1H-NMR plant extract: overall picture
Alkaloids
Flavonoids
Phenylpropanoids
Phenoloics
Tannins
Sugars
Amino acids
GlycosidesOrganic acids
Terpenoids
Steroids

Complex Spectra- Projection of J-resolved Spectra -
2D-J-resolved1H-NMR
Projection of J-resolved
• Less complex spectra
• Decoupled spectra like 13C
• Higher resolution
• Better separation in PCA

Phenylpropanoids in Brassica rapa• 2D confirmation (J-resolved spectra)
• More than 5 phenylpropanoids conjugated with malic acid
O
OH
OH
O
O
O
R1
HO
R2
1'2'
3'
4'5'
6'
7'
8'
12
3 4
*
*
H-8’ H-2
2D-J-resolved spectrum (d 5.8 – d 6.7) 2D-J-resolved spectrum (d 5.3 – d 5.5)

Phenylpropanoids in Brassica rapa
O
OH
OH
O
O
O
R1
HO
R2
1'2'
3'
4'5'
6'
7'
8'
12
3 4
R1
HO
R2
1'2'
3'
4'5'
6'
7' 8'
12
3 4
O
O OH
OH
O
O
R1 = OCH3, R2 = OH, cis-5-hydroxyferuloyl malate (6)
R1 = OH, R2 = H, cis-caffeoyl malate (7)
R1 = H, R2 = H, cis-coumaroyl malate (8)
R1 = OCH3, R2 = H, cis-5-hydroxyferuloyl malate (9)
R1 = OCH3, R2 = OCH3, cis-5-sinapoyl malate (10)
R1 = OCH3, R2 = OH, trans-5-hydroxyferuloyl malate (1)
R1 = OH, R2 = H, trans-caffeoyl malate (2)
R1 = H, R2 = H, trans-coumaroyl malate (3)
R1 = OCH3, R2 = H, trans-5-hydroxyferuloyl malate (4)
R1 = OCH3, R2 = OCH3, trans-5-sinapoyl malate (5)
• 10 phenylpropanoids including cis and trans isomers
• A new compound; 5-hydroxyferuloyl malate

Datamining in metabolomic
libraries
• Highly reproducible protocols
• Metadata samples
– Collection site
– Time of collection
– Developmental stage
– Harvesting method
• Biological variation
• Chemometric methods
• Chemotaxonomy
• Markers for activity medicinal plant
• Markers for plant resistance
• Developmental markers
• Functional genomics
• Quality control

Line no.1
Line no.108
adenine
Sinapoyl malate
Aliphatic GLS
phenylpropanoid
Flavonoid glycoside
phenylpropanoid
Comparison two Arabidopsis
accessions
Easy for 2, but for 6?

Find the 7 differences!

Biological variation
Arabidopsis from different accessions
and what in case of 146?
Each accession has distinct metabolome

Find the differences!

How to deal with all the data?
• Highly reproducible method to be able to
store data for future use and datamining
• Chemometric methods such as multivariate
analysis
We have library with:
• Spectra of > 25,000 plant extracts
•1D, 2D NMR spectra of > 600 plant metabolites

Multivariate data analysis
• Unsupervised multivariate data analysis
• Principal component analysis (PCA)
• Factor analysis
• Supervised multivariate data analysis
• Soft independent modeling of class analogy (SIMCA)
• Partial least square regression-discriminant analysis (PLS-DA)
• Independent component analysis (ICA)
• Cluster analysis (Hierarchical and K-means cluster analysis)
• Orthogonal PLS (OPLS)
• Canonical correlations analysis (CCA)

-200
-100
0
100
200
-600 -400 -200 0 200 400 600
PC
3
PC1
AAAAA
AAAAA
BBB
BB
B
B
BB
B
CCC
CCCCCCC
-0.4
-0.2
-0.0
0.2
0.4
0.6
-0.1 0.0 0.1 0.2 0.3 0.4 0.5
PC
3
PC1
109.969.929.889.849.89.769.729.689.649.69.569.529.489.449.49.369.329.289.249.29.169.129.089.0498.968.928.888.848.88.768.728.688.648.68.568.528.488.448.48.368.328.288.248.28.168.128.088.0487.967.927.887.847.87.767.727.687.647.67.567.527.487.447.47.367.327.287.247.27.167.127.087.0476.966.926.886.846.86.766.726.686.646.66.566.52
6.486.446.46.366.326.286.246.26.166.126.086.0465.965.925.885.845.85.765.725.685.645.65.565.525.485.44 5.45.36
5.325.285.24
5.25.165.125.085.0454.964.924.724.684.64
4.6
4.564.524.484.444.44.364.324.28
4.244.2
4.16
4.12
4.084.044
3.963.923.88
3.843.8
3.763.72
3.68
3.64
3.63.56 3.52
3.48 3.443.4
3.36
3.28
3.24
3.2
3.163.123.083.043
2.962.922.882.842.82.762.722.682.642.62.56
2.52
2.482.442.42.36 2.32
2.282.242.2
2.162.122.082.042
1.96
1.92
1.881.841.81.761.721.68
1.641.61.56
1.521.481.441.41.361.32
1.281.241.21.16
1.121.081.0410.960.920.880.840.8
0.760.720.680.640.60.560.520.480.440.4
Higher in B
Higher in C
Higher in A
PC score plot (PC1/PC3) PC loading plot (PC1/PC3)
Unsupervised multivariate data analysis
Principal Component Analysis (PCA)
Reduce the n-dimensional space of all data of an
experiment to a few principal components (2-3 PC)
that give the maximum separation for all samples

Arabidopsis 146 lines
PCA– Score plot (scaled to IS)
-2
-1
0
1
2
-2 -1 0 1 2
t[2
]
t[1]
R2X[1] = 0.350097 R2X[2] = 0.134157 Ellipse: Hotelling T2 (0.95)
1
2
3
46
7
8
9
10
1113
1415
16
17
18
19
20
21
22
24
2526
27
28
29
32
3335
38
39
41
42
4344
45 4648
49
51
52
53
54
55
57
58
59
60
61
6264
65
6667
68
69
70
72
73
74
76
77
7879
80
81
83
84
85
86
87
88 90
91
92
9495
96
97
98
99
100
101
102
103
104
105
106
107
108
109
110111
112
114115
116
117
118 119
120
121122
123
124 125126
127
128
129
130131
132
133
134
135
136
137
138139 142143
144
145
146
147
148
149
150
151
152 153
154
155
156
157158
159 160
161
162
163
Ka
Kb
LaLb
SIMCA-P 11 - 2007-09-20 오후 3:20:45

Organize the data in such a way that one can see which
samples are most related.
Hierarchical cluster analysis
Arabidopsis 146 lines
Ch
emica
l shift
Arabidopsis Inbred lines
No. 1 & No. 123

Sucrose
glucose
UDP-glucose
Glucose-6-P Erythrose-4-P
Shikimate Chorismate
Phosphoenolpyruvate
pyruvate
Acetyl-CoA
oxaloacetate citrate
malate isocitrate
fumarate
succinate
2-oxoglutarate
glutamate
proline
GABA
glutamine
arginine
aspartate
asparagine
Homoserine
threonine
Homocysteine
methionine
SAM nicotinamide
Aliphatic glucosinolate
Dehydroshikimic acid
Gallic acid
valine
alanine
leucine
inositolphenylalanine tyrosine
antharnilate tryptophan
Indole glucosinolate
cinnamateBenzylglucosinolateisochorismate
2,3-hydroxybenzoic acidanalogue
p-coumaric acid
Lignins Lignans
Flavonoids(Kaempferol, quercetin)
phenylpropanoids
fructose
TCA cycle
Fatty acids
citrulline
SNP107C6L9.78
M3.21
M1.10/SNP251
M3.21huA2.5
SNP107M3.21
SNP100M3.21
SNP251
M1.10C6L9.78huA2.5
QTLs Arabidopsis based on
metabolomics data

Supervised multivariate data analysis
Partial least squares regression-discriminant analysis
Ask a question to obtain maximum separation between two
or more classes.
-20
-10
0
10
-20 -10 0 10 20
GM
GM
GM
GM
GM
GM
GMGM
JGJG
JGJG
JG
JGJGMCMC
MC
MC
MCMC
MS
MSMS
MS
MSMS
MT
MT
MT
MT
MT
QJ
QJ
QJ
QJ
QJ
QJQJ
Active
Inactive

Supervised multivariate data analysis
• In this method, the signals related to activity
are separated from the superimposed at
random noise.
• Quality control can be focused on the
compounds related to activity, including
synergy and prodrugs.

Studying plants for biological active
compounds
e.g. medicinal plants, plant resistance
Reductionist
approach
• High throughput
screening and
bioassay guided
fractionation
Holistic approach
• Clinical trials
• In-vivo assays
• Systems biology

Lead discovery
Lead optimization
Identification clinical candidate
Investigational New Drug (IND) filing
Clinical studies (phase I-III)
New Drug Application (NDA)
1-2 years
1-2 years
1-3 years
3-6 years
registration
--
2-3 years
Screening
10,000-100,000
compounds
2003: 21 novel drugs
Ca. 7% of IND
pass clinical trials

Systems biology for finding active
compound(s) in (medicinal) plants
1. Different extracts or fractions of plant
2. Test activity in suitable bioassay
3. Correlate activity with signals in NMR,
LC- or GC-MS
4. Identify the compound(s) responsible for
these signals

Metabolomics and identification
active compounds in Galphimia glauca
• Collection of 6 different ecotypes
• Only two have strong sedative effect
• Can we identify metabolites
responsible for activity?
Collaboration with AT Cardoso Taketa and ML Villarreal, Mexico
Planta Med. 74(2008)1295

-20
-10
0
10
-20 -10 0 10 20
GM
GM
GM
GM
GM
GM
GMGM
JGJG
JGJG
JG
JGJGMCMC
MC
MC
MCMC
MS
MSMS
MS
MSMS
MT
MT
MT
MT
MT
QJ
QJ
QJ
QJ
QJ
QJQJ
Bioactive type
Non-bioactive type
Differentiation of Galphimia glauca
ecotypes based on anxiolytic activity
Partial least squares regression-discriminant analysis (PLS-DA)

-0.12
-0.10
-0.08
-0.06
-0.04
-0.02
-0.00
0.02
0.04
0.06
0.08
0.10
0.12
0.14
-0.12 -0.10 -0.08 -0.06 -0.04 -0.02 -0.00 0.02 0.04 0.06 0.08 0.10 0.12
10.00000" 9.96000" "9.92000" "9.88000" "9.84000" "9.80000" "
9.76000" "9.72000" "
9.68000" "9.64000" "
9.60000" "9.56000" "
9.52000" "
9.48000" "
9.44000" " 9.40000" "
9.36000" "
9.32000" "9.28000" "
9.24000" "
9.20000" "
9.16000" "
9.12000" "
9.08000" "9.04000" "
9.00000" "8.96000" "
8.92000" "
8.88000" "
8.84000" "8.80000" "
8.76000" "
8.72000" "
8.68000" "
8.64000" "
8.60000" "
8.56000" "
8.52000" "
8.48000" "
8.44000" "
8.40000" "
8.36000" "
8.32000" "
8.28000" "
8.24000" "
8.20000" "
8.16000" "
8.12000" "
8.08000" "
8.04000" "
8.00000" "
7.96000" "
7.92000" "7.88000" "
7.84000" "
7.80000" "
7.76000" "
7.72000" "7.68000" "7.64000" "
7.60000" "
7.56000" "
7.52000" "
7.48000" "
7.44000" "
7.40000" "
7.36000" "7.32000" " 7.28000" "
7.24000" "
7.20000" "
7.16000" "
7.12000" "
7.08000" "
7.04000" "
7.00000" "
6.96000" "
6.92000" "
6.88000" "
6.84000" "
6.80000" "
6.76000" "
6.72000" "
6.68000" "
6.64000" "
6.60000" "
6.56000" "
6.52000" "
6.48000" "
6.44000" "
6.40000" "
6.36000" "6.32000" "
6.28000" "
6.24000" "
6.20000" "
6.16000" "
6.12000" "
6.08000" "
6.04000" "
6.00000" "
5.96000" "
5.92000" "
5.88000" "
5.84000" "
5.80000" "
5.76000" "
5.72000" "
5.68000" "
5.64000" "
5.60000" "
5.56000" "
5.52000" "
5.48000" "
5.44000" "
5.40000" "
5.36000" "
5.32000" "
5.28000" "
5.24000" "
5.20000" "
5.16000" "
5.12000" "
4.52000" "
4.48000" "
4.44000" "
4.40000" "
4.36000" "
4.32000" "
4.28000" "4.24000" "
4.20000" "
4.16000" "
4.12000" "
4.08000" "
4.04000" "
4.00000" "
3.96000" "
3.92000" "
3.88000" "
3.84000" "
3.80000" "
3.76000" "
3.72000" "
3.68000" "
3.64000" "
3.60000" "
3.56000" "
3.52000" "
3.48000" "
3.44000" "
3.40000" "
3.36000" "
3.32000" "
3.28000" "
3.24000" "
3.20000" "
3.16000" "
3.12000" "
3.08000" "
3.04000" "3.00000" " 2.96000" "
2.92000" "
2.88000" "
2.84000" "
2.80000" "
2.76000" "
2.72000" "
2.68000" "
2.64000" "
2.60000" "
2.56000" "2.52000" "
2.48000" "
2.44000" "
2.40000" "
2.36000" "
2.32000" "
2.28000" "
2.24000" "
2.20000" "
2.16000" "
2.12000" " 2.08000" "
2.04000" "
2.00000" "
1.96000" "
1.92000" "
1.88000" "
1.84000" "
1.80000" "
1.76000" "
1.72000" "1.68000" "
1.64000" "
1.60000" "1.56000" "
1.52000" "
1.48000" "
1.44000" "1.40000" "
1.36000" "
1.32000" "
1.28000" "
1.24000" "
1.20000" "
1.16000" "
1.12000" "
1.08000" "
1.04000" "
1.00000" "
0.96000" "
0.92000" "
0.88000" " 0.84000" "
0.80000" "
0.76000" "
0.72000" "0.68000" "
0.64000" "
0.60000" "0.56000" "0.52000" "0.48000" "0.44000" "
0.40000" "0.36000" "0.32000"
Non active
Samples
Active Samples
(Triterpenoids)
Differentiation of Galphimia glauca
ecotypes based on anxiolytic activity
Loading plot PLS-DA

A 1HNMR vinylic H-1, H-2 diastereomeric galphimine B and F
B MeOH extract Galphimia glauca GM sample
Activity correlated
compounds Galphimia glauca
20
18
29
MeO2C
21
OR2
OH
O
O
R1
HO

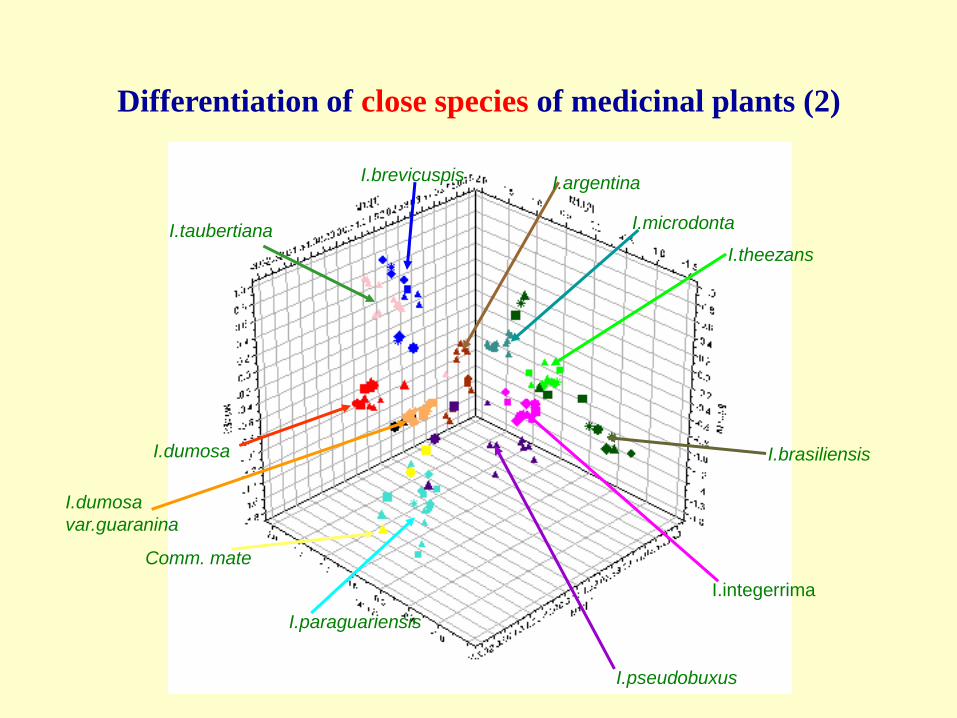
• Ilex brevicuspis
• Ilex dumosa var.dumosa
• Ilex dumosa var.guaranina
• Ilex theezans
• Ilex integerrima
• Ilex brasiliensis
• Ilex pseudobuxus
• Ilex argentina
• Ilex microdonta
• Ilex taubertiana
Which species is
closest to Ilex
paraguariensis?
Choi et al, J Agric Food Chem 53(2005)1237
Differentiation of close species
of medicinal plants
I.brevicuspis I.argentina
I.microdonta
I.theezans
I.brasiliensis
I.integerrima
I.pseudobuxus
I.paraguariensis
Comm. mate
I.dumosa
var.guaranina
I.dumosa
I.taubertiana
Differentiation of close species of medicinal plants (2)

Tree Diagram for 11 Variables
Single Linkage
Euclidean distances
0.5 1.0 1.5 2.0 2.5 3.0
Linkage Distance
Var8
Var5
Var4
Var10
Var3
Var6
Var11
Var2
Var9
Var7
Var1argentia
microdonta
pseudobuxux
brasiliensis
theezans
integerrima
breviscuspis
tauberitiana
dumosa var. dumosa
dumosa var. guaranina
paraguariensis
256 NMR signals are reduced to 10 PCs and hierarchical analysis
Differentiation of close species of medicinal plants (3)

Metabolomics and systems biology
in biodiscovery
• Library of metabolomes collected
organisms for datamining
• Identification active compounds
• Chemotaxonomy for novel structures
• Dereplication
• Understanding interactions between
organisms
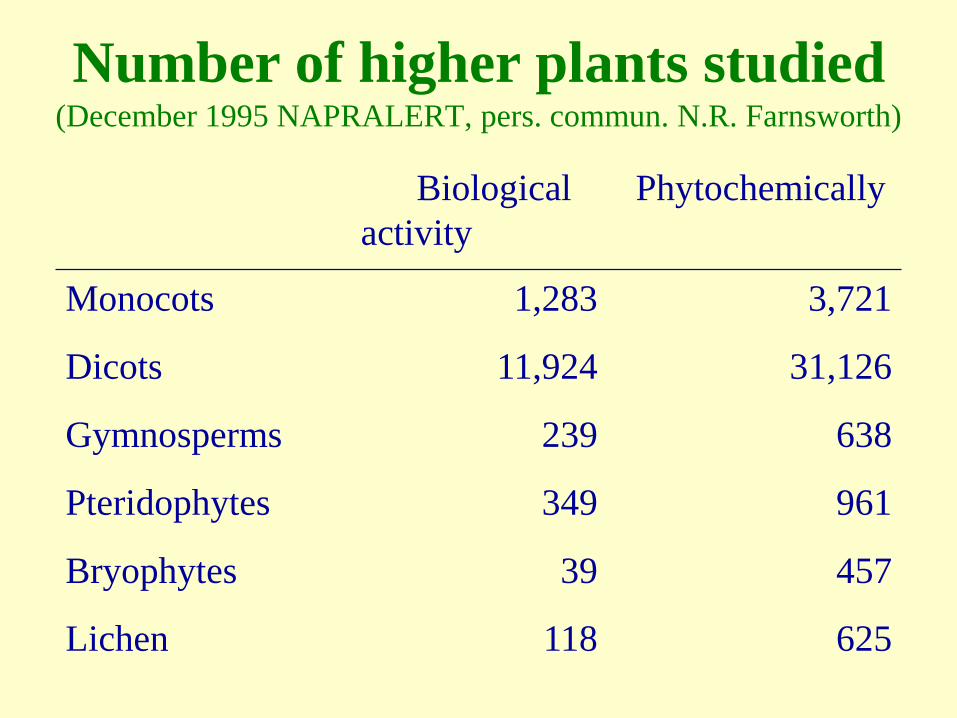
Number of higher plants studied(December 1995 NAPRALERT, pers. commun. N.R. Farnsworth)
Biological
activity
Phytochemically
Monocots 1,283 3,721
Dicots 11,924 31,126
Gymnosperms 239 638
Pteridophytes 349 961
Bryophytes 39 457
Lichen 118 625

How to apply metabolomics
in your work
1. Define the scientific question you have carefully
2. Determine the strategy you want to follow
3. Choose analytical tools, validate
4. Choose extraction method, validate
5. Determine biological variation of the system
6. Plan with statistical tools experiments to be done (number of variables, controls, replicates, etc.)
7. Analyze results with chemometric methods
8. Hypothesis

You can do it, but
• Do not try to do it all alone
• Collaborate with others
• Bring together the experts for the different
aspects of your study: biology, analytical
chemistry, natural products chemistry
bioinformatics, mathematic, …..
Metabolomics is teamwork!
Systems biology and the “omics” are all
about collaboration to:
unify, standardize, validate, combine, store
and exchange results
for long term future use

Same expertise
but another perspective!
• Metabolome instead of single compounds
• Holistic instead of reductionist

The final goal
Sustainable methods, allowing
you to use the results from all
your experiments for many
years to come.

You can do it
But where is the product?
One needs to build up a system in
which the knowledge of academia
is combined with the knowledge of
industry to develop applications!

Some characteristics natural products
Value Activity
range
amounts
Medicines High nM Kg -tons
Cosmetics High μM-mM Kg - tons
Nutraceuticals,
food additives
Intermediate -
low
mM Tons -
bulk
Agrochemicals low nM- μM Tons -
bulk
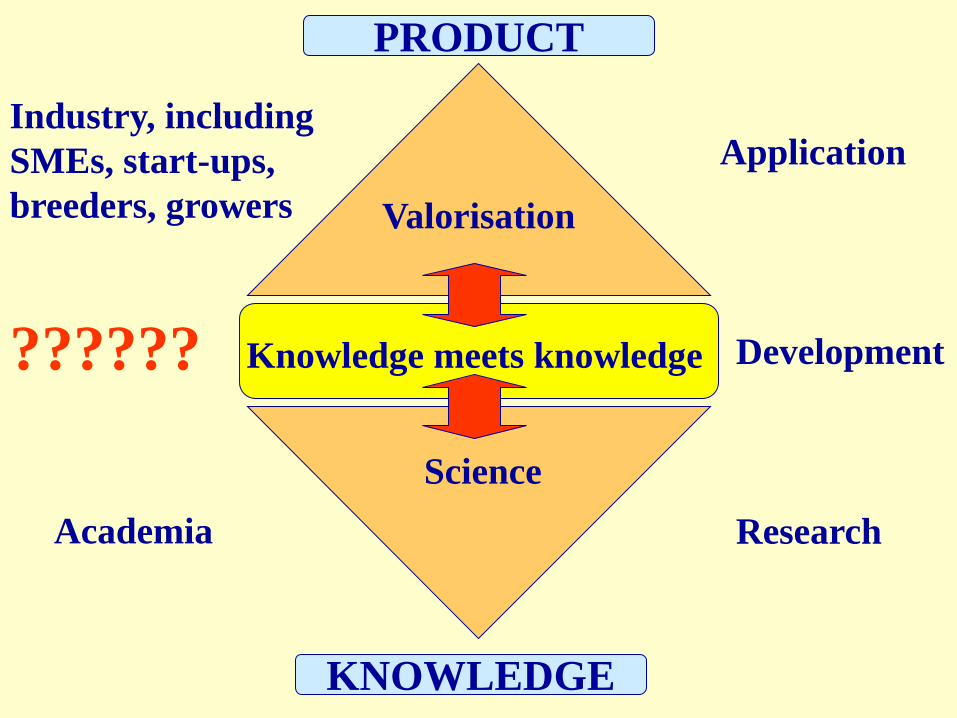
PRODUCT
KNOWLEDGE
Research
Development
Application
Academia
Industry, including
SMEs, start-ups,
breeders, growers
Science
Valorisation
Knowledge meets knowledge??????

There are no navigators
for research
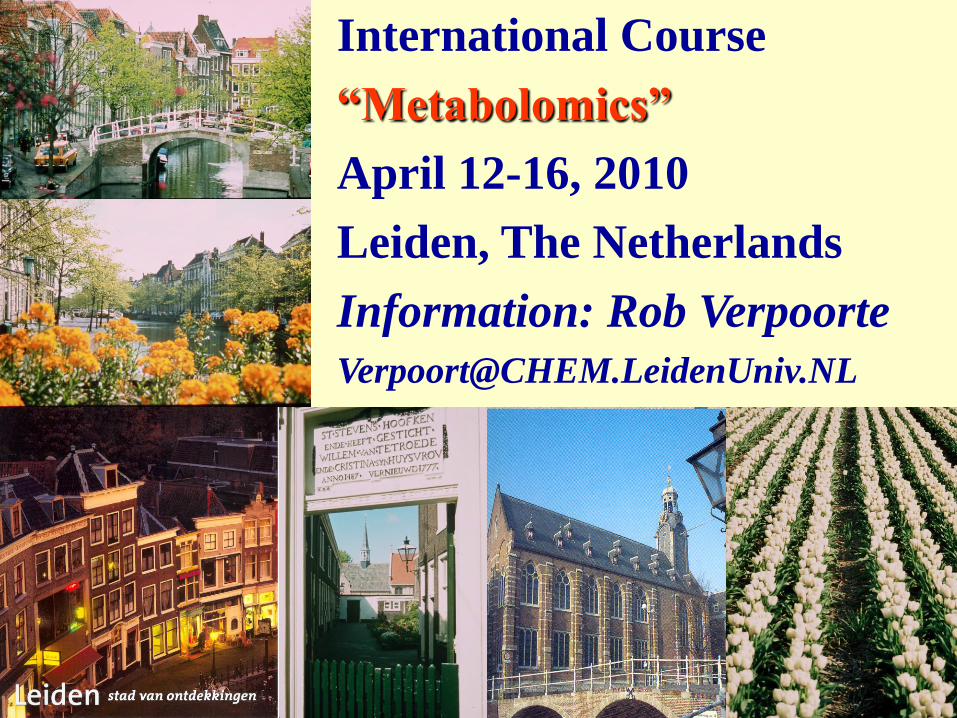
International Course
“Metabolomics”
April 12-16, 2010
Leiden, The Netherlands
Information: Rob Verpoorte