plant traits and litter decomposition of tree species naturally...
TRANSCRIPT
Plant traits and litter decomposition of tree species
naturally regenerating in Central America pasturelands
by
M. JIMENA ESQUIVEL SHEIK
A thesis submitted to the joint program for the degree of Doctor of the
Philosophy
Doctoral advisory committee:
PhD. Bryan Finegan
PhD. John Healey
PhD. Fernando Casanoves
PhD. Andreas Nieuwenhuyse
Graduate School, Tropical Agricultural Research and Higher
Education Center (CATIE), Turrialba, Costa Rica
School of Environment, Natural Resources and Geography, Bangor
University (BU), United Kingdom
2013

II

III
DECLARATION AND CONSENT
Details of the Work
I hereby agree to deposit the following item in the digital repository maintained by Bangor
University and/or in any other repository authorized for use by Bangor University.
Author Name: …………………………………………………………………………...
Title: ……………………………………………………………..……………………….
Supervisor/Department: ..................................................................................................
Funding body (if any): ......................................................................................................
Qualification/Degree obtained: ......…………………………………………………….
This item is a product of my own research endeavours and is covered by the agreement
below in which the item is referred to as “the Work”. It is identical in content to that
deposited in the Library, subject to point 4 below.
Non-exclusive Rights
Rights granted to the digital repository through this agreement are entirely nonexclusive. I
am free to publish the Work in its present version or future versions elsewhere.
I agree that Bangor University may electronically store, copy or translate the Work to any
approved medium or format for the purpose of future preservation and accessibility. Bangor
University is not under any obligation to reproduce or display the Work in the same formats
or resolutions in which it was originally deposited.
Bangor University Digital Repository
I understand that work deposited in the digital repository will be accessible to a wide
variety of people and institutions, including automated agents and search engines via the
World Wide Web.
I understand that once the Work is deposited, the item and its metadata may be incorporated
into public access catalogues or services, national databases of electronic theses and
dissertations such as the British Library’s EThOS or any service provided by the National
Library of Wales.
I understand that the Work may be made available via the National Library of Wales
Online Electronic Theses Service under the declared terms and conditions of use
(http://www.llgc.org.uk/index.php?id=4676). I agree that as part of this service the National
Library of Wales may electronically store, copy or convert the Work to any approved
medium or format for the purpose of future preservation and accessibility.The National
Library of Wales is not under any obligation to reproduce or display the Work in the same
formats or resolutions in which it was originally deposited.

IV
Statement 1:
This work has not previously been accepted in substance for any degree and is not being
concurrently submitted in candidature for any degree unless as agreed by the University for
approved dual awards.
Signed ………………………………………….. (candidate)
Date ……………………………………………..
Statement 2:
This thesis is the result of my own investigations, except where otherwise stated. Where
correction services have been used, the extent and nature of the correction is clearly marked
in a footnote(s).
All other sources are acknowledged by footnotes and/or a bibliography.
Signed …………………………………………. (candidate)
Date …………………………………………….
Statement 3:
I hereby give consent for my thesis, if accepted, to be available for photocopying, for inter-
library loan and for electronic repositories, and for the title and summary to be made
available to outside organisations.
Signed …………………………………………. (candidate)
Date …………………………………………….
NB: Candidates on whose behalf a bar on access has been approved by the Academic
Registry should use the following version of Statement 3:
Statement 3 (bar):
I hereby give consent for my thesis, if accepted, to be available for photocopying, for inter-
library loans and for electronic repositories after expiry of a bar on access.
Signed …………………………………………… (candidate)
Date ………………………………………………

V
Statement 4:
Choose one of the following options
a) I agree to deposit an electronic copy of my thesis (the Work) in the Bangor University
(BU) Institutional Digital Repository, the British Library ETHOS system, and/or in any
other repository authorized for use by Bangor University and where necessary have
gained the required permissions for the use of third party material.
b) I agree to deposit an electronic copy of my thesis (the Work) in the Bangor University
(BU) Institutional Digital Repository, the British Library ETHOS system, and/or in any
other repository authorized for use by Bangor University when the approved bar on
access has been lifted.
c) I agree to submit my thesis (the Work) electronically via Bangor University’s e-
submission system, however I opt-out of the electronic deposit to the Bangor University
(BU) Institutional Digital Repository, the British Library ETHOS system, and/or in any
other repository authorized for use by Bangor University, due to lack of permissions for
use of third party material.
Options B should only be used if a bar on access has been approved by the
University.
In addition to the above I also agree to the following:
1. That I am the author or have the authority of the author(s) to make this agreement and do
hereby give Bangor University the right to make available the Work in the way described
above.
2. That the electronic copy of the Work deposited in the digital repository and covered by
this agreement, is identical in content to the paper copy of the Work deposited in the
Bangor University Library, subject to point 4 below.
3. That I have exercised reasonable care to ensure that the Work is original and, to the best
of my knowledge, does not breach any laws – including those relating to defamation, libel
and copyright.
4. That I have, in instances where the intellectual property of other authors or copyright
holders is included in the Work, and where appropriate, gained explicit permission for the
inclusion of that material in the Work, and in the electronic form of the Work as accessed
through the open access digital repository, or that I have identified and removed that
material for which adequate and appropriate permission has not been obtained and which
will be inaccessible via the digital repository.
5. That Bangor University does not hold any obligation to take legal action on behalf of the
Depositor, or other rights holders, in the event of a breach of intellectual property rights, or
any other right, in the material deposited.
6. That I will indemnify and keep indemnified Bangor University and the National Library
of Wales from and against any loss, liability, claim or damage, including without limitation
any related legal fees and court costs (on a full indemnity bases), related to any breach by
myself of any term of this agreement.
Signature: ………………………………………………………
Date : ……………………………………………......................
VI
DEDICATION
To my parents; Carlos and Nohemy,
Who are exceptional parents and supported me with their time and love in every
new step of life.
To my daughter and husband; Sofia and Raffaele,
Who are both my daily fairy, for them altruistic patience to let mum think in trees
for so much time.
To Tiberio Giraldo and Bellavista community in Versalles, El Dovio, Valle del
Cauca, Colombia,
The visionary farmer, who was the first to allow me start studying trees in his
pastures, and the farmers’ community who taught me that trees can make a real difference
in farmer’s life.
VII
ACKNOWLEDGEMENTS
This research would not have been possible without the big supports of so many
people from so many different countries. To those I can remember and to those who I don’t,
thank you!
In Costa Rica:
To Muhammad Ibrahim (Gamma, CATIE) for his permanent support to continue
my research focused on tree ecology in silvopastoral systems in spite of some skepticism
by others since my first arrive at CATIE.
To Bryan Finegan (Forest Department) and Fernando Casanoves (Statistic
department) my supervisor and co-advisor in CATIE, thank you for the theoretical and
analytical inputs and discussions which enriched the final research results.
I am thankful to Glenn Galloway, Tom Dormody and the staff of the Postgraduate
School at CATIE.
To CATIE colleagues Sergio Vilchez, Yuliney Perdomo and Nelly, for their careful
work in the experiments run at CATIE.
To Patricia Leandro for soil and vegetable tissue determinations and for her detailed
and precise work at CATIE Soil Laboratories.
To my friends and colleagues on the join CATIE doctoral programs, Jorge Chagoya,
Sol, Pavel, Adina, Aleja, Carlitos, Clis, Sonia, Fausto, Kristen, thanks for all the
encouraging doctoral conversations.
VIII
In Bangor, UK:
To John Healey (School of Environment, Natural Resources and Geography) and
David Jones (Environment Centre Wales) my supervisor and co-advisor in the University
of Wales, thanks for their opportune feedbacks, logistic support and laboratory facilities.
Special thanks to Fergus Sinclair, Rachel Tylor, Thomas Easdale and Fer,
Genevieve Lamond, Yara Armanza and Juan, Sara Liviero, Cliserio, Pavel Bautista and
Diana, Martin and Nicola, for their friendly support during my stay in Bangor.
To Gordon Turner, Saskia Pagella and Mark Farrell, for their support to develop
tissues analyses in the Environment Centre (ECW) laboratories.
In Nicaragua:
To Andreas Nieuwenhuyse and Amilcar Aguilar (Degraded pastures project,
CATIE- Norway) thank you for the field experimental advices and the administrative
support during field work in Muy Muy, Matagalpa.
To Maribel Gonzales, my strong and responsible field assistant, special thanks for
her perseverant and hard work during the data collection and processing of information.
Many other local young students also helped me plant surveys and sample collections, to all
them thank you for your enthusiastic support.
Thank you also to the CATIE staff in Muy Muy for the logistic collaboration and
facilities throughout the field site work.
All my gratitude to Muy Muy farmers and their families, this research would not
have been possible without your welcoming attitude in your lands and paddocks. Special
thanks to La Estrella ranch and many local farmers: to Otilio Castro, Eddie González,
IX
Donald Bucardo, Adolfo Roque, Luis Rocha, Canuto and Danilo Membreño, Virgilio
Membreño, Marco Cisneros and Manuel Santana Plata.
To Muy Muy families and community, especially to Sonia Castro and Francisco
Valenzuela, who opened their homes to foreign researches.
In Cali, Colombia:
To the Centre for Research on Sustainable Agricultural production systems -
CIPAV for their encouraging support to continue my research focusing on trees in tropical
agriculture landscapes.
Thanks also to all my Esquivel Sheik family in Cali, for their in-conditional and
multitasking support overseas.
Finally, to my sponsors; this doctoral research was economically supported by:
“Multi-stake-holders participatory development of sustainable land use alternatives
for degraded pasturelands in Central America” project led by GAMMA group at CATIE,
funded by the Norwegian Ministry of Foreign Affairs, and by the Research Council of
Norway (NORWAY) and implemented in Muy Muy, Matagalpa, Nicaragua. In its
abbreviated name: Alternatives for the use of degraded pastures in Central America –
Degraded pasturelands – PD/ CATIE-NORWAY, Nicaragua.
DIVERSUS Project –Production and Conservation in Forests Programme - CATIE,
Costa Rica.
School of Environment, Natural Resources and Geography, Bangor University –
BU, Wales, Reino Unido.
Department of Agriculture and Agroforestry – CATIE, Costa Rica.

X
CONTENTS
DECLARATION AND CONSENT .......................................................................................... III
DEDICATION ........................................................................................................................... VI
ACKNOWLEDGEMENTS ..................................................................................................... VII
CONTENTS ................................................................................................................................ X
SUMMARY ............................................................................................................................ XIII
LIST OF TABLES ................................................................................................................... XV
LIST OF FIGURES ............................................................................................................. XVIII
LIST OF ACRONYMS .......................................................................................................... XXI
CHAPTER 1. General Introduction ....................................................................................... 1
1.1 Background statement ............................................................................................ 1
1.2 Aims and context of the research project ............................................................... 4 1.3 Study site ................................................................................................................ 6
1.4 General Objectives ................................................................................................. 7 1.5 General Hypothesis ................................................................................................ 8
CHAPTER 2. Vegetative and dispersal functional niches of tree species in seasonal
tropical pastures ...................................................................................................................... 10
2.1 ABSTRACT ......................................................................................................... 10
2.2 INTRODUCTION ............................................................................................... 11
2.3 METHODS .......................................................................................................... 20
Study site ...................................................................................................................... 20 Trait measurements ...................................................................................................... 21
Data analysis ................................................................................................................ 25
2.4 RESULTS ............................................................................................................ 27
Whole plant traits ......................................................................................................... 27 Leaf traits ..................................................................................................................... 28
Whole plant and leaf traits ........................................................................................... 28 Dispersal traits ............................................................................................................. 33 Dispersal mode ............................................................................................................ 34 Dispersal and whole plant traits .................................................................................. 37 Dispersal and leaf traits ............................................................................................... 38
Whole plant, leaf and dispersal traits .......................................................................... 40
2.5 DISCUSSION ...................................................................................................... 42
Whole plant traits ......................................................................................................... 42 Leaf traits ..................................................................................................................... 44 Relationships between leaf and vegetative traits of Neotropical tree species ............. 48
Dispersal traits ............................................................................................................. 49
XI
Tree investments on dispersal traits are coordinated with other stages of tree life
history ........................................................................................................................... 56
2.6 CONCLUSIONS .................................................................................................. 64
CHAPTER 3. Adult tree abundances and plant traits predict tree species natural
regeneration in active neotropical pasturelands ......................................................................... 66
3.1 ABSTRACT ......................................................................................................... 66 3.2 INTRODUCTION ............................................................................................... 67
3.3 METHODS .......................................................................................................... 78
Trait measurements ...................................................................................................... 78 Abundance of adult tree cover and tree natural regeneration ..................................... 82
3.4 RESULTS ............................................................................................................ 86
Relationships of plant traits with abundance of tree natural regeneration ................. 86 Functional characterization of adult’s tree community in active pasturelands .......... 90
Relationships of dispersal mode with abundance of tree natural regeneration .......... 92 Multivariate relationship of plant traits with abundance of tree natural regeneration
...................................................................................................................................... 92
3.5 DISCUSSION ...................................................................................................... 95
Dispersal, leaf and whole plant traits were correlated with the abundance of tree
natural regeneration in active pasturelands ................................................................ 95 Functional characterization of adult tree cover in active pasturelands .................... 101 Adult abundance was strongly and positively correlated with sapling and seedling tree
abundance. ................................................................................................................. 103 Plant traits predict the abundances of tree natural regeneration in active
pasturelands, but adult abundance is the strongest predictor. .................................. 104
3.6 CONCLUSIONS ................................................................................................ 106
CHAPTER 4. Litter quality and decomposability of neotropical tree species with
different capacity to naturally regenerate in active pasturelands ............................................. 108
4.1 ABSTRACT ....................................................................................................... 108 4.2 INTRODUCTION ............................................................................................. 109 4.3 METHODS ........................................................................................................ 118
Litter decomposition experiment in standard environmental condition .................... 118 Litter quality ............................................................................................................... 123
Plant traits .................................................................................................................. 124 Natural regeneration of tree species .......................................................................... 125
Statistical analyses ..................................................................................................... 127
4.4 RESULTS .......................................................................................................... 129
Leaf litter decomposition rates and leaf quality of trees commonly found in active
pasturelands ............................................................................................................... 129 Relationship of tree leaf litter decomposition rates with quality in leaves and litter 140 Relationship of the overall leaf litter decomposition rates with macronutrients and C
fractions releases ....................................................................................................... 146

XII
Changes in content of carbon fractions between green leaves, fresh litter and litter
remaining after decomposition .................................................................................. 148
Relationships of plant traits with decomposition rates, tree litter quality and nutrient
release ........................................................................................................................ 150 Relationships between abundances of tree natural regeneration and leaf litter quality,
decomposition rates and nutrient release. ................................................................. 156
4.5 DISCUSSION .................................................................................................... 159
Leaf litter decomposition rates and leaf quality of trees commonly found in active
pasturelands ............................................................................................................... 159 Differences in decomposition rates between tree species .......................................... 159 Inter-specific variability in leaf and litter quality composition ................................. 163 Relationship of tree leaf quality with litter decomposition rates ............................... 185
Relationships of plant traits with decomposition rates, tree litter quality and nutrient
release ........................................................................................................................ 188
Relationships between abundances of tree natural regeneration and leaf litter quality,
decomposition rates and nutrient release. ................................................................. 191
4.6 CONCLUSIONS ................................................................................................ 193
CHAPTER 5. GENERAL DISCUSSION ......................................................................... 195
5.1 INTRODUCTION ............................................................................................. 195 5.2 Tree functional strategies in Central American active pasturelands .................. 195 5.3 Tree population responses to anthropogenic disturbances ................................. 198
5.4 Tree effects on ecosystem processes .................................................................. 203 5.5 PRACTICAL RECOMMENDATIONS ............................................................ 207
5.6 GENERAL CONCLUSIONS ............................................................................ 214
CHAPTER 6. REFERENCES ........................................................................................... 215

XIII
SUMMARY
This research uses three consecutive approaches to evaluate the links among
morphological diversity and ecosystem processes of 65 tree species commonly found in
Central American active pasturelands (AP) under conventional management practices.
Firstly, we explore tree morphological diversity measuring 17 plant traits (PT) to describe
the functional strategies (FS) of tree species in agricultural lands. Secondly, we explore tree
responses to anthropogenic disturbances like conventional pasture management testing the
relationships of tree morphological diversity with tree abundances and exploring their
relative utility to predict tree natural regeneration capacity (CNR) in agricultural lands.
Thirdly, we test whether tree species variability in litter quality, decomposition rates and
nutrient releases was related with tree morphological diversity and tree abundances to
explore the effects of tree characteristics on litter decomposition. This approximation
allows exploring for the first time the effects of tree variability on ecosystems processes in
anthropogenic environments and the possible effects of actual management over today and
future provision of ecosystem services (ES) such as soil fertility replenishment and nutrient
cycling offered by trees outside the remnant tropical forests.
Tree functional strategies (TFS) were described as particular combination of PTs
strongly related to four main trait dimensions i.e. Leaf Economy Spectrum (LES), stem
density, canopy height and reproductive variability spectrums. Measured leaf traits were
leaf area, specific leaf area, leaf dry matter content, total carbon, phosphorus and nitrogen
leaf content, foliar tensile strength. Whole plant traits included wood density, maximum
tree hight and leaf phenology while measured tree reproductive traits were fruit and seed
mass, volume, shape and dispersal mode. Tree abundances at three different developmental
stages were surveyed once for 76 tree species in nested plots on 46 APs: adult tree (dbh ≥
10 cm) in one hectare plot, saplings (dbh ≤ 10 but more than 30 cm height) and seedlings
(lower than 30 cm height). A decomposition experiment with litterbags under standard
environmental conditions (temperature and humidity) was established during four months
for litter of 37 tree species to obtain overall (B5), partial (B4) and monthly litter decay rates
(b1, b2, b3, b4). Total macronutrients (C, P, N) and C fractions contents (SOL, HEM,
CELL and LIG) were measured on fresh and decomposed litter to measure the percentage
of nutrient released during litterbags incubation.
Multidimensional relationships among PTs were analyzed using principal
components analyses (PCA). Paired relationships among PTs, tree abundances, litter
quality, decomposition rates and nutrient releases were analyzed using Spearman
Correlation Analyses (CA) for quantitative variables and Logistic Regressions (LoRe) for
categorical ones. PT and tree abundances capacity to predict tree natural regeneration was
addressed using Multiple Regressions (MR) with Stepwise elimination method.
We found that tree species in APs have wide variability of leaf, reproductive and
whole plant traits with leaf variability strongly associated with other plant traits
dimensions. LES (conservative vs acquisitive) is strongly correlated with the Stem and
Phenology Spectrum (SPS). A novel Reproductive Investment Spectrum (RIS) splitting
apart tree species with bigger and heavier fruits and seeds from those with small and lighter
ones (expensive vs cheap), was correlated to both LES and SPS. Resulting holistic plant
XIV
trait associations were complex showing five main ordination axes explaining between 10
to 20% of tree species variability, without showing any tendency to form tightly-defined
“functional groups”. Resulted dispersal modes provided good examples of tree strategies
that split species’ traits variability with particular combinations of whole plant, leaf and
reproductive traits.
All PTs are correlated with both tree species abundances and CNR in APs. Some
successful PTs at seedlings and saplings stages were different from successful PTs in adult
tree cover. Species with denser woods, P rich leaves and expensive seeds have more sapling
abundances meanwhile species with C and N rich leaves have more abundant seedlings.
Tree species dispersed by cattle were abundant as seedlings and saplings while those
dispersed by local fauna were limited in all developmental stages. Adult tree abundances
were strongest predictors of tree seedlings and saplings abundances in AP and together with
PTs explain a higher proportion of species abundance variability (60 - 67%).
We expand actual knowledge of the afterlife effect of leaf traits to decomposition
dynamics, carbon and nutrient cycling stating that tree species with acquisitive leaves
decompose faster and release more N, P, C , SOL and HEM than more conservative
species. In addition to leaf traits, also stem and reproductive traits are related with
differences in litter quality, decomposition rates and macronutrients releases during
decomposition, thus linking the afterlife effect of leaf traits directly with tree natural
regeneration capacity.
The multidimensional FS observed in APs suggest that loss of any particular tree
characteristic could affect different ES offered by actual tree cover remaining in tropical
agricultural lands. The significant relationships among PTs and tree abundances show that
some PTs favor tree CNR after land use change meanwhile other PTs are associated to
species with limited CNR. The significant relationships we found among decomposition
rates with PTs and CNR suggest that more abundant trees tend to have faster
decomposition rates while less abundant tree species tend to present slow leaf-
decomposition rates.
These findings indicate that plant characteristics and tree natural regeneration are
linked with ecosystem processes such as litter decomposition which has direct implications
for important sustainability factors in agricultural systems such as nutrient and carbon
cycling. Actual tree functional diversity and the capacity to provide ES under current
management practices in APs will possibly decrease as a consequence of loss of some trees
with particular PTs and the limited CNR. Conventional pastures management (i.e. reduction
of tree cover) will probably reduce future tree cover diversity by eliminating those species
which cannot naturally regenerate in active pastures, slowing tree litter decomposition rates
and reducing the rates of nutrient releases, with impacts on actual and future capacity to
provide these ecosystem services.
This link between plant characteristics and ecosystem processes is particularly
important to improve actual management practices aiming to promote the sustainability of
agro ecosystems. This is especially relevant for the management of highly-diverse tropical
lands where the effects of forest fragmentation by land use change to agricultural systems
on ecosystem services has been understudied.

XV
LIST OF TABLES
Table 2.1. Whole plant, leaf and dispersal traits units and sample sizes measured for tree
species in neo-tropical and active pasturelands in Central America ........................22
Table 2.2. Dispersule characteristics used to categorize the dispersal mode traits adapted
from Cornelissen et al. (2003) ..................................................................................24
Table 2.3. Number of species sampled by plant trait (n) included in the cross-species
correlations Spearman analyses (r), for the Principal Components analyses
(PCA) done independently for each plant trait dimension: whole plant (W), leaf
(L) and dispersal (D) and for their interactions (WL, DW, DL, WLD) and the
species/traits ratio by matrix size (n x traits) ............................................................26
Table 2.4. Spearman correlation coefficients ( r ) between whole plant (H_max, WD, PHE)
, leaf ( SLA, LA, LDMC, LCC, LPC, LNC, FTF) and dispersal traits (Sha_Fru,
Sha_see, Mass_fru, Mas_see, Vol_Fru, Vol_see) for tree species commonly
found in neotropical active pasturelands ..................................................................30
Table 2.5. Spearman correlation coefficients r between whole plant (H_max, WD, PHE),
leaf (SLA, LA, LDMC, LCC, LPC, LNC, FTF) and dispersal traits (Sha_Fru,
Sha_see, Mass_fru, Mas_see, Vol_Fru, Vol_see) with the principal components
resulting from the PCA analyses resulted from paired trait dimensions
interactions (WL, WD, LD) and for all the traits together (WLD) ..........................31
Table 2.6. Dispersal modes of tree species commonly found in active pasturelands
categorized according with fruit and seed characteristics (Cornelissen et al.
2003) ........................................................................................................................35
Table 2.7. Regression coefficient for logistic models (ß) between whole plant (H_max,
WD, PHE) , leaf (SLA, LA, LDMC, LCC, LPC, LNC, FTF), dispersal traits
(Sha_Fru, Sha_see, Mass_fru, Mas_see, Vol_Fru, Vol_see) with the main
dispersal modes tree species commonly found in neotropical active pasturelands ..36
Table 3.1. Plant traits (continuous) units and sample sizes measured on adult trees (dbh ≥
10 cm) and abundances of tree species naturally regenerating on neo-tropical
and active pasturelands in Central America .............................................................80
Table 3.2. Dispersule characteristics used to categorize the dispersal mode traits adapted
from Cornelissen et al (2003) ...................................................................................81
Table 3.3. Partial Spearman correlations coefficients between the abundances of natural
tree regeneration in active pasturelands (residuals) with whole plant, green and
dispersal traits including additional dispersal ..........................................................86
Table 3.4. Partial Spearman correlations coefficients between the abundances of natural
tree regeneration in active pasturelands (residuals) with whole plant, green and
dispersal traits including additional dispersal ..........................................................92
Table 3.5. The total, adjusted and partial determination coefficients (r2, r2Ad) for the
multiple regression models and estimated parameters obtained for plant traits
and adult abundances as predictors of tree natural regeneration abundances
(seedlings and saplings) in active pasturelands ........................................................94

XVI
Table 4.1. Number of species and sample sized surveyed to measure tree decomposition
rates, litter quality (macronutrients and C fractions in fresh and decomposed
litter), plant traits (whole plant, leaf and dispersal) and natural regeneration
abundances for tree species commonly found in active pasturelands in
Matagalpa, Nicaragua, Central America ................................................................126
Table 4.2. Mean and range of variavility (Minimum and maximum values) of the
percentage of remainig litter mass (Rem), the overall (Beta 5), partial (Beta 4)
and monthly decomposition rates (b1, b2, b3, b4) estimated by specie (n=37)
and using four regressions (n=148) by each species, using time as regressor
variable ...................................................................................................................131
Table 4.3. Mean percentages (%) of total macronutrients (Phosphorus - LPC, Nitrogen -
LNC and Carbon - LCC) and C fractions (Soluble compounds - SOL,
Hemicelluloses - HEM, Cellulose - CEL and Lignin - LIG) contents in green
leaves, fresh (t0), remaining litter (t4) and mean percentages of it loses through
leaves senescence (from green to litter transition) and during decomposition
process (from fresh litter to remaining litter) in tree species commonly found in
active pasturelands in Central America ..................................................................134
Table 4.4. Spearman rank correlation coefficients of the relationships of overall and partial
decomposition rates with a) the contents of dry matter fractions, total
macronutrients and b) C fractions in leaves and fresh litter for 37 tree species
regenerating naturally in active neotropical pasturelands ......................................142
Table 4.5. Spearman rank correlations of green leaf traits related to a) macronutrients with
macronutrient and b) C fractions contents in fresh and litter remaining after
decomposition and with their losses during decomposition for tree species
naturally regenerating in active neotropical pasturelands¡Error! Marcador no definido.
Table 4.6. Spearman rank correlations of green leaf traits related to a) macronutrients with
macronutrient and b) C fractions contents in fresh and litter remaining after
decomposition and with their losses during decomposition for tree species
naturally regenerating in active neotropical pasturelands ......................................144
Table 4.7. Spearman correlations between a) C fractions contents in green leaves (n = 15)
and b) C fractions contents in fresh litter (n = 33) with C fractions contents in
fresh litter, remaining litter and with their looses during decomposition process
of tree species naturally regenerating in active neotropical pasturelands ..............145
Table 4.8. Spearman rank correlations between a) C fraction and b) macronutrients
contents among green leaves, fresh litter, litter remaining after decomposition
and C fraction looses during decomposition process of tree species naturally
regenerating in active neotropical pasturelands .....................................................149
Table 4.9. Spearman rank correlation coefficients of overall and monthly decomposition
rates and percentages of litter mass remaining after decomposition with
vegetative, leaf and dispersal traits of tree species commonly found in active
neotropical pasturelands .........................................................................................152
Table 4.10. Spearman rank correlation coefficients of a) total nutrient and b) C fraction
contents in fresh litter with whole plant traits of tree species commonly found in
active neotropical pasturelands ..............................................................................153
Table 4.11. Spearman rank correlation coefficients of a) total nutrient and b) C fraction
contents in fresh litter with fruit and seed traits of tree species commonly found
in active neotropical pasturelands ..........................................................................155
XVII
Table 4.12. Spearman rank correlation coefficients between population densities at three life
stages of tree species in active anthropogenic neotropical pasturelands and leaf
litter decomposition rates .......................................................................................156
Table 4.13. Spearman rank correlation coefficients for relationships between fresh litter total
macronutrients contents and tree species population densities in three life stages
in active pasturelands .............................................................................................157
Table 4.14. Spearman rank correlation coefficients of the relationships between fresh litter C
fraction contents and tree species population densities in three life stages in
active pasturelands .................................................................................................157
XVIII
LIST OF FIGURES
Figure 1.1. Diagram of the relationships among components of a Sylvopastoral System
where grass and woody species are combined for livestock production within
the framework of the three research chapters (grey lined squares) ............................9
Figure 2.1. PCA biplot for whole plant traits: maximum tree height (H_max), wood density
(WD) and leaf phenology (PHE); and leaf traits: specific leaf area (SLA), leaf
area (LA), leaf dry matter content (LDMC), total leaf carbon, phosphorus and
nitrogen contents (LCC, LPC, LNC) and leaf tensile strength (FTF1), measured
for 26 tree species commonly found in actively-managed anthropogenic
Neotropical pasturelands. .........................................................................................32
Figure 2.2. PCA biplot for dispersal traits: fruit and seed mass (Mas_Fru, Mas_See), volume
(Vol_Fru, Vol_See) and shape (Sha_Fru, Sha_See) measured for 29 trees
species commonly found in actively managed anthropogenic Neotropical
pasturelands ..............................................................................................................34
Figure 2.3. PCA Biplot showing species distribution by whole plant traits: maximum tree
height (H_max), wood density (WD) and leaf phenology (PHE); and dispersals
traits: fruit and seed masses (Mass_Fru and Mass_See), volume (Vol_Fru,
Vol_See) and shape (Sha_Fru, Sha_See), measured for 18 tree species
commonly found in actively-managed anthropogenic Neotropical pasturelands ....37
Figure 2.4. PCA biplot showing species distribution by dispersal traits: fruit and seed
masses (Mass_Fru and Mass_See), volume (Vol_Fru, Vol_See) and shape
(Sha_Fru, Sha_See); and leaf traits: specific leaf area (SLA), leaf area (LA), leaf
dry matter content (LDMC), total leaf carbon, phosphorus and nitrogen contents
(LCC, LPC, LNC) and leaf tensile strength (FTF), measured for 20 tree species
commonly found in actively-managed anthropogenic Neotropical pasturelands ....39
Figure 2.5. PCA biplot showing species distribution by whole plant (H_max, WD, PHE),
leaf (SLA, LA, LDMC, LCC, LPC, LNC, FTF) and dispersal (Sha_Fru,
Sha_See, Mas_Fru, Mas_See, Vol_Fru, Vol_See) traits measured for 25 tree
species commonly found in actively-managed anthropogenic Neotropical
pasturelands. .............................................................................................................41
Figure 3.1. Relationships between adults, saplings and seedlings abundances of tree species
in neo-tropical and active pasturelands in Central America (r and p values in
table 3.3) ...................................................................................................................88
Figure 3.2. Relationships between adults, saplings and seedlings abundances with some
plant traits of tree species in neo-tropical and active pasturelands in Central
America. ...................................................................................................................90
Figure 4.1. Spatial layout of litterbags within 2 m2 of each of the 4 litter beds located in a
glasshouse in CATIE. Six plots with 24 litterbags were located by 2 m2 of litter
bed. .........................................................................................................................122
Figure 4.2. Mean percentages of remaining litter mass (Rem) during 4 months of incubation
in standard conditions for 37 tree species commonly found in active pasturelands
in Central America. Different letters indicate ANOVA significant differences in
mean Rem (p ≤ 0.05). Black points remark the location of some common tree

XIX
species in the Rem gradient belonging to each significant identified species
group. .....................................................................................................................130
Figure 4.3. Litter decay using the percentage of remaining litter mass (Rem) after each
litterbags harvest (every 4 weeks) for 37 tree species commonly found in active
pasturelands in Central America during the 4 months of litter incubations under
standard conditions. Coloured lines indicate the location of some common tree
species and of those located in the extreme of the litter decay gradient according
to the mean Rem. Letter indicate ANOVA significant differences (p ≤ 0.05). ......130
Figure 4.4. Litter decay curves fitted to a simple exponential model regression for the four
months of litter decomposition (the estimated BETA 5) in standard conditions
for some of the 37 tree species commonly found in active pasturelands in
Central America .....................................................................................................132
Figure 4.5. Cluster plot showing tree species similarities (Euclidean distance and Ward
method) in decomposition rates regressions parameters (BETA 5) estimated by
specie in a 4 months litter decomposition experiment under controlled
conditions in Central America. The cutting identify groups of species with more
similar decomposition rates according to a DGC mean comparison test (p ≤
0.05) performed a-posteriori to an ANOVA (Wilks F= 209.18; p <0.0001) ........133
Figure 4.6. Mean total contents of a) Carbon – LCC, b) Phosphorus – LPC and c) Nitrogen -
LNC in green (0) leaves of tree species commonly found in active pasturelands
in Central America. ................................................................................................136
Figure 4.7. Mean total macronutrients contents (Phosphorus - LPC, Nitrogen - LNC and
Carbon - LCC) expressed in a) grammes (g) and b) percentages (%) in green
leaves (green), fresh litter (t0), remaining litter (t4) after decomposition and
their looses after leaves senescence (green –t0) and decomposition (t0 – t4)
measured in tree species commonly found in active pasturelands in Central
America. Contents in grams (g) should be divided by 100 to obtain the real
values. LPC contents in black, LNC in gray, LCC in white. .................................137
Figure 4.8. Mean contents (g) of C fractions (Soluble compounds - SOL, Hemicelluloses -
HEM, Cellulose - CEL and Lignin - LIG) in a) green leaves, b) fresh (t0) and c)
remaining litter (t4) in tree species commonly found in active pasturelands in
Central America. SOL contents in white, HEM in light gray, CEL in dark grey
and LIG in black .....................................................................................................138
Figure 4.9. Mean contents of C fractions (Soluble compounds - SOL, Hemicelluloses -
HEM, Cellulose - CEL and Lignin - LIG) expressed in a) litter (g) and b)
percentages (%) in green leaves, fresh litter, remaining litter after decomposition
and their looses after leaves senescence (from green to litter transition) and
decomposition (from fresh litter to remaining litter) measured in tree species
commonly found in active pasturelands in Central America. SOL contents in
white, HEM in light gray, CEL in dark grey and LIG in black ..............................139
Figure 5.1. Methodological approaches used to describe the tree functional strategies as
particular combination of plant traits strongly related with the main dimensions
of plant variability i.e. leaf, whole plant and reproductive traits, for 65 tree
species commonly found in active pasturelands (chapter1). Intra and inter-
dimensional relationships among plant traits were tested with correspondence
analyses (CA) for paired correlations, principal components analyses (PCA) for
multiple correlations and logistic regressions (LoRe) for paired correlations with
categorical traits. ....................................................................................................196
XX
Figure 5.2. Methodological approaches used to evaluate the relationships between tree
capacities to naturally regenerate under anthropogenic disturbances and the main
dimensions of plants variability i.e. leaf, whole plant (stem height and density)
and reproductive traits for 65 tree species commonly found in active
pasturelands (Chapter 2). ........................................................................................199
Figure 5.3. Methodological approaches to evaluate the relationships between the variability
of tree species in litter quality, decomposition and nutrient releases rates with the
main dimensions of plants variability (leaf, whole plant and reproductive traits)
and tree capacities to naturally regenerate for 37 tree species commonly found in
Central American active pasturelands (Chapter 3). ................................................204
XXI
LIST OF ACRONYMS
Hmax Adult plant stature
WD Wood density
PHE Leaf phenology
SLA Specific Leaf Area
LA Leaf size
LDMC Leaf Dry matter content
LCC Leaf total carbon content
LNC Leaf Nitrogen concentration
LPC Leaf Phosphorus concentration
FTF Physical strength of leaves
Sha_fru Fruit shape
Sha_see Seed shape
Mas_fru Fruits mass
Mas_see Seed mass
Vol_fru Fruits volume
Vol_see Seed volume
Dis_mod Dispersal mode
SOL Soluble carbon
HEM Hemicellulloce
CEL Cellullose
LIG Lignin
BETA 5 Overall decomposition rates
BETA 4 Partial decomposition rates
bn Monthly decomposition rates
CA Correlation analyses
PCA Principal Component analyses
MRA Multiple Regression analyses
LoRe Logistic Regression analyses
r Correlation coefficient
r2 Regression coeficients
Dbh diameter breast height
PAI Periodic annual increments
RGR Relative growth rate
AIC Akaike information criterion
BIC Bayesian information criterion
DGC Díaz, Guzman and Cassanoves mean comparison test
PT Plant traits
AP Active pasturelands
CNR Capacity of natural regeneration

1
CHAPTER 1. GENERAL INTRODUCTION
1.1 Background statement
Pasture degradation is a major problem related to land use in Central America (Szott
et al. 2000). Frequently, a gradual decline in forage yield occurs some years after the
establishment of pastures usually associated with a decrease in soil fertility. Pasture
degradation begins mainly due to poor fertility management in addition to tree cover
elimination in previously forested sites, forcing farmers to undertake a costly renewal of
pastures, or driving them to abandon pastures and to open new forest areas (Toledo et al.
1982, Fearnside and Barbosa 1998). Non-sustainable livestock management practices
reduce the ability of anthropogenic pasturelands ecosystems to provide supporting
ecosystem services like the capacity to maintain soil structure and fertility through
decomposition of plant litter and animal wastes and also the regulating services of purifying
water, as well as the provisioning of food (Milchaunas & Lauenroth 1993, Tilman 1999,
Tilman et al. 2002). Extensive livestock production systems including practices like large
paddock areas, low grazing rotation, overgrazing, chemical weeding and no fertilization
strategies are widely distributed in Neotropical landscapes. Today, it is estimated that 50%
of the Central America pastures suffer from some kind of degradation (PD/CATIE-Noruega
2002).
Silvopastoral systems (SPS) have been proposed as sustainable production systems
to avoid tropical pasture degradation and increase system productivity. Nitrogen fixation by
some leguminous and non-leguminous species could maintain and even improve nitrogen
availability through decomposition of shoot litter and roots. Also organic matter input from
litter and root turnover from all tree species can play an important role in maintenance of
soil physical and chemical properties (Velasco et al. 1999). However, below-ground
competition between trees and understory plants for soil moisture and nutrients may reduce
the amount of soil nutrients and water available to the herbaceous layer. Competition for
light, water and nutrients may affect pasture productivity under and close to trees. In
contrast to simpler grass monocultures systems in seasonally dry climates where the
productivity strongly decreases during the dry season, the presence of trees in pasturelands

2
can enhance overall pasture productivity during the dry seasons providing nutrition for
livestock from tree leaves, fruits and pods in the dry season (Cannell 1996, Rhoades 1997,
Cajas-Giron and Sinclair 2001). However research has not so far been able to describe the
full set of ecological interactions developed between a diverse tree cover and grass
productivity.
Tree cover can reduce pasture degradation and speeds up its recovery through
nutrient supply in litter deposition (Young 1989). This hypothesis arises from differences in
grass productivity observed between below-crown and open grassland habitats. Such
differences has been attributed primarily to a) improved fertility and structure of soils
below tree crowns and b) improved water relations of shaded plants (Kellman 1979, Belsky
1992, Belsky 1994, Rhoades et al. 2000). Soils under trees have been observed to have
higher level of organic matter, N, Ca, C and K, higher microbial biomass, reduced bulk
density and increase water infiltration than open pastureland soils, so called “islands of
fertility” below tree crowns (Belsky 1994). In addition, reductions of water loss under tree
crowns due to reduction of light intensity reaching the soil layers and its effects on soil and
air temperature can sometimes improve below-grown plant relations (Rhoades et al. 1998,
Belsky et al. 1989, 1992).
Little is known about the mechanisms responsible for the observed spatial fertility
patterns around trees in pasturelands. Higher values of animal manure deposition (wild
fauna and cattle), wind deposition of plant material (litter and fruits), soil fauna density,
dead root biomass and soil nitrification rates are mechanisms identified as responsible for
such contrasting patterns below tree crowns and open pasturelands (Belsky 1994). Patterns
of decomposition of the high amount of organic matter deposited around trees however
have not been well studied. Litter is the major sink of nutrients and carbon within plants
and its decomposition is the mayor source of soil fertility replenishment in diverse soils
(Cadisch & Giller 1997). Decomposition patterns are fundamental for understanding C and
nutrient fluxes within ecosystems (Blanco et al 2004). Litter quality is determined by its
composition and physical characteristics; together with climate, soil nutrient availability,
soil biotic communities and other site specific factors it controls the decomposition
processes (Berg and McClaugherty 2003). Therefore, in addition to observing the
variability of temperature, water, nutrients and SOM concentration around trees, it is
necessary to evaluate how plant litter decomposition develops within active pastureland
3
environments to clarify the mechanisms involved in the creation and maintenance of
“fertility islands” and their potential benefits to pasture productivity.
There has been a major debate in the ecological literature about the relationship
between species diversity and ecosystem function, and therefore whether loss of species
diversity threatens productivity and sustainability (Grime 1998, Loreau et al. 2001). Lower
leaching losses of inorganic nitrogen (leading to higher soil fertility) and higher biomass
have been reported in North American pasture ecosystems with a greater diversity of
species (Tilman et al. 1996, Collins et al 2012). Tree species composition in addition could
affect nutrient cycling and productivity in active pasturelands. For example, in Central
America, under crowns of nitrogen-fixing Inga spp. in situ net nitrification rate exceeded
that in open-pasture more than six-fold and extractable NO3--N concentration was 3.6 times
higher than in open pasture (6.3 versus 1.7 mg N/g), while beneath non-nitrogen-fixing
Psidium spp., neither nitrification rates nor the extractable NO3--N pool were significantly
greater than in open pasture (Rhoades 1997). However until today, the effect of a wider
variety of tree species usually found in agricultural landscapes, on nutrient cycling and
productivity in anthropogenic Neotropical pasturelands remains unknown
Intrinsic litter characteristics significantly influence the decomposition rates (Berg
et al. 1999). Trees in active pasturelands have different functional characteristics, e.g. leaf
traits, and flowering and foliar phenology, which could make different contributions to
nutrient cycling, via litter quality, quantity and timing, or creating diverse microsites for the
decomposition process in pastures. Different traits affect the regeneration capacities of trees
in grazed or active pasturelands, e.g. those linked to seed dispersal mechanism and
germination including seed mass. In managed pastures tree wood density can be important
as, along with use value for wood products, fruit, forage or shade, it could affect farmer’s
decisions to maintain different tree species on these sites. Therefore, identifying both the
functional characteristics of tree species in relation to litter quality and nutrient release
during litter decomposition, and the regeneration and utility characteristics that determine
whether trees are maintained or not in pastures, is vital for understanding how the species
composition of tree cover changes and its potential impact on pasture productivity via litter
input and decomposition. However, tree species effects on litter input, decomposition, soil
fertility and pasture biomass have not previously been researched using either an isolated or
pastureland approach to understand their effects on pasturelands productivity. Whether

4
other plant functional traits are associated with those affecting leaf litter quality traits will
define current and predicted future overall functional diversity of tree covering agricultural
lands and therefore the direction, magnitude and continuity of its effects.
Tree cover diversity in Central American pastures will decrease at least 50% if
current management practices are maintained (Esquivel et al 2008). Trees in active
pasturelands result from both regeneration of pioneer species and survival of remaining
trees from the original forest vegetation. Remnant tree density and diversity could be high
in Central America pasturelands (Harvey et al. 2000). However, at least 50% of the tree
species in active pasturelands have limited potential for natural regeneration due to
limitations to seed dispersal, germination and establishment, or due to pasture management
(Esquivel et al 2008). Management practices which do not specifically consider the
protection of populations of tree species with limited natural regeneration in pastures are
widespread in Central America (Camargo et al. 1999, Barrios 1999, Matinez-Garza &
Howe 2003). The expected reduction in tree cover species diversity within these areas
could have effects on pastureland productivity and sustainability due to changes in nutrient
cycling resulting from loss of tree species with particular functional attributes. However,
we still have little knowledge on how tree species affects nutrient cycling in Neotropical
anthropogenic pasturelands. Development of silvopastoral systems must therefore take into
consideration the different functional characteristics of tree composition and it effects over
ecosystem processes like tree regeneration and nutrient cycling in order to propose
strategies to recover degraded pasturelands in Central America.
1.2 Aims and context of the research project
This PhD research project was developed with the upport of the project
“Alternatives for the Use of Degraded Pastures in Central America – Degraded
Pasturelands” – PD CATIE-NORWAY. The PhD is focused on tree species functional
characteristics and their relationship with ecosystem processes, including productivity and
nutrient cycling, in pasture ecosystems in fragmented landscapes of the pilot areas of the
project. This PhD focuses on producing high-quality scientific research, but also on
providing key scientific support to the technical and participatory development of
appropriate options for the use of local tree diversity to recover degraded pastures in areas

5
characterized by chronic rural poverty. The focus of this research was within the broad set
of research areas of interest defined by PD CATIE-NORWAY: 1) the characterization of
nutrient stocks in different pasture ecosystem components (vegetation, fauna, soil and
primary minerals) and the type and magnitude of flows between components; 2) estimation
of pasture ecosystem productivity and the factors that limit it and 3) the relationship
between the aforementioned ecosystem characteristics and processes and the plant
taxonomic and functional diversity of pasture ecosystems, including comparative studies of
alternatives to degradation such as grass/legume mixes, protein banks and both naturally
and artificially regenerated silvopastoral systems.
The aim of this PhD was to contribute to understanding the role of the tree cover
species composition in maintaining or improving soil fertility and pasture productivity in
Central America. This study focused on the variability in leaf and litter quality,
decomposition rates and nutrient cycling amongst the tree species present in managed
pastures. It assessed the role of different leaf traits (physical structure and chemical
composition) in determining rates of litter decomposition and nutrient release and how
these leaf traits were linked to other whole plant and regeneration-related traits. To reach
this general objective, the research encompasses observational, experimental and analytical
approaches. First, a wide range of functional traits of tree species, not only those commonly
related with litter quality, were used to identify tree species characteristics linked to their
function within continually anthropogenic-disturbed pasturelands. Second, the relationship
between these observed functional traits of the tree species and their population abundances
(linked natural regeneration capacity) in active pasturelands, was evaluated to understand
current and possible future changes of tree functional diversity in pasturelands, as well as
which plant variables best predict such changes. Third, the effects of the aforementioned
tree species composition of active pasturelands, was evaluated by quantifying the
differences between species in decomposability and in nutrient release rates of their leaf
litter (in an experiment with 37 tree species) and how this was correlated with their leaf
traits, traits related to natural regeneration and their population structure. The species tested
in this experiment included those with a wide range of functional traits.
Tree litter is an important resource in active pasturelands, and its study in the
context of the functional characteristics and natural regeneration of the species that provide
it may provide clues about the actual and future role of tree cover in nutrient cycling and its
6
potential to recover degraded pasturelands. Assessing these processes and dynamics will
hopefully allow the development of more sustainable pasture production systems under the
changing scenarios of climate and land use in the tropics. Specifically it will provide
powerful evidence with which to assess the functional impacts of the tree species diversity
of managed pasture lands.
1.3 Study site
The study was conducted in the Río Grande de Matagalpa watershed in Central
Nicaragua (12°31‟-13°20‟N; 84°45‟-86°15‟W). The area is located in the municipality of
Muy Muy, at sites within an altitudinal range of 280 to 380 m. The predominant land-use is
livestock farming with relatively homogeneous livestock management. Livestock
production is generally extensive, with an average-stocking rate of 1 livestock unit ha–1
and
pasture management consisting of rotational grazing, fence maintenance and weeding,
either manually by chopping down weeds or recently by the use of herbicides. During the
dry season, grazing frequency is irregular.
The natural vegetation of the region corresponds to a transitional tropical sub-humid
forest (Holdridge 2000) with semi-deciduous vegetation, and is referred to as seasonally
dry tropical forest (Bullock et al. 1995). The vegetation in the study is an assemblage of
native and naturalized species including grasses, herbs and woody plants. The term semi-
natural grassland is used herein to refer to a pastureland area covered by spontaneous
vegetation that grows naturally after forest clearing or on fallow land and which is
maintained by grazing management, including fencing and weed control. Semi-natural
grasslands consist mostly of grass species of the genus Paspalum. Exotic grasses such as
Brachiaria spp. and Cynodon spp., have been planted to increase pastures productivity.
Both naturalized and exotic pasturelands occur in association with scattered trees.
Tree composition in active pasturelands is a mix between species of dry and sub-humid
forest communities. Mimosaceae, Fabaceae, Caesalpiniaceae and Bignoniaceae are the
most species-rich families (comprising ca. 31% of all species), while Sterculiaceae and
Boraginaceae are the most abundant families (ca. 54% of all individuals). The highest
importance values (mean of relative density, dominance and frequency) were for pioneer
7
species, typical of disturbed areas, dispersed by cattle, wind and wild animals, and actively
promoted by farmers for their use as fruits, timber and/or forage (Esquivel et al. 2008).
Geologically, the area consists of tertiary volcanic tuff, a type of pyroclastic rock.
The tuff presents a clear stratification, including softer and harder layers. It is probable that
many of the landscape undulations are associated with differences in the hardness of the
rocks and their variable resistance to erosion. Furthermore, tectonic movements are likely
to have influenced the landscape, especially in the transition to the higher mountainous
landscape of the Muy Muy municipality. Tuff in the area seems to be relatively
impermeable, which explains the limited infiltration of rainwater observed during the early
rainy season, especially in flat areas. Even on slopes, there are extensive areas where
drainage is limited during part of the rainy season. In flat and lownland ondulated areas, it
is common to find soils with vertic properties: soils present wide cracks during the dry
season and have prismatic structures, while on steeper slopes soils are more variable set or
vertic and Inceptisoils can be founded (Andreas Nieuwenhuyse, pers. comm. 2007).
The topography of the study area is undulating, with slopes of 5-40%, and the
dominant soil type in the study sites is a greyish to black coloured vertisol with high
organic matter content in the upper horizons (5-8%), clayey subsoil, with a pH between 5.9
and 6.8 in the topsoil, and relatively poor in phosphorous (2-10 ppm). In most cases, the
soil has limited drainage during the rainy season. Where the natural slope favours better
drainage, browner colours are observed.
1.4 General Objectives
The general objective of this thesis is to evaluate the functional diversity of the tree
species present in active pasturelands in central Nicaragua, to understand its relationships
with the abundance of natural regeneration and how these changes could affect
decomposition rates and nutrient release (specific objectives 1, 2 and 3).
Afurther general objective of the research project was to understand how the
functional diversity and variability of tree cover affects nutrient cycling, grass productivity
and grass and soil quality in active pasturelands in the central region of Nicaragua.However
this further work is not reported here in the main body of this PhD.

8
The specific objectives of this thesis research reported here are decribed by chapter
as follows:
1. Evaluate the functional diversity of the tree community in active pasturelands using
whole plant, leaf and regenerative traits (Chapter 2).
2. Evaluate how the functional diversity of tree cover was related with the capacity of tree
species to maintain their populations in active pasturelands through natural regeneration
(Chapter 3).
3. Evaluate if the differences in decomposition rates and nutrient releases of tree species
were related to their functional traits and their natural regeneration capacity (Chapter 4).
1.5 General Hypothesis
H1: The tree species present in active pasturelands encompasses diverse and linked
whole-plant, leaf and reproductive traits, which together comprise a definable functional
diversity of the tree community (Chapter 2).
H2: Tree species’ capacity to naturally regenerate in active pasturelands is related to
whole plant, leaf and reproductive functional traits, as well as to adult tree abundance
(Chapter 3).
H3: Tree species present in managed pasture lands have different decomposition
rates of leaf litter biomass and nutrients releases rates related with leaf, whole-plant traits
and with species capacity to naturally regenerate in active pasturelands (Chapter 4).
The following diagram (Figure 1.1) explain the relationships among components of
a Sylvopastoral System where grass and woody species are combined for livestock
production within the framework of the three research chapters (grey lined squares) of this
research. The scheme shows how the tree component of SPS adds new interactions
(segmented arrows) to those usually identified by conventional livestock management
systems (dark black arrows) among the grass component, and the cattle one affecting the
soil resource extraction-replenishment loop which negatively affects forest and tree cover
in agricultural lands. The thesis research chapters provide insights to understood some links

9
of this system, more specifically: chapter 1) Understanding the wide variability of leaves,
wood and fruits/seeds of the tree species in pastures; chapter 2) predicting the different
capacities of tree species to naturally regenerate in active pasturelands using this variability
together with adult tree abundances resulting from previous management practices; and
Chapter 3) Understanding how this capacity can affect other ecological processes like
decomposition rates and nutrient releases from tree litter , provides insights on possible
functional changes in future tree cover. This is especially relevant if management practices
imply the elimination of those tree species with limited natural regeneration and associated
plant traits, thus affecting the provision of ecosystem services to livestock managements
and to agricultural landscapes.
Figure 1.1. Diagram of the relationships among components of a Sylvopastoral System where
grass and woody species are combined for livestock production within the
framework of the three research chapters (grey lined squares)

10
CHAPTER 2. VEGETATIVE AND DISPERSAL
FUNCTIONAL NICHES OF TREE SPECIES IN
SEASONAL TROPICAL PASTURES
2.1 ABSTRACT
The identification of plant strategies outside pristine forest is relevant to improve
our understanding of the functional variability of plant responses following deforestation
and their effects on ecosystem processes after land use change to agricultural landscapes.
This research described the functional strategies (FS) of 65 tree species commonly
found in Central American active pasturelands (AP) under conventional management
practices (i.e. reducing tree cover), as particular combination of 17 plant traits strongly
related to four main trait dimensions i.e. Leaf Economy Spectrum (LES), stem density,
canopy height and reproductive variability spectrums. Measured leaf traits were leaf area,
specific leaf area, leaf dry matter content, total carbon, phosphorus and nitrogen leaf
content, foliar tensile strength; whole plant traits like wood density, maximum tree high,
leaf phenology; and reproductive traits like fruit and seed mass, volume, shape and
dispersal mode.
We confirm that LES (conservative vs acquisitive) is strongly correlated with a
Stem and Phenology Spectrum (SPS), defining that taller deciduous tree species with softer
woods have more fragile and acquisitive leaves than shorter evergreen trees with
conservative leaves. A novel Reproductive Investment Spectrum (RIS) splitting apart tree
species with bigger and heavier fruits and seeds from those with small and lighter ones
(expensive vs cheap), was correlated to both the LES and SPS, showing i) tree species with
acquisitive leaves and cheap constructed dispersules (Leaf and reproductive investment
spectrum) and ii) taller deciduous trees with cheap dispersules (Stem and reproductive
investment spectrum).
Five main ordination axes explain between 10 to 20% of tree species variability for
all plant traits interactions, showing the complexity of holistic plant trait associations,
without tendency to form tightly-defined “functional groups”. Dispersal modes resulted
good examples of tree strategies that split species’ traits variability with particular
combinations of whole plant, leaf and reproductive traits.

11
Tree species in APs have wide variability of leaf, reproductive and whole plant
traits with leaf variability strongly associated with the other plant traits dimensions. The
multidimensional FS observed in APs suggest that loss of any particular tree characteristic
could affect different ecosystem services offered by actual tree cover remaining in tropical
agricultural lands.
Key words: functional strategies, tree cover, plant traits, population dynamics,
agricultural lands.
2.2 INTRODUCTION
Plant trait measurements have gained increasing attention worldwide during the last
decade as an approach to summarize and generalize about plant species’ ecology and to
understand how ecosystems and their services will change in response to natural and
anthropogenic disturbances. Plant functional traits are defined as morphological plant
characteristics that are relatively easy and quick to quantify (soft traits) and strongly related
to plant functions (hard traits) responsible for plant responses or effects at the ecosystem or
biomes scale (Cornelissen 2003). Clearly expressed by Wright et al. (2007) the functional
ecology approach analyzes the interspecific correlations (cross-species correlations) among
plant traits which are expected to reflect 1) physical, physiological or developmental
‘constraints’ that limit the independent variation and evolution of the focal traits; and 2) the
‘adaptive’ outcome of natural selection favoring particular combinations of traits over
others forming dimensions of ecological ‘strategies’). Cross-species correlations are
especially relevant for providing insights into life-history trade-offs that operate within and
between environments, and thus also into phenomena such as niche differentiation and
species coexistence (Westoby and Wright 2004).
A huge amount of morphological and physiological data coming from around the
world has made it possible to increase our knowledge about at least the first three of four
main axes describing ecological strategies of tree species: i) the leaf economic spectrum
(LES) (Wright et al. 2004), ii) the wood economic spectrum (Chave et al. 2009, Baraloto et
al. 2010), iii) seed and fruit size variability (Moles and Westoby 2006) and iv) adult stature
as an independent axis of variation (Poorter et al. 2006). The LES shows a continuum of

12
species varying among cheaply constructed leaf area but short-duration return on
investment, to species with high leaf mass per area (LMA) or low specific leaf area (SLA)
and long leaf lifespan, with higher nitrogen and phosphorus contents and faster gas
exchange rates (Wright et al. 2004). Species variability in the ‘wood economics spectrum’
has been related to plant hydraulics: higher wood density appears to be correlated with
smaller leaf and twig sizes, lower conductivity per unit cross-section of sapwood, smaller
leaf area per unit of sapwood cross section, and lower vulnerability to embolism (Westoby
and Wright 2004). In the seed and fruit size spectrum, species with larger seeds have lower
seed number output per area of canopy but higher survival during seedling stages (Westoby
et al. 2002). Finally, the maximum-height spectrum describes species trade-offs among
mature height, growth rates and shade tolerance: taller trees are proposed to grow faster,
have lower mortality rates and have low tolerance of shade (Poorter et al. 2003), however
subsequent studies have found more complex relationships amongst these attributes (e.g.
Easdale et al. 2007). These four strategy axes summarize a high proportion of ecological
variability among forest tree species
A small proportion of studies have addressed how the four observed main axes of
species variability interact amongst each other (Westoby 1998, Wright and Westoby 2004,
Wright et al. 2007, Baraloto et al. 2010), in contrast to the huge proportion of traits-related
studies exploring individual axes of variability as cited previously. Unfortunately, the
structure of the interactions between the strategic dimensions of species variability have
been explored using only one representative trait or “focal trait” (Westoby 1998) for each
strategic component, usually wood density (WD), specific leaf area (SLA) and seed size
(mass or volume) together with maximum tree height (Hmax) as an axis in itself. Initially,
studies including only some “representative” traits proposed a leaf-height-seed (LHS) plant
ecology strategy using SLA, Hmax and seed mass as main axes of species variability where
the strategy of a species would be described by its position in the volume formed by the
three axes (Westoby 1998). Research on interactions among ecological dimensions based
on focal traits of tropical tree species suggested that the dimensions represented by SLA,
seed/fruit size and leaf size were essentially independent of each other and thus conveyed
largely independent information about plant strategies (Wright et al. 2007). Although the
advantages of defining a plant ecology strategy through a single readily-measured variable
13
are obvious, single plant traits are very unlikely to capture as much species variation as
multi-trait axes (Westoby 1998).
The functional niche as described by Rosenfeld (2002) is a useful conceptual tool
for condensing the multivariate assemblage of species’ responses to environmental factors
to the space occupied by a species in an n-dimensional functional space. Clark (1954)
distinguished two separate meanings for the term niche, the "functional niche" and the
"place niche." Clark noted that different species of animals and plants fulfill different
functions in the ecological complex, and that the same functional niche may be filled by
quite different species in different geographical regions. Other concepts of niche like the
Eltonian niche (sometimes called functional or trophic-niche) only focus on the impact of
species in the environment rather than on its response to particular resources (Elton 1927).
Equally, Hutchinson’s (1957) concept of the ecological niche considers all biotic and
abiotic resources interacting with species and was defined as a hyper-volume in the
multidimensional space of ecological variables, within which a species can maintain a
viable population. The functional conception of the ecological niche has recently received
new theoretical and methodological attention following the growing interest in functional
traits in community and applied ecology (McGill et al. 2006; Ackerly and Cornwell 2007).
Is the functional niche extended in an n-dimensional functional space and measured as the
species position along axes embodying functional attributes, rather than those concepts
including resource variables, the best approach to visualize the multiple variation of species
in response to environmental variation (Rosenfeld 2002; Mouillot, Mason and Wilson
2007)?
The evaluation of species distribution and functioning in disturbed areas is also
required to test if the plant functional traits approach helps us to predict actual and future
plant abundances and distributions in a changing environment. Recent studies of tree
natural history trade-offs have focused on the species responses to natural disturbances
inside the forest such as to tree falls. Most of the work is implicitly or explicitly about
strategies linked to horizontal and vertical light gradients, though some of the trait variation
is definitely linked to gradients in factors such as soil and elevation. Land use changes
imply massive and abrupt habitat transformations outside pristine forest borders resulting in
extended areas of landscapes undergoing strong forest fragmentation. To our knowledge no
previous studies have focused on the evaluation of how plant traits are actually expressed

14
and interact in tree communities outside the forest, where tree taxonomic and functional
diversity is affected by multiple global change drivers including land use change as well as
atmospheric CO2 concentration, nitrogen deposition, climate, and biotic exchange (Sala and
Austin al. 2000). It is at this frontier of functional ecology that we should ask: does our
current knowledge about forest tree functional niches predict the general characteristics of
tree species and functional diversity that is able to survive outside the forest?
Cattle production has already led to widespread deforestation of tropical dry and
moits forests in the Central American region and less than 1.7% of intact forest remains
(Calvo-Alvarado et al., 2009). In Central American pastures, the systems studied in the
present paper, trees outside forest have an important role in ecosystem processes at the
landscape scale, such as increasing habitat diversity, food availability for wild fauna, pollen
interchange and dispersal patterns (Harvey et al. 2011). Unfortunately, intensified
management practices are reducing this tree cover diversity in tropical landscapes (Esquivel
et al. 2008, Fischer et al. 2009). Conventional intensive management practices widespread
in the region like the sowing of improved grass monocultures, weed control (using agro-
chemicals, fire or manual cutting) and overgrazing do not consider the protection of tree-
species’ populations with limited natural regeneration in active pastures (Simon et al. 1997;
Camargo et al. 1999; Barrios 1999; Martinez-Garza and Howe 2005). Consequently,
natural regeneration of at least 50% of the tree species in active pasturelands of seasonal
lowlands is constrained due to limitation in dispersal, germination and establishment, or
due to pasture management (Esquivel et al. 2008). If current intensive management
practices continues these species can be expected to disappear from pastures.
The implications of tree diversity reduction outside forest for ecosystem processes
such as nutrient cycling at local (pasture) or landscape scales are unknown. Species’ life
histories are linked to community functional properties and therefore to ecosystem
processes and services (Díaz et al. 2011). Land-use management is often focused on few
species and local processes, but in dynamic, agricultural landscapes, only a diversity of
“insurance species” may guarantee resilience (the capacity to reorganize after disturbance)
(Tscharntke et al. 2005). Land-use intensification using few species may disrupt processes
such as crop pollination (Kremen et al. 2004), grassland productivity (Loreau and Hector
2001) and decomposition (Altieri 1999; Schläpfer et al. 1999; Tilman et al. 2002),
15
suggesting how important ecosystem services can be affected via the loss of biodiversity
outside forest.
The measurement of functional traits of tree species and the functional
characteristics of tree assemblages, combined with determinations of tree species’
abundance and biomass, are necessary for understanding tree species’ responses to habitat
fragmentation and the effects of tree biodiversity loss on ecosystem processes on active
pasturelands. Basic questions about the functional characteristics of the actual taxonomical
diversity of tree cover in active pasturelands - one of the most abundant land cover types in
the neotropics - have not yet been addressed. In other words, we don’t know, beyond
taxonomical diversity, which are the functional attributes of tree cover that persist after land
use change from forest to pasturelands. More importantly, we do not know how these tree
functional characteristics directly affect key ecosystem processes supporting natural and
anthropogenic ecosystem productivity in active pasturelands.
The differences in tree dispersal characteristics, for example, appear to be a major
mechanism through which tree species respond to human intervention and therefore,
partially, lead to biodiversity loss and consequent effects on ecosystem services, given that
effectively-dispersed species become more abundant in disturbed landscapes (Tscharntke et
al. 2005). In these environments, the species’ capacity to naturally regenerate in
pasturelands could be directly related to their dispersion traits (Janzen and Martin 1982,
Powers et al. 2009). If dispersal ability is correlated with leaf and stem traits, then dispersal
traits might be linked to ecosystem processes like nutrient cycling and productivity in
different vegetation stands. In this respect, Wright et al. (2010) conclude that a successful
traits-based ecology of tropical forests requires consideration of a wider range of traits than
reported by existing studies. Along the same line, Baraloto et al. (2010) argue for the
integrated analysis of traits at the whole-plant scale. Only using a larger set of measured
traits can allow us to analyze whether strategies linked to gradients inside forests can
predict tree community dynamics outside forests. In general terms, few studies of tropical
forests, especially in disturbed systems like that studied here, have achieved these goals.
Traits-based understanding of species’ responses to intensive human disturbance is
also vitally important for understanding the impact of current and future changes in
diversity on ecosystem services in agro-ecosystems, the world´s largest category of land
cover (Wassenaar et al. 2007). The interactions of site-specific conditions (e.g. soil,
16
precipitation, temperature and solar radiation) with plant traits and community structure
(species’ abundances) determine ecosystems properties. Modeling of these linkages is
relevant to improving understanding of the fundamental basis of both natural and
agricultural productivity such as through nutrient cycling (Perez-Harguindeguy et al.,
2000). Therefore, the understanding of how such interactions take place in human-disturbed
environments is as important as in the case of how they help predict the resilience of natural
ecosystems to environmental changes.
In order to contribute to this knowledge, for 75 tree species found in actively-
managed anthropogenic pastures at the study site in Muy muy, Nicaragua, we compiled
data of 16 traits classified between each of the four trait categories defined above (whole
plant, stem, leaf and dispersal). The two measured whole plant traits were maximum tree
height (H-max) and leaf phenology (PHE) and the single stem trait was wood density
(WD). The seven measured leaf traits were specific leaf area (SLA), leaf area (LA), leaf dry
matter content (LDMC), total leaf carbon (LCC), nitrogen (LNC) and phosphorus (LPC)
contents and leaf tensile strength (FTF). The six measured dispersal traits were seed and
fruit masses (Mass_see/fru), volume (Vol_fru/mass) and shape (Sha_fru/mass); in addition
information was collected about the categorical character dispersal mode. To our
knowledge no published study of tropical tree species has evaluated such a high number of
key traits across these four trait categories. Dispersal traits are of particular interest to our
study given their importance for tree species persistence in managed pastures (Esquivel et
al. 2008) and their under-representation in studies that quantify its relationships with other
key plant traits. The larger number of studied traits than previous studies allows us to
improve the characterization of tree species’ functional characteristics linked to their
persistence in expanding agro-ecosystems outside the forest environment.
Tree communities outside forest interact with the effects of past and present
anthropogenic management in addition to the interaction amongst the species, including
competition for resources, which is important for their coexistence. Species traits are
important in mediating the outcome of these interactions. The low vertical and horizontal
structural diversity of silvopasture vegetation, in addition to the dominance of grass,
increases light levels down to seedling heights. There is significant grass-tree competition
for soil water which, combined with the high rates of evapo-transpiration due to the lack of
canopy cover, can severely limit tree seedling establishment thus shaping tree community
17
composition in silvopastures (Esquivel et al. 2008). Herbivore pressure, mainly due to
cattle browsing, in addition to the physical damage generated by cattle (due to trampling,
resting and scratching) exert additional pressures shaping tree communities in pastures.
These external factors may dominate tree community assembly in pasture environments
and overwhelm some of the complex interactions amongst tree species within long-
established forest communities. However, the dominance of high light, low moisture and
high herbivore pressure may reinforce some interactions and create some new ones.
We expect also to find strong correlations between whole plant, stem, leaf and
dispersal traits beyond the commonly used focal traits (Hmax, WD, SLA and seed mass).
Some authors suggest that the leaf economics spectrum (LES) is decoupled from the wood
economics spectrum (WES) (Baraloto et al. 2010). Others suggest in contrast that WD is
negatively correlated with SLA reflecting the continuum from fast-growing pioneer species
with low WD to slow- growing shade-tolerant species with high WD (Wright et al. 2006).
In addition, H max and LA has frequently been reported to be orthogonal to LES and even
to WES (Baraloto et al. 2010). The majority of previous studies predict that we should find
WD to be negatively correlated with SLA, and H max and LA to be orthogonal to LES- and
WES-related traits. Therefore, the axes of these trait categories in general are likely to be
orthogonal, but we expect correlations within them like the LES and WES.
We expect to find strong correlations between whole-plant and leaf traits reflecting
integrated trait combinations that enable trees to overcome seasonal drought stress within
the studied silvopasture habitats with a low vertical structure in dry-/subhumid forest areas.
We thus expect that leaf phenology (measured as the number of months per year a tree has
a canopy cover under 50%) will be strongly correlated with Hmax and also with WD.
Deciduous tree species are predicted to have low-investment leaves with traits associated
with high rates of resource aquisition, while evergreen species tend to have more expensive
and resource-conservative leaves with lower water loss rates during dry season. Although
taller tree species probably have more water stress (Barnard and Ryan 2003) no previous
correlations has found in relation with leaf traits related with tolerance to drought.
As predicted by the LES we expect leaf N and P contents to be positively correlated
with SLA, and all to be positively correlated with PHE (treated as a quantitative trait in this
study): short-lived leaves should have traits linked to high resource-acquisition in drought-
avoiders deciduous species, in contrast to long-lived leaves with resource-conservation
18
traits in drought-tolerant evergreen species. LDMC would thus be expected to be positively
correlated with FTF but negatively with PHE, LNC, LPC and SLA. LCC is expected to be
positively correlated with LDMC and FTF but negatively correlated with LPC, SLA, LPC,
LNC and PHE. LPC has been found also to decrease significantly with increasing rain fall
(Marharjan et al. 2011) expecting to be also positively correlate to hydraulic related traits
like PHE. SLA has been found to be positively correlated with LNC but not strongly with
other leaf traits (Kazakou et al. 2006). Easdale et al. (2007a, 2009) also found that LA is
positively correlated with SLA, N and P but negatively correlated with LDMC. LA has
been found to be correlated with H max, WD, LPC, LNC, SLA, LDMC and LCC but
empirical results frequently contrast with theoretical expectations (Niinemets 2006,
Niinemets et al 2007), and therefore we had no particular expectations with respect to LA.
Many of the published trends for dispersal traits are related to latitudinal gradients
(Moles et al. 2007) and there is much less understanding of relationships of seed and fruit
traits with other traits for tree species within the tropics. In previous studies, “diaspore” (the
unit that is dispersed, it can range from a whole fruit, to a group of seeds or individual seed)
have been mostly represented by seed mass or volume (Moles et al. 2005), while fruit mass
or volume or diaspore shapes have received less attention, although they are relevant for
dispersal and post dispersal stages. Diaspores mass, volume and shape are linked to
dispersal mode, and affect dispersal distances, seed spatial distributions, incorporation into
soil seed banks, vulnerability to predation, germination mode/rate and seedling
establishment success. Small seeds tend to disperse further away from the mother plant
(Muller-Landau 2008), while stored resources in large seeds tend to help young seedling to
survive and establish in the face of environmental hazards (deep shade, drought, herbivory).
Smaller seeds can be produced in larger numbers with the same invested resources. Smaller
seeds with low shape values (relatively spherical) tend to be buried deeper in the soil, and
live longer in the seed bank with a lower risk of predation (Cornelissen et al. 2003). The
dispersal mode of “dispersules” (equivalent to disaspores or “propagules”, i.e. the unit of
seed, fruit or spore that is dispersed) has consequences for the distances it can cover, the
routes it can travel, the places it is dispersed to and also the pre-germination processes that
a seed is subject to before reaching the soil surface (Cornelissen et al. 2003, Muller-Landau
2008).
19
In agreement with previous studies about dispersal traits, we expect that seed mass
will be correlated with dispersal syndrome (Muller-Landau et al. 2008, Thompson et al.
2011). Vertebrate dispersal agents (responsible for mamalochory and zoochory) have been
associated with higher seed masses whereas abiotic agents (e.g. responsible for
anemochory) will favor lighter seeds. Positive relationships between fruit and seed volume
are expected overall according to mechanical constraints (Wright et al. 2007), but previous
studies have not documented any further relationships between fruit masses or shapes. We
expect that tree species develop coordinated investments of resources to dispersal
structures, and that therefore bigger and heavier fruits carry the biggest and heaviest seeds
not only due to mechanical constraints but also to functional constraints and tradeoffs.
Tree communities outside forest are composed of tree species varying in their
regeneration capacity (Esquivel et al. 2008). Some trees in silvopasture are forest remnants,
established in these areas before forest cutting and with limited or no capacity to establish
new individuals outside forest cover. These species can be considered old-growth forests
species and may tend to be characterized byparticular adult traits, i.e. tall species, with high
wood density, zoochory and slow growth rates. In contrast, those trees colonizing pasture
environments could be considered pioneer species, also with particular adult characteristics,
i.e. wind, bird or bat dispersed, with fast growth, low WD and low survival rates. Dispersal
has been identified as one of the strongest limitations to tree colonization of open areas
(Holl 1999). Therefore we expect that dispersal mode will probably affect the relationships
of dispersal with whole plant and with leaf traits.
We expect to find that the strongest relationships of dispersal traits with whole-plant
and leaf traits will occur within dispersal mode, due to trees allocating resources to pre-,
and post-dispersal stages reflected by leaf and whole plants traits. Although we expect a
LHS structure of trait associations within this tree community, a stronger relationship with
the L and H axes could be observed for dispersal mode, a trait largely neglected in previous
studies. Bigger investments in seeds and fruits probably require a dispersal mode that
increases the probability of dipsersules reaching safe sites, for example through
endozoochory (Muller-Landau 2008). In contrast, a reduced investment in tree dispersules
(mainly with biotic dispersers), higher seed mortality rates with a less directional dispersion
mode (like wind) and probably occurring in species with short-lived leaves and greater

20
maximum heights is expected. Taller tree species could probably have also bigger seeds
(volume) but not necessarily heaviest seeds (mass).
2.3 METHODS
Study site
The study site was located in the central region of Nicaragua, in the Rio Grande
watershed, Department of Matagalpa, Municipality of Muy Muy (12°31’ - 13° 20’ N, 84°
45’ - 86° 15’ W). Annual temperature is 24.5 ºC and means annual precipitation is 1576
mm. A warm rainy season begins in May and ends in October, while a dry cool season
takes place between December and April. Heavy droughts are observed in April, but rains
quickly create flooding on lowlands between July and August (pers. obs.), while May and
November are transitional months with highly variable conditions between years. The Muy
Muy landscape consists of plains and undulating areas between 100 and 450 m asl and soils
consist mainly of Vertisols, Inceptisols and Alfisols (Nieuwenhuyse, unpublished report).
The study sites were located in lowland areas, characterized by hilly, undulating landscape
with emerging small hills. Vertisols or Inceptisols with vertic properties are the commonest
soils; they are developed on tuff which itself is rather impermeable. On steeper slopes thin
Inceptisols can be found. Water drainage is restricted in low-lying areas during the rainy
season, while higher positions in the landscape are well drained. Soil texture is clay in low-
lying areas and loamy clay on the hill slopes. Soil pH is 6.5-7.5; Soil Organic Matter
content in the top 20 cm is about 5-10%, with medium to high Ca, Mg and K contents and
low P contents (Nieuwenhuyse, unpublished report).
The natural vegetation in the study area is semi-deciduous tropical dry forest
(transition to sub-humid) (Henríquez et al 1995, Meyrat 2000, Holdridge 1984). The
dominant land use is cattle production, with some basic grains and coffee cultivation in the
highlands. Approximately 53% of the land area is covered by self–sown pasture grasses
such as Paspalum spp., 22 % is pasture of planted improved exotic grasses such as
Brachiaria spp. and Cynodon spp., 10% is early secondary successional vegetation
(‘tacotales’) and only 5% is forest. A high tree cover resulting from natural regeneration is
found on the actively-managed pasturelands. In 0.5 ha of active pasturelands an average of
5446 seedlings belonging to 56 species, 177 saplings (22 species) and 20 adults (5 species)

21
were found by Esquivel et al. (2008). However, only 37 % of a total 85 tree species in the
study area were found to be regenerating actively under the current management
conditions. Regeneration of the remaining 48 species appeared to be limited by seed
dispersal, germination, seedling establishment or growth, and was unlikely to maintain their
populations (Esquivel et al. 2008). Tree composition in active pasturelands is a mix
between species of dry and sub-humid forest communities. Mimosaceae, Fabaceae,
Caesalpiniaceae and Bignoniaceae are the most species-rich families (comprising ca. 31%
of all species), while Sterculiaceae and Boraginaceae are the most abundant families (ca.
54% of all individuals). The highest importance values (mean of relative density,
dominance and frequency) were for pioneer species, typical of disturbed areas, dispersed by
cattle, wind and wild animals, and actively promoted by farmers for their use as fruits,
timber and/or forage (Esquivel et al. 2008).
Trait measurements
Plant traits were measured on adult trees located in open environments with
canopies completely exposed to sunlight. A minimum distance of 50 m was maintained
between sampled con-specifics. The plant trait measurements followed Cornelissen et al.
(2003). For leaf traits relatively young but fully expanded and hardened leaves without
obvious symptoms of pathogen or herbivore attack and without substantial cover of
epiphylls were sampled. As far as possible, leaves were sampled at least 2-3 h after sunrise
and 3-4 h before sunset. Mature fruits were collected from trees or from soil when fresh
fruits and seed recently released and were found. Leaf, fruit and seed samples were stored
in a cool box or fridge until processing in the laboratory. Dry (or only slightly moist)
samples were taken to avoid rot damage, and rehydratation was used for 6-12 h in a dark
room when necessary before measurements. However, where possible, measurements were
made within 48 h of sample collection. In general, 3 to 5 leaves or fruits were collected
from each of 3 to 10 sampled trees per species (Table 2.1).

22
Table 2.1. Whole plant, leaf and dispersal traits units and sample sizes measured for tree
species in neo-tropical and active pasturelands in Central America
Traits
groups
Traits
Abr.
Plant Traits
selected
Measurement
unit
Type of
variable Sample size
Whole
plant
H max Adult plant stature m continuous 3 – 5 trees
WD Wood density g cm3-1
continuous literature
PHE Leaf phenology month continuous 3 – 10 trees
Leaf
traits
SLA Specific Leaf Area mm2
mg-1
continuous 5 – 10 leaves (3 – 5 trees)
LA Leaf size mm2 continuous 5 – 10 leaves (3 – 5 trees)
LDMC Leaf Dry matter content mg g-1
continuous 5 – 10 leaves (3 – 5 trees)
LCC Leaf total carbon content % continuous 5 – 10 leaves (3 – 5 trees)
LNC Leaf Nitrogen
concentration % continuous 5 – 10 leaves (3 – 5 trees)
LPC Leaf Phosphorus
concentration % continuous 5 – 10 leaves (3 – 5 trees)
FTF Physical strength of leaves N (N mm-1
) continuous 5 – 10 leaves (3 – 5 trees)
Dispersal
traits
Sha_fru Fruit shape unitless continuous 3 - 5 fruits (3 – 5 trees)
Sha_see Seed shape unitless continuous 3 – 5 seeds (3 - 5 fruits,
3 – 5 trees)
Mas_fru Fruits mass g continuous 3 - 5 fruits (3 – 5 trees)
Mas_see Seed mass g continuous 3 – 5 seeds (3 - 5 fruits,
3 – 5 trees)
Vol_fru Fruits volume cm3 continuous 3 - 5 fruits (3 – 5 trees)
Vol_see Seed volume cm3 continuous
3 – 5 seeds (3 - 5 fruits,
3 – 5 trees)
Dis_mod Dispersal mode unitless categorical -
For whole-plant traits, the maximum plant height (H max, in m) was measured
using clinometers on flat sites, vertical measurements or visual estimations in more sloping
sites. The biggest trees were selected within the 46 active pasture areas in the study site
sampled for tree community composition data in a previous study (Esquivel et al. 2008).
Plant phenology (PHE) was measured using visual estimation of the percentage of tree
canopy covered by leaves every two weeks over a whole year for adult reproductive trees,
taking as a 100% reference the tree canopy density at the end of the previous rainy season.
PHE was measured as the number of months the canopy density was < 50%.

23
For leaf traits, the specific leaf area (SLA) was measured on mature and fully
hydrated leaves scanned using Leaf Area Measurements software (LAM V 1.3, University
of Sheffield, A.P. Askew, 2003). After area measurement each leaf sample was oven dried
at 60 ºC for 72 h, and then weighed. An average of 20 leaves per species were measured,
sampling 2-4 leaves per individual. Here we measured just the leaf lamina without petioles
or rachis. When collected, the samples (twigs with leaves attached) were wrapped in moist
paper and put into sealed plastic bags, so they remain water-saturated. These samples were
stored in a cool box or fridge until processing in the laboratory. When necessary,
rehydratation was done before measurements for 6-12 h in a dark room, but measurements
were mostly done within 48 h of sample collection (Cornelissen et al. 2003). Leaf dry
matter content (LMDC) was measured following oven drying leaf samples (at 60 ºC) for 72
h. The same leaves used for SLA were used for LMDC. A pooled sample of oven-dried
leaves was used to determine leaf carbon content (LCC), leaf nitrogen content (LNC) and
leaf phosphorus content (LPC) for each species (Cornelissen et al. 2003) in the CATIE Soil
Labs. Total C and N were measured by combustion analysis with an auto-analyzer.
Phosphorus was estimated by humid digestion with a mix of nitro-perclorated acids 5:1 and
colorimetry (Henríquez et al. 1995). Leaf Tensile Strength or physical strength of leaves
(FTF) was measured using a “tearing apparatus” (DIVERSUS project). A leaf fragment
from the central section of the leaf (but away from the central vein) following the
longitudinal axis (direction of the main vein), or the whole leaf was used. The width of the
leaf or the leaf fragment sample (1-10 mm) was measured. The total force used (1 kg = 10
N) was divided by the width of the leaf fragment to obtain the leaf tensile strength.
Mass, volume and shape of both fruits and seeds were measured to obtain complete
description about the dispersules (dispersal structure or propagule) as it reaches the soil
surface (Cornelissen 2003). At least 3 seeds obtained from 1 to 3 fruits were sampled from
1 to 5 different tree individuals per species. Complete fruits were oven dried for at least 72
h or until they reached a stable weight to obtain fruit and seed masses (Mas_fru, Mas_see).
Dispersule shapes (Sha_fru, Shas_see) describe quantitatively the shape or form of the
mature and live fruit or seeds. Shape was defined as the variance of the three main
dimensions (length, width and thickness (breadth)) of the seed or fruits, after each of these
values have been divided by the largest of the values. These shape values lie between 0 and
1 and are unitless. Shape was measured from different seeds and fruits sampled for seed

24
mass. Volume (Vol_fru, Vol_see) was described as the tri-dimensional or cubic space
occupied by the fruits and seeds. Fruit and seed volumes were calculated by spherical or
ellipsoid geometrical formulas according to their form described by length, width and
thickness (breadth). Fleshy fruits were stored in plastic bags and kept in a cool box on
fridge until measurements. Naturally dry fruits were air dried prior to storing.
Tree dispersal mode describes the routes traveled by the dispersule units or the
vector assisting or moving the dispersule before reaching the soil surface (Cornelissen
2003). The categories defined by Cornelissen (2003) were used and adjusted when
necessary for the local community (Table 2.2). We were aware that several dispersal
modes can assist a dispersule’s movements (dispersion) away from a parental tree to reach
the ultimate germination place (Fischer et al. 1996). We only use here the dispersal vector
involved within the first stage of dispersule release from parental tree within the whole
possible range of dispersion movements (main vector) to categorize tree species dispersal
mode. Four dispersal modes were identified: Autochory, Anemochory, Zoochory and
Mammalochory.
Table 2.2. Dispersule characteristics used to categorize the dispersal mode traits adapted from
Cornelissen et al. (2003)
Dispersal modes Vectors Dispersal mechanisms / Dispersule characteristics
Autochory
(including
Ballistochory)
Unassisted
dispersal, bristle
contraction or
seed launching
The seed or fruit has no obvious aids for longer distance transport, falling
passively from the plant or dispersule with Hygroscopic bristles on the
dispersule that promote movement with varying humidity. Restrained seeds
are launched away from the plant by “explosion” as soon as the seed capsule
opens
Anemochory Wind dispersal Minute dust-like seeds
Seed with pappus or other hair, balloons or comas
Flattened fruits or seeds with large wings
Tumbleweeds , where the whole plant or in-frutescence with ripe seeds is
rolled over the ground by wind
Endo-zoochory
(Zoochory and
Mammalochory)
Internal animal
transport
Fleshy often brightly coloured berries, arillate seeds, drupes and big fruits
that are evidently eaten by vertebrates (birds, mammals, bats) and pass
through the gut before seeds enter the soil elsewhere. Those mainly
consumed by wild animals where categorized as Zoochory, instead those
eaten exclusively by big mammals like cattle were categorized as
Mammalochory.

25
Wood density (WD) was the only plant trait exclusively obtained by literature
review. All the WD data come from standard published papers and from available metadata
reviews like those of Chave et al. (2006) and the Global Wood Density Databases of Zanne
et al. (2009). Dispersal trait data were also obtained by literature review in order to fill 80
gaps for the Y species for which no samples could be obtained from the field. For these 10
species, fruit and seed masses and dimensions, were obtained from standard published
papers and databases (i) that of Moles et al. (2004) for 4 species, (ii) specimen information
from Regional floras available on-line, i.e. TROPICOS (Tropicos.org, Missouri Botanical
Garden, 2012), Species of Costa Rica (inbio.ac.cr, National Biodiversity Institute, Costa
Rica, 2007), Flore Scientific Databases (biogeodb.stri.si.edu/bioinformatics, Smithsonian
Tropical Research Institute, 2012) and Agroforestree Database
(worldagroforestrycentre.org, World Agroforestry Centre, 2012) for 6 species.
Data analysis
The relationships between plant traits were evaluated using paired Spearman Rank
Correlation analyses due to the lack of normality of the measured variables even after
application of the common transformations used in ecology. An unbalance data set of 65
species X 17 traits was created due to some of the traits not being measured for all tree
species due to lack of available field samples and time limitations for year-round field
surveys and lack of any previously published data. Species correlations used all the species
with measurements of any given pair of traits. The number of tree species used for paired
correlation analyses or “cross-species correlation” of plant traits varied between 25 and 64
species. The sample number of species (n), significance value (p value) and Spearman rank
correlation coefficient (r) were reported for each of the 120 cross-species correlation
analyses performed (see Table 4 for the resulting integrated correlation analyses).
Principal components analysis (PCA) was used to understand how the patterns of
correlations or trait co-variation might be driving species community assemblage. The
variability of tree species distribution in a multivariate space explained by plant traits was
analyzed using standardized data. A total of seven different PCAs were carried out to
evaluate the variability explained by traits for a higher number of species using multivariate
analyses (highest traits/specie ratio) and maximizing the use of the unbalanced database of
76 species X 16 traits obtained with the combination of field measurements and literature
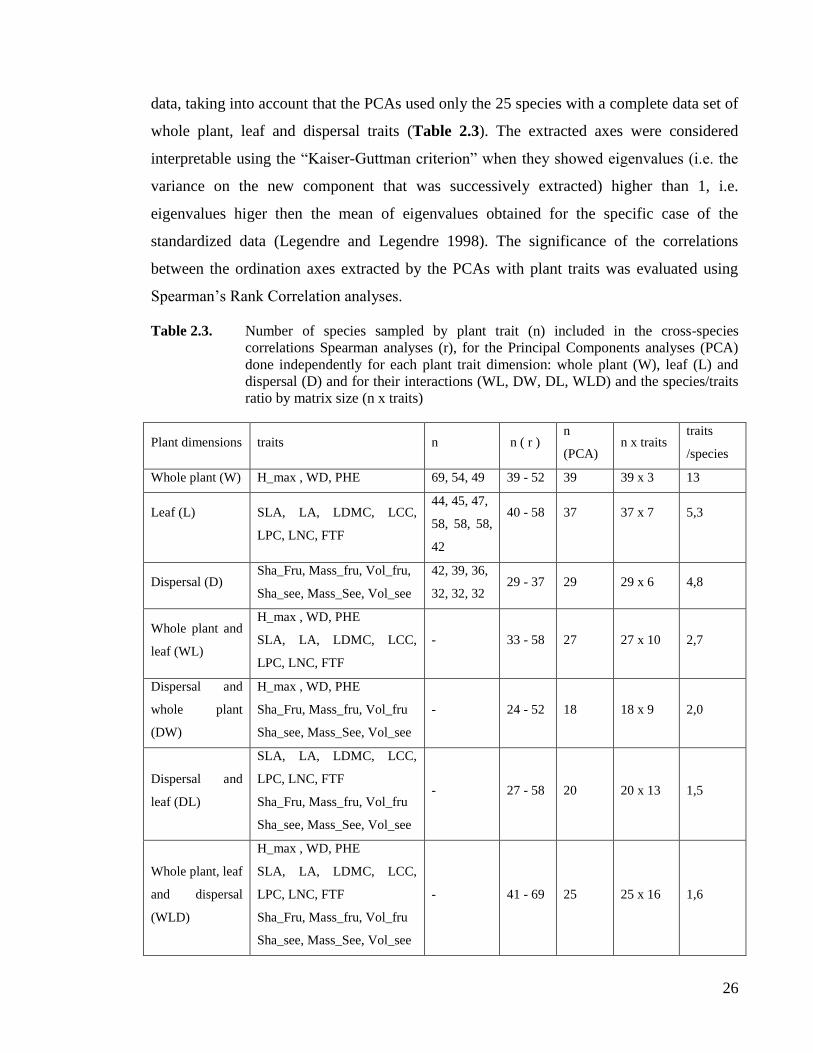
26
data, taking into account that the PCAs used only the 25 species with a complete data set of
whole plant, leaf and dispersal traits (Table 2.3). The extracted axes were considered
interpretable using the “Kaiser-Guttman criterion” when they showed eigenvalues (i.e. the
variance on the new component that was successively extracted) higher than 1, i.e.
eigenvalues higer then the mean of eigenvalues obtained for the specific case of the
standardized data (Legendre and Legendre 1998). The significance of the correlations
between the ordination axes extracted by the PCAs with plant traits was evaluated using
Spearman’s Rank Correlation analyses.
Table 2.3. Number of species sampled by plant trait (n) included in the cross-species
correlations Spearman analyses (r), for the Principal Components analyses (PCA)
done independently for each plant trait dimension: whole plant (W), leaf (L) and
dispersal (D) and for their interactions (WL, DW, DL, WLD) and the species/traits
ratio by matrix size (n x traits)
Plant dimensions traits n n ( r ) n
(PCA) n x traits
traits
/species
Whole plant (W) H_max , WD, PHE 69, 54, 49 39 - 52 39 39 x 3 13
Leaf (L)
SLA, LA, LDMC, LCC,
LPC, LNC, FTF
44, 45, 47,
58, 58, 58,
42
40 - 58
37
37 x 7
5,3
Dispersal (D) Sha_Fru, Mass_fru, Vol_fru,
Sha_see, Mass_See, Vol_see
42, 39, 36,
32, 32, 32 29 - 37 29 29 x 6 4,8
Whole plant and
leaf (WL)
H_max , WD, PHE
SLA, LA, LDMC, LCC,
LPC, LNC, FTF
- 33 - 58 27 27 x 10 2,7
Dispersal and
whole plant
(DW)
H_max , WD, PHE
Sha_Fru, Mass_fru, Vol_fru
Sha_see, Mass_See, Vol_see
- 24 - 52 18 18 x 9 2,0
Dispersal and
leaf (DL)
SLA, LA, LDMC, LCC,
LPC, LNC, FTF
Sha_Fru, Mass_fru, Vol_fru
Sha_see, Mass_See, Vol_see
- 27 - 58 20 20 x 13 1,5
Whole plant, leaf
and dispersal
(WLD)
H_max , WD, PHE
SLA, LA, LDMC, LCC,
LPC, LNC, FTF
Sha_Fru, Mass_fru, Vol_fru
Sha_see, Mass_See, Vol_see
- 41 - 69 25 25 x 16 1,6

27
The first set of three PCAs were performed independently within each set of traits
that have been reported to correlate with main trait axes for tropical trees in previous
literature, i.e. respectively whole plant, leaf, and dispersal traits. 1) The first PCA was done
using only the three measured whole-plant traits, i.e. Hmax, WD and PHE. 2) The second
PCA was done only including the seven measured leaf traits, i.e. SLA, LA, LDMC, LCC,
LPC, LNC and FTF. 3) The third PCA was done using only the quantitatively-measured
dispersal traits, i.e. fruit and seed shape, mass and volume. The second set of three
additional PCAs each combined two of the three sets of traits: 4) whole plant and leaf traits;
5) whole plant and dispersal traits; 6) leaf and dispersal traits. A final integrating PCA was
done combining all three sets of traits together; this was carried out in a complete balanced
species X trait data matrix for 25 tree species and 16 traits. Finally, logistic regression
analyses were run to test the significance and direction of the associations between the
observed categorical dispersal modes (zoochory, mammalochory, anemochory and
autochory) and the quantitative whole plant, leaf and dispersal traits. All the data analyses
were carried out using Infostat Professional software (Infostat 2011).
2.4 RESULTS
Whole plant traits
The Spearman’s rank correlation analyses showed that PHE was strongly and
negatively correlated (p = 0.01) with WD and positively but more weakly correlated (p =
0.084) with H max (Table 2.4). The evidence was weaker still for an association between
WD and H max (p = 0.11). Using PCA, a total of 80% of species variability was explained
by the first two components in the whole-plant traits’ space. The first axis (CP1W)
explained 56% of variability (having an eigenvalue higher than 1) for a total of 39 species.
Spearman’s rank correlation coefficients between traits and this axis showed that CP1W
was signficantly correlated (p ≤ 0.05) positively with WD (0.79) and negatively with PHE
(-0.78). In contrast H_max was significantly positively correlated with the second axis,
CP2W (0.71), which explained 24.5% of species distribution variability. These correlations
indicate that evergreen species tend to have denser wood and lower maximum height than
deciduous species, which are less closely related to H-max.
28
Leaf traits
The Spearman’ rank correlation analyses showed that LDMC was strongly (p ≤
0.01) positively correlated with SLA, LCC and FTF, but negatively with LPC (and more
weakly (p = 0.053) with LNC) (Table 2.4). SLA was, in addition, very negatively
correlated with FTF (p = 0.0001), but positively with LNC (p = 0.001) (and more weakly (p
= 0.07) with LPC). LPC was also strongly (p < 0.01) negatively correlated with FTF and
positively with LNC. LNC was strongly (p < 0.01) negatively correlated with FTF and with
LA. LCC was also strongly (p < 0.01) negatively correlated with LPC. These results show
that species with high LDMC tend to have high LCC and high FTF, but low SLA, LPC and
LNC. Also, species with high LNC tend to have a high SLA and LPC but a low LA, LDMC
and FTF.
The first two principal components for leaf traits (CP1L and CP2L) explained 57%
of variance among species within the all-leaf-traits’ space (having Eigen values higher than
1) for a total of 37 species. CP1L significantly separates (p≤0,05) species along a spectrum
from those with a high LDMC (r for association with axis 0.82), LCC (0.58) and FTF
(0.55) from those with high SLA (-0.69) and LPC (-0.68), explaining 35% of species’
variability. In contrast axis CP2L distinguishes species with high LA (0.78) from species
with high LNC (-0.66), explaining 22% of variability in species’ variability.
Whole plant and leaf traits
PHE was negatively correlated (p ≤ 0.05) with FTF and positively with LPC (Table
2.4). H_max was strongly negatively correlated with SLA p= 0.005) but weakly with FTF
(p = 0.09), and positively correlated with LDMC (p = 0.04) and very weakly with LCC (p =
0.13). WD was only positively correlated with LDMC (p = 0.007). These results showed
that tree species with dense wood tended to have high leaf dry matter contents, even though
leaf dry matter content was not closely related with leaf phenology. In contrast taller
species tended to have a low specific leaf area linked to a high leaf dry matter content and
strength. The only leaf traits linked to a deciduous leaf phenology were higher
concentrations of phosphorous and lower strength.
The most important axis observed in the PCA corresponded to that of leaf
economics (indicated by SLA and LPC versus LDMC, LCC and FTF1), which was also
29
strongly correlated with phenology (p = 0.006): deciduous species tended to invest less
resource per leaf (Table 2.5). H max (p < 0.0001) and deciduous phenology (PHE, p =
0.001) were strongly loaded onto a separate axis from that of the leaf economics spectrum,
with opposite loading being shown only by LA (p = 0.02). Forty-nine per cent of species
variability (amongst 26 species) was explained by these first two components of the PCA
combining all leaf and vegetative traits (CP1WL and CP2WL) (Figure 2.1). The
correlations of Hmax with leaf traits suggest that taller species are more resource
conservative. However, this is not reflected at all in the whole plant-leaf traits PCA.
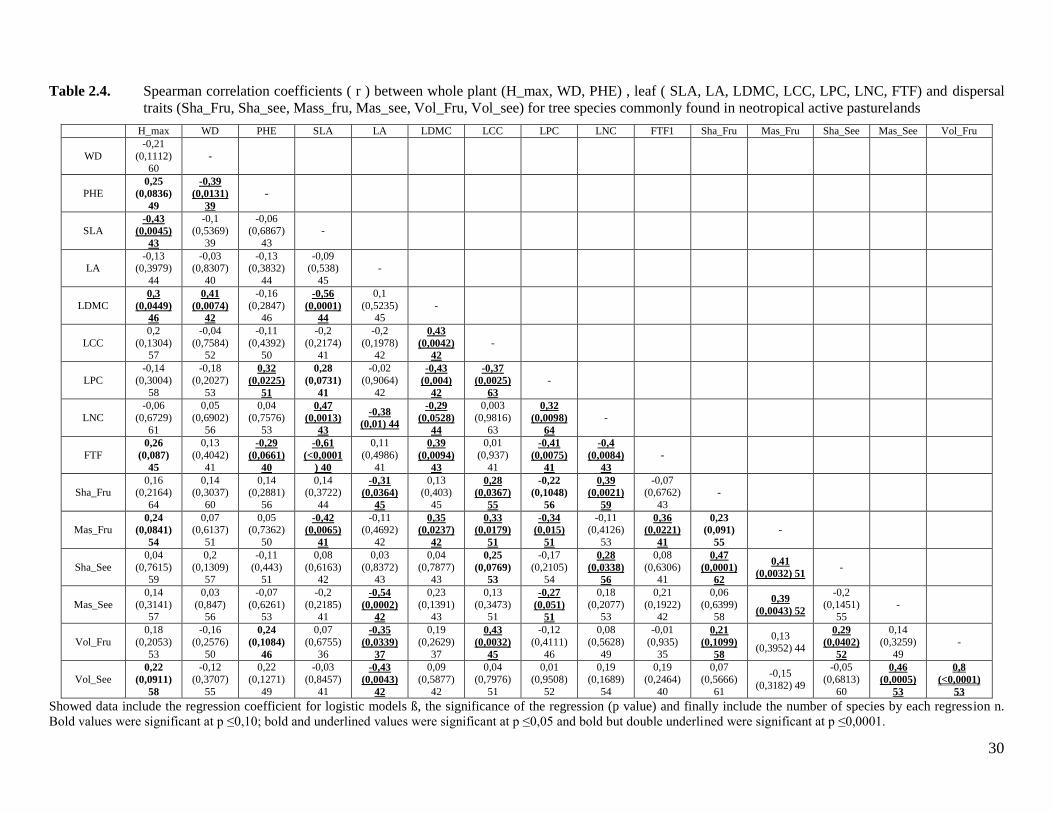
30
Table 2.4. Spearman correlation coefficients ( r ) between whole plant (H_max, WD, PHE) , leaf ( SLA, LA, LDMC, LCC, LPC, LNC, FTF) and dispersal
traits (Sha_Fru, Sha_see, Mass_fru, Mas_see, Vol_Fru, Vol_see) for tree species commonly found in neotropical active pasturelands
H_max WD PHE SLA LA LDMC LCC LPC LNC FTF1 Sha_Fru Mas_Fru Sha_See Mas_See Vol_Fru
WD
-0,21
(0,1112)
60
-
PHE 0,25
(0,0836)
49
-0,39
(0,0131)
39
-
SLA -0,43
(0,0045)
43
-0,1 (0,5369)
39
-0,06 (0,6867)
43
-
LA -0,13
(0,3979)
44
-0,03 (0,8307)
40
-0,13 (0,3832)
44
-0,09 (0,538)
45
-
LDMC 0,3
(0,0449)
46
0,41
(0,0074)
42
-0,16
(0,2847) 46
-0,56
(0,0001)
44
0,1
(0,5235) 45
-
LCC
0,2
(0,1304) 57
-0,04
(0,7584) 52
-0,11
(0,4392) 50
-0,2
(0,2174) 41
-0,2
(0,1978) 42
0,43
(0,0042)
42
-
LPC
-0,14
(0,3004)
58
-0,18
(0,2027)
53
0,32
(0,0225)
51
0,28
(0,0731)
41
-0,02
(0,9064)
42
-0,43
(0,004)
42
-0,37
(0,0025)
63
-
LNC
-0,06
(0,6729)
61
0,05
(0,6902)
56
0,04
(0,7576)
53
0,47
(0,0013)
43
-0,38
(0,01) 44
-0,29
(0,0528)
44
0,003
(0,9816)
63
0,32
(0,0098)
64
-
FTF 0,26
(0,087)
45
0,13
(0,4042)
41
-0,29
(0,0661)
40
-0,61
(<0,0001
) 40
0,11
(0,4986)
41
0,39
(0,0094)
43
0,01
(0,937)
41
-0,41
(0,0075)
41
-0,4
(0,0084)
43
-
Sha_Fru 0,16
(0,2164)
64
0,14 (0,3037)
60
0,14 (0,2881)
56
0,14 (0,3722)
44
-0,31
(0,0364)
45
0,13 (0,403)
45
0,28
(0,0367)
55
-0,22
(0,1048)
56
0,39
(0,0021)
59
-0,07 (0,6762)
43
-
Mas_Fru 0,24
(0,0841)
54
0,07 (0,6137)
51
0,05 (0,7362)
50
-0,42
(0,0065)
41
-0,11 (0,4692)
42
0,35
(0,0237)
42
0,33
(0,0179)
51
-0,34
(0,015)
51
-0,11 (0,4126)
53
0,36
(0,0221)
41
0,23
(0,091)
55
-
Sha_See
0,04
(0,7615)
59
0,2
(0,1309)
57
-0,11
(0,443)
51
0,08
(0,6163)
42
0,03
(0,8372)
43
0,04
(0,7877)
43
0,25
(0,0769)
53
-0,17
(0,2105)
54
0,28
(0,0338)
56
0,08
(0,6306)
41
0,47
(0,0001)
62
0,41
(0,0032) 51 -
Mas_See
0,14
(0,3141) 57
0,03
(0,847) 56
-0,07
(0,6261) 53
-0,2
(0,2185) 41
-0,54
(0,0002)
42
0,23
(0,1391) 43
0,13
(0,3473) 51
-0,27
(0,051)
51
0,18
(0,2077) 53
0,21
(0,1922) 42
0,06
(0,6399) 58
0,39
(0,0043) 52
-0,2
(0,1451) 55
-
Vol_Fru
0,18
(0,2053)
53
-0,16
(0,2576)
50
0,24
(0,1084)
46
0,07
(0,6755)
36
-0,35
(0,0339)
37
0,19
(0,2629)
37
0,43
(0,0032)
45
-0,12
(0,4111)
46
0,08
(0,5628)
49
-0,01
(0,935)
35
0,21
(0,1099)
58
0,13 (0,3952) 44
0,29
(0,0402)
52
0,14
(0,3259)
49
-
Vol_See 0,22
(0,0911)
58
-0,12
(0,3707)
55
0,22
(0,1271)
49
-0,03
(0,8457)
41
-0,43
(0,0043)
42
0,09
(0,5877)
42
0,04
(0,7976)
51
0,01
(0,9508)
52
0,19
(0,1689)
54
0,19
(0,2464)
40
0,07
(0,5666)
61
-0,15 (0,3182) 49
-0,05
(0,6813)
60
0,46
(0,0005)
53
0,8
(<0,0001)
53
Showed data include the regression coefficient for logistic models ß, the significance of the regression (p value) and finally include the number of species by each regression n.
Bold values were significant at p ≤0,10; bold and underlined values were significant at p ≤0,05 and bold but double underlined were significant at p ≤0,0001.

31
Table 2.5. Spearman correlation coefficients r between whole plant (H_max, WD, PHE), leaf (SLA, LA, LDMC, LCC, LPC, LNC, FTF) and dispersal traits
(Sha_Fru, Sha_see, Mass_fru, Mas_see, Vol_Fru, Vol_see) with the principal components resulting from the PCA analyses resulted from paired
trait dimensions interactions (WL, WD, LD) and for all the traits together (WLD)
CP (n) H_max WD PHE SLA LA LDMC LCC LPC LNC FTF1 Sha_fru Mas_fru Sha_see Mas_se Vol_fru Vol_see
CP1 WL (27) -0,02
(0,9296)
0,26
(0,1852) -0,52
(0,0062)
-0,61
(0,0009)
0,08
(0,6729) 0,78
(0,0001)
0,54
(0,0072)
-0,78
(<0,0001)
-0,34
(0,0897)
0,69
(0,0001)
CP2 WL (27) 0,90
(<0,0001)
-0,39
(0,0487)
0,60
(0,0012)
-0,29 (0,153)
-0,48
(0,0159)
0,08 (0,6804)
0,09 (0,6679)
-0,03 (0,8727)
0,14 (0,4946)
0,28 (0,1726)
CP3 WL (27) -0,16
(0,4422) 0,76
(0,0002)
-0,31
(0,1254)
0,04
(0,8485) -0,35
(0,0798)
0,09
(0,6407)
-0,19
(0,3428)
0,32
(0,1146) 0,67
(0,0002)
-0,05
(0,8072)
CP4 WL (27) -0,02
(0,9057)
-0,18
(0,3787)
0,08
(0,707) 0,51
(0,0081)
-0,46
(0,0223)
0,11
(0,5903) 0,62
(0,0021)
-0,22
(0,2803) 0,38
(0,059)
-0,49
(0,0102)
CP1 WD (18) 0,18
(0,4655) 0,5
(0,0353)
-0,4
(0,101)
0,19
(0,4551) 0,97
(<0,0001)
0,03
(0,9196) 0,97
(<0,0001)
0,95
(<0,0001)
0,73
(0,0006)
CP2 WD (18) 0,42
(0,0815)
-0,28
(0,2531) 0,39
(0,112) 0,79
(0,0001)
0,07
(0,7726) 0,82
(<0,0001)
-0,07
(0,7683)
0,17
(0,5011)
-0,15
(0,5542)
CP3 WD (18) -0,55
(0,0177)
0,63
(0,0047)
-0,42
(0,0841)
0,26
(0,2942)
0,01
(0,975)
0,35
(0,1551)
-0,19
(0,4622)
0,04
(0,8807) -0,42
(0,086)
CP1 LD (20)
-0,28
(0,3205)
-0,26
(0,3525) 0,71
(0,0028)
0,62
(0,0098)
-0,37
(0,1613)
-0,26
(0,3222) 0,47
(0,0652)
0,21
(0,3977) 0,93
(<0,0001)
0,02
(0,9503) 0,95
(<0,0001)
0,92
(<0,0001)
0,76
(0,0002)
CP2 LD (20)
0,05
(0,8692)
0,1
(0,7149)
0,07
(0,7919)
0,4
(0,1249)
-0,04
(0,8725)
-0,02
(0,9314)
0,15
(0,5879) 0,6
(0,008)
0,05
(0,8291) 0,85
(<0,0001)
-0,09
(0,7144)
0,18
(0,4785)
-0,15
(0,5641)
CP3 LD (20)
0,34
(0,2107)
0,33
(0,2229)
0,08
(0,7893)
-0,05
(0,854)
-0,2
(0,4472)
-0,14
(0,5967)
-0,2
(0,4496)
0,21
(0,4071)
0,07
(0,7876)
0,33
(0,1814)
-0,09
(0,7351)
0,08
(0,754)
-0,33
(0,1797)
CP4 LD (20)
-0,33
(0,2275)
-0,28
(0,321)
0,29
(0,3024)
0,38
(0,1441) -0,48
(0,0611)
0,38
(0,1435)
0,15
(0,5907) 0,59
(0,0093)
-0,17
(0,5021)
0,1
(0,7039)
-0,15
(0,5619)
-0,16
(0,5307)
-0,01
(0,9734)
CP1 WLD (25) 0,29
(0,153)
0,2
(0,3357)
-0,09
(0,6592) -0,54
(0,0056)
-0,08
(0,6785) 0,74
(0,0003)
0,63
(0,0019)
-0,74
(<0,0001)
-0,26
(0,2085) 0,55
(0,0048)
0,39
(0,0563)
0,65
(0,0015)
0,29
(0,1672)
0,31
(0,1317)
0,33
(0,1092)
0,28
(0,1739)
CP2 WLD (25) -0,18
(0,3883)
0,23
(0,262)
-0,42
(0,035)
0,54
(0,0052)
-0,04
(0,8329)
0,1
(0,6215) 0,5
(0,0149)
-0,07
(0,726) 0,70
(0,0001)
-0,24
(0,2413) 0,56
(0,0034)
-0,03
(0,8772) 0,59
(0,0018)
-0,19
(0,3442) 0,39
(0,0575)
0,05
(0,8053)
CP3 WLD (25) 0,77
(<0,0001)
-0,27
(0,189)
0,24
(0,2517) -0,62
(0,0009)
0,35
(0,0844) 0,48
(0,0185)
0,24
(0,2489)
-0,24
(0,245)
-0,23
(0,2768) 0,56
(0,0034)
0,4
(0,0501)
0,26
(0,1975)
0,25
(0,2288)
-0,28
(0,1761)
-0,07
(0,7373)
-0,17
(0,4262)
CP4 WLD (25) 0,31
(0,1326) -0,64
(0,0006)
0,67
(0,0003)
0,09
(0,6525) -0,42
(0,0411)
-0,22
(0,2811)
0,17
(0,4071)
-0,16
(0,4496)
-0,09
(0,67)
-0,23
(0,2767) 0,39
(0,0536)
0,15
(0,4693)
0,07
(0,7395)
0,03
(0,8891) 0,45
(0,0278)
0,28
(0,1782)
CP5 WLD (25) 0,05
(0,8255)
0,22
(0,281)
0,31
(0,1267)
-0,03
(0,8694) 0,70
(0,0006)
0,06
(0,7803)
-0,16
(0,4309)
0,17
(0,406)
-0,18
(0,3974)
-0,08
(0,7169)
-0,27
(0,1891)
0,02
(0,91) 0,48
(0,0141)
-0,61
(0,0027)
-0,08
(0,6979)
-0,31
(0,1265)
CP6 WLD (25) 0,35
(0,0872)
0,23
(0,2636)
0,12
(0,5676)
-0,02
(0,9069)
-0,11
(0,6057)
0,27
(0,1834)
0,16
(0,4443)
0,52
(0,0072)
-0,01
(0,9811)
-0,24
(0,2491)
-0,25
(0,2347)
-0,03
(0,8832)
-0,18
(0,3789)
0,04
(0,827)
-0,04
(0,8358)
-0,08
(0,7065)
Showed data include the Spearman correlation coefficient n and the significance of the regression (p value). The number of species by each regression n is inside parenthesis in
each row label. Bold values were significant at p ≤0,10; bold and underlined values were significant at p ≤0,05 and bold but double underlined were significant at p ≤0,0001.
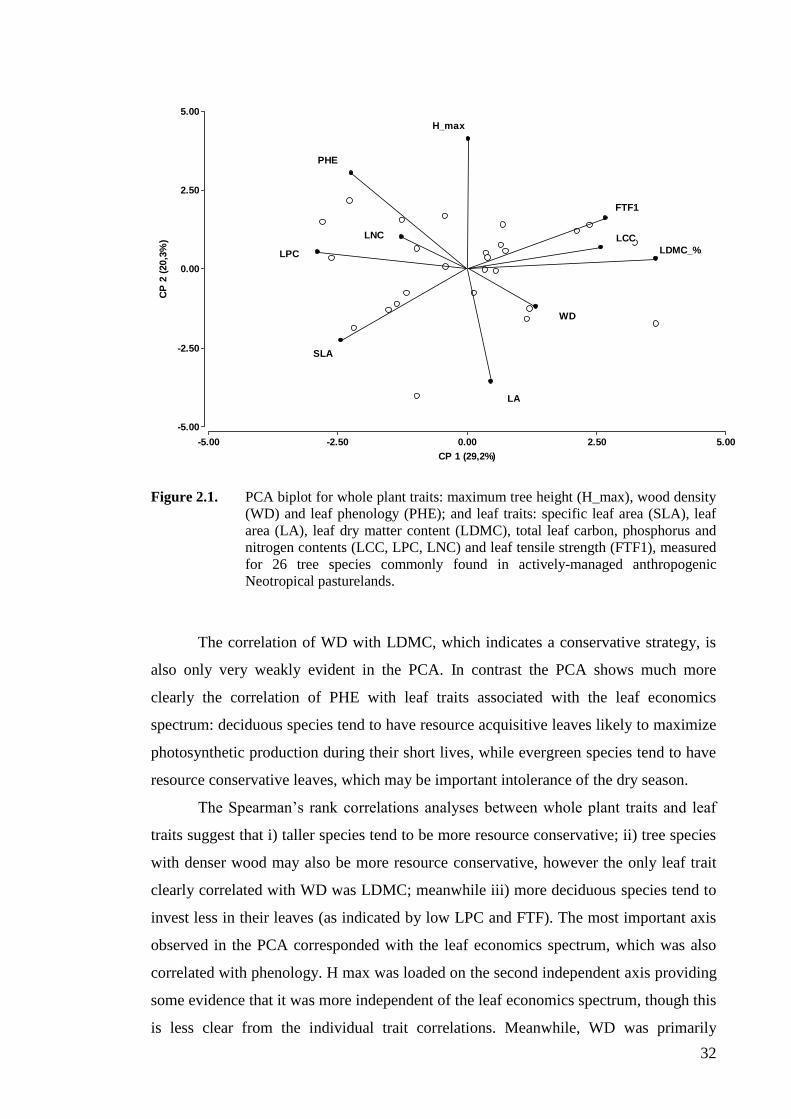
32
Figure 2.1. PCA biplot for whole plant traits: maximum tree height (H_max), wood density
(WD) and leaf phenology (PHE); and leaf traits: specific leaf area (SLA), leaf
area (LA), leaf dry matter content (LDMC), total leaf carbon, phosphorus and
nitrogen contents (LCC, LPC, LNC) and leaf tensile strength (FTF1), measured
for 26 tree species commonly found in actively-managed anthropogenic
Neotropical pasturelands.
The correlation of WD with LDMC, which indicates a conservative strategy, is
also only very weakly evident in the PCA. In contrast the PCA shows much more
clearly the correlation of PHE with leaf traits associated with the leaf economics
spectrum: deciduous species tend to have resource acquisitive leaves likely to maximize
photosynthetic production during their short lives, while evergreen species tend to have
resource conservative leaves, which may be important intolerance of the dry season.
The Spearman’s rank correlations analyses between whole plant traits and leaf
traits suggest that i) taller species tend to be more resource conservative; ii) tree species
with denser wood may also be more resource conservative, however the only leaf trait
clearly correlated with WD was LDMC; meanwhile iii) more deciduous species tend to
invest less in their leaves (as indicated by low LPC and FTF). The most important axis
observed in the PCA corresponded with the leaf economics spectrum, which was also
correlated with phenology. H max was loaded on the second independent axis providing
some evidence that it was more independent of the leaf economics spectrum, though this
is less clear from the individual trait correlations. Meanwhile, WD was primarily
-5.00 -2.50 0.00 2.50 5.00
CP 1 (29,2%)
-5.00
-2.50
0.00
2.50
5.00
CP
2 (
20,3
%)
SLA
LA
LDMC_%
LCC
LPC
LNC
FTF1
H_max
WD
PHE
SLA
LA
LDMC_%
LCC
LPC
LNC
FTF1
H_max
WD
PHE

33
displaced to a third axis (together with LNC) though it was also correlated with the
second axis.
Dispersal traits
For the 29 tested species, seed mass was strongly positively correlated (p < 0.01)
with fruit mass and seed volume (Table 2.4). Fruit mass was also strongly positively
correlated (p = 0.003) with seed shape and weakly (p = 0.09) with fruit shape. Fruit
shape and seed shape were strongly positively correlated (p = 0.0001). Fruit volume was
correlated with seed shape (p = 0.04) and weakly with fruit shape (p = 0.11). These
results show that tree species with bigger, heavier and longer fruits tended also to have
bigger, heavier and longer seeds. However, individual relationships amongst these traits
were variable and tended to be stronger for seeds than for fruits, i.e. species with bigger
fruits were not necessarily heaviest or carrying heavier seeds, though they were very
likely to be carrying bigger seeds. There was a clear trend for species with bigger seeds
to have heavier seeds. Fruit and seed shapes were consistently correlated with fruit mass
and volume but not with seed mass or volume: longer, heavier and bigger fruit tended to
have longer seeds but did not necessarily have heavier or bigger seeds. However, and
indirect correlation between dipersule shapes with seed morphology was always present
due the strong correlations between fruit shape with fruit morphology and among
dispersule shapes. i.e the more voluminous fruits were also the longest fruits, and
contain voluminous and longest seeds which were not necessarily the heaviest
dispersules. Instead, voluminous seeds were indeed the heaviest ones and were found in
the biggest fruits but not necessarily in the heaviest fruits.
The PCA result reflects the strong correlations between the measured fruit and
seed traits. The two principal axes explain together a total of 63% of the variation
amongst species in trait values of fruit and seed mass, volume and shape (Figure 2.2).
The first axis explains 33%, the second axis 30% and a third axis an additional 18% of
species variability (having eigenvalues higher than 1). Spearman’s rank correlation
coefficients between dispersal traits and the first two axes (CP1D and CP2D) showed
that Axis 1 reflects a spectrum of seed and fruit mass (r = 0.95 and 0.81 respectively)
and volume (0.72 and 0.62 respecively), and axis 2 was defined by increasing
elongation of seed and fruit shape (0.85 and 0.89) respectively, which were strongly
orthogonal to axis 1.

34
Figure 2.2. PCA biplot for dispersal traits: fruit and seed mass (Mas_Fru, Mas_See),
volume (Vol_Fru, Vol_See) and shape (Sha_Fru, Sha_See) measured for 29
trees species commonly found in actively managed anthropogenic Neotropical
pasturelands
Dispersal mode
The majority of the tree species (64%) were mainly dispersed by animals
(zoochory) (Table 2.6). Within this set, almost half of the total number of species (49%)
were dispersed mainly by native fauna like frugivorous birds, bats or small rodents,
which eat the entire fleshy fruits (drupes or berries) or the fleshy endocarps (arils)
ingesting at the same time the small and spherical seeds and subsequently releasing
them away the parental trees after digestion of the fruit (endozoochory). A lower
proportion of the total species (15%) have a different form of zoochory with indehiscent
well-protected fruits (with a wood-like exocarp) enclosing succulent endocarps or, when
dry, containing a sweet to sour oleaginous substances (like honey) and are particularly
attractive for consumption by cattle which eat these fruits during the dry season together
with their enclosed bigger seeds that are dispersed in the cattle dungs. These tree species
are considered to be originally dispersed by big mammals (mammalochory) like native
horses, gomphotheres, ground sloths, and other megafauna, which are already extinct
from South-America (Pleistocene) and have been replaced today by cattle (seed
-4.00 -1.00 2.00 5.00 8.00
CP 1 (43.4%)
-4.00
-1.00
2.00
5.00
8.00
CP
2 (
31.2
%)
Sha_Fru
Mas_Fru
Sha_See
Mas_See
Vol_Fru
Vol_See
Sha_Fru
Mas_Fru
Sha_See
Mas_See
Vol_Fru
Vol_See
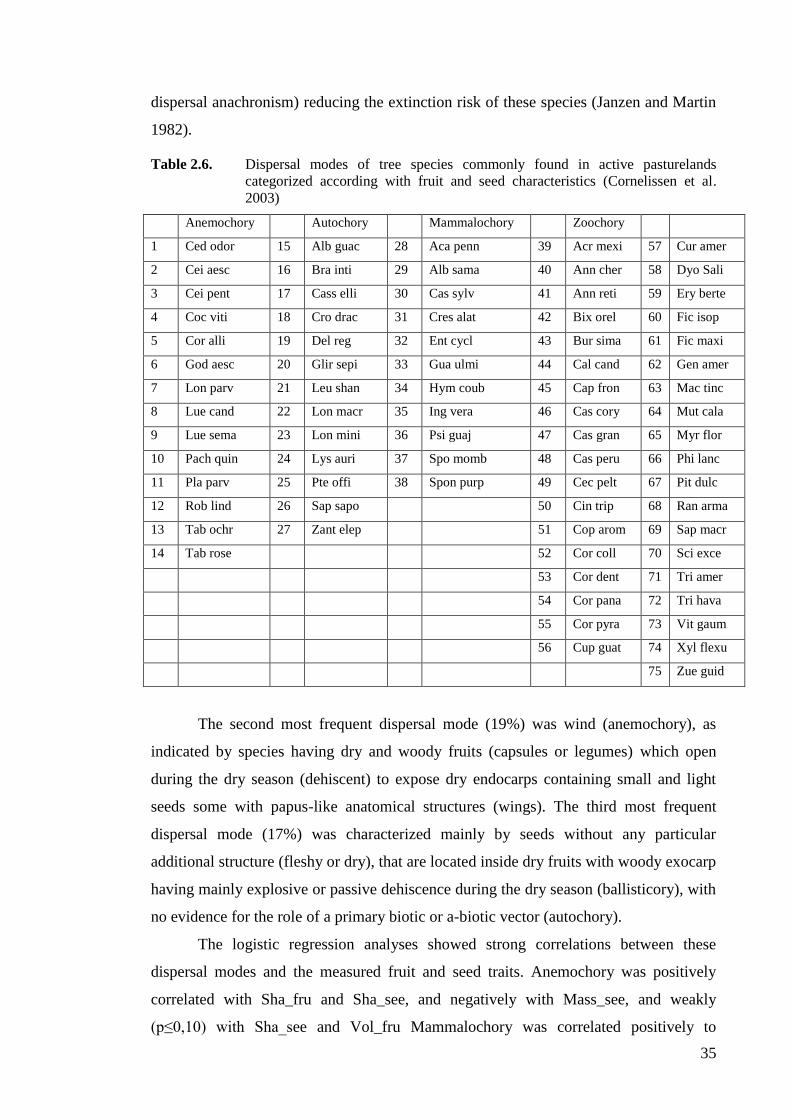
35
dispersal anachronism) reducing the extinction risk of these species (Janzen and Martin
1982).
Table 2.6. Dispersal modes of tree species commonly found in active pasturelands
categorized according with fruit and seed characteristics (Cornelissen et al.
2003)
Anemochory Autochory Mammalochory Zoochory
1 Ced odor 15 Alb guac 28 Aca penn 39 Acr mexi 57 Cur amer
2 Cei aesc 16 Bra inti 29 Alb sama 40 Ann cher 58 Dyo Sali
3 Cei pent 17 Cass elli 30 Cas sylv 41 Ann reti 59 Ery berte
4 Coc viti 18 Cro drac 31 Cres alat 42 Bix orel 60 Fic isop
5 Cor alli 19 Del reg 32 Ent cycl 43 Bur sima 61 Fic maxi
6 God aesc 20 Glir sepi 33 Gua ulmi 44 Cal cand 62 Gen amer
7 Lon parv 21 Leu shan 34 Hym coub 45 Cap fron 63 Mac tinc
8 Lue cand 22 Lon macr 35 Ing vera 46 Cas cory 64 Mut cala
9 Lue sema 23 Lon mini 36 Psi guaj 47 Cas gran 65 Myr flor
10 Pach quin 24 Lys auri 37 Spo momb 48 Cas peru 66 Phi lanc
11 Pla parv 25 Pte offi 38 Spon purp 49 Cec pelt 67 Pit dulc
12 Rob lind 26 Sap sapo
50 Cin trip 68 Ran arma
13 Tab ochr 27 Zant elep
51 Cop arom 69 Sap macr
14 Tab rose
52 Cor coll 70 Sci exce
53 Cor dent 71 Tri amer
54 Cor pana 72 Tri hava
55 Cor pyra 73 Vit gaum
56 Cup guat 74 Xyl flexu
75 Zue guid
The second most frequent dispersal mode (19%) was wind (anemochory), as
indicated by species having dry and woody fruits (capsules or legumes) which open
during the dry season (dehiscent) to expose dry endocarps containing small and light
seeds some with papus-like anatomical structures (wings). The third most frequent
dispersal mode (17%) was characterized mainly by seeds without any particular
additional structure (fleshy or dry), that are located inside dry fruits with woody exocarp
having mainly explosive or passive dehiscence during the dry season (ballisticory), with
no evidence for the role of a primary biotic or a-biotic vector (autochory).
The logistic regression analyses showed strong correlations between these
dispersal modes and the measured fruit and seed traits. Anemochory was positively
correlated with Sha_fru and Sha_see, and negatively with Mass_see, and weakly
(p≤0,10) with Sha_see and Vol_fru Mammalochory was correlated positively to
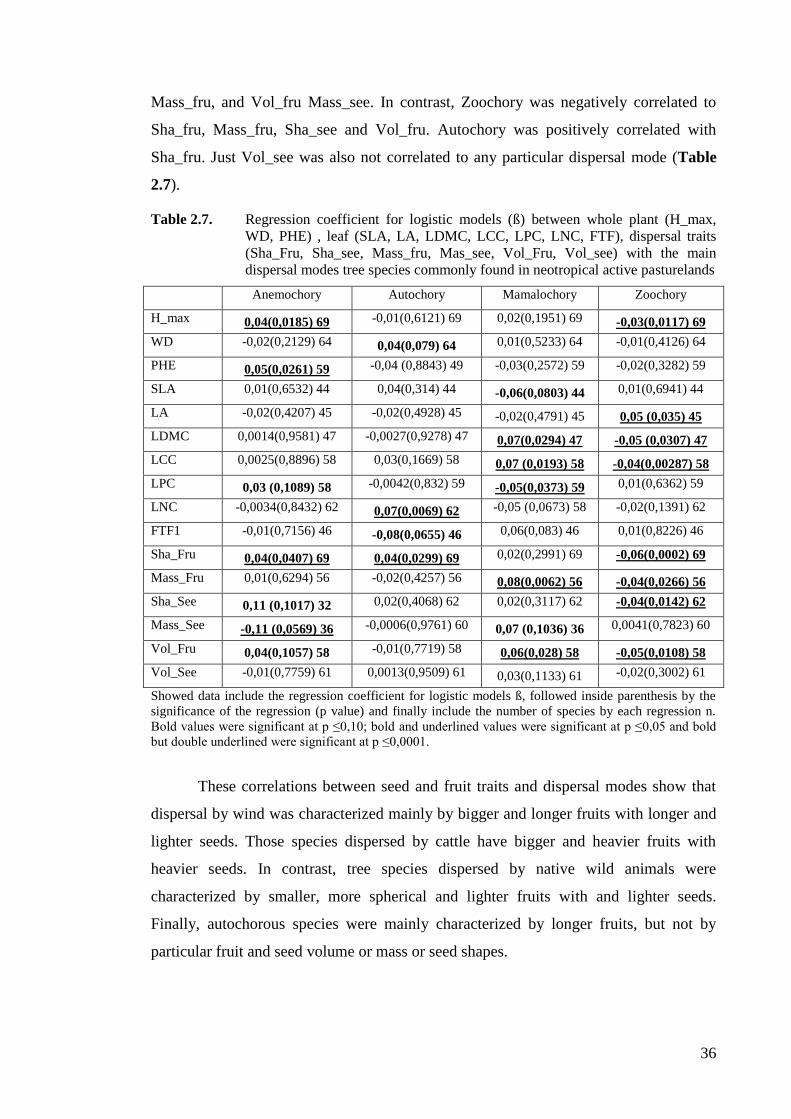
36
Mass_fru, and Vol_fru Mass_see. In contrast, Zoochory was negatively correlated to
Sha_fru, Mass_fru, Sha_see and Vol_fru. Autochory was positively correlated with
Sha_fru. Just Vol_see was also not correlated to any particular dispersal mode (Table
2.7).
Table 2.7. Regression coefficient for logistic models (ß) between whole plant (H_max,
WD, PHE) , leaf (SLA, LA, LDMC, LCC, LPC, LNC, FTF), dispersal traits
(Sha_Fru, Sha_see, Mass_fru, Mas_see, Vol_Fru, Vol_see) with the main
dispersal modes tree species commonly found in neotropical active pasturelands
Anemochory Autochory Mamalochory Zoochory
H_max 0,04(0,0185) 69 -0,01(0,6121) 69 0,02(0,1951) 69 -0,03(0,0117) 69
WD -0,02(0,2129) 64 0,04(0,079) 64 0,01(0,5233) 64 -0,01(0,4126) 64
PHE 0,05(0,0261) 59 -0,04 (0,8843) 49 -0,03(0,2572) 59 -0,02(0,3282) 59
SLA 0,01(0,6532) 44 0,04(0,314) 44 -0,06(0,0803) 44 0,01(0,6941) 44
LA -0,02(0,4207) 45 -0,02(0,4928) 45 -0,02(0,4791) 45 0,05 (0,035) 45
LDMC 0,0014(0,9581) 47 -0,0027(0,9278) 47 0,07(0,0294) 47 -0,05 (0,0307) 47
LCC 0,0025(0,8896) 58 0,03(0,1669) 58 0,07 (0,0193) 58 -0,04(0,00287) 58
LPC 0,03 (0,1089) 58 -0,0042(0,832) 59 -0,05(0,0373) 59 0,01(0,6362) 59
LNC -0,0034(0,8432) 62 0,07(0,0069) 62 -0,05 (0,0673) 58 -0,02(0,1391) 62
FTF1 -0,01(0,7156) 46 -0,08(0,0655) 46 0,06(0,083) 46 0,01(0,8226) 46
Sha_Fru 0,04(0,0407) 69 0,04(0,0299) 69 0,02(0,2991) 69 -0,06(0,0002) 69
Mass_Fru 0,01(0,6294) 56 -0,02(0,4257) 56 0,08(0,0062) 56 -0,04(0,0266) 56
Sha_See 0,11 (0,1017) 32 0,02(0,4068) 62 0,02(0,3117) 62 -0,04(0,0142) 62
Mass_See -0,11 (0,0569) 36 -0,0006(0,9761) 60 0,07 (0,1036) 36 0,0041(0,7823) 60
Vol_Fru 0,04(0,1057) 58 -0,01(0,7719) 58 0,06(0,028) 58 -0,05(0,0108) 58
Vol_See -0,01(0,7759) 61 0,0013(0,9509) 61 0,03(0,1133) 61 -0,02(0,3002) 61
Showed data include the regression coefficient for logistic models ß, followed inside parenthesis by the
significance of the regression (p value) and finally include the number of species by each regression n.
Bold values were significant at p ≤0,10; bold and underlined values were significant at p ≤0,05 and bold
but double underlined were significant at p ≤0,0001.
These correlations between seed and fruit traits and dispersal modes show that
dispersal by wind was characterized mainly by bigger and longer fruits with longer and
lighter seeds. Those species dispersed by cattle have bigger and heavier fruits with
heavier seeds. In contrast, tree species dispersed by native wild animals were
characterized by smaller, more spherical and lighter fruits with and lighter seeds.
Finally, autochorous species were mainly characterized by longer fruits, but not by
particular fruit and seed volume or mass or seed shapes.
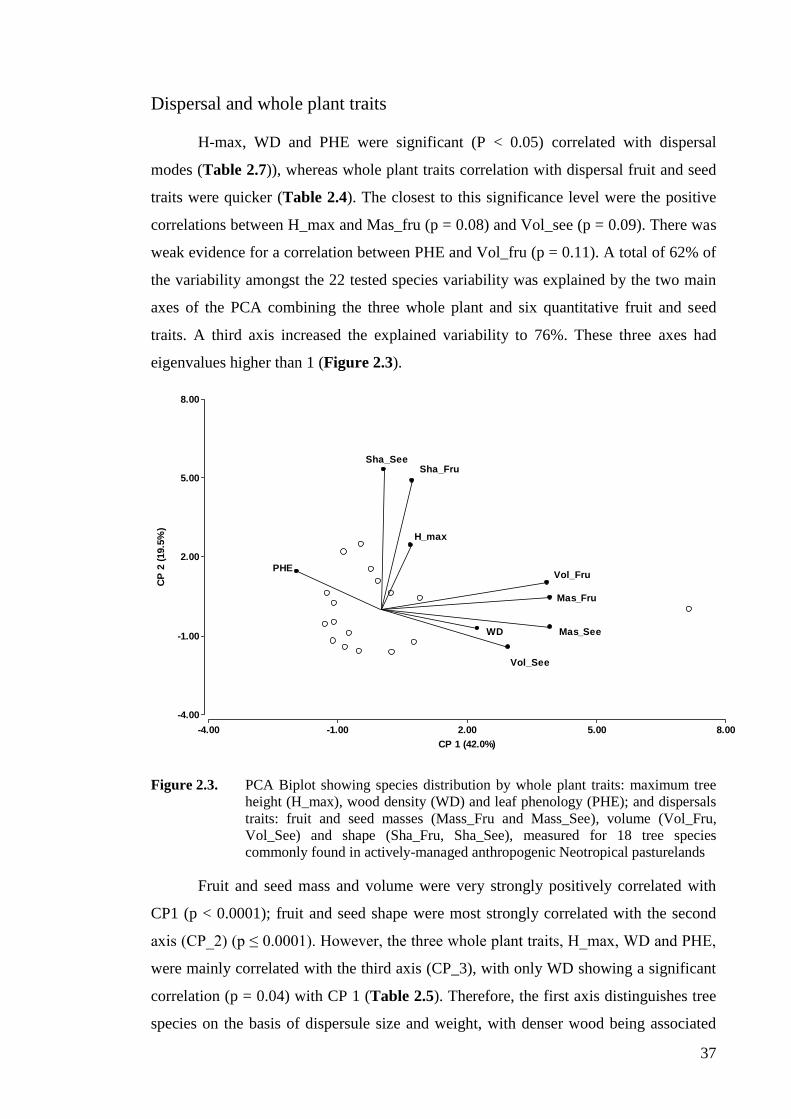
37
Dispersal and whole plant traits
H-max, WD and PHE were significant (P < 0.05) correlated with dispersal
modes (Table 2.7)), whereas whole plant traits correlation with dispersal fruit and seed
traits were quicker (Table 2.4). The closest to this significance level were the positive
correlations between H_max and Mas_fru (p = 0.08) and Vol_see (p = 0.09). There was
weak evidence for a correlation between PHE and Vol_fru (p = 0.11). A total of 62% of
the variability amongst the 22 tested species variability was explained by the two main
axes of the PCA combining the three whole plant and six quantitative fruit and seed
traits. A third axis increased the explained variability to 76%. These three axes had
eigenvalues higher than 1 (Figure 2.3).
Figure 2.3. PCA Biplot showing species distribution by whole plant traits: maximum tree
height (H_max), wood density (WD) and leaf phenology (PHE); and dispersals
traits: fruit and seed masses (Mass_Fru and Mass_See), volume (Vol_Fru,
Vol_See) and shape (Sha_Fru, Sha_See), measured for 18 tree species
commonly found in actively-managed anthropogenic Neotropical pasturelands
Fruit and seed mass and volume were very strongly positively correlated with
CP1 (p < 0.0001); fruit and seed shape were most strongly correlated with the second
axis (CP_2) (p ≤ 0.0001). However, the three whole plant traits, H_max, WD and PHE,
were mainly correlated with the third axis (CP_3), with only WD showing a significant
correlation (p = 0.04) with CP 1 (Table 2.5). Therefore, the first axis distinguishes tree
species on the basis of dispersule size and weight, with denser wood being associated
-4.00 -1.00 2.00 5.00 8.00
CP 1 (42.0%)
-4.00
-1.00
2.00
5.00
8.00
CP
2 (
19.5
%)
H_max
WD
PHE
Sha_Fru
Mas_Fru
Sha_See
Mas_See
Vol_Fru
Vol_See
H_max
WD
PHE
Sha_Fru
Mas_Fru
Sha_See
Mas_See
Vol_Fru
Vol_See

38
with bigger and heavier dispersules. The second main axis separate species on the basis
of dipersule shape, and the third axis is largely unrelated to seed and fruit traits.
The PCA results emphasized the independence of the dispersule and whole-plant
traits that is obvious in the correlations. Probably CP1 was determined by the very
strong inter-correlation of the seed and fruit dimensions, and the whole traits has been
pushed down because they are not correlated with dispersules and are less strongly
correlated with each other. The logistic regression analyses between whole plant and
dispersal traits highlights the association of H_max and PHE with anemochory (species
reaching a greater stature and deciduous tend to be wind dispersed) and the negative
association of H_max with zoochory (Table 2.7). WD was not strongly correlated with
any dispersal mode.
These results mean that deciduous species and/or species belonging to the higher
canopy stratum tend to be dispersed by wind and those tree species belonging to the
lower canopy stratums in contrast tend to be dispersed by animals. In contrast,
dispersule dimensions and dispersal mode are independent of wood density and its
implications for species strategies. These results suggest also that taller tree species tend
to have heaviest fruits and biggest seeds, meanwhile more deciduous tree species tend to
have bigger fruits.
Dispersal and leaf traits
At least one of the fruit and seed traits was significantly (p < 0.05) correlated
with each of the measured leaf traits (Table 2.4). Amongst the leaf traits largest number
of significant correlations occurred for LA (negatively with four), LCC (positively with
three), and LNC (positively with two). Amongst the fruit and seed traits the largest
number of significant correlations occurred for Mas Fru (three positive and two
negative); Sha Fru (two positive and one negative); and Vol Fru (one positive and one
negative). In general heavier fruits tended to occur in species with higher LCC, LDMC,
stronger leaves and lower LPC and SLA. The first two main axes for the PCA
combining dispersule and leaf traits explained 54% of the variability for the 20 tested
species (Figure 2.4). The first axis (CP1) was strongly significantly (p < 0.01) and
positively correlated with all four dispersule mass and volume traits and two leaf traits
(LDMC and LCC) (Table 2.5). The second axis (CP2) was significantly correlated (p <
0.01) with only fruit and seed shape. The explained species variability was increased to
67% and to 78% with the third and four main axes respectively (having also Eigen
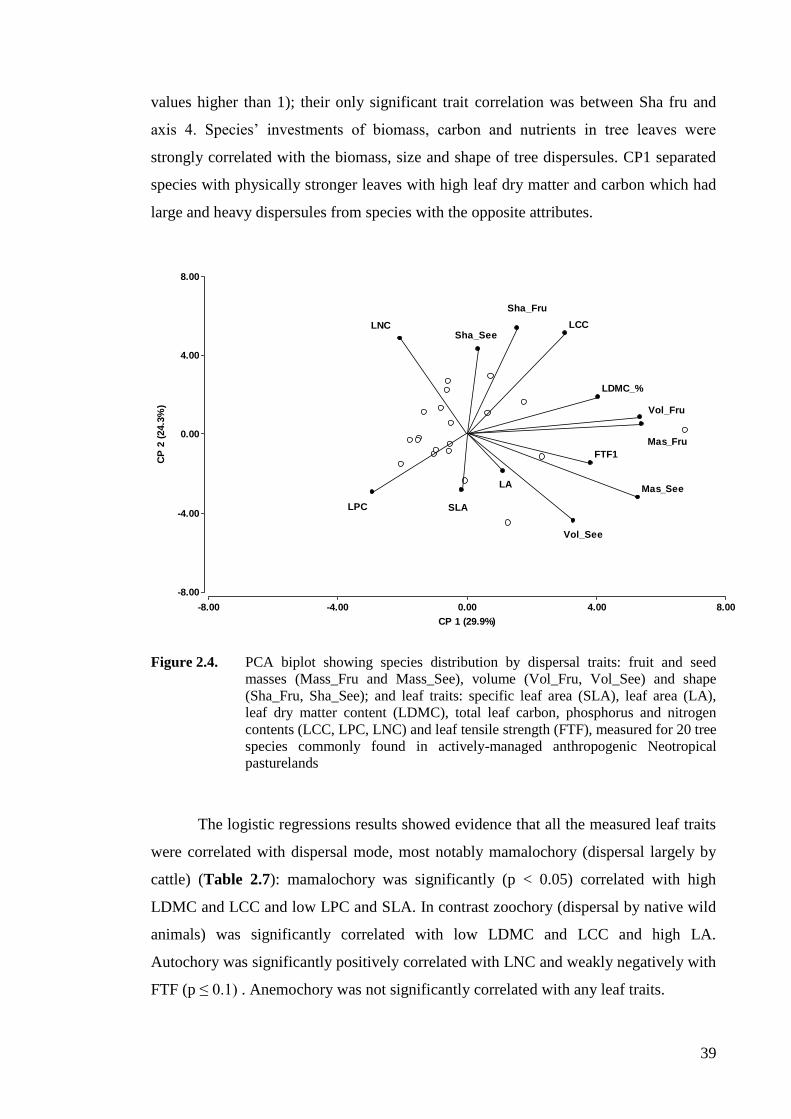
39
values higher than 1); their only significant trait correlation was between Sha fru and
axis 4. Species’ investments of biomass, carbon and nutrients in tree leaves were
strongly correlated with the biomass, size and shape of tree dispersules. CP1 separated
species with physically stronger leaves with high leaf dry matter and carbon which had
large and heavy dispersules from species with the opposite attributes.
Figure 2.4. PCA biplot showing species distribution by dispersal traits: fruit and seed
masses (Mass_Fru and Mass_See), volume (Vol_Fru, Vol_See) and shape
(Sha_Fru, Sha_See); and leaf traits: specific leaf area (SLA), leaf area (LA),
leaf dry matter content (LDMC), total leaf carbon, phosphorus and nitrogen
contents (LCC, LPC, LNC) and leaf tensile strength (FTF), measured for 20 tree
species commonly found in actively-managed anthropogenic Neotropical
pasturelands
The logistic regressions results showed evidence that all the measured leaf traits
were correlated with dispersal mode, most notably mamalochory (dispersal largely by
cattle) (Table 2.7): mamalochory was significantly (p < 0.05) correlated with high
LDMC and LCC and low LPC and SLA. In contrast zoochory (dispersal by native wild
animals) was significantly correlated with low LDMC and LCC and high LA.
Autochory was significantly positively correlated with LNC and weakly negatively with
FTF (p ≤ 0.1) . Anemochory was not significantly correlated with any leaf traits.
-8.00 -4.00 0.00 4.00 8.00
CP 1 (29.9%)
-8.00
-4.00
0.00
4.00
8.00
CP
2 (
24.3
%)
Sha_Fru
Mas_Fru
Sha_See
Mas_See
Vol_Fru
Vol_See
SLA
LA
LDMC_%
LCC
LPC
LNC
FTF1
Sha_Fru
Mas_Fru
Sha_See
Mas_See
Vol_Fru
Vol_See
SLA
LA
LDMC_%
LCC
LPC
LNC
FTF1

40
These results allow us to describe clearly LES associations with all dispersal
components. Tree species dispersed mainly by local animals had big leaves with a
reduced biomass and total carbon contents. In contrast tree species dispersed mainly by
big mammals i.e. cattle, had physically strongest leaves with higher dry matter and
carbon contents but with low N and P contents and a reduced specific leaf area. Tree
species with parental seed dispersion showed mainly higher amounts of N with a
reduced foliar strength. Finally, species with seed dispersed by wind tend to have leaves
with a higher phosphorus contents.
Whole plant, leaf and dispersal traits
The final PCA including all measured/literature-derived whole plant, leaf and
dispersule traits together was carried out for 25 tree species. The first two main axes
explain together just 36% of tree species variability (20% and 16% respectively), and
the third main axis (explaining 15%) increased the total to 51% and fourth, fifth and
sixth main axes explained a further 11%, 10% and 6% respectively. Therefore, the six
principal axes (having Eigen values higher than 1) together explain 78% of tree species
variability in the complete multivariate traits distribution.
Axis 1 was significantly (p < 0.01) correlated with five leaf and one dispersule
trait (Figure 2.5). It corresponds well with the LES being positively correlated with
LDMC, LCC and FTF and negatively with LPC and SLA, while also being positively
correlated with Mas fru. The second axis was more related to dispersule shape
(significantly positive with longer seeds and fruits) as well as LNC and evergreen
phenology. The third axis was very significantly (P < 0.001) positively correlated with
H_max and negatively with SLA; it was also significantly (P < 0.05) positively
correlated with LDMC and weakly (p = 0.05) positively correlated with long fruit. Axis
four was significantly (p < 0.05) correlated with deciduousness and large fruit but
negatively with WD. Axis five was positively correlated with LA and negatively with
seed mass. LPC was the only trait significantly correlated with axis 6.
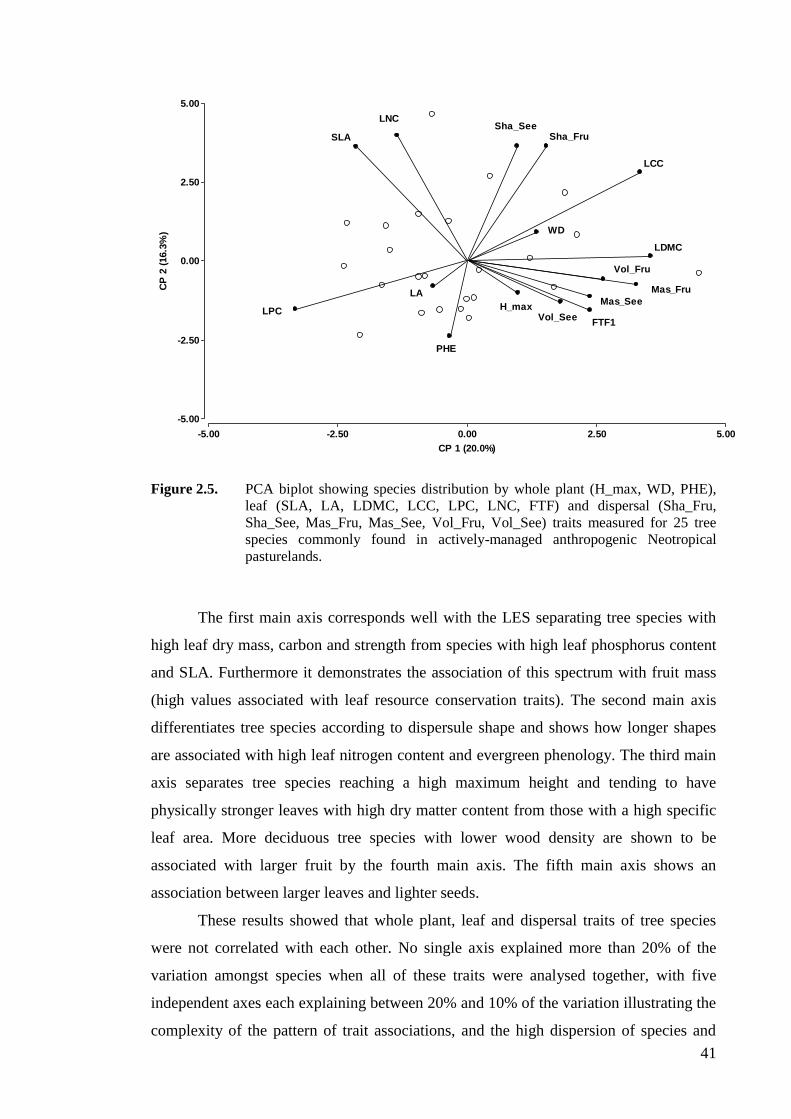
41
Figure 2.5. PCA biplot showing species distribution by whole plant (H_max, WD, PHE),
leaf (SLA, LA, LDMC, LCC, LPC, LNC, FTF) and dispersal (Sha_Fru,
Sha_See, Mas_Fru, Mas_See, Vol_Fru, Vol_See) traits measured for 25 tree
species commonly found in actively-managed anthropogenic Neotropical
pasturelands.
The first main axis corresponds well with the LES separating tree species with
high leaf dry mass, carbon and strength from species with high leaf phosphorus content
and SLA. Furthermore it demonstrates the association of this spectrum with fruit mass
(high values associated with leaf resource conservation traits). The second main axis
differentiates tree species according to dispersule shape and shows how longer shapes
are associated with high leaf nitrogen content and evergreen phenology. The third main
axis separates tree species reaching a high maximum height and tending to have
physically stronger leaves with high dry matter content from those with a high specific
leaf area. More deciduous tree species with lower wood density are shown to be
associated with larger fruit by the fourth main axis. The fifth main axis shows an
association between larger leaves and lighter seeds.
These results showed that whole plant, leaf and dispersal traits of tree species
were not correlated with each other. No single axis explained more than 20% of the
variation amongst species when all of these traits were analysed together, with five
independent axes each explaining between 20% and 10% of the variation illustrating the
complexity of the pattern of trait associations, and the high dispersion of species and
-5.00 -2.50 0.00 2.50 5.00
CP 1 (20.0%)
-5.00
-2.50
0.00
2.50
5.00
CP
2 (
16.3
%)
Sha_Fru
Mas_Fru
Sha_See
Mas_See
Vol_Fru
Vol_See
WD
PHE
LCC
LPC
LNC
H_max
SLA
LA
LDMC
FTF1
Sha_Fru
Mas_Fru
Sha_See
Mas_See
Vol_Fru
Vol_See
WD
PHE
LCC
LPC
LNC
H_max
SLA
LA
LDMC
FTF1
42
trait vectors within this multivariate space with no tendency for them to form tightly-
defined “functional groups”.
2.5 DISCUSSION
Whole plant traits
As expected WD was not related to H max. PHE was positively correlated to H
max and negatively to WD.
We didn’t find any relationship between H max and WD meaning that taller and
shorter species can develop similar wood densities. Taller tree species in this
community (H max > 32m) like Cedrela odorata, Ceiba pentandra have indeed low
wood densities (WD<0,46 g/cm3) and species belonging to the lower canopy stratum (H
max < 19 m) like Pithecelloboum dulce and Lonchocarpus parviflorum have some of
the highest WD (WD > 0,69), but there were also other considerable number of other
low stratum species like Coclospermum vitifolium and Erythrina berteroana which also
share the low wood densities observed in the taller species. As suggested by Poorter and
Bongers (2006) for all Hmax values, a range of strategies across the acquisitive-
conservative spectrum are viable.
Our results show also that phenology, measured as the number of months tree
canopy has a leaf cover under 50%, was negatively correlated with WD. This means
that deciduous species, like Ceiba pentandra and Pachira quinata which can be
considered drought avoiders (Marharjan et al. 2011), were taller and have softer woods
than the evergreen species, instead those species reducing the canopy cover under 50%
by less than one month, which can be then consider drougth-tolerants, like Casearia
sylvestris and Mutingia calabura, were mainly characterized by low heights and hard
woods.
Such correlations between PHE - WD and PHE - H max have been explained by
previous studies according to tradeoffs between investments in water balance, in light
requirements and in growth rates. The lack of significance between WD and H max can
be related to the presence of diverse phenological status. Poorter (2008) hypothesized
that wood fraction (in relation to gas and water fractions in tree stems) decreases with
higher light requirements and adult stature of tree species, although he found such
tendency for shaded tolerant species (significant negative) but not for pioneer species
(relation that tend to be positive) due to the replacements of short lived species with low

43
wood densities to quickly reach their maturity height to complete their life cycle , by
taller, less light demanding but longer lived pioneers with higher WD to persist more
long time. We found a significant negative correlation between WD and H max when
just the more deciduous species were included in the analyses. Instead, a non-significant
correlation was found again between WD – H max for “quick” deciduous (species with
no more than 2 months with a reduced tree canopy) and evergreen species (species
performing a complete leaf renewal in less than one month or performing continuous
leaf renewals through the year). This implies that deciduousness and a low wood density
are in fact an strategy for overcoming the higher drought stress and the higher cavitation
risk faced by tall trees, probably in addition to wood density association with hydraulic
traits (Poorter et al. 2010 Maharjan et al. 2011). In contrast, evergreen species have high
wood densities and lower adults’ stature, but these do not present linear relationship
inside the observed range of heights and wood densities for evergreen species.
Therefore, evergreen species might have developed additional morphological and
physiological strategies to overcome water stress which do not necessarily compromise
adult stature either and wood density tradeoffs.
Associations between WD – PHE – H max in open pasture sites seem be
reflecting also differences in growth rates, although no formal analyses has been
performed here to test this hypotheses. The taller species with low WD for example
were extremely-deciduous species (between 4 and 6 months with a reduce leaf canopy
cover) with relatively faster growth rates (Cedrela odorata increase 0,13 cm in dbh
periodic annual increments - PAI) and can be considered long lived pioneers and
drought-avoiders. The lower species with high WD like L. parviflorum and P. guajava
were evergreen to moderate deciduous species (with no more than one month with a
reduce leaf canopy cover) with lower growth rates (DAP increases in 0,06 and 0,07
PAI) and could be considered then shade and drought tolerants. The lower species but
with low WD like C. vitifolium and E. berteroana were highly variable in phenology
(between extremely deciduous to evergreen species) with a high light requirements but
reach maturity faster with higher growing rates (dap increase 1,66 and 0,95 cm PAI
respectively) (short-lived pioneers).
Temporal, vertical or horizontal variation in light levels does not strongly affect
tree growth in dry forests (Fowler 1989; Nath et al. 2006). No previous studies have
evaluated the correlations between these vegetative traits for tree species outside
forests-stand conditions. Probably light requirement is not the most important factor to

44
model relationships between WD and H max in dry seasonal sites. Variability in water
availability, which may vary strongly among years (Bullock 1997) and have important
consequences for tree growth (Brienen et al. 2010) could be a more influential factor in
a strong-light environment. This could be observed in the resulting axes from PCA. The
drought resistance by tolerance or avoidance seems to be driving the expressions of WD
and H max and its relationships in tree communities under water stress conditions.
Outside the forest cover, in open pasture conditions the ability to survive in water-stress
conditions could determine survival and maintenance of viable populations. Therefore,
we should not expect to find a strong negative relation between H max and wood
densities in tree community, mainly because tree forest species surviving here will be
those well adapted to tolerate water stress thanks to several different strategies beyond
the tree height – wood density tradeoffs.
Leaf traits
PHE was positively correlated to LPC, negatively to FTF and LDMC but not
related to SLA. SLA was positively correlated to LNC but not to LPC. SLA was also
negatively correlated to FTF and LDMC. It was hypothetized that LPC will be
positively correlated to PHE; LPC and LNC positively correlated to PHE and
negative to SLA.
Phenology was positively correlated to LPC as found by Marharjan (2011) but
we didn’t find any relationship between phenology and SLA, contrary to Leaf Economy
Spectrum expectations. PHE was in addition negatively correlated to LTS, although no
correlation was found either with LA, LCC or LDMC. Therefore deciduous species
were characterized by high leaf phosphorus contents and a reduction of leaf tensile
strength. This result suggests that deciduous species could be effectively reducing water
loss via stomata due to the higher P content, which affect CO2 concentrations and
reduce water loss (Wright et al. 2001) but without implying an expected higher
efficiency in light use reflected in high rates of photosynthesis and respiration expressed
by a low SLA and high LNC. This observation could imply that deciduous species must
have alternative morphological or physiological strategies to overcome the expected
higher photosynthetic efficiency. The reduced WD could allow deciduous and the
higher P content in leaves, could be an adequate strategy to overcome the water-
economy tradeoff, without compromising a higher range in SLA values. Deciduous
species probably have a higher vessel density and to store high amounts of water in

45
wood tissues and the high P levels in leaf tissues increase the CO2 gradients reducing
stomata water loss during the wet season. Leaf abscission in dry season must be
reducing risks in water economy due to the higher range of SLA observed for these
species.
Evergreen species in contrast tend to have a small P content in leaf and a high
LTS consistent with a conservative strategy. However, the lack of significance between
PHE and SLA remains unclear for evergreen species which have no clear adaptation to
water stress in wood tissues. Could the lack of correlations between LPN and PHE to
SLA be reflecting the high variability of SLA values found for the whole species
community with different PHE status? When correlation between LPC and SLA was
partitioned by PHE status, a significant positive correlation between SLA – LPC was
observed just for the more evergreen species (those with up to 3 months in reduced
canopy cover) and no significant correlation was found for the more deciduous species
(between 4 and 6 months with a reduce canopy cover). Therefore, evergreen species
will have low LPC with respect to deciduous species, but the SLA will decrease with
LPC inside this reduced range of phosphorus content for evergreens. This positive
correlation between nutrients and SLA has been explained by a larger fraction of
support structures in thicker and denser leaves that possess a lower SLA, and the
reduced requirement for mineral nutrients for construction of foliage with low SLA
(Niinemets and Kull 1998; Niinemets 1999). This observation goes in line with previous
studies expecting that nutrient contents traits as major contributors to the acquisitive-
conservative leaf traits spectrum (Díaz et al. 2004) increased with a reduce leaf carbon
resources allocations, expressed here in a negatively correlation to LTS, and have a
more efficient light capture per unit leaf mass because of their high SLA (Marharjan
2011), except that this strategy in outside tree communities apply just to more evergreen
species.
LNC was not correlated to LPC. LPC and LNC were negatively correlated to
LDMC. LPC is positively correlated to PHE but negatively to LCC and FTF. LNC is
positively correlated to SLA and FTF but negatively to LA. We expect that LPC and
LNC were negatively or positively correlated to SLA but negative to LDMC, LCC and
FTF.
In comparison to LES (Wright et al. 2004) our results showed that leaf
phosphorus and nitrogen content do not co-vary equally with changes in leaf dry matter
investment by area unit or either positively to leaf span related traits like phenology.
46
LNC was positively correlated to SLA and no association was found with PHE. Instead
as expected, LPC was positively correlated PHE, but not correlated to SLA. In addition
to LES Wright (2004) defined mostly by nutrients concentrations and SLA, our results
showed also that LPC, LNC and SLA were correlated independently to other leaf traits
like LDMC, LCC, LA and FTF. LNC was negatively correlated to LA in addition to its
positive correlation to SLA. Instead LPC was negatively correlated to LCC in addition
to its positive relation to PHE. Both nutrient contents in addition to SLA were also
inversely correlated to FTF: LNC were positivity instead LPC and SLA were negatively
correlated to FTF.
This result means that, species with a high investment of dry matter in the
construction of a functional leaf unit (independently of the area) will in fact produce
leaves with low content of phosphorus and nitrogen as expected, but both nutrients must
be related to different physiological mechanisms reflecting in their independent
variability to other leaf traits. Leaf nitrogen content is low in big leaves and in leaf with
a higher investment in dry matter content, but increase together with specific leaf area
implying a low efficiency in leaf construction, i.e. a higher dry matter required to
construct a determinates leaf area. The positive correlation between nutrients and SLA
has been explained by a larger fraction of support structures in thicker and denser leaves
that possess a lower SLA, and the reduced requirement for mineral nutrients for
construction of foliage with low SLA (Niinemets and Kull 1998; Niinemets 1999).
Additionally, higher N content is positively correlated to Amass (net maximum
photosynthetic rate per unit mass). LNC increases with FTF, implying that plant
resources investment in defense structures against physical damage increase when
nitrogen content in leaves also increase, an important feature in systems with a high
herbivore rate like active pasturelands. Leguminous species, those expected to have the
higher levels on nitrogen in leaves will consequently be expected to have strongest
leaves reflected in a reduced herbivory rates which could be reflecting also a reduced
decomposition rates.
The phosphorus contents in contrast, increases with PHE, do not vary linearly
with specific leaf area but decrease with higher overall leaf dry matter content and
higher structural carbon inversions for leaf construction. This means that higher
phosphorus content are found in deciduous species with a reduced carbon invested in
structural and overall leaf construction and in leaf defense structures. This result goes in
line with previous observations where LPC has been found also to decrease significantly
47
to increasing rain fall (Marharjan 2011) and positively correlated to hydraulic related
traits like PHE and negatively with LDMC, LCC and FTF as LPC is a major contributor
to the acquisitive-conservative leaf traits spectrum (Díaz et al. 2004). A higher LPC
content in deciduous species and associated traits goes also in line with previous
observations of a positive relation with litter decomposition rate (Prajjwal et al. 2011).
LA was negatively correlated to LCC and LNC. We expected that LA was
positive/negative correlated to H max, WD, LPC, LNC, SLA, LDMC and LCC.
LA relationships with leaf and stem economics spectra are not so clear. Some
authors have observed strong correlations between LA and SLA that could be positive
or negative (Niinemets 1998, Shipley 1995) instead was not included into leaf spectrum
reviews (Wright et al. 2004). It has been hypothesized that dense woods could support
bigger leaves due to a greater biomechanical strength (Niklas 1995) and increased
cavitation resistance (Hacke and Sperry 2001). However, Baraloto et al. (2010)
highlighted in addition that the higher construction costs associated to denser woods
could also favour smaller leaves presence (Hacke and Sperry 2001; Pickup et al. 2005;
Wright et al. 2007).
Our results cannot deny or support hypotheses about direct relationships
between WD and LA, or between WD and SLA but instead we found indirect
relationships between WD, LDMC, LCC, SLA and LA. WD was positively correlated
to LDMC, and SLA and LA were negatively correlated to LDMC and LCC
respectively. Therefore in this system, species with more resources inversion in wood
construction invest also more on overall leaf construction, including structural and
functional leaf components. This species with costly overall leaf constructions (high
LDMC) mainly reduce the overall resources invested by leaf area (low SLA) to produce
cheapest leaves no matter what leaf area produced. Instead, increases in leaf area were
directly reflecting reduction in structural leaf construction (low LCC) but not
necessarily in overall construction costs (LDMC), no matter these last two carbon leaf
measurements also positively co-varied. Unless, we can indirectly relate increases in
construction costs of wood tissue to reduced LA, our results underlined two additional
relations: i) LA and SLA could be decoupled from STS (at least were not directly
correlated to WD) but not from LES, being correlated to LCC and LDMC respectively,
and therefore ii) the importance of a fine partitioning in the measurements of
construction components is required, like LDMC and LCC, to understand in detail the
acquisitive and conservative leaf or wood spectrums. Our results about coordinated
48
tissue investments in leaves and wood support the hypothesis that allocation strategies
of cheap or expensive tissues occurring to a whole plant level result in synchronized
construction costs of leaf and stem tissues (Grime et al., 1997 in Bartolo, 2010).
We should emphasize here that WD is independent from LA and SLA.
Therefore a high or low dry matter inversion in wood (WD) did not imply a determinate
direction in LA or SLA variability. These traits were definitely linked closely to C
resources inversions and construction costs in both important plant organs, but many
different structural or physiological strategies could be available to avoid water or light
stress in leaves, and even tissue damage or lost by herbivores, independently on mature
leaf area expression or the dry matter ratio inversion in leaf and woods.
In contrast to Bartolo et al. (2010) we observed that LA was associated to LES
but decoupled from SES maybe responding to his suggested prediction of a higher
association between LA to LES in sites with a lower rainfall. But a decoupling of LA
from FTF was also observed in this tree community no matter the higher risk of tissue
damage by herbivores in the studied system, contrary to his second prediction of a
reduce advantages of a tougher tissue with an increasing laminar size. In contrast to
Bartolo et al. (2010), we found that larger slight and cheap leaves related to soft woods
are also a plausible life vegetative strategy.
Relationships between leaf and vegetative traits of Neotropical tree species
Our results evidence an interesting story about the structure of interactions
between two important plant species variability dimensions like those expressed by
whole plant and leaf traits. Deciduous species are predicted to have acquisitive leaves to
maximize photosynthetic production during their short lives, while evergreen species
should have conservative leaves, partly in order to tolerate the dry season.
Contrary to the decoupled wood density hypothesis about WD being orthogonal
to all the leaf traits, WD was correlated to other leaf and vegetative traits. WD was
negatively correlated to PHE and positively to LDMC and FTF, but not correlated to
SLA as expected for some authors (Wrigth et al. 2006). Therefore, species with dense
woods are evergreen species with high amounts of dry matter content for overall leaf
construction represented also in strong tensile force. Instead, deciduous species with
low densities will have a low dry matter content invested in overall leaf construction
and reflected also a low capacity to resist physical damage. WD has been correlated to
water economy and resistance to damage and could be the driving factor for the

49
observed tendencies in open pasture sites, where deciduous species escape to drought
stress reducing water loss through leaves and probably storing water in wood. In
contrast, the evergreen species will have to invest higher amounts of dry matter
resources in their leaves to avoid water loss and resist herbivore damage to leaves when
no water is being probably stored in wood at the same time that a hard wood could
make them resist the higher herbivores visits during dry seasons.
In contrast we found that not single trait was unrelated indicating orthogonality
of the ecological strategy dimensions represented i.e leaf, vegetative and dispersion. All
leaf traits measured were correlated to other traits belonging to the same leaf dimension
but also to traits belonging to one or two of the additional dimensions represented by
vegetative and/or dispersal traits. LA and LNC were correlated to dispersal traits like
Fru Sha, instead LCC was correlated also to SeeSha and FruMass. LDMC was the only
leaf trait correlated to a vegetative trait i.e. WD in addition its correlations to other leaf
traits but without being also correlated to any trait in the dispersal dimension. In
contrast, SLA, LPC and FTF were leaf traits correlated to vegetative and at the same
time to dispersal dimensions’ traits. SLA was correlated to H max and to Mass_fru;
LPC was correlated to PHE and to Sha_fru, Sha_see and Mass_see; finally FTF was
correlated to WD and PHE in addition to Mass_fru and Mass_see.
Dispersal traits
Biggest, heaviest and large fruits do not have small, lighter or spherical seeds
All measured dispersal traits (fruit and seed mass, volume and shapes) were
correlated between each other indicating mainly the absence of a triangular relationship
between fruit and seed traits. Fruit volume, mass and shape were strongly correlated to
seed traits implying that biggest, heaviest and longest fruits carry the biggest, heaviest
and longest seeds. Our results do not support the expectation of a ‘triangular’
relationship between seed and fruit size due to physical constraint which determine that
seeds cannot be bigger than fruits and imply that large-fruited species could have a wide
range of seed sizes whereas small-fruited species should have small seeds only (Wright
et al. 2007). The positive correlation found between fruit volume and seed volume
indicates that biggest fruit with smallest seeds was not a successful strategy within this
tree community. In addition to Wright et al. (2007) observations about the tight
correlations between fruit and seed volume, we observed also that fruit and seed masses
plus fruit and seed shapes were also strongly correlated (r values were 0,80, 0,39 and
50
0,47 respectively). Therefore, biggest, heaviest and longest fruits have biggest, heaviest
and longest fruits seeds although biggest, heaviest and longest fruit could anatomically
carry smallest, lighter and more spherical seeds. These results implied that strong
functional relations in addition to mechanical constraints determine together fruits and
seed morphology, supporting the idea that coordination of life-history traits together
with the mechanical constraints define better the relationships between fruit and seed
size as suggested by Moles et al. (2005).
Biggest fruits and heaviest fruits have bigger and heaviest seeds with the higher
biomass investments.
The strong positive correlations between fruit and seed volume and masses
implied also a coordinated plant investment on dispersal structures with big and heaviest
fruits carrying also biggest and heaviest seeds. These correlations mean also that trees
make similar inversions i.e. highest or lowest, on both dispersal structures and on
parental provisioning granted for offspring establishment. In fact, we observed in
addition to the very obvious finding that volume and mass were also tightly correlated,
also the less obvious findings that i) fruit and seed masses were correlated and that ii)
fruit volume was tightly correlated with the whole seed morphology (mass, volume and
shape). Fruit volume association with seed morphology and fruit and seed mass
correlations suggests that trees develop a coordinated strategy to allocate more or less
resources to the whole dispersal structures and not just to seed volume. Large-seeded
tree species have higher survival through early seedling establishment than small-seeded
species (Moles and Westoby 2004). According with the highest investments on seed,
more expensive investment on fruits structures should also represent an inherent benefit
in the dispersal process. Bigger and heaviest fruit and seeds probably follow a particular
dispersal mode that increases probabilities to reach a higher number of safe places for
the specie, where once arrived bigger no matter their lowest production, bigger seeds
will have an increased survivorship in contrast to the higher production of smallest
seeds.
Tree investments on dispersal traits are coordinated with dispersal mode
Previous studies have mentioned correlations between seed mass with dispersal
modes (Westoby et al. 1996) but a complete characterization of fruits and seeds traits by
dispersal mode are uncommon. Fruits and seeds of tropical tree species vary widely in
their size and morphology and are dispersed by a broad array of dispersal agents (Levey

51
et al. 1994; Muller-Landau and Hardesty 2005). Seed dispersal patterns depend on the
interaction between the local frugivore communities with the plant attributes that
influence attractiveness to dispersers, or with plant attributes which affect the final
deposition of seeds in the case non animal assisted dispersion. The majority of studies
have been focused on relationships between seed mass or seed production with
dispersed distances from parental trees or with height of parental tree (Moles et al. 2004,
2008), the relationships between seed mass with other dispersal traits and with different
dispersal modes has paradoxically receive less attention. The magnitude and spatial
distribution of seed rain clumping and in any bias in where the seed arrives in a
determinate habitat is at least as important as the maternal resources (Muller-Landau
and Hardesty 2005) and are necessary in order to understand if the different paths that
tree species follows in a community achieve or not a more successful regeneration.
We have found that in addition to seed mass other seed and fruits traits have a
stronger functional correlation with dispersal modes. Fruit and seed volume, mass and
shape were correlated with the main dispersal modes of tree species commonly found in
active pasturelands. In fact not one dispersal trait was correlated to all the main
dispersal traits within this community, rather different fruit and seed traits were more
strongly correlated to one dispersal mode than to another, explaining impossibility to
predict dispersal modes based in a unique dispersal trait like seed mass. The strongest
and more abundant relationships were found between fruit and seed shapes, fruit
volume and masses with zoochory and mammalochory followed by fruit shape and seed
masses with anemochory and with autochory, reflect the higher proportion of species
dispersed by biotic agents in tropical lands. Tree species dispersed by local fauna
showed the more rounded, smallest and lighter fruits carrying also the most rounded
seeds. In contrast, tree species dispersed by big non-volant mammals’ i.e cattle, have the
biggest and heaviest fruits carrying the heaviest seeds. Tree species dispersed by wind
have the lighter seeds and the longest fruits. Those trees with unassisted dispersion tend
to have longest fruits, but were not correlated to fruits or seed masses.
The facts that fruit volume was related with all seed morphology and that seed
mass together with other seed and fruit traits were correlated with particular dispersal
modes imply that tree species balance the highest investments on dispersal structures
and maternal resources to offspring’s during dispersal process, even previous to
germination or early growing stages. Therefore, biggest fruits have the highest
probabilities to be heaviest and longest ones and also the highest probabilities to have

52
the longest, heaviest and bigger seeds (independently of the number of seeds by fruit)
and to be dispersed by big mammals which determine seed spatial distribution
increasing or reducing their inherent probabilities to survive. Similar observations about
selective consumption driving big and heaviest fruit and seed has been found in tree
species dispersed by large mammals in Africa and South America (Janzen and Martin
1982). Smallest fruits had the higher probabilities to be spherical and lighter carrying
also spherical fruits and being dispersed by local fauna like birds and bats. The
consumption of fleshy fruits by frugivorous animals has been reported to affect the
maximum mean fruit size for some plants, particularly the relationship between fruit
size and gape width determines whether or not the fruit can be swallowed by some bird
species (Jordano 1987). Endo-zoochorous dispersing birds can be expected to optimize
their energy intake through fruit selection and hence exert a positive selection even with
fruit content as their reward, translating this selection to seed morphology, that is to say,
favoring big enough fruits with small enough and easy swallowed seeds (Sobral et al.
2010). The time seeds remain passing through dispersers´ systems and therefore the
dispersal distances vary according to animal and seed size. Instead, rather longest fruits
tend to have lighter seeds dispersed by wind or by the same parental tree. The different
dispersal vectors caring big or small seeds define the distribution of seed rain for both
seed sizes (Muller-Landau and Hardesty 2005).
Tree species with more expensive fruits and seeds correlate with dispersal modes
with a more dispersal effectiveness i.e a higher probability to colonize a safety place to
establish successfully new offsprings. There is wide variation in patterns of primary
seed rain among tropical tree species (Gentry 1982). Seed dispersal mode did explain
significant variation in seed rain clumping: animal-dispersed species showed higher
clumping of seed deposition that wind or autochorus dispersed species unless did not
explain significant variation in seed dispersal distances due mainly to the high
variability within species with the same dispersal mode (Muller-Landau et al. 2008).
Substantial proportions of interspecific variation in seed production, seed dispersal
distances, and clumping of seed deposition has been found to be explained by relatively
easily measured plant traits, especially dispersal mode, seed mass, and tree height
(Muller-Landau et al. 2008). In consequence, dispersal modes with a higher clumping
distribution of biggest seeds away enough the parental trees but directed to specific
favorable habitats, like has been observed commonly for endozoochoruous dispersion
by nonvolant mammals, could increase seed survival and dispersion fitness to

53
compensate the costly fruit and seed and their low production. In contrast, tree species
with lighter seeds and/or fruits having a relatively lower construction cost expressed
mainly by lighter seeds and not so heavy fruits, were correlated with dispersal modes
with a less specific seed dispersal distributions commonly exhibited by abiotic vectors
like wind or by the non-assisted dispersion like ballistically or explosive fruits, reducing
the probabilities to reach safe places for survival increasing seed mortality but
compensated by an abundant seed production.
The fact that seed mass and fruit mass were related to each other supports the
idea about a coordinated investment of resources for dispersal structures compensate by
a more effective dispersal mode. However not only fruit and mass shape were correlated
with dispersal modes, rather a specific combination of dispersule volume, mass and
shape were correlated to the main dispersal modes identify for this tree community,
according with the stated dispersal syndromes idea. As a whole, more expensive
dispersule constructions have more focal dispersal modes, meanwhile lower cost
dispersule constructions have more dispersal modes with a resulting wider scope,
confirming again the initial idea about tree investment on dispersal traits coordinated
with other stages of tree life history. In this tree community fruit volume can be
considered a relatively easy measurable and good indicator of tree investment on
dipersule structures due to its strong correlations with other fruit characteristics and with
the whole seed morphology (volume, mass and shape).
Fruit and seed volume and mass were orthogonal with fruit and seed shape
Fruit and seed shape co-varied independently from fruit and seed volume and
masses suggesting that changes in fruit and seed shape could be responding to different
selective forces than those operating for dispersal masses and volume. Although fruit
and seed shape were strongly correlated between each other, neither fruit or seed shape
were correlated with seed volume or mass, meanwhile seed shape was indeed correlated
with fruit morphology. This lack of association between seed shape and seed volume
and mass, and its strong correlation with fruit shape imply that seed shape could be an
independent dimension of tree natural history nevertheless their correlation with fruit
and seed masses and with dispersal modes. In fact, the multivariate analyses confirm
these observations from the cross species correlations, showing that fruit and seed
volume and mass were correlated with the main principal component and instead fruit
and seed shape were mainly correlated to the second and orthogonal axes.
54
Seed shape could be responding to additional selective forces related with tree
reproductive stages further to dispersule production and dispersion, like seed dispersal
and seed incorporation to soil seed banks. Fruit shape was correlated with fruit volume
and mass and strongly correlated with seed shape, meanwhile seed shape was not
correlated either with seed mass nor volume. The first PCA separates two orthogonal
axes the first for mass and volume and the second for shape. This implies that dispersal
shape was not subjected to the same co-variability observed for seed and fruit masses
and volume. Seed size and shape predict seed persistence in the soil for British and
Argentinian herbaceous plant species (Thompson et al. 1993, 1994, Funes et al. 1999).
Those species with small, rounded seeds tend to have persistent seeds while those with
larger, more elongate or flattened seeds usually lack persistence. Ease of burial, as
small, rounded seeds are incorporated into the soil more easily than large, elongated or
flattened seeds and are therefore less likely to be eaten by seed predators determining
seed longevity. However, species with large and/or elongate or flattened persistent seeds
were relatively common as well as small and rounded persistent seeds in New Zealand
and in Australia (Leishman and Westoby 1998, Moles et al. 2000). Moles et al. (2000)
suggest that species with small, rounded seeds cannot help but be incorporated into the
soil, and are only ecologically viable if they have the ability to persist until such time as
a disturbance event brings them back to the surface. A possible relationship between
seed size, shape and immediate germination was proposed by Moles et al. (2000) as a
functional relation underlaying the size and shape variability and persistence.
Seed mass has been found positively correlated with time to seedling emergence,
and negative with time between emergence and production of the first true leaf, but not
with seedling establishment probably due to many stochastic factors affecting seedling
establishment during any given recruitment episode at any given site. Seed mass was
not related with cause of death, but 57% were killed by herbivory and 21% % were
killed by drought (Moles and Westoby 2004). Rapid germination can be advantageous
in environments where favourable conditions for seedling establishment are short-lived.
Early leaf production might also be important in determining the outcome of
competitive interactions between large and small seedlings, through their effects on the
size of seedlings at encounter. Small-seeded species have an initial advantage over
large-seeded species, as the number of seeds a plant can produce for a given amount of
reproductive effort is negatively related to seed size. But biggest seeds will compensate
55
by seedling establishment due to more resources but also for a higher probability to
reach safety places according with dispersal mode.
The biggest investments does in seeds and fruits for a dispersal mode that
maximizes the probability to find safety places for germination probably to pay off by a
higher seedling establishment due to the highest resources invested in dispersal.
Correlations between fruit and seed masses with dispersal modes could probably
evidence a plant strategy to assure a successful colonization and natural regeneration
through new open areas like open pasturelands. This reproductive investment in
dispersion strategies can be related also with tradeoffs among biomass resources
allocation to other plant structures like leaf or whole plant traits related with further
growing and survival within the colonized environment.
Lighter but not small seed species have abiotic dispersal vectors
Our results also support previous observations related with the higher abundance
of vertebrate seed dispersal agents in tropical ecosystems that might have allowed
tropical species to radiate into larger seed masses than was possible for species growing
in the temperate zone, where the predominantly abiotic dispersal agents might favor
small seeds (Lord et al. 1997). Half of the tree species (49%) were mainly dispersed by
local animals (zoochory) which in addition to those tree species particularly attractive
for cattle consumption (15%), due to woody fruits but filled with oleaginous substances
(mammalochory), make of endozoochorous the most common dispersion mode. Just
19% was observed for those tree species using wind as dispersal vector (anemochory)
while the resting 17% have unassisted dispersion mode (autochory). In contrast to wind
dispersed seeds, the three species dispersed by cattle were also correlated with seed
mass, having the biggest seeds.
In contrast with previous empirical data (Leishman et al., 1995) our results
confirm that species with wind dispersal have lighter but not smaller seeds than species
with animal dispersal. The statement that small seed species have abiotic dispersal
vectors has been widely accepted without making a clear differentiation among seed
mass and seed volume. Accordingly to this perception we found that seed volume and
seed mass were positively correlated, but in contrast to the previous statement we also
found that seed mass was correlated to dispersal modes like anemochory and zoochory,
meanwhile seed volume was the only seed trait not associated with any dispersal mode.
These results imply that dispersal mode cannot be predicted only by seed size probably
due to a huge range in seed size amongst wind dispersed species, as indeed there is too

56
amongst animal dispersed species. More detail should be take into account to
distinguish seeds that are consumed within fruit and pass through animals guts (which
limits their size) versus those seeds dispersed by wind which could have a bigger
volume but must be lighter or even can be heavier than some of the endo-zoochorous
dispersed by local fauna but have aerodynamic adaptations i.e. wings.
Tree investments on dispersal traits are coordinated with other stages of
tree life history
Dispersal traits and modes were correlated with whole plant traits
Whole plant traits and dispersal traits were strongly correlated with dispersal
modes meanwhile tree maximum height and leaf phenology were marginally correlated
with fruit mass and seed and fruits volume. These results showed that tree investments
in dispersal structures were also correlated with tree investments in other stages of tree
life history like growth rate, defense against physical damages and tolerance to drought,
expressed by the variability of H_max, WD and PHE. The strongest associations
between whole plant traits and dispersal traits change for each dispersal mode,
indicating that the tradeoff between plant resources allocated to dispersal or to other
plant structures were not independent from tree strategy assumed during dispersion.
Maximum tree height was correlated with anemochory and zoochory but not with
autochory or mammalochory. Wood density was only correlated with autochory and
leaf phenology was only correlated with anemochory. Instead, fruit shape was
correlated with anemochory, autochory and zoochory but not with mamalochory. Fruits
mass and volume were mainly correlated with mammalochory and zoochory, instead
seed mass and shape were only correlated with anemochory and zoochory.
Independently of tree dispersal mode, taller tree species just tend to have heaviest fruits
and biggest seeds, instead more deciduous tree species tend to have biggest fruits. These
results indicate that in order to understand the implication of whole plant and dispersal
traits correlations the dispersal mode is a relevant condition that has been manly
neglected by so many cross species relationships studies.
The observed associations between whole plant traits with dispersal modes and
fruit and seed traits indicate that tree maximum height, leaf phenology and wood density
were components not isolated from reproductive fitness, rather were articulated by
dispersal modes with strongest associations with fruits and seed morphology. Ours
results show up for example that relationships between plant height and fruit and seed
57
morphology co-varied at different levels within each dispersal modes to define tree life
strategies. Seed mass and tree height do not co-vary in similar strength by each dispersal
mode. Seed mass and tree height were correlated with tree species dispersal by wind;
meanwhile only seed size, but not tree maximum height were correlated with tree
species dispersed by big non-volant mammals. In contrast, tree height but not seed
mass, was correlated with dispersion by local fauna; meanwhile either tree height or
seed mass were correlated with non-assisted dispersion. These differences of
correlations between tree height and seed size by dispersal show up the variability that
tree species have in life styles to deal with dispersal success integrating other stages of
tree life history with fruits and seed characteristics. Similarly in a large-scale, cross-
species quantification about correlations between dispersal distance and both seed mass
and plant height, Thompson et al. (2011) showed that seed mass was positively related
to mean dispersal distance, that plant height had substantially stronger explanatory
power than did seed mass but also that the relationship between seed mass with
dispersal distance was not significant within dispersal modes. As suggested by
Thompson (2011) this lack of relationships between seed mass and dispersal distance
could be because species adjust their investment in energetic rewards for dispersers or
dispersal structures (primary or secondary) to increase dispersal distances, depending
not only in seed mass. In addition, as observed in our results, plant resources
investments in dispersal structures and the resulted tradeoffs between dispersal and
whole plant traits changed according with each dispersion strategy.
In fact, four clear tree species morphological and functional strategies come out
from these whole plant and dispersal traits associations. 1) Taller and more deciduous
trees species have wind dispersed seeds, having biggest, longest and heaviest fruits with
biggest, longest but lighter seeds. 2) Smallest tree species were dispersed by local fauna,
having smallest, lighter and more spherical fruits caring more smallest and rounded
seeds. 3) Tree species with non-assisted or parental seed dispersion have longest fruits,
dense woods (direct correlations), more evergreen canopies and heaviest seeds (indirect
correlations). Finally, 4) tree species dispersed by non-volant mammals were not
directly correlated by whole plant traits, being characterized more by their biggest and
heaviest fruits carrying also heaviest seeds.
Tree species dispersed by local fauna have smallest and lighter fruits and have
shorter tree sizes probably according to fauna vertical stratification. Birds and bats
mainly forage the low medium strata in dry – humid forest were a highly availability of
58
rather small fruits are founded. Instead tree species dispersed by non volant mammals
have the biggest and heaviest fruits and the heaviest seeds but have not any particular
height. Dispersion of these tree species do not require of a particular height to expose
fruits and increase dispersal success. Other authors observed that endozoochorous
species that were protected, large and coloured by orange, yellow, brown or green were
classify as mammal-dispersed (nonvolant mammals including rodents, ruminants and
elephants), in contrast to unprotecteck (no husk) relatively small (less than 1,4 cm
diameter) and red, white, black, blue, purple or multicoloured (Janson 1983, Gautier-
Hion et al. 1985, Gentry 1982, Willson et al. 1989) which contrast inside the green
canopy. Gentry (1982) observe also that tree species dispersed by bird and baths were
shorter than those dispersed by mammals. In rain forest the non volant mammals
account for the higher consumption of fruits and seed biomass. The big and heaviest
ripe fruits of these species are released to the ground, beneath or near the canopy edge,
were foraging mammals found them and eat them (Guimarães et al. 2008) attracted
mainly by the smell sense due to the in general strong sweet-sour smell of like honey
substances surrounded seeds, and therefore probably without have a particular dispersal
advantages with a higher or reduced height for dispersal success.
In contrast, the dispersal distances of the longest and lighter seeds from did
clearly increase in taller tree. Previous studies have identified that taller species have
larger seeds and take longer to reach maturity. Plant height is another important trait for
species’ life-history strategies, affecting species’ abilities to capture light (Falster and
Westoby 2005). Tall species within all life forms tend to have higher annual seed
production, larger seeds, greater longevity and greater reproductive lifespans than do
short species (Moles and Leishman 2008). We do confirm this cross species correlation
between tree height and seed volume but at marginal levels. In addition, we find a less
reported correlation between tree height and dispersal mode, indicating that taller tree
species were wind dispersed species, having heaviest and longest fruits but lighter and
longest seeds. Taller anemochorous species have heaviest fruits probably due the woody
and dehiscent fruit epicarp which open when ripe responding to drought stress, exposing
the lighter seeds to be transported by wind. The longest fruits have a longitudinal
distribution of seeds which probably increase the contact surface of winds passing
though the fruit to disperse seeds. We found also that the anemochorus species were the
more deciduous ones, which having a low tree canopy cover during the longer time by
year and during the driest months when also fruits ripen, favor also probably the wind

59
passage trough tree canopy, reducing the nearest physical obstacles to increase dispersal
distances of the lighter seeds. Tree species with a non- assisted dispersion in contrast
seems to have a widely variarety of strategies to release their seeds with therefore a
wide variarety of heights and seed masses to assure successful dispersal events,
resulting in no correlations between tree height, dispersal traits and this parental
dispersal mode.
Therefore, we found that seed size and fruit size were tightly related and that
plant height was weakly correlated with fruit and seed mass similar to Wrigth et al.
(2007). However we found in addition that whole plant traits and dispersal traits were
correlated with dispersal modes together or alternatively, possibly affecting this weak
correlation between tree height and seed mass, supporting the idea about a tree
coordinate strategy with dispersal structures to model correlations between dispersal and
whole plant traits and trees life history
Dispersal traits modes were also correlated with leaf traits
The leaf traits strongly correlated with the leaf economic spectrum (Wright
2004) like SLA, LCC, LDMC, LNC, LPC and FTF were all correlated with fruit and
seed volume mass and shape. Dispersal traits and dispersal modes were also strongly
correlated with leaf traits implying also that leaf economic spectrum were strongly
articulated with tree dispersal strategies. SLA was negatively correlated with fruit mass;
LA was negatively correlated with fruit shape, volume and seed mass and volume;
LDMC was positively correlated with fruit mass meanwhile LCC was also positively
correlated with all fruits traits (shape, mass, volume) and seed shape. LPC was also
negatively correlated with fruit and seed mass and fruit shape; LNC was correlated with
fruit and seed shapes; and finally FTF was correlated with fruit and seed masses and
seed volume. Anemochory was correlated with LPC; autochory was correlated with
LNC and FTF; mammalochory was correlated with SLA, LDMC, LPC and FTF; and
finally Zoochory was correlated with LA, LDMC and LCC.
A relative higher number of correlations were found between leaf traits and fruit
sizes implying the direct correlation of leaf morphology with dispersal syndromes
(57%), but also a relevant proportion include seed sizes (48%) implying that also the
further paths in tree development were compromised within these correlations. Mainly
fruit mass, but also fruit volume and shape, co varied with SLA, LDMC, LCC, LPC and
FTF showing that tree investments in leaf construction reflect those on dispersal
structures. Tree species with more expensive leaves i.e physically strong leaves having

60
high contents of total biomass and carbon but reduced phosphorus contents and a
reduced area produced by leaf dry matter content (those species located in the positive
extreme of the leaf economy spectrum), have also heaviest, biggest and longest fruits.
Tree species with heaviest seed were also allocated associated with expensive leaves but
mainly due they direct association of seed mass with more fragile leaves having a
reduced phosphorus content, meanwhile longest seeds have also direct correlation with
highest total carbon and nitrogen leaf investments and biggest seed with LNC and FTF.
In contrast, in general those tree species with cheapest leaf construction located in the
opposite side of the LES showed more spherical, smaller and lighter fruits and seeds.
Leaf morphology was strongly correlated also with dispersal modes implying
that co-variation in tree leaf, fruits and seeds constructions costs were also coordinated
within the different tree strategies to disperse seeds and assure future populations. Tree
species dispersed by wind tend to have higher phosphorus content in more deciduous
leaves at the same time that have lighter seeds in longest and heaviest fruits and grow up
to the higher canopy stratums. In addition, tree species dispersed small local fauna have
bigger leaves with lowest leaf dry matter and carbon contents, in completely opposition
with those species dispersed by big mammals like the cattle, which have stronger leaves
with a higher dry matter contents but a reduced phosphorus content and area produced
with it biomass unit, at the same that have biggest and heaviest fruits with relatively
heaviest seeds. Even tree species with non-assisted seed dispersion were correlated with
leaf morphology, having also physically fragile leaves with highest nitrogen contents,
and longest fruits.
The strong correlations between leaf, dispersal traits and dispersal modes
evidence that other ecological process like herbivore defense, water balance and nutrient
cycling, commonly related with leaf morphology, were also compromised with
dispersion modes and with plant resources investment on dispersule construction. Leaf
traits like FTF, SLA, LDMC and LCC have been related with defense against herbivore
or with leaf vulnerability to herbivory and physical hazards (Wright and Westoby 2002,
Coley 1983, Perez-Harguindeguy et al. 2003). Leaves with a reduce specific leaf area
also has been related with shade-tolerance (Kitajima, 1994; Walters and Reich, 1999)
and water balance (Poorter 2008). As cited by Markesteijn et al. (2011) tough, well-
protected leaves with low SLA, shade-tolerant species reduce leaf herbivory, and
enhance leaf longevity and hence lifetime carbon gain and plant survival in the shaded
understory. We found in addition than these tree species do invest also in expensive
61
fruits (heavy and bigger) which allow a relatively more directed dispersion of biggest
seeds. Tree species dispersed by big non volant mammals probably benefit from
physically stronger leaves with a reduce palatability resulted from higher amounts of
total biomass and carbon to reduce the physical damage on foliage due to leaves direct
or occasional consuming by mammals browsing their fruits, like is actually observed
with cattle. Well-protected leaves with low SLA has been also correlated with drought-
tolerater strategies to balance water contents increasing the root length to maximize the
access to water or reduce water releases by a reduced transpiration (Markesteijn et al.
2011). However the lack of correlation between leaf phenology and mammalochory
implies that wider transitional stages between extreme deciduosness (4 to 6 months with
a reduced leaf canopy) and complete evergreens canopies (full leaf canopy year round)
were compatible with mammals dispersed species, unless the negative sense of their
correlations imply that more probably this well-protected leaves were more associated
with a moderate deciduodness (between 1 to 3 month with a reduced leaf canopy cover).
The endozoochorus strategy performed by the small frugivoruous local fauna
(i.e. birds and bats) have a completely opposite leaf characterization to those species
dispersed by big mammals. Mainly biggest leaves with a reduced total leaf dry matter
contents and carbon were found within these zoochorous tree species, having also
smaller, lighter and more spherical fruits carrying spherical seeds in rather shorter trees.
The maximum height and leaf traits did correlate positively with dispersal traits as
expected for these tree species, but not tree height and leaf.
Tree species dispersed by wind tend to have higher phosphorus content on more
deciduous leaves at the same time that have lighter seeds in longest and heaviest fruits
and grow up to the higher canopy stratums.
The more expensive leaves were now also associated with mammalochory and
probably will be associated with slow growing rates, accordingly with better defense
against hervibory, having probably longer lifespan and lower rates of nutrient cycling.
LA was negatively correlated with dispersal traits in contrasts to previous
observation by Wright et al. (2007). LA was strongly correlated with seed size (volume
and mass), fruit mass and shape. Therefore, tree species with bigger leaves have small
fruits and seeds with lighter seeds in rather spherical fruits, meanwhile tree species with
small leaves have longest and heaviest fruits with rather big and heaviest seeds. It has
been long recognized that twig size is positively correlated with the size of attached
appendages. Known as Corner’s rule (Corner, 1949), this correlation has been widely
62
demonstrated both for interspecific and intraspecific comparisons (see Yang 2009) but
mainly in relation with leave size meanwhile few in addressed directly the twig size -
fruit sizes relationship (Chen et al. 2009). We found also that LA tend to be positively
correlated with zoochorus trees, indicating that tree species dispersed by birds and bats
have the biggest leaves and accordingly with previous stated correlations between
dispersal modes and fruits traits, have also the smallest and lighter fruits. These
significant relationships could probably response more to the dispersal mode interaction
which indirectly relates tree species with zoochory dispersion with the smallest tree
species which having more competition for light within the original forests, will require
higher leaf areas. We have not measured of twig size to contrast our correlations
between leaf area and fruits size with possible differences in the tradeoff between leaf -
twig – fruits size axe.
These results imply that these two trait-based strategy dimensions were not
disarticulated and have ecological importance for tropical tree species communities.
Has not being clearly tested why big species could have bigger fruits beyond the
physical constraints that a small plant cannot support big diapores (Leishman et al.
2000, Wrigth et al. 2007). Easily, bigger trees can have an increased dispersal distances
for those anemochorus or autochorus species (Leishman et al. 2000) meanwhile the
higher survivorship required at juvenile stages for taller trees higher could be benefit
from bigger seeds (Moles et al. 2004). This last possible explanation needs to be tested
carefully quantifiying the relationship between seed mass and survival from seed
production to reproductive maturity.
Both leaf and dispersal traits were correlated to the main two and three PC axes.
LDMC, FTF, dispersule masses, Vol_Fru and LPC were respectively positive and
negatively correlated to the first main axe CP_1 when the 20 species with a complete
leaf and dispersal trait data set were included in a PCA for dispersal and leaf traits.
LCC, LNC together with dispersule shapes and Vol_see were also respectively positive
and negatively correlated to the second main axe CP_2. In contrast, SLA and LA were
positively correlated to the third and four main axes CP_3 CP_4.
Dispersal modes were correlated to all leaf traits. All leaf trait correlates to at
least one or two dispersal modes, instead three of the four main dispersal modes
identified were correlated to at least two, three or even to five leaf traits at time. Just one
dispersal mode, Anemochory was not correlated to any leaf trait. Autochory was
positively correlated to LNC and tend to be negatively correlated to FTF. Zoochory was
63
positively to LA and negatively correlated to LCC and LDMC. Mammalochory was
positively correlated to LDMC and LCC but negatively correlated to SLA, LPC and
LNC.
Integrated trees strategies in active pasturelands:
Wind dispersed tree species were taller and more deciduous, have higher
phosphorus contents on leaves and longest dispersules (fruits and seeds) with lighter
seeds. Self dispersed tree species have denser woods, more fragile leaves with higher
nitrogen contents and longest fruits. Tree species dispersed by local fauna were smaller,
have biggest leaves with lower biomass and total carbon investments, have small and
lighter fruits and more spherical dispersules (fruits and seeds). Tree species dispersed by
big mammals (i.e. cattle within this anthropogenic environment) were not correlated
with whole plant traits but with leave and dispersal traits. Tree species dispersed by big
mammals have stronger leaves with higher biomass and total carbon contents but a low
specific leaf area and phosphorus contents, together with a big and heaviest fruits and
heaviest seeds.
These results reflect the variability plant coordinated strategies mixing particular
combinations of the 3 main axes of trait covariability identified nowadays i.e. i) leaf
economic spectrum, ii) seed size – seed output- seedling survive and iii) tree height-
early growing rates-shade tolerance, within these tree community. In addition, these
results help to understand how tree species’ traits were related to dispersal mode, which
is related with dispersal distance, seedling establishment, and therefore is crucial for
understanding the ecology of plant dispersal colonization to new environments.
In this chapter, we do not use ‘phylogenetic’ analyses to test for the effect of
evolutionary divergences in trait-pairs over the correlation patterns observed within the
cross-species analysis as suggested by Felsenstein (1985). We are aware that the
taxonomic biases in the dataset could contribute substantially to cross-species results.
However, our main objective in this paper is to describe present-day traits species
values in a particular environment and tree community. Phylogenetic’ analyses to
confirm the absence of the evolutionary divergences effect will be relevant at further
research stages to address different questions about how the range of trait values has
arisen phylogenetically through evolutionary history (Westoby and Wright 2004) and
when additional tree communities within pasturelands will be compiled at higher
regional or word-wide scales. The majority of previous studies on ‘cross-species’
64
correlations have found strong similarities with those using phylogenetic correlations
(i.e. Zanne et al. 2005). This is possibly due to the fact that closely related species retain
similar ecological characteristics (phylogenetic conservatism of traits or niche
conservatism) (Blomerg et al. 2003, Ackerly 2009).
2.6 CONCLUSIONS
Tree species in active pasturelands have wide variability of plant traits, more
specifically:
We confirm the presence of a leaf variability spectrum (equivalent to the
Leaf Economy Spectrum (LES)) which split apart conservative leaf
species with high LDMC, LCC, FTF but low SLA and LPC from those
with more acquisitive leaves having the opposite characteristics
(acquisitive – conservative).
Tree species also vary also in the stem and phenology variability
spectrum (SPS) confirming that taller deciduous trees have softer woods
than shorter evergreens (deciduous softer – denser evergreens).
We found that tree species vary also in a fruit and seed investment
spectrum, splitting apart tree species with bigger and heavier fruits from
those with small and lighter fruits and seeds (cheap – expensive).
Moreover we found that leaf, reproductive and whole plant traits are strongly
associated i.e. leaf characteristics are linked with other plant variability, more
specifically:
A leaf and reproductive investment spectrum showed than acquisitive
leaves have cheap fruits and seeds in contrast to conservative tree species
which have expensive fruits and seeds construction (acquisitive and
cheap).
A stem, phenological and reproductive spectrum split apart deciduous
tree species with small and lighter seeds from evergreen species with
more expensive fruits and seeds (deciduous and cheap).
A leaf, stem and phenological spectrum outline that deciduous tree
species (with a short leaf life span) have more fragile acquisitive leaves
and softer woods (low LCC but high LPC) than evergreen species which

65
have more conservative leaves and denser woods (deciduous, acquisitive
and softer woods).
Plant traits interact in several spectrums of variability defining different plant
strategies where investments in fruits and seeds construction are related with leaf and
stem economies.
The complexity of the pattern of plant trait associations showed no tendency to
form tightly-defined “functional groups” with holistic associations occurring in several
diverse axes of traits variability.
Dispersal types are good examples of tree strategies that display species’ traits
variability which display different arrangements of leaf, whole plant and reproductive
traits, more specifically:
Tree species dispersed by wind were taller, deciduous, having rich
phosphorus leaves, bigger and longest fruits and carrying lighter seeds.
Tree species dispersed by local fauna were shorter with big but cheap
constructed leaves (low LCC) carrying small, lighter and spherical fruits
with spherical seeds. In contrast, tree species dispersed by big mammals
like cattle showed strong and expensive leaves (high LDMC and LCC)
poor in nutrients (low LPC and LNC) carrying big and heavy fruits with
heavy seeds. Tree species with parental dispersion have dense woods but
fragile nutrient rich leaves (high LNC) having the longest fruits.
The multidimensional tree functional strategies observed in APs suggest that
loss of any particular tree characteristic could affect different ecosystem services
offered by actual tree cover remaining in tropical agricultural lands.

66
CHAPTER 3. ADULT TREE ABUNDANCES AND PLANT
TRAITS PREDICT TREE SPECIES NATURAL
REGENERATION IN ACTIVE NEOTROPICAL
PASTURELANDS
3.1 ABSTRACT
Species different capacity to naturally regenerate (CNR) is an ecological
property of plant communities key to conserve the decreasing fraction of local diversity
remaining in agricultural lands and related ecosystem processes.
A reduction of tree cover diversity can produce negative impacts on actual and
future provision of ecosystem services if some plant traits (PT) favor tree CNR after
land use change meanwhile others are associated to species with limited CNR.
We evaluate the relationships between PT and adult tree cover with tree
seedlings and saplings abundances and their contribution to the CNR of tree cover
diversity under disturbances generated by active pastureland (AP).
Tree abundances (adult, saplings and seedlings) and 17 PT related to four main
trait dimensions (leaf, stem density, canopy height and reproductive variability
spectrums) were measured on 76 tree species in 46 APs. Measured leaf traits were leaf
area, specific leaf area, leaf dry matter content, total carbon, phosphorus and nitrogen
leaf content, foliar tensile strength; whole plant traits were wood density, maximum tree
high, leaf phenology; and reproductive traits were fruit and seed mass, volume, shape
and dispersal mode.
All PT are correlated with both tree species abundances and CNR in APs. More
abundant adult trees were taller deciduous species with softer woods, small and
conservative leaves, with expensive and longest fruits carrying big and longest seeds,
dispersed by wind and cattle.
Some successful PT at seedlings and saplings stages differ with adult tree cover:
species with denser woods, P rich leaves and expensive seeds have more sapling
abundances meanwhile species with C and N rich leaves have more abundant seedlings.
Tree species dispersed by cattle were abundant as seedlings and saplings but those
dispersed by local fauna were limited in all developmental stages. Adult tree
abundances were strongest predictors of tree seedlings and saplings abundances in AP
and together with PL explain a higher proportion of species abundance variability (60 -
67%).

67
Actual tree functional diversity and the capacity to provide ecosystem services
under current management practices in APs will possibly decrease as a consequence of
the limited CNR of some trees with particular PT.
Key words: responses to disturbances, seedlings, saplings, tree cover,
population dynamics, agricultural lands.
3.2 INTRODUCTION
The capacity of tree species to regenerate after disturbances is a key ecological
property of plant communities potentially determining today and future ecosystems
services. The selective pressures from environmental conditions, disturbances and biotic
interactions act distinctively over individuals at different developmental stages i.e.
seedlings, saplings, adults and diasporas (Boege and Marquis 2005). Each
developmental stage has differences in physiological and morphological attributes and
constraints, generating different responses to the selective pressures exerted over tree
ontological development and shaping species populations (Elger et al. 2009). At
community level, the relative abundance of species and their population structure,
reflect the differential species´ ability to reproduce under the prevailing environmental
conditions in response to natural and anthropogenic disturbances like herbivores,
droughts and deforestation (Kitajima and Fenner 2000, Esquivel et al. 2008). In
addition, the relationships between species abundance by developmental stage with
species physio-morphological traits potentially reflect the successful functional
“responses” to overcome such selective pressures. At the same time, the relationships
among functional traits and demography could evidence the main “constraints” tree
species should face to complete their life cycle in a specific habitat, adding functional
information to the tree communities’ structure. Therefore, if some plant traits are more
successfully promoting high tree abundances than others, they probably will affect
ongoing ecosystem processes like litter decomposition. In consequence, a reduction of
tree cover diversity can produce negative impacts in future ecosystem services provided
by tree species communities (i.e. nutrient cycling) if some plant traits (PT) favor tree
provision of ecosystem services if some plant traits (PT) favor tree capacity to naturally
natural regeneration capacity (CNR) after land use change meanwhile others are
associated to species with limited CNR.

68
However the direct relationships between tree species abundances with different
functional traits in a tree community have been explored by a small number of studies.
During the last few decades community ecology has searched for general rules
associating species characteristics with biotic factor and environmental conditions
(Keddy 1992). In this process the links between species demographic structures and
ecosystems processes has deal with contrasting interpretations. Some authors have
suggested that disturbance responses involve demographic rather than physiological
traits, therefore highliting the independence of traits relevant to disturbance response
from those involved in ecosystem effects and processes (Díaz and Garnier 2002). In
contrast, others argue that presence and abundance of species in a habitat could be
predicted from a particular subset of ecophysiologycal traits, with others being filtered
out due to the environmental and biotic interactions (Keddy 1992). Therefore, the
number, relative abundance, and functional identity of plant species potentially
influence ecosystem processes (Chapin et al. 2002). As postulated by Grime (1998) in
the ‘‘biomass ratio hypothesis’’ which states ‘‘the extent to which the traits of a species
affect ecosystem properties is likely to be strongly related to the contributions of the
species [. . . ]’’ taking explicitly into account the number, relative abundance functional
identity of the species present in determinate habitat (Garnier et al. 2004).
The species’ capacity to successfully complete their life cycles in a specific
habitat and its effects on the functional structure of tree communities has been
exclusively studied inside pristine forest or native grasslands. However, tree species
natural regeneration has a key role also in the community structure in the agricultural
lands adjacent to forest frontiers. Increasing our knowledge about natural regeneration
in agricultural lands is especially relevant in areas where pristine forests are under high
deforestation pressures like seasonal dry tropical forests, both for ecological and
practical reasons. Tropical dry forest originally represented 42% of the tropical
vegetation worldwide (Murphy and Lugo 1995) but is one of the most threatened
tropical terrestrial ecosystems, precisely due to the conversion of these areas into
agricultural lands (Sanchez-Azofeifa et al. 2005). The damaging consequences of this
land use change include the loss of ecological services (such as biodiversity and
watershed protection), the loss of many goods (such as timber and non-timber forest
products), and the loss of means of existence for forest dwelling people (Lamb et al.
2005).
69
Agricultural lands conserve an important fraction of local diversity (Pimentel et
al. 1992, Harvey et al. 2006). In the neotropics, tree cover in agricultural landscapes
typically occurs in the form of riparian forests, forest fallows, live fences and dispersed
trees (Harvey et al. 2006). This tree cover does not have common origins, in contrast is
a mixed community including remnant individuals which survive the cutting of the
original forest, together with new colonizers coming from conserved forest fragments
and introduced individuals deliberately sown by farmers. These tree resources are often
actively managed by farmers to provide products such as firewood, timber, fruits and
fodder for cattle, and services such as watershed functions and shade for cattle (Harvey
et al. 2004, Gordon et al. 2010). Although trees are principally retained by farmers for
productive purposes, they may also provide habitats, resources, and landscape
connectivity for animals (Estrada et al. 2000, Harvey et al. 2004). Some literature has
also compared animal diversity on agricultural land vs. forest in the neotropics (Estrada
et al. 2000) indicating for example that tree components outside offers resources for
54% of terrestrial native mammals foraging inside and outside the forest (Daily et al
2003), an impressive amount for biodiversity conservations issues.
Paradoxically the ecology of tree components in agricultural lands has not
received attention beyond the taxonomical diversity, despite the several functional
attributes which have been pointed out implicitly with the conservation values of trees
outside the forest for biodiversity. For example, diverse whole plant, leaf and fruits
characteristics should be found in tree cover to be able to offer diverse food and habitat
sources for diverse animal taxa (Harvey et al. 2004). In addition, key ecological
processes like tree natural regeneration just have been started to be addressed beyond
the forest edges (Esquivel et al 2008), no matter it huge relevance for the maintenance
of plant communities and ecosystem processes and services as cited previously. Tree
natural regeneration is an ecological process especially relevant in anthropogenic
disturbed ecosystems like pasturelands, were tree cover is continually depleted
following conventional management to increase grass and livestock productivity
(Nepstad et al. 1999). Seed dispersal from forest fragments for example is an important
process to colonize new open areas particularly outside forest (Aide 2000). However we
don’t know which morphological or physiological characteristics are associated with the
observed different natural regeneration capacity of tree species to colonize and maintain
viable populations in these areas (Esquivel et al. 2008).
70
Conversely we have started to be aware that even the diversity of tree cover in
agricultural landscapes is also threatened to decline under the continuity of conventional
management strategies i.e intensive over-grazing and pesticide use (Esquivel et al. 2008,
Gibbons et al. 2008, Fischer et al. 2009). In one of the few studies of the ecology of the
trees in active tropical pastures, it was found that tree species have different capacities
to maintain viable populations within these habitats (Esquivel et al. 2008). In this study
in a seasonal central American environment, half of tree species in active pastures had
abundant seedlings, saplings and adult populations, meanwhile seedlings or saplings
were absent for the other half of species indicating their incapacity to renew this
populations within this continually disturbed habitat (Esquivel et al. 2008). The natural
regeneration capacity of tree species as responses to disturbances typical of
anthropogenic habitats like pasturelands, involved: they inherited (genetic) development
of physiological and morphological characteristics, and their interactions with external
ecological factors like preexisted vegetation (i.e. exotic grasses), animals (i.e.cattle) and
environmental conditions (i.e. soil soil fertility) (Price et al. 2001). Despite the last
decades of massive efforts to evaluate the functional characterization of diversity
worldwide (Wright et al. 2004, Díaz et al. 2007, Chave et al. 2009, Moles et al. 2007),
we know little about the functional characteristics of the tree cover in the agricultural
lands.
Neither the natural regeneration patterns or the functional characteristic of tree
components in agricultural lands can be predicted from the actual knowledge coming
from pristine forest areas mainly due to the high variability between models resulting
from different forest types i.e dry and humid forests and differences in nature and
intensity of the disturbances inside and outside the forest (Viera and Scariot 2006). The
different patterns of natural regeneration observed in dry forest areas in comparison
with moist forest for which a higher amount of ecological natural regeneration studies
have been based were carefully described by Viera and Scariot (2006). Different
environmental conditions inherent to these forest types (rainy seasonality and
temperatures), disturbance regimens (i.e. fires and slides) and the differences on the
morphological and physiological responses of tree species to overcome such site
conditions (like phenology, seed dispersal, seed germination seedlings establishment,
fire resistance and resprouting capacity) has been identified as responsible for such
differences between in regeneration patterns between dry and moist forest reflected
finally on the inherent tree communities structure and richness of such contrasting forest
71
types (Viera and Scariot 2006). Reponses to tree fall gaps for example has been widely
considered to be focal regeneration sites in moister tropical forests, but can decrease the
seedling survival dry forest due the extremely high soil temperatures and low humidity
(Gerhardt 1999; Mclaren and McDonald 2003a, 2003b).
Most knowledge about natural tree regeneration after anthropogenic
disturbances outside the forest has come from the observation of forest succession in
abandoned pasturelands (Holl 1999). The models of natural regeneration in abandoned
pastures identify that seed dispersal, safety microenvironments for seed germination and
the competition with pre-established grasses are the main limiting factors (Zimmerman
et al. 2000). The number of seeds dispersed by animals in abandoned pasture for
example, decreased dramatically to more than 5 m from forest edge (Holl 1999) mainly
due to the few forest birds and bats able to move into open areas outside the forest
(Cardoso da Silva et al. 1996, Howe and Smallwood 1982). Tree species dispersed by
wind were also dependent on distances to forest edges and surrounding vegetation
unless were able to have higher seed densities at higher distances from seed sources in
the forest or in the preexisting vegetations in the pastures (Holl 1999). Abandoned
pastures with a reduced vertical and horizontal plant stratification and species diversity
remain therefore dominated by grasses which cover profusely the soil reducing the early
establishment of trees and shrubs (Uhl et al. 1988). These bottlenecks for woody
regeneration in abandoned pastures stand can be hold by for long periods stopping
succession advances due to the higher growth and increased dominance of grasses cover
(Uhl et al. 1988). Once pioneers trees and shrubs set out in these conditions, the
structural complexity of the landscape increase, forming patches of woody vegetation in
the matrix of herbaceous cover. Now, local birds and bats visit frequently this woody
“islands” increasing the density of seeds dispersed by birds under this vegetation and
surrounding areas (McDonnell and Stiles 1983, Holl 1998) increasing pastures diversity
and speeding up succession advance (Lugo and Helmer 2004).
In contrast, few studies have identified the pathways of woody vegetation in
anthropogenic pasturelands under actively grazing pressures (Arnaiz et al. 1999,
Esquivel and Calle 2001, Esquivel 2008). These studies confirmed the relevance of
previous existed woody vegetation to act as foci for tree species colonization within the
pasturelands. For example, abundance and richness of tree and shrub seedlings were
studied under 57 isolated trees of four different tree species and in adjacent (5m) pasture
plots without the influence of prestablished woody vegetation in pastures under active
72
livestock production in the Andean moist pre-montane tropical lands (Esquivel and
Calle, 2001). With the exception of Montanoa quadrangularis (a wind dispersed
pioneer), regeneration of woody species below isolated trees was richer and more
abundant than in open pasture, suggesting that these trees with fruit dispersed seeds
enhance the seed rain and provide favourable microsites for the germination of those of
secondary species that are unable to reach, germinate or established in open pasture sites
(Holl 1998, McClanahan and Wolfe 1993, Guariguata et al. 1995, Robinson and Handel
1993, Toh et al. 1999). A higher proportion of bird dispersed species are able to reach
pasturelands under trees remnants of forest (Guevara et al. 1986). Meanwhile other tree
species colonize grasslands from forest edges, reaching open areas by wind or cattle
dispersion. Some species domain tree communities meanwhile other can be rare but
successful species.
In areas under continuous disturbance such as active pastures, additional
anthropogenic factors influence the process of seed dispersal and its dynamics in
addition to those observed inside tree forest and in abandoned agricultural lands.
Livestock (horses and cattle) for example, scatter the seeds of leguminous trees as
Enterolobium cyclocarpum (Janzen 1981, 1982) and fruits such as Psidium guajava
(Somarriba 1995). These animals can consume a high amount of fruits and disperse
seeds of high densities of these species in their dung. The different characteristics of
mobility and habitat preferences of these dispersers over wildlife, influence the
dynamics of natural regeneration of trees in active pasture regarding abandoned
degraded areas (Radford et al. 2001). For example, three years after the experimental
application of cattle dung in Mediterranean abandoned pastures, its vegetation showed a
significant increase in tree species richness of species found only in active grazing areas
(Traba et al 2003). Animals capable of dispersing seeds in anthropogenic disturbed
areas can expand plants populations, colonizing habitats that would not achieve
successfully without their interaction (Chambers and MacMahon 1994). Thus, the
effects of domestic animals become more important in the dynamics of dispersion of the
natural regeneration of degraded areas and active pastures. Despite its influence,
variability of results has not been widely explored. Specific fruits and seed
characteristics of tree species related with different mechanisms to colonize these areas
will probably related with the abundances of tree seedlings and saplings, shaping tree
community structures and processes.
73
Seedling establishment and seed dispersal are considered the most important
stages in the natural regeneration of trees. The study of both processes has been more
addressed inside than ouside the forests, despite them crucial effects to determine the
tree colonization patterns in deforested areas. Different dispersion strategies determine
patterns of distribution of seeds and consequently define the conditions under which
seedlings and saplings will live or die. Thus the demography of seedlings reflects plants
responses to the selection pressures on seeds and seedlings in the dispersed sites (Howe
1990). Density dependent mortality, microclimate conditions, nutrient availability,
competition with existing vegetation and herbivory are the main factors determining
seedling establishment and development in natural and anthropogenic factors. Newly
germinated seedlings may experience higher mortality near adult individuals where
usually high densities of seeds occur, due to intraspecific competition or further attacks
by pathogens or herbivores (Gilbert et al. 2001). In contrast, the least likely survival of
seedlings over long distances are related to new habitats at greater distances from parent
trees and probably lower proportion of microsites suitable for germination, survival and
establishment of the species (Auspurguer and Kitajima 1992).
The availability of nutrients in different soil microsites also determines the
growth and survival of seedlings in natural and disturbed areas. The survival and growth
of tropical tree species in areas of pasture are lower than in other land uses including
forests (Somarriba and Beer 1987). The biomass of leaves, stems and roots of several
tree species seedlings growing in pastures do not differ to those observed in forest
although the nutrient levels are lower in forest than in grassland areas (Holl 1999). The
low survival of seedlings in grasslands possibly due to severe competition from grasses,
which can cover completely and prevent seedling growth and development as has been
reported for other species evaluated in abandoned pastures (Gonzalez and Fisher 1994).
The dispersal mode which influences seed rain characteristics (distance and density) and
the capacity to be establish and growth under limited resources must be all important
characteristics to overcome seedling and sapling stages of tree regeneration in active
pasturelands.
Additionally, cattle grazing can increase or decrease the likelihood of
recruitment of woody plants in various ways (Archer 1995). By grazing and browsing
the domestic herbivores interact with seed banks and tree seedlings and saplings causing
direct and indirect changes in the vegetation of natural regeneration in these areas.
Direct effect on mortality resulted from the consumption of plant tissue with the

74
consequent loss of CO2, water and nutrient uptake associated with the biomass
reduction of leaves and roots (Archer 1995). Indirect effects from cattle trampling were
changes in ground cover, microclimate, soil properties, nutrient cycling and changes in
competitive interactions for these limited resources. The indirect effects of cattle
activities may become more important than the direct effects due to its ability to shaping
the dynamics and properties of an ecosystem (Archer 1995). In contrast, cattle may
favor the establishment of seedlings dispersed in their dung. The dung reduces
competition with grass roots and avoids trampling (Somarriba 1995), reducing the high
pressures of selection by herbivores or physical damage imposed by grazing. However,
few studies have evaluated the effect of actively grazing managements on tree
regeneration in pastures (Esquivel et al 2008). Palatability and tolerance to defoliation
in addition to dispersal mode must be characteristics of tree species affecting saplings
abundances of tree species surviving in active pasturelands.
Management practices of active pastures exert a strong selection pressure on the
early stages of plant development tree. A high tree cover in pastures is no guarantee that
the natural regeneration will not decrease in future years (Harvey and Haber 1999).
Periodical cuttings, intentional fires or the use of herbicides are common to reduce
woody colonization over pastures, but also through these farmers practices can reduce
the establishment of some species of seedlings, can in contrast favor the establishment
of others, influencing composition, distribution and population densities of tree species
naturally regenerating in active pastures (Esquivel et al. 2008). The maintenance of
woody components in the landscape scale, may favor a higher number of microsites and
recruitment centers for the establishment of tree species in agricultural landscapes.
However, few studies have evaluated how the proximity of propagules sources in the
landscape i.e forests or isolated trees, and their botanical composition of these sources,
influence colonization of degraded areas to these areas by native vegetation. For
example, higher densities of seedlings, greater species richness and largest number of
forest species were found under windbreaks connected to forests and under trees forest
remnants isolated in pasturelands (Harvey 2000). Therefore the presence, abundance,
composition and distribution of isolated trees in the landscape could increase the
diversity and abundance of seedlings in degraded landscapes (Esquivel et al. 2008).
In consequence, dispersal, leaf and whole plant traits of tree species must be
strongly related with the abundances of the early stages of tree natural regeneration i.e.
saplings and seedlings, reflecting the trade off to successfully maintain tree populations

75
in active pasturelands which give shape to tree community structures and affect
ecosystem processes. Dispersal traits like fruit and seed sizes together with dispersal
mode will probably be strongly correlated with tree regeneration abundances due to
importance of seed dispersal for the colonization of these open sites outside the forest.
Bigger dispersules (seeds and fruits) probably increase the colonization and
establishment chances for tree species due their highest investments on directed
dispersal (zoochory) to reach safe microsites and with the higher parental resources to
survive under low resources sites like the active pastures soils. Those tree species
dispersed by cattle and wind will probably have a dispersal advantages over those
dispersed by local animals like bird or bats due to their higher independence from the
pre-established woody vegetation, resulting in higher seedlings and saplings densities.
The correlation of small dispersules with tree regeneration abundances will probably
depend on dispersal mode, because bird and bats will probably have lower abundances
than those dispersed by wind. Therefore biggest (mass, volume) and cattle dispersed
seed could be probably enhancing the tree regeneration capacity in active pasturelands.
Leaf plant traits (SLA, LA, LDMC, LCC, LNC, LPC and FTF) may be
correlated with natural regeneration abundances in active pasturelands due their strong
relationships with water control, resources use and herbivores defence. Those more
conservative tree species with higher LDMC, LCC and FTF will be probably positively
correlated with tree regeneration abundances because these characteristics confer more
physical resistance to leaf damage caused during cattle grazing and browsing. However,
those more acquisitive tree species with a high SLA, LNC and LPS but with low carbon
related measures could be also positively correlated with higher abundances of tree
regeneration due to the stronger capacity to grow faster in conditions of limited
availability of resources like the active pasturelands. No clear expectations were
hypothetized around LA relationships with tree natural regeneration. Leaf traits
correlation could be stronger for saplings than for seedlings due to the strong
dependence of saplings stages on environmental conditions than seedlings when
parental resources has still effects of and enhanced tree regeneration capacity in active
pasturelands.
Whole plant traits like H_max, PHE and WD are probably correlated with
natural regeneration abundances in active pasturelands due their strong relationships
with growth, water control and resistance to physical damages. Taller tree species could
be positively related with seedling and saplings abundances because higher growing
76
rates associated to taller tree species allowing seedlings and saplings rapidly escape
from the strong environmental constrains during these early developmental stages. A
higher wood density could also give stronger capacity to tolerate physical damages at
early developmental stages increasing the abundances of tree natural regeneration under
constant grazing and browsing pressures. Finally, we can not propose a priori a pattern
for the association between phenology and tree regeneration abundances because
deciduous species and evergreen species have successful mechanisms to avoid water
stress, and both could have variable correlations with the abundances of early tree
developmental stages.
The abundance of adult tree cover inside the agricultural lands is an important
factor correlated with the abundances of tree natural regenerations (Esquivel et al. 2008)
but is not clear yet if they relative importance to predict natural regeneration
abundances is higher or lower than the prediction strength of plant traits. Today adult
tree components in active pasturelands have been resulted from a complex interaction
between historic natural and anthropogenic disturbances shaping the actual tree cover
functional composition. Previous natural disturbances when the forest cover still
domain, ages since forest cutting, management intensity, land users decisions making
regard the tree cover components in managed areas (windbreaks, isolated trees, riparian
forests) and their neighbourhoods (forest remnants) shape actual tree cover in active
pasturelands. The functional characterization of these adult tree cover in active
pasturelands has not been studied previously, but encompasses huge relevance because
the natural and historic anthropogenic disturbances has been mainly widely spread
within the tropical lands and because the direct influence that these woody components
could have on the future functional scenarios in the agricultural lands. Therefore, if tree
adults abundances were strongest predictors than functional traits anyway the functional
characterization of those tree cover reinforce their importance, because those tree
species able to proliferate or dominate within this areas will be those with the higher
probability to maintain their populations.
However, there are not previous studies predicting the abundances of tree natural
regeneration from functional plant traits in agricultural lands. The most similar
approaches have been not attempted in tropical systems, only in abandoned vineyards in
France (Shipley et al 2006), herbaceous ecosystems in temperate North America
(Sudding et al. 2005) and in unproductive limestone grassland in UK (Thompson et al.
2001) including only herbaceous vegetation and not tree species. A total of 94% of the
77
variance of relative abundances were explained by Shipley et al (2006) using eight
functional traits (proportion perennial, seed number, seed maturation date, SLA,
aboveground vegetative mass, stem mass, leaf mass and heigh) for 30 herbaceous
species without including population dynamics. Under controlled conditions of fertility
and disturbance Thompson et al. (2001) found that regenerative traits like seed mass and
germination characteristics were the best predictors of invasibility success after 2 years
in a experimental grass community of 54 native species, but that after 5 years no single
trait was a good predictor of invasiveness. Also in experimental conditions for more
than 900 herbaceous species, Suding et al. (2005) found that the risk of species loss due
to fertilization ranged from >60% for the rarest species to 10% for the most abundant
species, meanwhile some of the functional traits groups studied (photosynthetic
pathway, N-fixing symbiont, life span, height, vegetative spread, origin) like perennials
and species with N-fixing symbionts experienced increased risk of local extinction after
fertilization, regardless of their initial abundance. Therefore, both plant traits and tree
cover abundances will be relevant for predicting for the first time the tree natural
regeneration abundances using in tropical anthopogenic environments where the
functional role of those tree species with limited regeneration capacity will be
susceptible to extinction and will be essential to maintain biodiversity. Whereas
abundance was consistently important across all the studied that included it, functional
mechanisms were often system-dependent within these grassland environments.
As a novel approach, we evaluate the relationships between plant functional
traits and adult tree cover with tree seedlings and saplings abundances and their relative
role to predict the capacity of today tree cover diversity in agricultural landscapes to
regenerate naturally under the ongoing disturbances generated by livestock production.
We addresed a more fundamental question like what determine the relative abundance
of each species in a determinate environment?. We aim to provide information to
answer this question for tree species regenerating in actively managed environments.
Are functional traits good predictors of such early development abundances? I.e can tree
species natural regeneration abundances in active pasturelands be predicted from whole
plant, leaf and dispersal traits? Or the tree cover inside the same areas could be a better
predictor? Due to the complex and historical effects of the natural and anthropogenic
disturbances influencing the actual composition of the adults tree cover, we have no
questions related to correlations between traits and the abundance of adults. However
we addressed for the first time also, a widely functional description of the adult tree

78
cover commonly found in the agricultural lands of dry to humid –transition forest areas
in the Central America region.
In order to reach these objectives, we assembled functional trait data for 76 tree
species commonly found in active pasturelands (anthropogenic grasslands sowed with
exotic and native grasses after the removal of native forest) and their abundances
measured on 46 different pastures under common management’s options in the study
area region. A wide spectrum of 17 plant traits, the highest reported for tropical tree
species to date, were measured aiming to obtain a relevant characterization of tree life
history with leaf, reproductive and whole plant traits related with growing development
and regeneration processes. Dispersal traits include: fruit and seed masses (Mass_see,
Mass_fru), volume (Vol_fru, Vol_see), shapes (Sha_fru, Sha_see) and dispersal mode;
leaf traits included: specific leaf area (SLA), leaf area (LA), leaf dry matter contents
(LDMC) total carbon, nitrogen and phosphorus content), foliar tensile strength (FTF);
and whole plant traits measured were: maximum tree heigh (H_max), leaf phenology
(PHE) and woody density (WD).
3.3 METHODS
Trait measurements
A total of 17 plant traits were measured on adult trees (dbh ≥ 10 cm) for a total
of 76 tree species growing in active pasturelands located on Matagalpa, Nicaragua,
Central America (12°31’ - 13° 20’ N, 84° 45’ - 86° 15’ W). Maximum tree height
(Hmax), wood density (WD) and leaf phenology (PHE) were measured as whole plant
traits. Leaf traits measured were specific leaf area (SLA), leaf area (LA), leaf dry matter
content (LDMC), total leaf carbon, nitrogen and phosphorus contents (LCC, LNC LPC)
and physical strength of leaves (FTF). Measured dispersal traits include fruit and seed
masses (Mass_fru, Mass_see), volume (Vol_fru, Vol_see) and shape (Sha_fru,
Sha_see).
Plant traits were measured on adult trees located in open site environments with
canopies completely exposed to sunlight and following the general considerations made
by Cornelisen et al. (2003). A minimum distance between conspecifics of 50 m was
maintained for sampling. For leaf traits relatively young but fully expanded and
hardened leaves without obvious symptoms of pathogen or herbivore attack and without
susbtancial cover of epiphytes were sampled. As far as possible, leaves were sampled at
79
least 2 – 3 h after sunrise and 3 – 4 h before sunset. Mature fruits were collected from
trees or from soil when fresh fruits and seed recently released and were found. Leaf,
fruits and seeds samples were stored in a cool box or fridge until processing in the
laboratory. Dry and moist samples taken to avoid rot damage of the samples, and re-
hidratation was used for 6 to 12 h in a dark room when necessary, but will be desirable
measure within the following 48 h of collecting sampled. In general, sample sizes by
traits were 3 to 5 leaves or fruits collected from of 3 to 5 trees by species to obtain a
mean value of each trait for specie (Table 3.1).
The maximum plant height (H max) was measured using clinometers on flat
areas (m), vertical measurements or visual estimations in the more slope areas. The
biggest trees were selected within 46 active pastures (paddocks) where tree community
composition was sampled in a previous study (Esquivel et al. 2008). Plant phenology
(PHE) was measured using visual estimation of the percentage of tree canopy cover by
leaves (%) every two weeks over a year round for adult and reproductive trees, taking as
100 % reference the tree canopy density at the end of the previous rainy season. PHE
was measured as the number of months the canopy density was < 50%.
The specific leaf area (SLA) was measured on mature and full hydrated leaves
scanned Leaf Area Measurements software (LAM V 1.3, University of Sheffield, A.P.
Askew, 2003). After area measurement each leaf sample was oven dried at 60ºC for 72
h, and then weighed. An average of 20 leaves by species was measured, sampling 2 – 4
leaves by individual. Here we measured just the leaf lamina without petioles or rachis.
When collected, the samples (twigs with leaves attached) were wrapped in moist paper
and put them in sealed plastic bags, so they remain water- saturated. These samples
were stored in a cool box or fridge until processing in the laboratory. Re-hidratation was
done previous measurements for 6 to 12 h in a dark room when necessary, but
measurements were mostly done within the following 48 h of collecting sampled
(Cornelissen et al. 2003).
Leaf dry matter content (LMDC) was measured by oven drying leaf samples (60
– 70ºC) for 72 hours to determine dry mass content. The same leaves used for SLA
were used for LMDC. A pooled sample of oven dried leaves was used to determine
LNC, LCC and LPC contents for each species (Cornelissen et al. 2003) in CATIE Soil
Labs. Total N and C were estimated by combustion analysis made with FlashEA 1112
CN auto-analyzer. P was estimated by humid digestion with a mix of nitro-perclorated
acids 5:1 and colorimetry (Henríquez et al. 1995).The Leaf Tensile Strength or physical
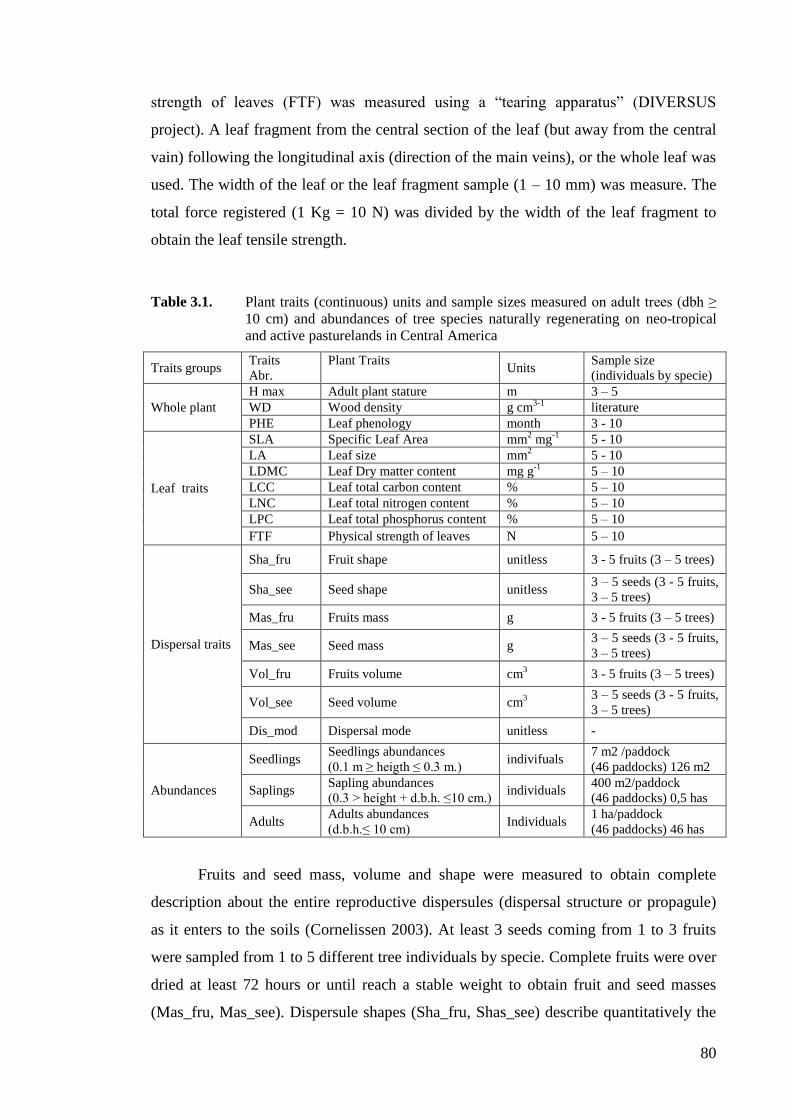
80
strength of leaves (FTF) was measured using a “tearing apparatus” (DIVERSUS
project). A leaf fragment from the central section of the leaf (but away from the central
vain) following the longitudinal axis (direction of the main veins), or the whole leaf was
used. The width of the leaf or the leaf fragment sample (1 – 10 mm) was measure. The
total force registered (1 Kg = 10 N) was divided by the width of the leaf fragment to
obtain the leaf tensile strength.
Table 3.1. Plant traits (continuous) units and sample sizes measured on adult trees (dbh ≥
10 cm) and abundances of tree species naturally regenerating on neo-tropical
and active pasturelands in Central America
Traits groups Traits
Abr.
Plant Traits
Units
Sample size
(individuals by specie)
Whole plant
H max Adult plant stature m 3 – 5
WD Wood density g cm3-1
literature
PHE Leaf phenology month 3 - 10
Leaf traits
SLA Specific Leaf Area mm2 mg
-1 5 - 10
LA Leaf size mm2 5 - 10
LDMC Leaf Dry matter content mg g-1
5 – 10
LCC Leaf total carbon content % 5 – 10
LNC Leaf total nitrogen content % 5 – 10
LPC Leaf total phosphorus content % 5 – 10
FTF Physical strength of leaves N 5 – 10
Dispersal traits
Sha_fru Fruit shape unitless 3 - 5 fruits (3 – 5 trees)
Sha_see Seed shape unitless 3 – 5 seeds (3 - 5 fruits,
3 – 5 trees)
Mas_fru Fruits mass g 3 - 5 fruits (3 – 5 trees)
Mas_see Seed mass g 3 – 5 seeds (3 - 5 fruits,
3 – 5 trees)
Vol_fru Fruits volume cm3 3 - 5 fruits (3 – 5 trees)
Vol_see Seed volume cm3
3 – 5 seeds (3 - 5 fruits,
3 – 5 trees)
Dis_mod Dispersal mode unitless -
Abundances
Seedlings Seedlings abundances
(0.1 m ≥ heigth ≤ 0.3 m.) indivifuals
7 m2 /paddock
(46 paddocks) 126 m2
Saplings Sapling abundances
(0.3 > height + d.b.h. ≤10 cm.) individuals
400 m2/paddock
(46 paddocks) 0,5 has
Adults Adults abundances
(d.b.h.≤ 10 cm) Individuals
1 ha/paddock
(46 paddocks) 46 has
Fruits and seed mass, volume and shape were measured to obtain complete
description about the entire reproductive dispersules (dispersal structure or propagule)
as it enters to the soils (Cornelissen 2003). At least 3 seeds coming from 1 to 3 fruits
were sampled from 1 to 5 different tree individuals by specie. Complete fruits were over
dried at least 72 hours or until reach a stable weight to obtain fruit and seed masses
(Mas_fru, Mas_see). Dispersule shapes (Sha_fru, Shas_see) describe quantitatively the

81
shape or form of the mature and alive fruit or seeds. Dispersule shape is the variance of
seed or fruits three main dimensions, i.e. the length, the width and the thickness
(breadth), after each of these values has been divided by the largest of the values. Shape
values or variance lie between 0 and 1 and are unitless. Dispersule shape was measured
from different seeds and fruits sampled for seed mass. Dispersule volume (Vol_fru,
Vol_see) describe the tri-dimensional or cubic space or volume occupied by tree fruits
and seeds. Fruits and seed volume were calculated by spherical or ellipsoid geometrical
formulas according to dispersule form described by length, width and thickness
(breadth). Fleshy fruits were stored in plastic bags and keep in a cool box on fridge until
measurements. For naturally dry fruits, air dried will be use previous to storing.
Tree dispersal mode describes the routes traveled by the dispersule units (fruits
or seed) or the vector assisting or moving the dispersule previous reaching the soil
surface Cornelissen (2003). The categories by Cornelissen (2003) were used and
adjusted when necessary to the local community (Table 3.2). We were aware that
several dispersal modes may be assisting dispersule unit’s movements (dispersion) away
from a parental tree to reach the ultimate germination place (Fischer et al. 1996). We
only use here the dispersal vector involved within the first stage of dispersule release
from parental tree within the whole possible range of dispersion movements (main
vector) to categorize tree species dispersion mode. Four dispersion modes were
identified: Autochory, Anemochory, Zoochory and Mammalochory.
Table 3.2. Dispersule characteristics used to categorize the dispersal mode traits adapted
from Cornelissen et al (2003)
Dispersal modes Vectors Dispersal mechanisms / Dispersule characteristics
Autochory
(including
Ballistochory)
Unasisted
dispersal,
bristle
contraction or
seed
launching
The seed or fruit has no obvious aids for longer distance transport,
falling passively from the plant or dispersule with Hygroscopic
bristles on the dispersule that promote movement with varying
humidity. Restrained seeds are launched away from the plant by
“explosion” as soon as the seed capsule opens
Anemochory Wind
dispersal
Minute dust-like seeds
Seed with pappus or other hair, balloons or comas
Flattened fruits or seeds with large wings
Tumbleweeds , where the whole plant or in-frutescence with ripe
seeds is rolled over the ground by wind
Endo-zoochory
(Zoochory
and
Mammalochory)
Internal
animal
transport
Fleshy often brightly coloured berries, arillate seeds, drupes and big
fruits that are evidently eaten by vertebrates (birds, mammals, bats)
and pass through the gut before seeds enter the soil elsewhere.
Those mainly consumed by wild animals where categorized as
Zoochory, instead those eaten exclusively by big mammals like
cattle were categorized as Mammalochory.

82
Wood density (WD) was the only plant trait exclusively obtained from literature
review. All the WD data come from standard published papers and from available
metadata reviews like those from Chave et al. (2006) and the Global wood density
databases from Zanne et al. (2009). Complementary dispersal traits data were obtained
also from literature reviews in order to increase the number of species obtained from the
field. Dispersule masses and dimensions, i.e. the length, the width and the thickness
(breadth) were obtained from standard published papers and data bases like Moles et a.l
(2004), specimens information from Regional floras available the on line i.e.
TROPICOS (Tropicos.org, Missouri Botanical Garden, 2012), Species of Costa Rica
(inbio.ac.cr, National Biodiversity Institute, Costa Rica, 2007), Flora Scientific
Databases (biogeodb.stri.si.edu/bioinformatics, Smithsonian Tropical Research Institute,
2012) and Agroforestree Database (worldagroforestrycentre.org, World Agroforestry
Centre, 2012).
Abundance of adult tree cover and tree natural regeneration
Study plots were established in 46 actively used pastures on 17 cattle farms.
These plots were selected to ensure a non-grouped spatial arrangement that covered the
different conditions of pastures present in the region. The pastures were selected on the
basis of grass composition and were representative of pastures in the region. The
selected pastures were dominated (i.e. cover = 70%) by one of three grass types: (i)
Urochloa spp. [Urochloa brizantha (Hochst. ex A. Rich.) Stapf and Urochloa
decumbens Stapf] previously named Brizantha spp. (B, n = 15); (ii) mixtures of
Cynodon nlemfuensis Vanderyst and Cynodon dactylon (L.) Pers. (C, n = 13); or (iii)
naturalized grasses (i.e. not planted or seeded) such as Paspalum spp. (N, n = 18)
(Esquivel et al. 2008). Abundance of seedlings, saplings and adult trees were sampled in
the 46 pastures in the rainy season from May to late July (Esquivel et al. 2008). Species,
height, diameter at breast height (d.b.h.) and crown sizes (two diameters along
perpendicular axes) were identified and measure for each tree individual. Seedlings
were defined as woody plants with a height between 10 and 30 cm, saplings as woody
plants with heights > 30 cm and d.b.h. ≤ 10 cm, and adult trees as plants with d.b.h. >
10 cm. (Esquivel et al. 2008).
Adult trees were sampling in 1 ha plot by pasture (10000 m2), saplings were
sampled in a mean of 10 quadrat plots per pasture (4000 m2), while seedlings were
sampled in a mean of 18 circular plots (126 m2) per pasture. The total area of each
83
pasture varied from 1 to 22 ha (mean 5·82 ± 1·34 ha). Further details about sampling
scheme, design, pasture management conditions and characteristics of the natural
regeneration of these tree species can be found in Esquivel et al. (2008).
Statistical analyses
Three types of analyses were performed to provide different approximations to
plant traits relationships with tree regeneration abundances: correlation, logistic
regressions and a multiple regression. First, the partial Spearman correlations analyses
were used to evaluate interspecific relationships (cross-species analysis, Poorter et al.
2008) between regeneration abundances with functional traits, while controlling for
pasture type. Cross-specific correlation analysis identifies statistically significant linear
abundance-trait relationship, their direction and strength (r). Second, logistic regression
analyses were used to identify also the significance of tree species abundances in the
different developmental stages with dispersal strategies or syndromes as categorical
variables. Finally, multiple regressions analyses (MRA) were performed to evaluate
how much of the variability in tree species abundances was explained by plant traits at
each early developmental stage: seedling and saplings. All the analyses were done using
an unbalanced species x traits data base build using the mean abundances by plot
(density) per specie and developmental stage founded in the three different types of
grass together with the mean values of the 17 plant traits observed by species.
The relationships between tree abundances by developmental stage and pasture
type with whole plant, leaf and dispersal traits were tested using Partial Correlation
Analyses (CA). These partial correlations analyses remove the grass type effect from
the regeneration abundances sampling model in three different pastures types avoiding
therefore any confounding effect of pasture management over the correlations between
abundance of tree natural regeneration with plant traits. In order to do this, the residual
values resulted from the ANOVA to test effects of pasture Grass type (B, E, N) on
regeneration abundances (with abundances previously rank-transformed to to overcome
lack of Normality) were correlated with the RANG values of whole plant, leaf and
dispersal traits using Pearson coefficients. The partial Spearman Correlation analyses
were able to test the relationships between abundances of tree natural regeneration with
plant traits without interferences of grass effects. The Partial Spearman Correlations
were compared with additional Spearman coefficients done using the original values of
tree regeneration abundances and 16 traits (a non-partial Spearman correlations) to
84
confirm for difference in Spearman coefficients due to a confounding effect due to
pasture Grass type
According to the categorical nature of dispersal mode variables and the
continuous nature of the abundance counting, the strength of the relationships between
the abundances of tree natural regeneration by each developmental stages (seedling,
saplings and adults trees) with dispersal modes were evaluated using logistic regression.
Multiple linear regression analysis (MRA) were used to evaluate which plant
traits predict a higher proportion of the variability observed for tree regeneration
abundances in active pasturelands. Individual models were calculated for seedlings and
saplings abundances as dependent variables and using the plant traits significatively
correlated each early developmental stage as regressors. Models were calculated also for
seedlings and saplings abundances including adult tree abundances and plant traits as
independent variables to test if the variability explained with the adult tree cover was
greater than those observed only with plant traits to predict tree natural regeneration
capacity. The Grass type (B, E, N) was also included as class variable (by including
dummy variables) within both regression models developed by tree regeneration stage
(seedlings and saplings) to evaluated and correct for possible effect of Grass type over
the multiple regression between stage of tree abundances and plant traits. The pasture
type from which the tree abundances were obtained did not affect the multiple
regression relationships for any developmental stage and therefore the resulted models
were shown without including the pasture factor (data not shown).
Our main objective with multiple regression was to describe the directions and
relative magnitudes of the plant traits explaining tree regeneration abundances but not to
explain the most variance. In order to select the best model for our main objectives we
did the following steps: 1) All the original values of measured plant traits were included
in MRA without any transformation or elimination method. 2) The partial residuals of
the model were inspected to detect outliers and lack of fit of the different regressors. 3)
Polynomic terms, mostly of quadratic and cubic order, were included to the MRA when
the partial residuals suggest them to adjust linearity. This procedure continues until the
inspection of the partial residues of the model showed absence of any pattern. Centered
regressors were used for all the polynomial orders when polynomic functions were
necessary to avoid multicoliniarity between polynomic terms of the same regressors; 4)
Stepwise elimination method, a method for adding and removing terms systematically
from a multilinear model (Legendre and Legendre, 1998) was used to retain the plant

85
traits associated (p < 0,05) with seedlings and saplings trees abundances. 5) Outliers’
presence and Normality assumption (a Q-Q plot with r2 ≥0.94) were tested. Adjusted - r
2
(higher is better), AIC (Akaike Information Criteria) and BIC (Bayesian Information
Criteria) criterion (smaller is better) were used to select the best fit model. 6) The
Variance Inflation Factor (VIF) was used to avoid multicolianiarity, excluding the
factors having a VIF ≥ 5 from the model. 7) Finally, original variables were transformed
when normality assumption was not reached following these steps. The normality
assumption was held for the error term of all these this models (Q-Q plot, r2>0.94), as
well as linearity (simple linear patterns in the graphic between partial residuals and each
trait) and heteroscedasticity (no function pattern in the residuals against predicted
scatter plot).
A total of 76 tree species were surveyed for tree abundances by developmental
stage and plant traits generating an un-balanced data set of 76 species × 16 traits
because not all the plant traits were measured for all the species (missing values). The
abundances were obtained from three different pasture types (B, E, N) resulting in
increased data matrix of 228 data coming from 76 species x 3 grass types x 16 mean
traits values. A total of 25 tree species have a complete record for each trait generating a
balanced sub-database of 75 data coming from the species abundances of 25 tree species
in the three grass types. The partial Spearman correlations analysis (CA) between plant
traits and the abundances of tree regeneration stages were calculated using between 32
and 76 species by paired correlation analyses, varying depending on the traits
considered. In contrast MAR were calculated using the 31 and 26 species respectively
for seedling and saplings stages having the complete data set of plant traits measured for
the specific combination of traits entered as potential regresors generating dataset of 95
and 83 values taking into account the abundances variability by grass types. Therefore,
the CA paired correlations between the abundance of tree regeneration stages were
tested with more power than MAR. The results from these approaches (CA and MRA)
were complementary and not necessary equal, first because the incomplete data set, and
second because MRA consider in addition the co-variance structure among all the
regressors.
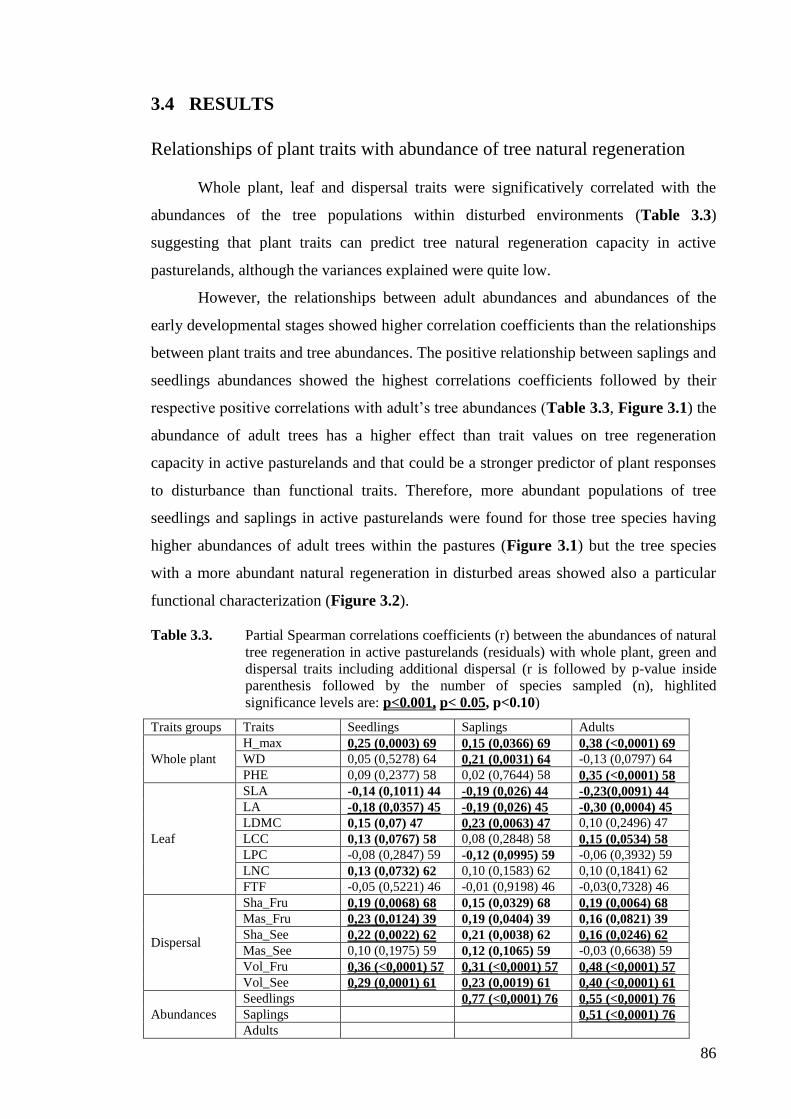
86
3.4 RESULTS
Relationships of plant traits with abundance of tree natural regeneration
Whole plant, leaf and dispersal traits were significatively correlated with the
abundances of the tree populations within disturbed environments (Table 3.3)
suggesting that plant traits can predict tree natural regeneration capacity in active
pasturelands, although the variances explained were quite low.
However, the relationships between adult abundances and abundances of the
early developmental stages showed higher correlation coefficients than the relationships
between plant traits and tree abundances. The positive relationship between saplings and
seedlings abundances showed the highest correlations coefficients followed by their
respective positive correlations with adult’s tree abundances (Table 3.3, Figure 3.1) the
abundance of adult trees has a higher effect than trait values on tree regeneration
capacity in active pasturelands and that could be a stronger predictor of plant responses
to disturbance than functional traits. Therefore, more abundant populations of tree
seedlings and saplings in active pasturelands were found for those tree species having
higher abundances of adult trees within the pastures (Figure 3.1) but the tree species
with a more abundant natural regeneration in disturbed areas showed also a particular
functional characterization (Figure 3.2).
Table 3.3. Partial Spearman correlations coefficients (r) between the abundances of natural
tree regeneration in active pasturelands (residuals) with whole plant, green and
dispersal traits including additional dispersal (r is followed by p-value inside
parenthesis followed by the number of species sampled (n), highlited
significance levels are: p<0.001, p< 0.05, p<0.10)
Traits groups Traits Seedlings Saplings Adults
Whole plant
H_max 0,25 (0,0003) 69 0,15 (0,0366) 69 0,38 (<0,0001) 69
WD 0,05 (0,5278) 64 0,21 (0,0031) 64 -0,13 (0,0797) 64
PHE 0,09 (0,2377) 58 0,02 (0,7644) 58 0,35 (<0,0001) 58
Leaf
SLA -0,14 (0,1011) 44 -0,19 (0,026) 44 -0,23(0,0091) 44
LA -0,18 (0,0357) 45 -0,19 (0,026) 45 -0,30 (0,0004) 45
LDMC 0,15 (0,07) 47 0,23 (0,0063) 47 0,10 (0,2496) 47
LCC 0,13 (0,0767) 58 0,08 (0,2848) 58 0,15 (0,0534) 58
LPC -0,08 (0,2847) 59 -0,12 (0,0995) 59 -0,06 (0,3932) 59
LNC 0,13 (0,0732) 62 0,10 (0,1583) 62 0,10 (0,1841) 62
FTF -0,05 (0,5221) 46 -0,01 (0,9198) 46 -0,03(0,7328) 46
Dispersal
Sha_Fru 0,19 (0,0068) 68 0,15 (0,0329) 68 0,19 (0,0064) 68
Mas_Fru 0,23 (0,0124) 39 0,19 (0,0404) 39 0,16 (0,0821) 39
Sha_See 0,22 (0,0022) 62 0,21 (0,0038) 62 0,16 (0,0246) 62
Mas_See 0,10 (0,1975) 59 0,12 (0,1065) 59 -0,03 (0,6638) 59
Vol_Fru 0,36 (<0,0001) 57 0,31 (<0,0001) 57 0,48 (<0,0001) 57
Vol_See 0,29 (0,0001) 61 0,23 (0,0019) 61 0,40 (<0,0001) 61
Abundances
Seedlings
0,77 (<0,0001) 76 0,55 (<0,0001) 76
Saplings
0,51 (<0,0001) 76
Adults

87
Eight plant traits: Hmax, SLA, LA, Sha_fru, Sha_see, Mass_fru, Vol_fru and
Vol_see were correlated with all three developmental stages, indicating they key
relationship with a successful tree natural regeneration in active pasturelands and with
tree species responses to disturbances. H_max together with Sha_fru, Sha_see,
Mass_fru, Vol_fru and Vol_see were positively correlated with seedlings, saplings and
adult’s abundances, meanwhile SLA and LA were negatively correlated (Table 3.3).
The correlations coefficients of these eight traits were higher for the relationships with
adult tree populations than with seedlings or saplings populations. The strongly
positively correlations of H_max, Sha_fru, Sha_see, Mass_fru, Vol_fru, Vol_see and
the negative correlations of SLA, LA with adults abundances reflect the strong
functional responses of the actual adult tree cover outside the forest resulted from the
complex interactions between natural and anthropogenic selection forces.
The relationships between seedlings abundances with these whole plant and
dispersal traits followed in strength, having the relationships between saplings
abundances with leaf traits the lower correlation coefficients. The slightly more stronger
positive correlations between whole plant traits (H_max) and dispersal traits (Sha_fru,
Sha_see, Mass_fru, Vol_fru, Vol_see) with seedlings than with saplings abundances,
probably suggest also that this characteristics help to overcome mainly the limitations in
seed dispersal and seedling initial establishment. The slightly more stronger negative
correlation between leaf traits (SLA and LA) with saplings than with seedlings
abundances suggest that these traits are probably more relevant to with saplingsurvival
and adult growth up to maturity.
Other plant traits were correlated only with abundances of early developmental
stages but not with adult abundances indicating that this trait is a morphological
characteristic that definitely enhances natural regeneration in active pasturelands
independently of adult abundances. One plant trait, LDMC was correlated only with
both early stages of tree development, having positive and strong relationships with
saplings and more weakly with seedlings abundances. A higher LDMC in saplings and
seedlings probably enhance tree early developmental stages sapling survival via
reducing leaf damages and consumption by hervivories and/or reducing drought
mortality.
In contrast, some plant traits were correlated only with adult abundances but not
with seedlings and saplings abundances, like PHE, which has a strong and positively
relationship with adult abundances.
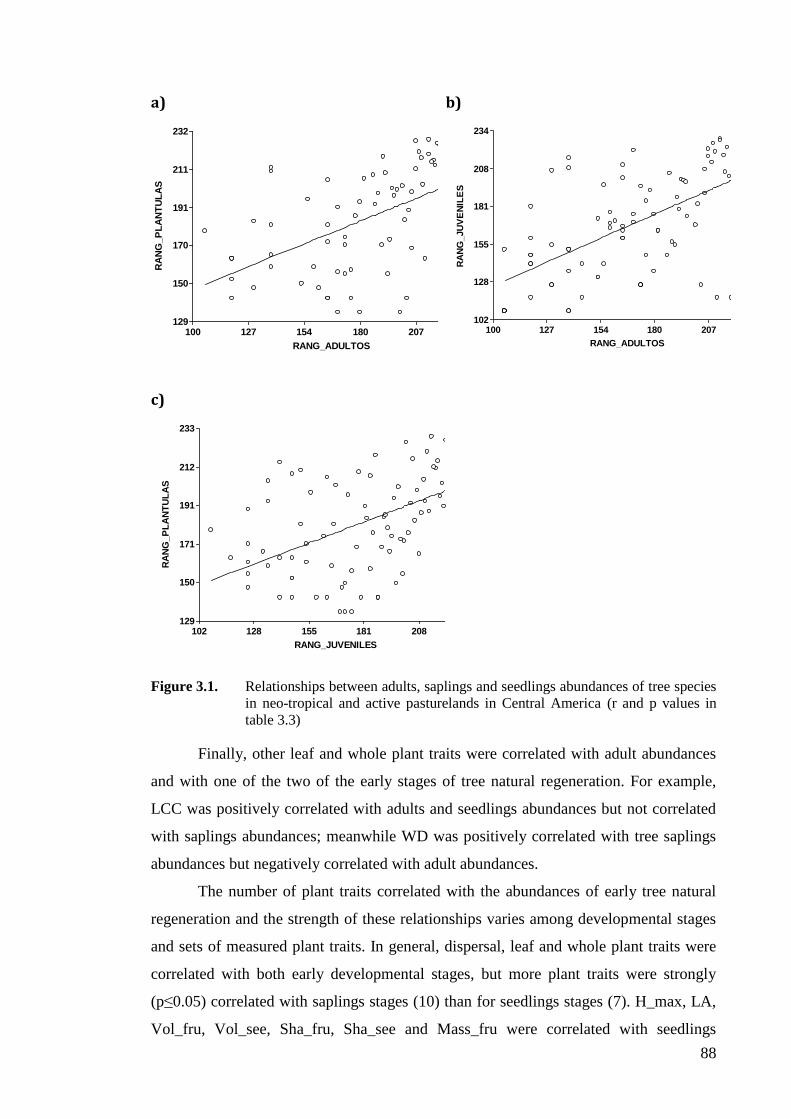
88
100 127 154 180 207 234
RANG_ADULTOS
129
150
170
191
211
232
RA
NG
_P
LA
NT
UL
AS
a) b)
c)
Figure 3.1. Relationships between adults, saplings and seedlings abundances of tree species
in neo-tropical and active pasturelands in Central America (r and p values in
table 3.3)
Finally, other leaf and whole plant traits were correlated with adult abundances
and with one of the two of the early stages of tree natural regeneration. For example,
LCC was positively correlated with adults and seedlings abundances but not correlated
with saplings abundances; meanwhile WD was positively correlated with tree saplings
abundances but negatively correlated with adult abundances.
The number of plant traits correlated with the abundances of early tree natural
regeneration and the strength of these relationships varies among developmental stages
and sets of measured plant traits. In general, dispersal, leaf and whole plant traits were
correlated with both early developmental stages, but more plant traits were strongly
(p≤0.05) correlated with saplings stages (10) than for seedlings stages (7). H_max, LA,
Vol_fru, Vol_see, Sha_fru, Sha_see and Mass_fru were correlated with seedlings
100 127 154 180 207 234
RANG_ADULTOS
102
128
155
181
208
234
RA
NG
_JU
VE
NIL
ES
102 128 155 181 208 234
RANG_JUVENILES
129
150
171
191
212
233
RA
NG
_P
LA
NT
UL
AS

89
abundances and in addition, WD, LDMC and SLA were correlated with saplings
abundances. Vol_fru was the plant trait more strongly correlated with the abundances of
both developmental stages. In general, the positive relationships between abundances of
tree early developmental stages with dispersal traits showed highest correlation
coefficients, being even quite higher for seedlings than for saplings abundances, but
keeping the same decreasing order at both stages: Vol_fru, Vol_see, Sha_fru, Sha_see
and Mass_fru.
In contrast, the strength of the positive relationships between the abundances of
early natural regeneration with leaf and whole plant traits, which followed in strength of
the correlations to dispersal traits, did vary following different patterns for both
developmental stages. In general, whole plant traits showed highest correlations
coefficients for seedling abundance meanwhile leaf traits showed highest correlations
coefficients for leaf traits higliting their different relative influence for each of the early
tree developmental stages. For example, the observed correlation coefficients with
whole plant traits like H_max were higher for seedlings (0,25) than for saplings (0,15)
at the same time that also WD was positively correlated with saplings abundances. In
addition, the correlation coefficients for the relationships between abundances and leaf
traits were stronger with saplings than with seedlings abundances. In this case, although
the correlation coefficient of LA was just slightly higher for saplings (0,19) than for
seedlings (0,18), two more leaf traits i.e. LDMC and SLA were also highly correlated
with saplings but not with seedlings abundances (Figure 3.2) Other leaf traits like
LDMC, SLA, LCC and LNC were only weakly correlated with seedlings abundances;
meanwhile LPC and other dispersal trait like Mass_see were only weakly correlated
with saplings abundances.
These results showed that plant traits are directly correlated with the abundances
of tree natural regeneration after disturbances like active livestock management. Taller
tree species regenerate successfully having more abundant saplings and seedling
populations in active pasturelands. Tree species with dense woods have more abundant
populations of saplings unless tree species with softer woods were more abundant at
adult’s stages. Deciduous tree species were also the more abundant trees in active
pasturelands, but were nor related at all with tree early stages. Tree species more
conservative leaf strategies (lower SLA, LA and LPC together with high LDMC and
LCC) were the more abundant species at all tree developmental stages. Finally, tree
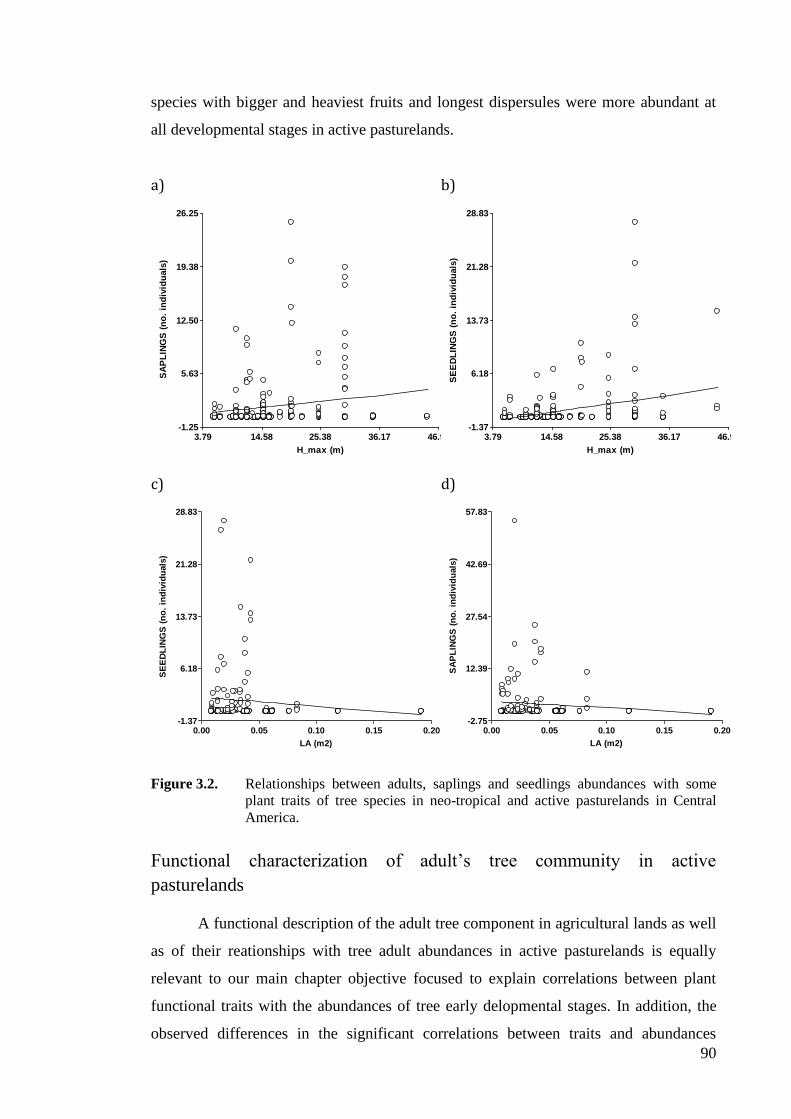
90
species with bigger and heaviest fruits and longest dispersules were more abundant at
all developmental stages in active pasturelands.
a) b)
c) d)
Figure 3.2. Relationships between adults, saplings and seedlings abundances with some
plant traits of tree species in neo-tropical and active pasturelands in Central
America.
Functional characterization of adult’s tree community in active
pasturelands
A functional description of the adult tree component in agricultural lands as well
as of their reationships with tree adult abundances in active pasturelands is equally
relevant to our main chapter objective focused to explain correlations between plant
functional traits with the abundances of tree early delopmental stages. In addition, the
observed differences in the significant correlations between traits and abundances
3.79 14.58 25.38 36.17 46.96
H_max (m)
-1.25
5.63
12.50
19.38
26.25
SA
PL
ING
S (
no
. in
div
idu
als
)
3.79 14.58 25.38 36.17 46.96
H_max (m)
-1.37
6.18
13.73
21.28
28.83
SE
ED
LIN
GS
(n
o.
ind
ivid
uals
)
0.00 0.05 0.10 0.15 0.20
LA (m2)
-1.37
6.18
13.73
21.28
28.83
SE
ED
LIN
GS
(n
o.
ind
ivid
uals
)
0.00 0.05 0.10 0.15 0.20
LA (m2)
-2.75
12.39
27.54
42.69
57.83
SA
PL
ING
S (
no
. in
div
idu
als
)

91
between developmental stages give insights over the possible changes in the functional
characterization of tree cover within these disturbed areas due the different regeneration
capacities of these tree species with particular functional niches.
The abundance of adult trees was correlated with whole plant, leaf and dispersal
traits no matter the strongly variable factors influencing adult’s trees composition and
abundances in active pasturelands (Table 3.3). Adult tree abundances were strongly and
positively correlated with Vol_fru, Vol_see, H_max, PHE, Sha_fru, Sha_see, Mass_fru
and LCC, and were negatively correlated with LA, SLA and WD. Therefore, the tallest
and more deciduous tree species with lighter woods have the more abundant adult
populations. In addition smallest leaves with highest total carbon contents and therefore
a low specific leaf area were common leaf characteristics of the more abundant adult
tree species in these habitats. The biggest and longest diaspores with heaviest fruits
characterized also the tree species with the highest adult’s populations. These results
imply that the actual assemblage of adult’s trees in active pasturelands has a direct
association with functional species characteristics besides the complex convergence of
natural and anthropogenic selection exerted over this tree component in active
pasturelands.
The functional characterization of adult populations was similar to the functional
description found for the early developmental stages of tree species naturally
regenerating in active pasturelands. The more abundant seedlings and saplings
populations were found for taller tree species, with more conservative leaf in the use of
resources i.e. small leaves with high carbon and leaf dry matter content and with a low
specific leaf area, also with bigger and longest dispersules and heaviest fruits. However,
other plant traits were exclusive correlated with the abundances of early developmental
stages and not with the abundances of adult tree populations. Tree species with higher
total carbon and nitrogen for example were more abundant at saplings stages,
meanwhile also those with highest phosphorus in leaves and heaviest seeds were more
abundant as saplings, but none of these characteristics was correlated to more abundant
tree species at adult’s stages. Conversely, a higher abundance of tree saplings was
observed also for species with dense woods, meanwhile the more abundant adult tree
species have mainly softer woods.

92
Relationships of dispersal mode with abundance of tree natural
regeneration
Dispersal mode was correlated with tree abundances at the three different
developmental stages (Table 3.4). Mammalochory was positively correlated with
seedlings, saplings and adults abundances. In contrast, Zoochory was negatively
correlated with abundances of the three all tree developmental stages, but strongest with
adults abundances, followed by seedlings and tending to be correlated with saplings
abundances. Anemochory was also positively correlated with tree abundances but just at
adult tree stages. Finally, Autochory was not correlated tree abundances at any
developmental stages.
Table 3.4. Partial Spearman correlations coefficients between the abundances of natural
tree regeneration in active pasturelands (residuals) with whole plant, green and
dispersal traits including additional dispersal
Abundances Seedlings Saplings Adults
Dispersal types Est. p-value Est. p-value Est. p-value
Mamalochory 0,01 0,0108 0,01 0,0047 0,01 0,0001
Zoochory -4,70E-03 0,0396 -3,70E-03 0,0908 -0,01 <0,0001
Anemochory 4,10E-03 0,1519 3,20E-04 0,9101 0,01 0,0026
Autochory -3,70E-03 0,2372 -1,70E-03 0,5555 -1,30E-03 0,6443
These results showed that dispersal mode can predict abundances of tree natural
regeneration in active pasturelands. Those tree species dispersed by cattle were the
species having the most abundant tree regeneration in active pasturelands at all
developmental stages. Tree species dispersed by wind were also the most abundant
adult’s tree species, but were not so successfully at earlier developmental stages. Tree
species dispersed by wild animals like birds and bats were in contrast to the species with
the lowest abundances through the whole tree developmental stages. Tree species
dispersed by the same parental tree in contrast, didn’t have any particular association
with a more abundant or restricted tree natural regeneration in active pasturelands.
Multivariate relationship of plant traits with abundance of tree natural
regeneration
The multiple regression models showed that dispersal, leaf as well as whole
plant traits were also explaining more than half of the total interespecific variance

93
observed in tree natural regeneration abundances in active pasturelands. As observed in
the pair-wise plant traits and tree abundances relationships, some plant traits explained a
relevant proportion of inter-specific variability in the multivariate models for both early
tree developmental stages. Dispersal traits like Sha_fru and Sha_see, together with
whole plant traits like H_max and leaf traits like LDMC were predicting seedling and
also sapling abundances taking into account the interspecific and multivate variability,
underlying the key role of these traits in the successful of tree natural regeneration in
these areas (Table 3.5). In contrast, other plant traits have a multivariate predictive
value (p=0.05) within the fitted models only for one of the two developmental stages.
Leaf traits like LNC, LCC, LA and dispersal traits like Vol_Fru were predicting
seedlings abundances but not saplings abundances, indicating the more relevant role of
these leaf and dispersal traits to develop a successful seedling population in active
pastures.
A total of 55% of species variability in sapling abundance was explained
together by whole plant, leaf and dispersal traits (R2=0.55 and the adjusted R2 was
0.52), indicating that plant traits predict tree sapling abundances. The partial
determination coefficients (r2) were higher for dispersal traits like Sha_fru and for
whole plant traits like H_max, than for leaf traits and other dispersal traits like LDMC
and Sha_see. Therefore, dispersal and whole plant traits make the higher contributions
to explain the interspecific variability observed in saplings abundances.
A higher proportion of variability in saplings abundances, 67%, was explained
when adult tree abundances were also included within the multiple regression analyses
(R2=0.60, adjusted R
2=0.51). Now, tree adult abundances together with plant like
Sha_fru and LDMC explained together the abundances of tree saplings. Sha_fru had the
higest r2 values within this adult dependent model, followed by sapling abundances
together with LDMC.
In addition, 56% of species variability in seedling abundances was predicted by
whole plant, leaf and dispersal traits (R2=0.56; R
2 Aj=0.51). The variability observed in
seedling abundances was mainly predicted by dispersal traits like Sha_fru followed by
H_max, Sha_see, LNC, LA, Vol_fru and finally LDMC (ranked by decreasing order in
partial determination coefficients r2). These results imply that unless dispersal and
whole plant traits make the highest contributions to explain seedlings abundances leaf
traits play also and important roles at this first stage. A higher proportion of variability
in saplings abundances, 67% was explained when adult tree abundances were also
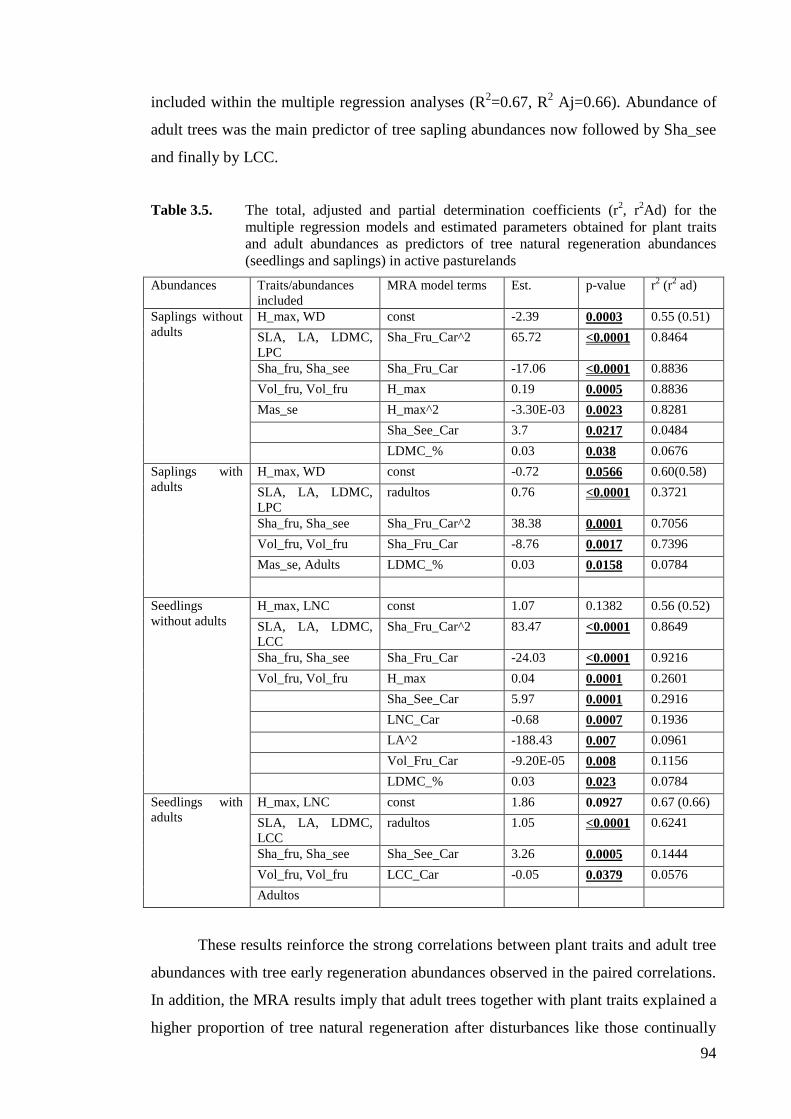
94
included within the multiple regression analyses (R2=0.67, R
2 Aj=0.66). Abundance of
adult trees was the main predictor of tree sapling abundances now followed by Sha_see
and finally by LCC.
Table 3.5. The total, adjusted and partial determination coefficients (r2, r
2Ad) for the
multiple regression models and estimated parameters obtained for plant traits
and adult abundances as predictors of tree natural regeneration abundances
(seedlings and saplings) in active pasturelands
Abundances Traits/abundances
included
MRA model terms Est. p-value r2 (r
2 ad)
Saplings without
adults
H_max, WD const -2.39 0.0003 0.55 (0.51)
SLA, LA, LDMC,
LPC
Sha_Fru_Car^2 65.72 <0.0001 0.8464
Sha_fru, Sha_see Sha_Fru_Car -17.06 <0.0001 0.8836
Vol_fru, Vol_fru H_max 0.19 0.0005 0.8836
Mas_se H_max^2 -3.30E-03 0.0023 0.8281
Sha_See_Car 3.7 0.0217 0.0484
LDMC_% 0.03 0.038 0.0676
Saplings with
adults
H_max, WD const -0.72 0.0566 0.60(0.58)
SLA, LA, LDMC,
LPC
radultos 0.76 <0.0001 0.3721
Sha_fru, Sha_see Sha_Fru_Car^2 38.38 0.0001 0.7056
Vol_fru, Vol_fru Sha_Fru_Car -8.76 0.0017 0.7396
Mas_se, Adults LDMC_% 0.03 0.0158 0.0784
Seedlings
without adults
H_max, LNC const 1.07 0.1382 0.56 (0.52)
SLA, LA, LDMC,
LCC
Sha_Fru_Car^2 83.47 <0.0001 0.8649
Sha_fru, Sha_see Sha_Fru_Car -24.03 <0.0001 0.9216
Vol_fru, Vol_fru H_max 0.04 0.0001 0.2601
Sha_See_Car 5.97 0.0001 0.2916
LNC_Car -0.68 0.0007 0.1936
LA^2 -188.43 0.007 0.0961
Vol_Fru_Car -9.20E-05 0.008 0.1156
LDMC_% 0.03 0.023 0.0784
Seedlings with
adults
H_max, LNC const 1.86 0.0927 0.67 (0.66)
SLA, LA, LDMC,
LCC
radultos 1.05 <0.0001 0.6241
Sha_fru, Sha_see Sha_See_Car 3.26 0.0005 0.1444
Vol_fru, Vol_fru LCC_Car -0.05 0.0379 0.0576
Adultos
These results reinforce the strong correlations between plant traits and adult tree
abundances with tree early regeneration abundances observed in the paired correlations.
In addition, the MRA results imply that adult trees together with plant traits explained a
higher proportion of tree natural regeneration after disturbances like those continually
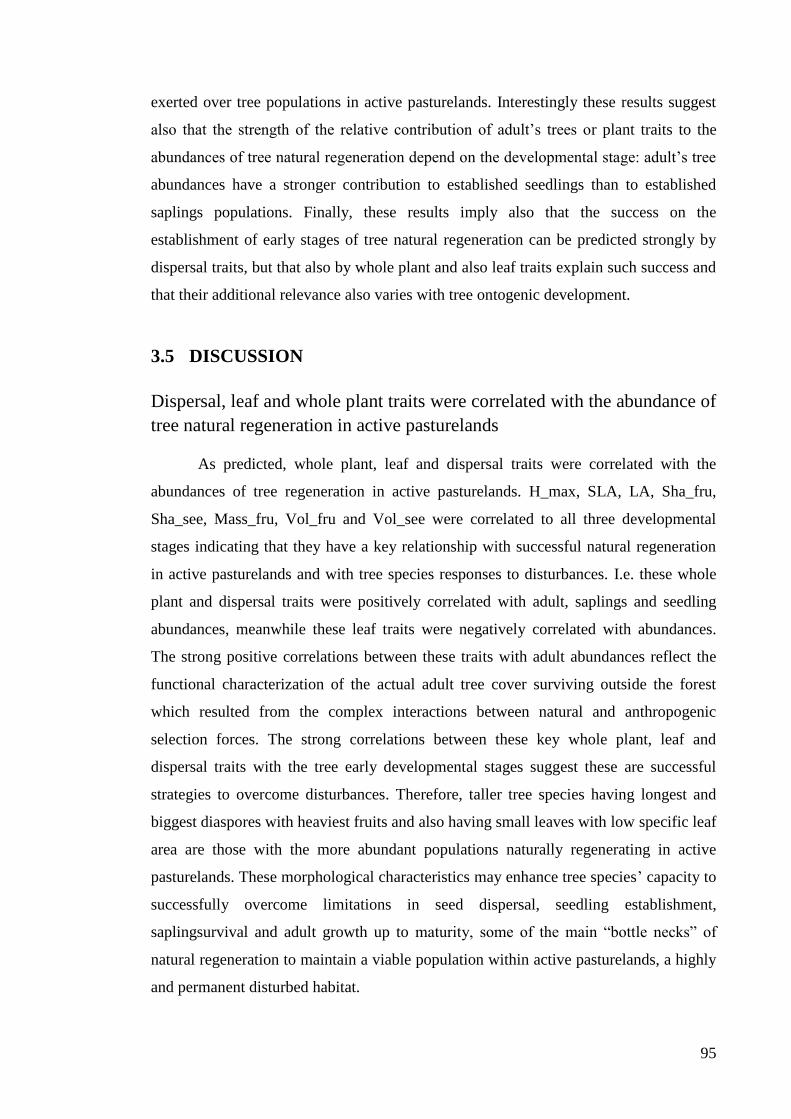
95
exerted over tree populations in active pasturelands. Interestingly these results suggest
also that the strength of the relative contribution of adult’s trees or plant traits to the
abundances of tree natural regeneration depend on the developmental stage: adult’s tree
abundances have a stronger contribution to established seedlings than to established
saplings populations. Finally, these results imply also that the success on the
establishment of early stages of tree natural regeneration can be predicted strongly by
dispersal traits, but that also by whole plant and also leaf traits explain such success and
that their additional relevance also varies with tree ontogenic development.
3.5 DISCUSSION
Dispersal, leaf and whole plant traits were correlated with the abundance of
tree natural regeneration in active pasturelands
As predicted, whole plant, leaf and dispersal traits were correlated with the
abundances of tree regeneration in active pasturelands. H_max, SLA, LA, Sha_fru,
Sha_see, Mass_fru, Vol_fru and Vol_see were correlated to all three developmental
stages indicating that they have a key relationship with successful natural regeneration
in active pasturelands and with tree species responses to disturbances. I.e. these whole
plant and dispersal traits were positively correlated with adult, saplings and seedling
abundances, meanwhile these leaf traits were negatively correlated with abundances.
The strong positive correlations between these traits with adult abundances reflect the
functional characterization of the actual adult tree cover surviving outside the forest
which resulted from the complex interactions between natural and anthropogenic
selection forces. The strong correlations between these key whole plant, leaf and
dispersal traits with the tree early developmental stages suggest these are successful
strategies to overcome disturbances. Therefore, taller tree species having longest and
biggest diaspores with heaviest fruits and also having small leaves with low specific leaf
area are those with the more abundant populations naturally regenerating in active
pasturelands. These morphological characteristics may enhance tree species’ capacity to
successfully overcome limitations in seed dispersal, seedling establishment,
saplingsurvival and adult growth up to maturity, some of the main “bottle necks” of
natural regeneration to maintain a viable population within active pasturelands, a highly
and permanent disturbed habitat.
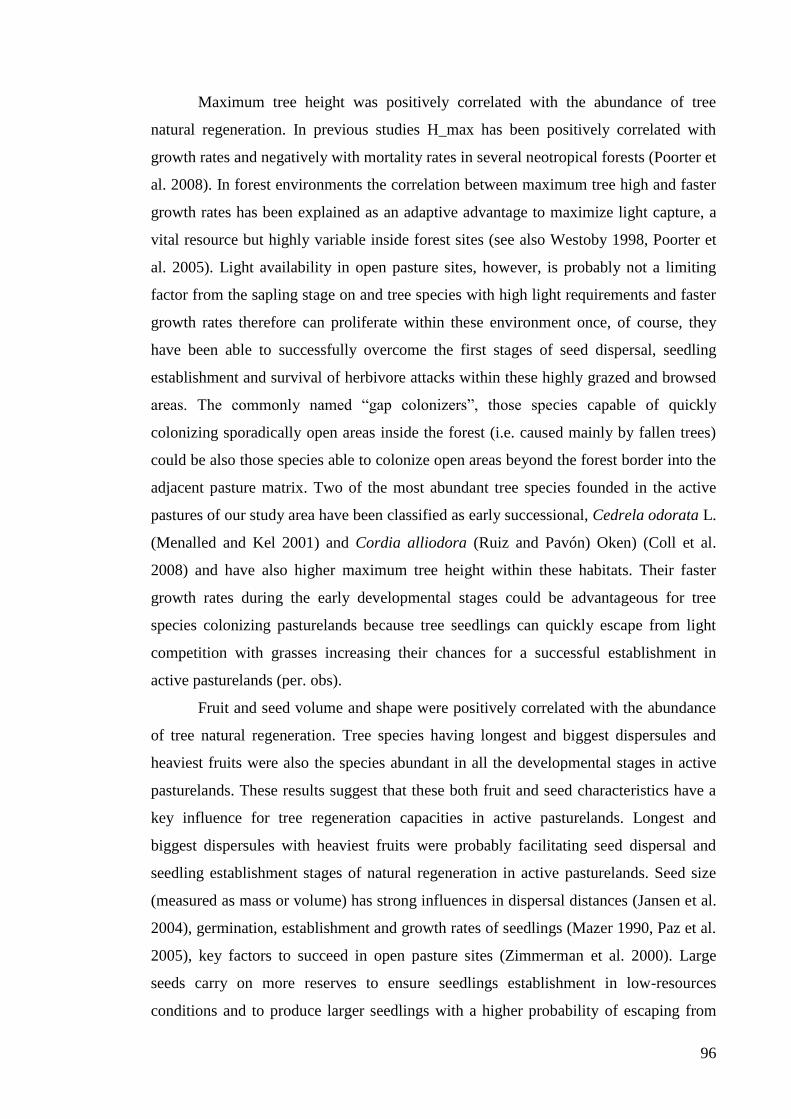
96
Maximum tree height was positively correlated with the abundance of tree
natural regeneration. In previous studies H_max has been positively correlated with
growth rates and negatively with mortality rates in several neotropical forests (Poorter et
al. 2008). In forest environments the correlation between maximum tree high and faster
growth rates has been explained as an adaptive advantage to maximize light capture, a
vital resource but highly variable inside forest sites (see also Westoby 1998, Poorter et
al. 2005). Light availability in open pasture sites, however, is probably not a limiting
factor from the sapling stage on and tree species with high light requirements and faster
growth rates therefore can proliferate within these environment once, of course, they
have been able to successfully overcome the first stages of seed dispersal, seedling
establishment and survival of herbivore attacks within these highly grazed and browsed
areas. The commonly named “gap colonizers”, those species capable of quickly
colonizing sporadically open areas inside the forest (i.e. caused mainly by fallen trees)
could be also those species able to colonize open areas beyond the forest border into the
adjacent pasture matrix. Two of the most abundant tree species founded in the active
pastures of our study area have been classified as early successional, Cedrela odorata L.
(Menalled and Kel 2001) and Cordia alliodora (Ruiz and Pavón) Oken) (Coll et al.
2008) and have also higher maximum tree height within these habitats. Their faster
growth rates during the early developmental stages could be advantageous for tree
species colonizing pasturelands because tree seedlings can quickly escape from light
competition with grasses increasing their chances for a successful establishment in
active pasturelands (per. obs).
Fruit and seed volume and shape were positively correlated with the abundance
of tree natural regeneration. Tree species having longest and biggest dispersules and
heaviest fruits were also the species abundant in all the developmental stages in active
pasturelands. These results suggest that these both fruit and seed characteristics have a
key influence for tree regeneration capacities in active pasturelands. Longest and
biggest dispersules with heaviest fruits were probably facilitating seed dispersal and
seedling establishment stages of natural regeneration in active pasturelands. Seed size
(measured as mass or volume) has strong influences in dispersal distances (Jansen et al.
2004), germination, establishment and growth rates of seedlings (Mazer 1990, Paz et al.
2005), key factors to succeed in open pasture sites (Zimmerman et al. 2000). Large
seeds carry on more reserves to ensure seedlings establishment in low-resources
conditions and to produce larger seedlings with a higher probability of escaping from
97
size-dependent mortality and from hervibore damage (Kitajima 2002, Harms and
Dalling 1997). In open areas outside the forest like in active pasturelands, tree species
with biggest seeds probably also benefit with a higher content of reserves to produce big
seedlings that can establish in low-resources conditions, to quickly overcome the dense
grass cover and survive herbivorous damage.
Bigger seeds were positively correlated to tree abundances in all developmental
stages, indicating that tree species with bigger seeds have more abundant tree natural
regeneration in active pasturelands. Bigger seeds have been correlated with an increased
capacity to grow with low resource availability (Westoby et al. 2002), lower seed
production (Henery and Westoby, 2001) and a reduced probability of reaching safe sites
(Wright et al. 2006). In contrast, our results indicate that tree species with bigger seeds
(volume) are predictors of a more abundant seedling bank in active pasturelands. As
stated by Westoby et al. (2002) probably the higher resources allocation within the
biggest seeds (measured as seed mass or volume) increases the probability of successful
seedling establishment in the face of environmental hazards that in active grasslands
could be determinated by low water and nutrients availability and high grass
competition (Zimmerman et al. 2000).
The longest dispersules with bigger and heaviest fruits were related with
particular seed dispersal strategies that probably increase seeds probabilities to reach
safety places increasing also further seedling establishment rates. As stated in our
previous chapter 2, dispersule shapes, masses and volume have been found correlated
with dispersal modes: small and spherical seed and fruits have been found to be
dispersed by local fauna, meanwhile longest fruits with longest and lighter seeds have
been mainly dispersed by wind, and biggest and heaviest fruits with heaviest seeds have
been found to be dispersed mainly by cattle. In addition, we observed that tree
regeneration abundances were also significatively correlated with tree species main
dispersal mode. Tree species dispersed by cattle (a particular kind of mammalochory)
were the more abundant tree species in all developmental stages. Fruits dispersed by
cattle tend to have the biggest and heaviest fruits with heaviest seeds. Once consumed,
cattle dung provides an enhanced microhabitat for seed germination and seedling
establishments through a substrate that reduce grass competition and cattle damage
through grazing and browsing (Malo and Suarez 1995, Cosyns et al. 2005).
In contrast, those tree species with seed mainly dispersed by wild fauna had
lower abundances in all tree developmental stages. These tree species in fact have more
98
spherical, small and lighter dispersules. The highly fragmented tree habitat component
of active pasturelands probably restricts wild fauna mobilization reducing the seed rain
to under tree canopies reducing therefore their relative abundances within these
ecosystems. In addition, tree species having morphological adaptations for wind
dispersed seed were also abundant in adult stages, but such high abundance of mature
trees with anemochorous dispersion was not reflected in higher abundances of early
developmental stages. In the previous chapter 2, we observed that wind dispersed trees
were correlated with lower seed masses. A low seed size has been found in species with
a high density of seeds by dispersule unit, being considered also better colonizers of
ephemeral sites in space and time (Dalling et al. 1998, Moles et al. 2004). Wind was
probably a more successful seed dispersion vector to reach the open pasturelands
matrix, but their successful seedling and sapling establishment will depend on reaching
a successful microsite and growing quickly enough to avoid grass competition for light
and water. Unless faster growth rates could be can be observed for tree wind dispersed
species like Cordia alliodora, it is probabe that their further success in seedling and
sapling establishment probably depends on additional characteristics like defense
against herbivorous attacks. Therefore unless wind dispersed seeds could easily reached
open pasture areas, this condition does not imply higher abundances of tree natural
regeneration in disturbed areas.
Appropriated strategies to survive the herbivore attacks are also required for tree
species to proliferate their populations in active pasturelands together with an
advantageous seed dispersal mode and high establishment rates. We found that SLA and
LA were negatively correlated with adult, saplins and seedling abundances. The more
abundant tree species have small but expensive leaves having a higher investment in
carbon for their construction. Low SLA leaves tend to be thicker and dense and
physically robust and less attractive to herbivores than leaves with a high SLA (Coley
1985, Wright and Westoby 2002). Low SLA leaves tend to be longer lived and may
lead to longer plant life spans (Sterck et al. 2006). Kitajima (1994) found that SLA was
a good predictor of seedlings growth and survival and Poorter and Bongers (2006)
founded that SLA was good predictor of sapling height growth. Our results suggest
however that SLA has a key role in the survivorship of trees at all developmental stages
in active pasturelands, when tree species abundances of early developmental stages
increases consistently when SLA decreases. Tree leaves with a higher investment of
99
biomass in producing leaf area are probably a good defense against herbivore attack and
damages due to cattle grazing and browsing.
Other plant traits were correlated exclusively with early stages of development
suggesting that maybe different morphological characteristics during the development
of trees can increase tree species survival during the natural regeneration in active
pasturelands. LDMC was positively correlated with seedling and sapling abundance but
not with adult abundance, indicating a stronger relationship with early tree
establishment stages and therefore a key role enhancing seedling and sapling
establishment. Higher amounts of biomass invested in leaves probably enhance seedling
and sapling defense against herbivores due to increase in physical strength of leaves or
due to reduced leaf palatability for consumers (Elger and Willby 2003). We didn’t find
a significant correlation between tree species abundance and FTF to support that LDMC
can also increase the physical resistance to damage due to cattle grazing or browsing.
However, FTF measures leaf resistance to tearing, while higher LDMC in leaves
probably implie an increase of more recalcitrant C fractions like lignin, celluloses and
memicelluloses or other secondary metabolites which reduce leaf digestibility or
palatability mainly for cattle, so that both traits may affect grazing palatability (Coley et
al. 1985, Hanley and Lamont 2002).
LCC and LNC were positively correlated with seedling abundance, and therefore
tree species with higher carbon and nitrogen content in leaves have more abundant
individuals at early developmental stages. LCC was positively correlated also with adult
abundances and therefore the higher abundance of seedlings of those tree species with
higher LCC could be though to reflect only the higher dispersule sources (more
dispersible potential sources then more seeds dispersed and more seedlings
abundances). However, LCC has been also positively correlated with defense against
herbivores consumption and negatively with palatability as measured by the amount of
structural carbon invested to construct one functional leaf and with leaf C/N-ratio
(Schädler et al. 2003). Therefore, these species probably experienced lower mortality
rates due to herbivore attacks allowing them to develop more abundant seedling
populations. Unpalatable leaves have low LNC and high leaf tensile strength, which
depends on LDMC (Pérez-Harguindeguy et al. 2000, Wardle et al. 2002), these traits
determining also carbon-rich structural compounds and high recalcitrant C fractions like
lignin, which strengthen leaves significantly (Choong et al. 1992, Wright and Illius

100
1995) and determine leaf digestibility and litter decomposition (Swift et al. 1979,
Melillo et al. 1982, Schädler et al. 2003).
Conversely to the low palatability hypothesis, LNC was also positively
correlated with seedling abundance, indicating that other additional mechanisms are
also feasible to develop a successful population or seedlings in active pastures. In
contrast to LCC, LNC was not correlated with adult abundance, indicating that those
tree species with higher nitrogen content on leaves have must a more successful seed
dispersal, germination and/or seedlings establishment rates, independently of adult
abundances and to the higher risk of mortality due to higher palatability associated to
higher LNC. Therefore, the strategy of tree species to have higher abundances of
saplings in active pasturelands, probably rely not only on the reduction of herbivore
damage risk, but also in another mechanism evidenced by the correlations with other
traits. In fact, as stated previously, the higher abundances of seedlings were also
positively correlated with H_max and dispersal traits, even more than with saplings
abundances, probably due to higher photosynthetic rates required for tree species with
higher growth rates allow them to quickly escape from competitions and herbivores
within the preexisting vegetation. In addition, tree species with higher LNC as well as
those with higher early regeneration abundances, were positively correlated with
specific dispersal strategies like mammalochory, which provide additional advantages to
this species via cattle dung, serving as an enriched environment and as a physical
defense against herbivores and competition.
In addition, a good defence against herbivores has been also related with high
quality leaves, like those with higher nitrogen contents. Tree species with high quality
leafs but well defended against herbivores will have clear advantages to succeed their
populations in active pasturelands. Leaves with higher nitrogen contents have been
related with higher photosynthetic rates in full sun exposures. In contrast, long-term
shading of isolated plants generally results in leaves that have a lower photosynthetic
capacity and leaf nitrogen content per unit area, and a larger investment of total
available nitrogen in chlorophyll and light-harvesting compounds (Evans, 1996;
Hikosaka and Terashima, 1996; Evans and Poorter, 2001). Apart from the decrease in
leaf thickness, shading also causes a decrease in leaf density, the net result being a
higher amount of leaf area formed per unit of biomass invested in leaves (Poorter et al.
2005). Therefore, in open pastureland the high availability of sun exposure is a
favourable environment for tree species with high photosynthesis requirements and low
101
palatability, which can develop here successful populations ones of course they have
been able to successfully overcome seed dispersal and germination.
LPC and Mass_see were plant traits also marginally correlated but only with
sapling abundances, indicating that tree species with low leaf phosphorus contents and
with heaviest seeds could have higher saplings abundances. Biggest seeds (according to
volume or mass) have been related with more parental resources to grow quickly
escaping from the high mortality rates at early developmental stages. The positive
tendency in the relationship between Mass_See with seedlings abundances could
support this idea but the lack of significance indicates that other more relevant
mechanisms and morphological traits could be implicated on assuring higher
abundances at seedling stages like an inherent faster growth (reflected by the positive
correlations of H_max with seedling abundances) and more conservative leaves with
low palatability and desiccation risks (reflected by the negative correlations of LA, SLA
and LPC but positive with LDMC). A reduced content of phosphorus in leaves reflected
only in saplings stages probably reflects the strong influence that the plant strategy to
obtain nutrients have on the saplings stages when all the mineral nutrients for growing
comes from the environment and not from the maternal resources which favoring
seedlings growth or neither by massive internal redistributions of nutrient as can happen
in adult trees (Pallardi 2008). Therefore, although a tendency for those tree species with
more conservative leaves to have more abundant seedlings populations; the
relationships with other traits make possible the identification of further successful
strategies to overcome limitations in active pasture site colonization.
Functional characterization of adult tree cover in active pasturelands
Natural interactions, historic disturbances and farmers’ decisions shape adult
tree cover in agricultural lands (Harvey at al 2006). Management strategies affect tree
regeneration richness and composition shaping biodiversity of future tree cover outside
forest (Esquivel et al. 2008). We do not attempt to explain the ultimate causes of the
observed correlations between plant traits with adult abundances due to the complex
interactions between natural and anthropogenic historical management. However, our
results showed the first functional description of the actual tree cover in agricultural
lands. This functional description has special relevance as agricultural landscapes cover
a higher proportion of land and have been consider an important source of biodiversity
within the highly fragmented tropical landscapes (Harvey et al. 2006). In addition to the
102
previous described correlations between plant traits and tree abundances (H_max, SLA,
LA, Sha_fru, Sha_see, Mass_fru, Vol_fru and Vol_see) found for adult tree abundances
as well as for early developmental stages, other plant traits were exclusively correlated
with adult tree abundances, reflecting all those complex interaction out of the scope of
the present study.
Leaf phenology and LCC for example, were positively correlated with adult
abundances; meanwhile wood density was negatively correlated, indicating a direct
relationship of these traits with tree species maintenance within these agricultural lands
located on dry transition to humid regions. Therefore, the most abundant adult tree
cover in active pasturelands is characterized by taller and deciduous tree species, with
soft woods, small leaves with higher total carbon content and low specific leaf area,
longest and biggest dispersules and heavy fruits. Whether these species are able to
naturally regenerate or not will probably affect future tree cover characterization. Other
plant traits were correlated only to adult abundances but not with seedling and sapling
abundances, like PHE, implying that leaf life spans per se is not a mopho-physiological
condition relevant to assure an abundant natural regeneration capacity of tree species in
active pasturelands.
WD was negatively correlated with adult tree abundances but positively
correlated with sapling abundance in active pasturelands. This result mean that tree
species with lighter woods were the most abundant tree species as adults but not as
sapling stages were tree species with dense woods are those able to develop abundant
sapling populations. WD has been found to be closely related with shade tolerance and
with some vital plant functions like defense, stability water relationships, carbon gain
and growth (Santiago et al. 2004). WD has been found negatively correlated with
growth and mortality rates in several neo-tropical forests (Poorter et al. 2008).
Therefore, tree species with lighter woods (low WD) grow faster but died more
frequently, have lower tensile strength at rupture and less elasticity, have a higher
capacity to store water but a lower capacity to store C than do species with dense woods
(high WD). Tree species with lighter woods has been successfully established as
individual adult in active pasturelands.
More abundant saplings populations of tree species with dense wood in active
pasturelands could be explained by an increase in resistance to herbivores damages. The
early stages of dense wood tree species probably have relatively more resistance to
physical damage by cattle due to higher WD of saplings stems which confer a higher

103
physical strength and flexibility increasing their capacity to successfully survive at
sapling stages. In addition, WD is generally correlated with a low SLA meaning that in
addition to stronger sapling stems to resist cattle physical damages when grazing, a low
SLA probably reduces herbivore consumption increasing again their chances to have an
abundant sapling population in active pasturelands. This is a parallel condition to the
observation inside forests, where a high wood fraction is advantageous for species that
mainly regenerate in the shade, because it is protected from falling debris, an important
mortality agent for understory tree species (Poorter et al. 2008) even seedlings and
saplings (Kitajima 1994, Muller-Landau 2004).
Adult abundance was strongly and positively correlated with sapling and
seedling tree abundance.
The strongest correlations with tree regeneration abundances in active
pasturelands were found for adults abundances, suggesting that the abundance of adult
trees has a relevant effect on tree regeneration capacity in active pasturelands and that it
could be a stronger predictor of plant responses to disturbance than functional traits.
These strong correlations between trees abundances were followed in strength the
relationships between tree regeneration abundances with dispersal, leaf and whole plant
traits respectively. These results confirm some observations made for other systems
such as by Sudding et al. (2005) in herbaceous ecosystems in temperate North America,
who find a negative relationship between abundance and extinction probability. These
results reinforce the importance of retaining and maintaining an abundant and diverse
adult tree cover within pastures and agricultural lands to encourage natural tree
regeneration (Mayfield and Dayly 2005, Esquivel et al. 2008). Several previous studies
have suggested that many tree species are unable to reproduce successfully and maintain
populations in pastures over the long term (Janzen 1986, Esquivel et al. 2008). The
limited seed rain (Radford et al. 2001) and the unfavorable microsites and microclimatic
conditions in open pasture (Nepstad et al. 1996, Holl et all 199) are known to reduce
tree colonization. Results like these suggest that environmental filtering during pasture
colonization should select for tree species with certain combinations of traits that
contribute to overcoming barriers to colonization of pastures, and that species lacking
these trait combinations will be slow to colonize. Our study supports this to an extent, as
already discussed. However, our results strongly indicate a simple positive relationship
between seed availability – determined by adult abundance – and regeneration
104
abundance suggesting that colonization of these pasture is effectively trait-neutral or
trait-random (see Suding et al. 2005)
A higher abundance of adults also has been positively related with a higher
genetic diversity implying that more but also better seeds will be dispersed from a more
abundant mature population, increasing the probabilities for a successful germination
and establishment. Grass competition (Schaller et al. 2003), cattle grazing (Archer
1995) and pasture management (Teague and Dowhover 2003) also limit tree
regeneration in active pasturelands. The strong positive correlations between seedlings
and sapling abundances we observed imply in addition that a higher number of
seedlings increase the probability by chance to successfully survive and growth to the
next developmental stage due the higher mortality rates that prevailed in these
continually disturbed environment.
The fact that most but not all the observed correlations among plant traits with
tree abundances were observed for adults trees and also for early developmental stages,
indicates that together with adult tree abundances the functional composition of such
tree cover are relevant because is going to be maintain through the future population.
However the fact that some relationships between plant traits and abundances were
found only in the early developmental stages, let open the gap in which the functional
traits have a relevant role also in the prediction of tree natural regeneration after
disturbances.
Plant traits predict the abundances of tree natural regeneration in active
pasturelands, but adult abundance is the strongest predictor.
Whole plant, leaf and dispersal traits predict tree regeneration abundances in
active pasturelands. A total of 55% and 56% of species variability in sapling and
seedling abundances were explained together by whole plant, leaf and dispersal traits
indicating that plant traits predict an important percentage of tree natural regeneration
abundances. The fact that dispersal together with leaf and whole plant traits were found
in both models indicates also that only and integrative assessment of plant functional
traits make it possible to predict a relevant proportion of inter-specific variability in
responses after disturbances. Tree sapling abundance was predicted by Sha_fru, H_max,
LDMC and Sha_see; meanwhile tree seedling abundance was predicted by H_max,
Sha_see, LNC, LA, Vol_fru and finally LDMC.

105
Dispersal traits like Sha_fru and Sha_see, together with whole plant traits like
H_max and leaf traits like LDMC were predicting seedling and also sapling abundances
underlying they key role in the successful of tree natural regeneration in these areas.
These results agree with our previous expectations about a relevant role of dispersion
traits over the population composition and structure of trees outside the forest. Sha_fru
and Sha_see have been found correlated with different dispersal modes (see Chapter 1
results): longest fruits has been correlated with anemochorus and autochorus tree
species while more spherical fruits and seeds were related with zoochorus tree species
dispersed mainly by local fauna. More abundant tree species as seedlings and sapling
were mainly dispersed by big mammals like cattle, meanwhile the less abundant tree
species were those dispersed by zoochorus tree species. Therefore longest fruits and
seeds were dispersed by more successful vectors to reach wide open pasture sites. In
addition, the potentially higher growth rates associated with tree species with higher
maximum tree heights and strongest leaf to avoid herbivorous damages, define optimal
strategies to successfully overcome the limited dispersal, early establishment and
growth of tree species in after disturbances in active pasture sites.
Leaf traits like LNC, LCC, LA and dispersal traits like Vol_Fru were predicting
seedling abundance but not saplings abundances, indicating the more relevant role of
these leaf and dispersal traits to predict the successful establishment on the post-
germination earlier tree ontogenic populations.
As expected, higher percentages of variability can be explained with the
inclusion of adult abundances. A total of 67% of tree species variability was predicted
by tree adult abundances and plant traits. These reinforce the strong correlations
between plant traits and adult tree abundances with tree early regeneration abundances
observed in the paired correlations. In addition, the MRA results imply that adult trees
together with plant traits explained a higher proportion of tree natural regeneration after
disturbances like those continually exerted over tree populations in active pasturelands.
Sha_fru and LDMC together with tree adult abundances predicted saplings abundances;
instead tree adult abundances together with Sha_see and LCC predicted saplings
abundances. Interestingly these results suggest also that the strength of the relative
contribution of adult trees or plant traits to the abundances of tree natural regeneration
depend on the developmental stage: adult tree abundances have a stronger contribution
to established seedlings than to established saplings populations. Finally, these results
imply also that the success on the establishment of early stages of tree natural

106
regeneration can be predicted strongly by dispersal traits, but that also by whole plant
and also leaf traits explain such success and that their additional relevance also varies
with tree ontogenic development. However, unless plant traits do predict the
abundances of tree natural regeneration in active pasturelands, adult abundance is the
strongest predictor.
3.6 CONCLUSIONS
Tree species’ capacity to naturally regenerate in active pasturelands is related
with different plant traits which are characterized by four main plant traits dimensions,
namely: leaf, stem density, canopy height and reproductive variability spectrums.
Adult tree cover was dominated by taller deciduous tree species, with expensive
investments in dispersules (fruits and seed) and wind or cattle dispersion, dominating
also further tree cohorts, more specifically:
Taller deciduous tree species with softer woods, small and more
conservative leaves (low SLA, high LCC) with expensive (big, heavy)
and longer fruits carrying big and longest seeds dispersed by wind and
cattle represented the most abundant adult tree cover. Taller tree species
with conservative leaves (high LDMC) and expensive fruits dispersed by
cattle were also more abundant at both early developmental stages.
However, some successful plant traits at seedlings and saplings tree stages were
different from those successful in adult tree cover. In response to the presence of cattle
and other factors associated with active pastures, tree species with denser woods, low P,
high N and more expensive seeds dispersed by cattle, have more abundant early
development stages. More specifically:
Tree species with denser woods, P rich leaves and expensive seeds
(heaviest) have more sapling abundances, meanwhile those tree species
with C and N rich leaves have more abundant seedlings.
Tree species dispersed by cattle have abundant seedlings and saplings banks in
active pasturelands, while tree species dispersed by local fauna were limited in all
developmental stages.
Adult tree abundances were strongest predictor of tree seedlings and saplings
abundances in active pastures but a higher proportion (i.e. between 60 and 67%) of
107
species abundance variability was explained by both adult tree abundances and plant
traits.
Present tree cover is dominated by particular tree characteristics with higher
capacity to naturally regenerate. However actual pasturelands managements are
favoring different plant traits at sapling and seedlings stages, probably dominating
future tree cover under current management practices.
As a consequence, actual tree functional diversity in active pasturelands will
decrease due to the limited capacity of some trees (with particular leaf, reproductive and
whole plant traits) to naturally regenerate under actual pastureland management
possibly affecting future ecosystems process in agricultural landscapes.
.

108
CHAPTER 4. LITTER QUALITY AND
DECOMPOSABILITY OF NEOTROPICAL TREE
SPECIES WITH DIFFERENT CAPACITY TO
NATURALLY REGENERATE IN ACTIVE
PASTURELANDS
4.1 ABSTRACT
The link between plant characteristics and ecosystem processes is important for
the sustainability of the agro ecosystems and has received too limited attention
especially regarding the high diversity tropical lands continually threatened by land use
changes from forest to agricultural systems. This research explores for the first time the
relation between plant functional traits, decomposition rates and nutrient releases for 37
Nicaraguan tree species with different capacities to naturally regenerate in agricultural
lands such as anthropogenic pastures. A total of 17 plant traits related to four main trait
variability dimensions like i) leaf, ii) stem ii) height and iv) reproductive spectrums
were measured on adult trees (dbh ≥ 10 cm). A decomposition experiment under
controlled conditions was established for monthly litterbags collection during four
months and seven chemical traits were measured on leaves, fresh and decomposed litter.
Finally, the abundance of saplings and seedlings of such species was surveyed in
managed pastures. We expand actual knowledge of the afterlife effect of leaf traits
directly to decomposition dynamics, carbon and nutrient cycling including a higher
number of tropical tree species than previous studies. We found that tree species with
high P, N, C in green leaves have also high P, N, C in fresh litter and that tree species
with acquisitive leaves decompose faster, release more N, P and C than more
conservative species. However, our results extend even further this afterlife effects
linking also particular C fractions contents of green leaves to different decomposition
dynamics. Another novel result was to observe that in addition to leaf traits, also stem
and reproductive traits are related with differences in litter quality, decomposition rates
and macronutrients releases during decomposition, thus linking the afterlife effect of
leaf traits directly with tree natural regeneration capacity. These significant relationships
outline that more abundant trees tend to have faster decomposition rates while less
abundant tree species tend to present slow leaf-decomposition rates.
109
Our findings indicate that plant characteristics are linked with ecosystem
processes such as litter decomposition and tree natural regeneration with implications
for important sustainability factors in agricultural systems such as nutrient and carbon
cycling.
Key words: ecosystem effects, leaf nutrients, carbon releases, C fractions, leaf
traits, reproductive traits, dispersal mode
4.2 INTRODUCTION
The decomposition of litter has important ecosystem-level implications through
regulating build up of soil organic matter, releasing nutrients that are available for plant
growth, and influencing the flux of CO2 from the soil (Wardle 2003). Resulting soil
properties, in turn, have strong impacts on plant community composition, diversity and
productivity (Wardle 2004). The diversity of plant tissues and decomposer
microorganisms can be considered the local biotic drivers of these soil and plant
feedbacks (Parton et al. 2007). Diverse plant tissues and their linked litter qualities
generate heterogenic substrates with contrasting quality affecting the activity of
microorganisms and, indirectly, plant growth (Dehlin et al 2006).
It is well accepted that variation between species in the properties of important
photosynthetic plant tissues like leaves can usefully be represented in terms of a major
axis of plant evolutionary trade-offs, which distinguish nutrient-acquisitive species with
high nutrient but low carbon contents, from nutrient-conservative species with the
opposite composition (Wright et al. 2004). More recent ecological research has focused
on the relationships between such plant functional traits and ecosystem processes such
as litter decomposition rates, to elucidate if the outcomes of plant evolutionary trade-
offs have clear consequences for soil-plant feedbacks (Thompson 2011). However,
these first approaches have come mainly from studies in temperate regions (e.g.
Vaieretti et al. 2005, Freschet et al. 2012) or focused on herbaceous species with only a
low proportion of woody species (Cornwell et al. 2008, Beaker et al. 2011).
How species loss in an ecosystem could affect ecosystem functioning has also
been a major question in ecology during recent decades (Lawton 1994) incorporating
various hypotheses of how ecosystem functioning would respond to biodiversity loss

110
and even to its restoration (Lake et al 2007). Such hypotheses include those of ‘rivet-
popping’ (Ehrlich & Ehrlich 1981), redundancy or “passengers and drivers” theory
(Walker 1992) and the diosyncratic ecosystem responses to species loss (Naeem 1998).
All of these theories place particular ecosystem responses to biodiversity within a
theoretical gradient of species’ effects from one extreme, where species have strong
similarities in their effects on system functioning (rivets), through the case where
individual species have very distinct effects (as a “driver”) as opposed to those species
that function as “passengers” to the other end of the gradient where individual species
have multiple effects which can change ecosystem functioning in unpredictable
directions (idiosyncratic). Some empirical results have continually support one or these
theories or another (Tilman et al. 1996).
As well as research focusing on the differences in litter effects between
individual species (the effect of “species identity”) others have focused on the effects of
the species richness of litter. Typically, Wardle (1997) found there to be no relationship
between species richness of litter and overall litter decomposition rate (Wardle 1997).
Hard et al. (2001) suggested that the three theories listed above describe aspects of the
same generalized theory but that the exact nature of the relationship between
biodiversity and ecosystem function depends on the scale of biodiversity and the
ecosystem evaluated (Hard et al 2001). It is widely recognized that better
characterization of the range of (bidirectional) relationships between biodiversity and
ecosystem functioning for different ecosystems is required to predict the impacts of
biodiversity loss, e.g. on delivery of ecosystem services. However, study of the effects
of biodiversity on ecosystem properties has mainly focused on net primary productivity
(Wardle 1997).
It is particulary important to research biodiversity-ecosystem function
relationships for tropical tree communities because of their high diversity (and
continued interest in evolutionary and ecological mechanisms creating and maintaining
this diversity) and because of their importance for global ecosystem function. However,
the practical challenges posed by this high diversity and the long-life spans of most trees
compared with most herbaceous species has limited research into the effects of loss of
tropical tree biodiversity. There is a lack of even basic descriptive information about the
variability of litter quality and decomposition rates amongst tree species within tropical
tree communities.
111
Nutrient cycling (and the role in this of litter decomposition) have special
relevance in tropical ecosystems because nutrient availability is a major limiting factor
to agricultural productivity on many old and depleted tropical soils after conversion
from forest (Turner et al. 2007). Many of these soils are deficient in N, P or both and
cannot support sustainable crop production without external inputs (Sanchez & Logan
1992). Inputs of organic matter from the leaf litter of trees has been found to play a
major positive role in the fertility of soils in tropical agroforestry systems through their
contribution to the maintenance and increase of soil organic matter, linked to the
recycling of nutrients (Young 1997). Some trees species can further enhance soil
fertility by adding N through N2-fixation (Mafongoya et al. 1998). However, the rate at
which nutrients are recycled via tree leaf litter depends on its rate of mass input, nutrient
concentration and decomposition rates, which in turn depends on litter quality, physico-
chemical environment and soil decomposer community (Teklay and Malmer 2004).
Some African tree species which produce leaf litter with a high concentrations of
tannins, which would be considered to make them of ‘poor quality’ in terms of rate of
decomposition, have been found to provide an improvement of soil organic matter
stocks with benefits for soil fertility and agricultural productivity (Teklay and Malmer
2004). The maintenance and improvement of soil fertility in tropical agroecosystems is
of critical importance to underpin food provisioning. It is a high priority to determine
how it is influenced by the identity and diversity of tree species retained within these
ecosystems.
The remaining, sometimes high, tree diversity in agricultural lands is endangered
worldwide (Esquivel et al. 2008, Gibbons et al. 2008, Fisc
her et al. 2009). The different capacities of tree species to reproduce and
maintain viable populations within these areas even when agricultural management is
intensified was predicted to lead to a reduction by half of the tree diversity in Central
America pasturelands by Esquivel et al. (2008). This will result in major changes in tree
community composition which is likely to have a major impact on ecosystem function
mediated, e.g., by leaf litter impacts on soil as described above (Vitousek et al. 1997,
Chapin et al. 2000, Díaz and Cabido 2001, Lavorel and Garnier 2002). However, the
high taxonomic diversity of tree cover recently reported in Central American
pasturelands (Harvey et al. 2006) has not been evaluated in terms of such aspects of
functional diversity. We do not know to what extent this taxonomic diversity is linked
112
to inter-specific differences in leaf litter qualities, neither if these inter-specific
differences in leaf litter quality will affect ecosystem process like decomposition and
nutrient cycling.
Few studies, however, have included a sufficiently wide range of tree species in
decomposition experiments to be able to extrapolate the effects of diversity in litter
quality on decomposition and nutrient cycling rates up to a whole diverse tropical tree
community. The most common approach has been to select no more than five
contrasting tree species to make a detailed description of their litter qualities and
comparisons of the litter decay curves in field conditions (Teklay and Malmer 2004).
Such studies have tended to select tree species belonging to different functional types
defined by categorical classifications like leaf phenology (deciduous and evergreen) and
N-fixation capacity, with the implicit assumption that other tree species with these same
characteristics also share the same chemical (e.g. C fraction, polyphenols and condensed
tannin concentrations) and physical (e.g. SLA, LA and FTF) litter quality properties, or
that the differences amongst them do not have significant effects on the observed
decomposition or nutrient cycling rates (Wedderburn and Carter 1999).
An increasing number of litter decomposition experiments in standard conditions
(e.g. “microcosms”) have been carried out during the past 20 years to evaluate litter
decomposability. However, in virtually all cases they include less than 20 species
(usually representing only a subset of the composition of a given plant community).
Most studies are focused on the evaluation of litter-by-substrate interactions rather than
comparisons between different plant tissues (Sariyildiz and Anderson 2003). Only
recently has the scope of laboratory and field decomposition experiments been
expanded using meta-analyses to make comparisons amongst many different studies
including large numbers of species worldwide (Cornwell et al. 2008). However, I have
found no published study of the decomposition rates of litter from > 20 tropical tree
species that are commonly present in tree communities on agricultural lands outside the
forest, such as anthropogenic pastureland. Extension of knowledge about the impact of
tree species on ecosystem function from natural systems to lands used for agricultural
food production is especially important because low and unsustainable productivity of
these lands threatens both human welfare and increased deforestation of remaining
forests worldwide (Gibbs et al. 2009).

113
The observed differences between species in leaf elemental content (especially
N, P and C) have been used to evaluate the effect that changes in species composition of
litter mixtures have on nutrient cycling and even ecosystem Net Primary Productivity
(NPP). Wedderburn and Carter (1999) suggested that a mixture of litter types could be
used to manipulate the timing of nutrient release to benefit pasture growth. They stated
that initial lignin and the lignin-to-N ratio content in leaf litter controls the rate of decay
thus predicting the relative abilities of the different tree species to release nutrients to
the pasture systems. They suggested that seasonal effects on leaf litter quantity and
quality were not as important as the over-riding chemical differences between tree
species. However, they only evaluated two common tree species with contrasting leaf
phenology (deciduous and evegreen) and N-fixing capacity. There have been many
studies on litter decomposition and nutrient release of tree species in tropical Africa
(Teklay and Malmer 2004), but few with a wide range of indigenous and tropical tree
species for the neotropics.
Leaf litter decomposition rates are regulated by physical (Cornelissen et al.
1999; Pèrez-Harguindeguy et al. 2000), chemical (Wardle 2002) and biotic factors
interacting between each other in their influence on the metabolism of fungi and
bacteria as the main agents of litter decomposition (Heal et al. 1997). There has been
much research on the effect on the rate of decomposition of the chemical litter quality
which is itself determined by the amount of water soluble C, including polyphenols
(Mafongoya et al. 1998, Hättenschwiler and Vitousek 2000), N and low lignin (Melillo
et al. 1982). Tree species with higher concentrations of nutrients (especially N) like total
P and the more labile C components (like polyphenols and tannins) tend to have faster
decomposition rates. In contrast, the concentration of more recalcitrant carbhoydrates
like lignin, celluloses and hemicelluloses tends to be associated with lower
decomposition rates. Physical characteristics have only tended to be included in litter
quality descriptions in recent studies; the two main characteristics used are specific leaf
area (Kazakou et al. 2006) and foliar strength (Pèrez-Harguindeguy et al. 2000, Dominy
et al. 2008). However, the intrinsic rates at which different leaf quality components
decompose through the process of leaf senescence and litter decomposition remain
largely unknown (especially for tropical tree species). Some studies about the role of
cellulose and lignin as regulating factors of litter decomposition rate have been reported
from temperate and boreal coniferous and deciduous forests and Mediterranean
ecosystems (Berg et al. 1996, Couteaux et al. 1998, Di Nardo et al. 2001, De Marco et

114
al 2012) but such information about tropical trees is scarce. The extent to which the
components of chemical leaf quality and its inter-specific variability in tropical trees
changes during leaf development (including senescence) and its correlation with other
leaf traits will be important in understanding the functional basis by which tree species
composition and diversity contributes to ecosystem nutrient cycling and inputs of soil
organic matter.
A number of leaf traits (especially specific leaf area, leaf nitrogen content and
leaf dry matter content) that are part of the ‘economics spectrum’ described by Wright et
al. (2004) at the leaf level, and tightly related to potential relative growth rate (RGR)
(Kazakou et al. 2006), are also considered to be related to leaf litter decomposition rate.
Leaf toughness, or resistance to fracture, may protect leaves from physical hazards such
as falling debris and trampling (Read and Stokes 2006), reduce mortality subsequent to
physical damage (Alvarez-Clare and Kitajima 2007) and enhance leaf life-span and
whole-plant survival, especially in shade conditions (Kitajima and Poorter 2010). This
leaf toughness has been found to be correlated with cell wall fiber content, which is also
known to reduce the digestibility of leaves (Sanson 2006). Kitajima and Poorter (2010)
found that some material properties of leaves (e.g. fracture toughness and tissue density)
but not others (e.g. lamina thickness) were negatively correlated with palatability to a
generalist herbivore and positively correlated with leaf life span, sapling survival, and
shade tolerance in 19 woody species from the Bolivian Amazon. Likewise, Alvarez-
Clare and Kitajima (2007) found that material toughness and tissue density (but not
structural toughness of leaves and stems) were positively correlated with seedling
survival of eight neotropical tree species. The specific relationship between leaf litter
decomposability and whole plant traits remains unexplored except as part of the wider
body of evidence in support of the “economics spectrum” model and the tendancy for a
trade-off between plant traits conferring rapid resource acquisition and those conferring
resource conservation (Fresquet et al 2012). No published studies have evaluated the
relationships between species’ leaf litter decomposition rates and both leaf traits and
whole plant traits (like wood density, maximum tree height and leaf phenology) as well
as seed dispersal traits (like fruit and seed masses, volume and shape, in order to give a
holistic overview of the contribution of species composition and diversity to ecosystem
function which encompasses both the potential of species to persist in disturbed,
managed agroecosystems as well as their role in nutrient cycling.

115
Addressing these knowledge gaps, this chapter evaluates the differences
amongst tree species abundant in Central American silvopasture in their decomposition
rates and the extent to which these rates are associated with leaf traits, then with other
whole-plant traits and finally (via those traits) with capacity for natural regeneration in
active pasturelands. A further objective was to assess the extent to which the rate of
decomposition of different leaf mass fractions was correlated with the rate of loss of
total litter mass (as an indicator of overall decomposition rate). This is important to
assess whether the rate of total litter mass loss is a good indicator of the contribution of
litter decomposition to nutrient cycling and inputs of soil organic matter. Four
consecutive approaches were developed to meet these objectives. In the first, three main
questions about the variability of species decomposition rates and their correlation with
leaf traits were addressed, namely: i) how much do tree species differ in their rates of
leaf litter decomposition, and in their foliar composition of macronutrients and C
fractions? ii) are leaf litter decomposition rates of tree species correlated with nutrient
and C fraction concentrations in fresh leaves and in fresh litter? and iii) to what extent
are tree species’ nutrient and C fraction concentrations in fresh leaves correlated with
those in fresh litter (or are they heavily altered by variation amongst species in their
rates of nutrient reabsorption (or leaching) during foliar senescence)? The rationale for
these questions relates to the importance of knowing the extent to which tree species
differ not only in green leaf traits, but also in litter quality, decomposition rates, and
potential to release macronutrients and C fractions which can bring new insights into the
afterlife effects of traits known to be strongly linked to the leaf economics spectrum.
In the second approach, more mechanistic questions were addressed about the
relationships between macronutrient and C fraction concentrations measured in green
leaves and in fresh litter with their losses during the litter decomposition process. I ask:
i) whether the rate of decomposition of each of the different leaf mass fractions is
strongly correlated the rate of loss of total litter mass (as an indicator of overall
decomposition rate), or whether the rates of decomposition of these fractions varies
greatly (if so the resulting question is how much species differ in their relative rates of
decomposition amongst these fractions)?; ii) which model best fits the rate of
decomposition of the different fractions? and iii) where decomposition rates of the C
fractions do differ amongst tree species, which are best predicted by different foliar
traits? If tree species differ in their rates of decomposition of different C fractions, and
this difference is predicted by some leaf traits, this has consequences for how the

116
“functional diversity” of tree species (as characterized by these traits) contributes to
ecosystem function in terms of rates of nutrient cycling and inputs of soil organic
matter.
In the third approach, questions were addressed about the relationships of whole
plant and dispersal traits with litter quality traits and rates of decomposition and nutrient
release. The first question is whether whole-plant traits and traits of non-foliar organs
(especially those linked to the plant resource use-conservation economics axis) correlate
with foliar litter quality and decomposition rates. For the set of species included in this
study I evaluated both the linkage between leaf traits and the “afterlife” litter
decomposition rates and between leaf traits and whole plant traits.
The fourth stage addresses the ultimate purpose of this study: to evaluate if there
is a functional trait-based relationship between the regeneration capacity of tree species
in managed pasturelands and their impact on ecosystem function via leaf litter
decomposition and nutrient release rates. The following question was addressed: Do tree
species with different capacities to regenerate naturally in managed pasturelands differ
in their leaf litter decomposition and nutrient releases rates? If so, a subsidiary question
is which functional leaf traits are most strongly associated with this correlation.
Several hypotheses were developed for each of these four stages of the research.
For the first stage, I hypothesize that the species comprising diverse tree cover
commonly found in active pasturelands in Central America (Esquivel et al. 2008) differ
in their litter quality, litter decomposition rates and nutrient release rates. I predict that
foliar nutrient and C fraction concentrations are tightly correlated with their
concentrations in fresh litter across species and therefore that foliar traits predict leaf
litter decomposition rates. In terms of chemical concentrations, I specifically predict
that LNC, LPC and SOL are positively correlated with leaf litter decomposition rates,
and that LCC, LDMC, LIG, HEM and CEL are negatively correlated with leaf litter
decomposition rates. In terms of physical leaf traits, I predict that: SLA is positively
correlated with leaf litter decomposition rate, however LA is positively correlated with
LNC and LPC, and FTF is positively correlated with LDMC, LIG, HEM and CEL, and
therefore both and are negatively correlated with leaf litter decomposition rates.
For the second stage, I hypothesize that macronutrient and C fraction
concentrations in green leaves are correlated with their concentrations in fresh litter. For

117
the macronutrients (LNC and LPC) and the soluble carbohydrate (SOL) I predict that
their foliar concentrations also predict their rate of loss during leaf litter decomposition.
I also predict that the concentration of recalcitrant carbohydrate fractions (LIG, HEM,
CEL) in green leaves are correlated with their concentrations in fresh litter but
negatively with the rate of leaf litter decomposition. Species with litter that decomposes
more quickly are also predicted to have a higher rate of decomposition of the
recalcitrant carbohydrate fractions that it contains. In relation to the changes in
concentration of nutrients and C fractions I predict that losses of the more labile nutrient
and C fractions will be greater during senescence than during decomposition, however
the opposite will be true for the recalcitrant fractions (provided that the studied time
period of litter decomposition is long enough). I also hypothesize that the rate of loss of
total litter mass is strongly correlated with the rate of decomposition of each of the
different leaf mass fractions. I predict that the rate of loss of total litter mass is
positively correlated with the losses of the labile fractions but negatively correlated with
the losses of recalcitrant fractions.
For the third stage, I hypothesize that a range of plant morphological traits (i.e.
not only foliar traits but also whole plant and dispersal traits) of tree species found in
active pasturelands are correlated with rates of leaf litter decomposition and nutrient
release. I specifically predict that the whole plant traits WD, Hmax and PHE and the
dispersal-related traits Mass_fru, Mass_see, Vol_fru, Vol_see, Sha_fru and Sha_see are
all correlated with rate of litter decomposition and nutrient release. If such correlations
occur, I predict that they will be linked to foliar traits associated with the plant resource
use-conservation axis. I specifically predict that H_max and PHE are positively
correlated with foliar concentration of macronutrients and therefore with rates of leaf
litter decomposition and nutrient release. I predict that the correlation with leaf litter
decomposition rate will be stronger for PHE than for H_max because PHE will be more
strongly negatively correlated with LDMC, LCC, LIG, HEM and CEL. In contrast I
predict that WD, Mass_Fru, Vol_Fru, Mass_See and Vol_see are all positively
correlated with LDMC, LCC, LIG, HEM and CEL, and therefore negatively correlated
with leaf litter decomposition rate. We expect also that Sha_fru and Sha_see are
positively correlated with foliar total C, and C fractions total N in fresh litter and
decomposition rates.

118
For the fourth stage, I hypothesize that the abundance of natural regeneration of
the trees species found in active pasturelands is correlated with rates of leaf litter
decomposition and nutrient release (linked via leaf traits). In this case there are two
alternative, competing hypotheses: (i) that species achieve higher abundance of
regeneration in active pastureland due to more rapid growth rate linked to higher foliar
concentrations of macronutrients and SOL and therefore higher rates of leaf litter
decomposition and nutrient release; (ii) that species achieve higher abundance of
regeneration in active pastureland due to greater resistance to herbivory linked to higher
foliar concentrations of recalcitrant C fractions (especially LIG) and lower
concentrations of macronutrients and therefore lower rates of leaf litter decomposition
and nutrient release.
To test these hypotheses the rate of loss of total leaf litter mass and of separate
mass fractions of 37 neotropical tree species comprising 50% of the tree community in
active pastureland in Nicaragua were measured in a decomposition experiment
conducted in a controlled greenhouse environment. Litter properties of these 37 species
were measured: concentrations of macronutrients (LNC, LPC), total C (LCC) and C
fractions (SOL, HEM, CEL and LIG) and the physical traits LA, SLA and FTF. For a
subset of 19 of the species measurements were made of the same chemical and physical
traits in green leaves. Correlation tests were made between the green leaf and litter
traits, and between these traits and decomposition rate variables. In addition, correlation
tests were made between all of these, and existing data of whole plant and dispersal-
linked morphological traits. To my knowledge no previous studies have evaluated these
relationships between leaf traits, litter traits, litter decomposition rate, whole plant traits
and population structure. Changes in land and ecosystems and their implications for
global environmental change and sustainability are a major research challenge for the
ecological and human environmental sciences (Turner et al 2007).
4.3 METHODS
Litter decomposition experiment in standard environmental condition
Species selection
A sub-sample of 37 out of the 76 tree species found as adult trees in the active
pasturelands in the central region of Matagalpa in Nicaragua were used to measure
decomposability of leaf litter in a litterbags decomposition experiment under standard
119
environmental conditions (temperature and humidity) inside a greenhouse. Plant
morphological traits in green leaves and total macronutrients contents and C fractions
were measured for all the species used in this experiment. Species were selected mainly
by litter availability and include species with contrasting abundance of natural
regeneration, leaf phenology, and green leaf and litter quality.
Litter fall collection
Litter from 36 tree species was collected using litter traps and manual collections
of litter fallen lifted (fresh litter) under at least five different isolated trees for each
species in active pastures, weekly over the whole four month period. Two circular litter
traps (1m diameter) were located at five and ten m away tree trunk under canopy tree
area. Litter traps with smallest mesh (1 x 1 mm) were used to collect litter from tree
species with compound leaves and small leaflets where the individual leaflets litter was
then carefully manually collected. Tree litter was manually collected and sorted between
species without including leaves contaminated by non-litter material, e.g. animal faeces.
Leaves litter was manually separated from branch, flower, fruit or other tree litter.
Primary and secondary rachis of compound leaves and petioles from simple leaves were
also manually separated from leaflets or leaf lamina litter.
Litter was collected during the January to April 2008 dry season, oven-dried at
65º C for 72 hours to remove moisture and to determine dry weight, and stored in paper
and plastic bags until the decomposition experiment was set up. The litter collected for
each of these 36 species were thoroughly mix/homogenize before sub-sampling from
this mixture was used to fill the litterbags i.e. obtaining a mean sample of tree species
litter quality and minimizing the “natural variation” amongst the replicates. Only foliar
lamina was used for decomposition experiments and chemical analyses. Rachis and
petioles litter was dried in isolation from leaf lamina litter and was used to obtain an
independent determination of their biomass and chemical composition (data not shown).
The biomass proportions invested in each leaf structure (petioles or rachis and
lamina) by tree species were also obtained by leaf unit (data not shown). Decomposition
rates reported here were obtained only for the leaf lamina or leaflets, the main photo-
synthetically active tissues in compound or simple leaves.
Litter bags
Plastic mesh bags of 20 x 15 cm and 2 mm mesh sized were filled with 10 g of
litter dry mass by species (monotypes) for a standard decomposition experiment. A
120
sample of stored litter was oven-dried before litterbags were filled (to obtain the
percentage humidity accumulated due to storage) and was used to correct the initial
litter amount that should be weighed to fill each litterbag with exactly 10 g of dry mass
by species. Size of leaf litter was highly diverse between species and individuals. Leaf
litter size range varied from 2.6 x 5.4 mm in Enterolobium cyclocarpum to 26 x 7 cm in
Anona cherimmola and even to 50 x 45 cm in Cecropia peltata. Tree litter of all species
was cut into homogeneous fragments of approximately 2 x 2 cm to be able to compare
decomposability of leaf litter material between different tree species. Only the leaf litter
of Enterolobium cyclocarpum was not cut due to it leaf size being lower than the regular
litter fragments. To cut the leaf litter removes other physical characteristics that could
affect also species litter decomposition rates in the field. The area and form of the whole
leaf could influence litter decomposition rates for example influencing the leaf–soil
contact surface, the litter and soil humidity retention and the physical microhabitat
formation to promote colonization by decomposers (per. obs).
Therefore, decomposition rates obtaining by this experiment were not an
accurate estimation of species natural decomposition rates in the field. In contrast, this
litter manipulation provides similar litter fragments for more accurate comparisons of
decomposition rates between species due specifically to litter tissue qualities. In
addition, the use of entire leaves in a previous decomposition experiment during the dry
season of 2007 (data not shown) caused a strong clustering of leaves forming a
compacted strata of litter inside litter bags, affecting the estimation of decomposition
rates due to the creation of a litter clustering condition never observed in the field. In
contrast, litter fragments were freely distributed within the litterbags allowing the free
movements of water and decomposers (per.obs).
Litter beds in standard conditions
A total of four litter decomposition beds of approximately 3.50 x 1.5 x 0.20 m
were constructed to contain the litter bags inside a CATIE greenhouse at Turrialba,
Costa Rica. Sun exposure was controlled inside the greenhouse and the medium time
between the field capacity and the permanent wilting point of the soil profile was used
to regulate the frequency of water additions (app. every three days). Litter beds were
constructed with wood and filled to ca. 20 cm depth with homogenized soil obtained
from pasture sites next to remnant forest near Turrialba. The soil used in the litter beds
was different to that in the Nicaragua field site though it did also include a pasture
natural decomposer community. The litterbags were buried at 10 cm depth in the soil

121
profile to reduce microclimatic variability and accelerate the rate of decomposition. A
plastic mesh covered all the litter decomposition beds to avoid animal or accidental
removals.
Experimental design
Because sun exposure and temperature can vary among litter beds, each litter
bed was considered a block. The 37 litter species (first treatment factor) were randomly
distributed into each block. The experimental unit for species consist in four litter bags
with litter of the same species (sampling units for time) to which each of the four
harvesting times (second factor) were randomly distributed. One bag from each of these
plots was randomly harvested at each date. The resulting experimental design is a split-
plot replicated in blocks. The main plot contains the experimental units for species
factor and the split-plot contains the experimental units for time factor (Figure 4.1).
Inside each main-plot, the four litterbags filled with litter of the same species
were placed one next to another and harvested at different times (t1, t2, t3, t4) avoiding
confounding effects of position and species. Each block contain only one main plot by
species i.e. the four bags each one for one harvested time by specie, avoiding
confounding effects of position and harvested time. Therefore, a total of 4 litterbags
were collected by specie by time and 148 litterbags by harvested time, resulting in a
grand total of 560 litterbags for this standard decomposition experiment with four
replicate bags per combination of 37 species and four harvest times. Similar spatial
distributions were used within each litter bed and minimal distance between litterbags
within main and split plots was ca. 5 cm, resulting in a litterbags density of 20 per m2 of
litter bed.
Litter decomposition rates
The four litterbags replicates per species were harvested at each of four different
collection times (4, 8, 12 and 16 weeks) between August and November 2008. The litter
mass remaining in each litterbag was gently washed with running water to eliminate
mainly soil residues, using a plastic mesh sieve of 1 mm to control the possible removal
of the smallest litter material during this process. The cleaned litter material was then air
dried for 12 hours and thereafter manually sorted to eliminate bigger non-litter material
mainly invertebrates remains or mineral contaminants like chippings. Remnant litter
material bigger than 1 mm was then oven dried at 65 °C for 72 hours (after this time no
further mass loss was occurring) and stored in plastic bags. The mass weight (grammes)
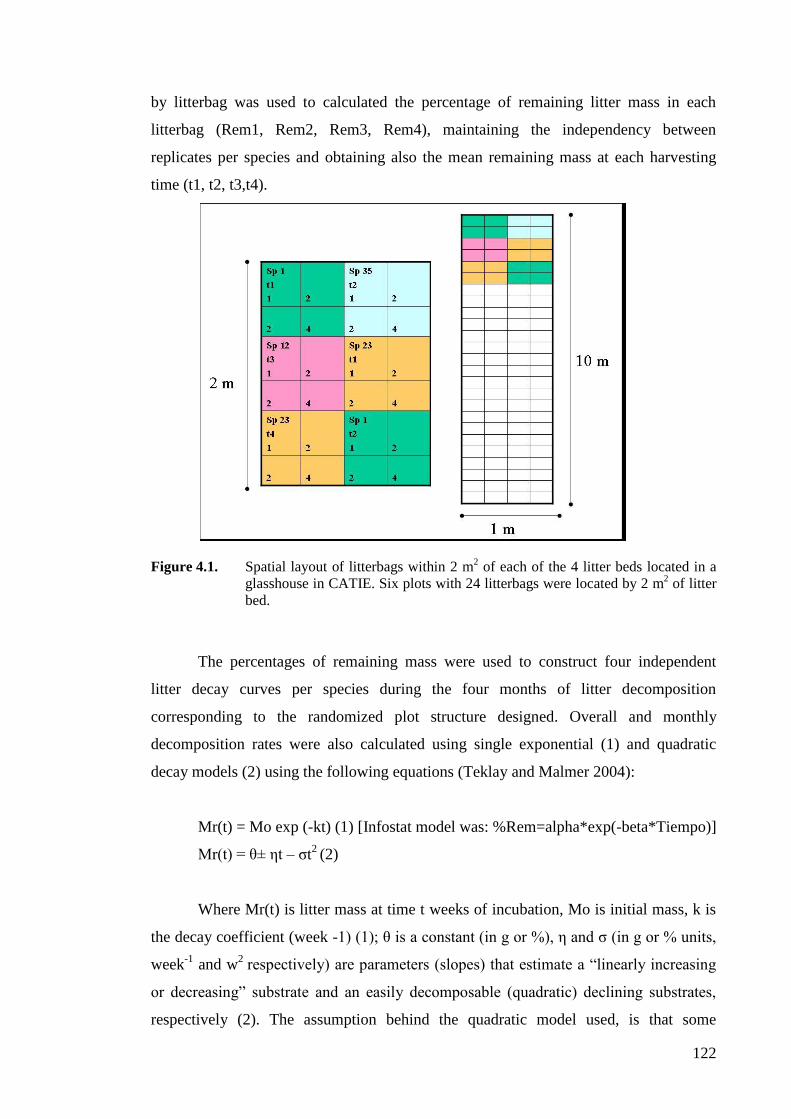
122
by litterbag was used to calculated the percentage of remaining litter mass in each
litterbag (Rem1, Rem2, Rem3, Rem4), maintaining the independency between
replicates per species and obtaining also the mean remaining mass at each harvesting
time (t1, t2, t3,t4).
Figure 4.1. Spatial layout of litterbags within 2 m2 of each of the 4 litter beds located in a
glasshouse in CATIE. Six plots with 24 litterbags were located by 2 m2 of litter
bed.
The percentages of remaining mass were used to construct four independent
litter decay curves per species during the four months of litter decomposition
corresponding to the randomized plot structure designed. Overall and monthly
decomposition rates were also calculated using single exponential (1) and quadratic
decay models (2) using the following equations (Teklay and Malmer 2004):
Mr(t) = Mo exp (-kt) (1) [Infostat model was: %Rem=alpha*exp(-beta*Tiempo)]
Mr(t) = θ± ηt – σt2
(2)
Where Mr(t) is litter mass at time t weeks of incubation, Mo is initial mass, k is
the decay coefficient (week -1) (1); θ is a constant (in g or %), η and σ (in g or % units,
week-1
and w2
respectively) are parameters (slopes) that estimate a “linearly increasing
or decreasing” substrate and an easily decomposable (quadratic) declining substrates,
respectively (2). The assumption behind the quadratic model used, is that some

123
components could increase initially due to immobilization (e.g. N) or transformation of
some substrates of lower decomposability (Teklay and Malmer 2004).
We decide to calculate three different measurements of decomposition rates:
overall decomposition rate (BETA 5), partial decomposition rates (BETA 4) and
monthly decomposition rates (b1, b2, b3, b4). Overall decomposition rates (decay
coefficients or k values) were calculated with 100% as the initial point (t0, when the
whole 10 g of dried matter was placed in the decomposition beds) (BETA 5). Partial k
values were also calculated (BETA 4) using the percentages of remaining litter at weeks
4, 8, 12 and 16 fitted in a simple exponential model, without including 100% as the t0
value.
Therefore, the overall decomposition rate, BETA 5, was fitting a linear decay
curve including the initial four weeks of litter decomposition. In contrast, the partial
decomposition rate, BETA 4, was fitting a linear decay curve, based on mass loss in
each period after the initial four weeks. In addition, monthly decomposition rates were
calculated to estimate independent changes in mass decay during each of the four four-
week periods (beta1, beta2, beta3, beta4). Decomposition rates during the first four
weeks of litter incubation (b1) were expected to describe phase I of the theoretical
model of liter decomposition; b2, b3 and b4 as well as BETA 4 were expected to
describe phase II, and the overall decomposition rate (BETA 5) included both phases.
These overall and partial decomposition rates calculations were made separately to
provide more precise descriptions of different components of litter decomposition to test
correlations with litter qualities and plant traits.
Litter quality
Composite samples for each species of the fresh and remaining litter at the end
of the incubation period (week 16) were used to determine the initial and final litter
quality based on concentrations of macronutrients (N and P), total C, and C fractions
(ash, lignin, cellulose, hemicelluloses and soluble compounds). Concentrations of N, P
and C were analyzed in the Soil, Vegetal Material and Water Laboratory of CATIE in
Costa Rica, which is subscribed to the International Plant-Analytical Exchange
(WEPAL), Wageningen. Total N and C concentrations were measured by combustion at
1800 °C with gasses analysed by a chromatography column connected to a thermic
conductivity detector using a Flash EA 1112 NC Analyzer. Total P content was
determining by humid digestion with a mix of nitro-perclorated acids 5:1 (HCl) and
124
colorimetry (using ammonium molybdate and stannous chloride) and reading a UV/V
espectophotometer at 660nm (Henríquez et al. 1995).
The percentages of C fraction contents in litter were determined using an
ANKOM 2000 Fiber Analyzer in the Laboratories of the Environment Centre Wales at
Bangor University, UK. Lignin contents were separated from cellulose, hemicelluloses
and from non-structural compounds (sugars, starch, proteins and lipids) by consecutive
extractions of a plant sample using the filter bags technique, done in the order of NDF
(neutral detergent fiber), ADF (acid detergent fiber) and ADL (acid determined lignin)
(ANKOM 2000 Fiber Analyzer, Operator’s Manual, 2011.
http://www.ankom.com/media/documents/A2000series_Manual_RevE_083011.pdf).
During the NDF digestion, the fraction that is washed off by the NDF solution (soapy
water) contains soluble cell contents like carbohydrates, lipids, pectins, starch, soluble
proteins and non-protein nitrogen. The fraction that is left in the bag contains
hemicellulose, proteins bound to the cell walls, cellulose, lignin, and recalcitrant
materials. During the ADF digestion, hemicelluloses and bound proteins are washed off.
The fraction left behind by the ADF solution (a 1.00 Normal sulfuric acid and detergent
solution) contains cellulose, lignin, and recalcitrant materials. During the ADL
digestion, cellulose is washed off by the ADL solution (72% sulfuric acid) leaving only
lignin and recalcitrant materials. The ash or recalcitrant material percentage was
estimated by incineration of litter material at 550 °C for 8 hours.
Plant traits
Whole-plant, leaf and dispersal traits were measured for a bigger group of 76
tree species commonly found in active pasturelands in the field site in Nicaragua (Table
4.1). The whole plant traits were maximum tree height (Hmax), Leaf phenology (PHE)
and wood density (WD). Leaf traits were measured in mature green leaves and included
specific leaf area (SLA), leaf size (LA), leaf dry matter content (LDMC), leaf total
carbon, nitrogen, phosphorus content (LCC, LNC and LPC) and physical strength of
leaves (PSL or FTF). The dispersal traits measured in adult mature trees were fruit and
seed masses, volume and shapes (Mass fru, Mass see, Vol fru, Vol see, Sha fru, Sha see
respectively). A detailed and complete description of these plant traits can be found in
chapter 2.
125
Natural regeneration of tree species
The abundance of 76 tree species was surveyed in 46 active pasturelands on 17
cattle farms in the central Region of Matagalpa in Nicaragua in 2004 (Esquivel et al.
2008). The relative abundance of individuals in three main size classes was observed:
seedlings (germinated plants from 10 to 30 cm height), saplings (individuals with more
than 30 cm height and less than 10 cm in DBH) and adults trees (DBH > 10 cm). Adult
trees were sampling in 1 ha plot by pasture (10000 m2), saplings were sampled in a
mean of 10 quadratic plots per pasture (4000 m2), while seedlings were sampled in a
mean of 18 circular plots (126 m2) per pasture (Table 3.1). The total area of each pasture
varied from 1 to 22 ha (mean 5·82 ± 1·34 ha). The pastures were selected on the basis
of grass composition and selected to ensure a non-grouped spatial arrangement that
covered the different conditions of pastures present in the region. The selected pastures
were dominated (i.e. cover = 70%) by one of three grass types: (i) Brachiaria spp.
[Urochloa brizantha (Hochst. ex A. Rich.) Stapf and Urochloa decumbens Stapf]
previously named Brachiaria spp. (B, n = 15); (ii) mixtures of Cynodon nlemfuensis
Vanderyst and Cynodon dactylon (L.) Pers. (C, n = 13); or (iii) naturalized grasses (i.e.
not planted or seeded) such as Paspalum spp. (N, n = 18) (Esquivel et al. 2008).
Tree species densities by developmental stage and pasture type were used to
correlate natural regeneration abundances with decomposition rates and leaf litter
quality. Tree species densities by developmental stage and pasture type were obtained
as the ratio between the total abundances of seedlings, saplings and adults by the
number of pastures surveyed by pasture type (B, E, N). The possible pasture type effect
over the natural regeneration abundances was discounted from tree species densities
using as variables for the further analyses in this chapter including regeneration
abundances, the residual values of the ANOVA testing for differences in abundances of
adult, saplings and seedlings by pasture type, named partial or residual abundances, to
perform the correlation analyses. These partial correlation analyses take off the grass
type effect from the regeneration abundances sampling model, avoiding therefore any
confounding effect of pasture management over the correlations between abundance of
tree natural regeneration with decomposition rates, litter quality and macronutrient
releases. Further details about sampling scheme, design, pasture management conditions
and characteristics of the natural regeneration of these tree species can be found in
chapter 2 and in Esquivel et al. (2008).
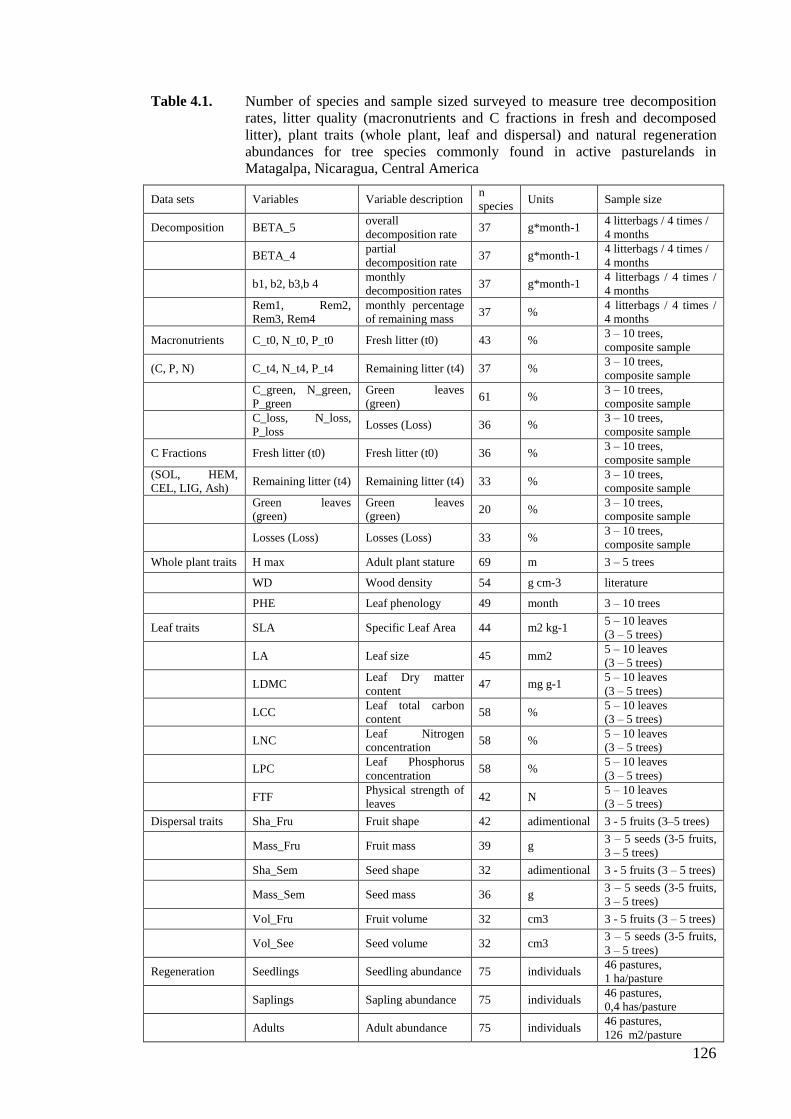
126
Table 4.1. Number of species and sample sized surveyed to measure tree decomposition
rates, litter quality (macronutrients and C fractions in fresh and decomposed
litter), plant traits (whole plant, leaf and dispersal) and natural regeneration
abundances for tree species commonly found in active pasturelands in
Matagalpa, Nicaragua, Central America
Data sets Variables Variable description n
species Units Sample size
Decomposition BETA_5 overall
decomposition rate 37 g*month-1
4 litterbags / 4 times /
4 months
BETA_4
partial
decomposition rate 37 g*month-1
4 litterbags / 4 times /
4 months
b1, b2, b3,b 4
monthly
decomposition rates 37 g*month-1
4 litterbags / 4 times /
4 months
Rem1, Rem2,
Rem3, Rem4
monthly percentage
of remaining mass 37 %
4 litterbags / 4 times /
4 months
Macronutrients C_t0, N_t0, P_t0 Fresh litter (t0) 43 % 3 – 10 trees,
composite sample
(C, P, N) C_t4, N_t4, P_t4 Remaining litter (t4) 37 % 3 – 10 trees,
composite sample
C_green, N_green,
P_green
Green leaves
(green) 61 %
3 – 10 trees,
composite sample
C_loss, N_loss,
P_loss Losses (Loss) 36 %
3 – 10 trees,
composite sample
C Fractions Fresh litter (t0) Fresh litter (t0) 36 % 3 – 10 trees,
composite sample
(SOL, HEM,
CEL, LIG, Ash) Remaining litter (t4) Remaining litter (t4) 33 %
3 – 10 trees,
composite sample
Green leaves
(green)
Green leaves
(green) 20 %
3 – 10 trees,
composite sample
Losses (Loss) Losses (Loss) 33 %
3 – 10 trees,
composite sample
Whole plant traits H max Adult plant stature 69 m 3 – 5 trees
WD Wood density 54 g cm-3 literature
PHE Leaf phenology 49 month 3 – 10 trees
Leaf traits SLA Specific Leaf Area 44 m2 kg-1 5 – 10 leaves
(3 – 5 trees)
LA Leaf size 45 mm2
5 – 10 leaves
(3 – 5 trees)
LDMC
Leaf Dry matter
content 47 mg g-1
5 – 10 leaves
(3 – 5 trees)
LCC
Leaf total carbon
content 58 %
5 – 10 leaves
(3 – 5 trees)
LNC
Leaf Nitrogen
concentration 58 %
5 – 10 leaves
(3 – 5 trees)
LPC
Leaf Phosphorus
concentration 58 %
5 – 10 leaves
(3 – 5 trees)
FTF
Physical strength of
leaves 42 N
5 – 10 leaves
(3 – 5 trees)
Dispersal traits Sha_Fru Fruit shape 42 adimentional 3 - 5 fruits (3–5 trees)
Mass_Fru Fruit mass 39 g
3 – 5 seeds (3-5 fruits,
3 – 5 trees)
Sha_Sem Seed shape 32 adimentional 3 - 5 fruits (3 – 5 trees)
Mass_Sem Seed mass 36 g
3 – 5 seeds (3-5 fruits,
3 – 5 trees)
Vol_Fru Fruit volume 32 cm3 3 - 5 fruits (3 – 5 trees)
Vol_See Seed volume 32 cm3
3 – 5 seeds (3-5 fruits,
3 – 5 trees)
Regeneration Seedlings Seedling abundance 75 individuals 46 pastures,
1 ha/pasture
Saplings Sapling abundance 75 individuals
46 pastures,
0,4 has/pasture
Adults Adult abundance 75 individuals
46 pastures,
126 m2/pasture
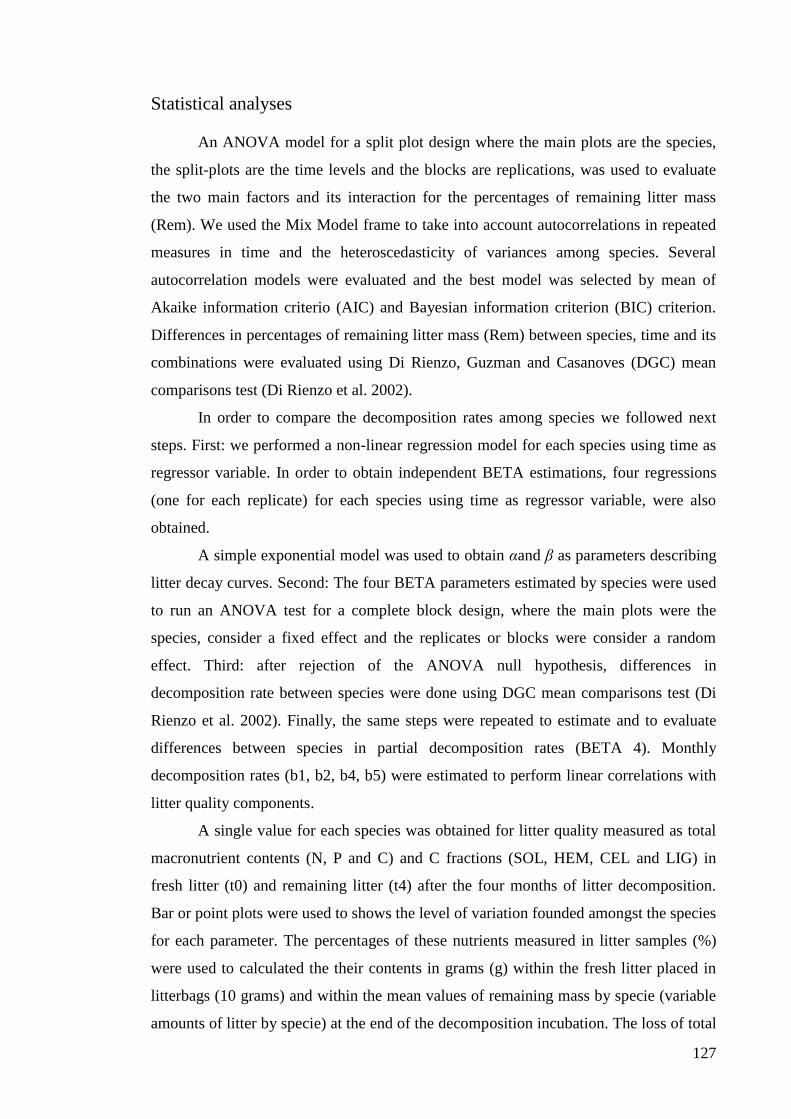
127
Statistical analyses
An ANOVA model for a split plot design where the main plots are the species,
the split-plots are the time levels and the blocks are replications, was used to evaluate
the two main factors and its interaction for the percentages of remaining litter mass
(Rem). We used the Mix Model frame to take into account autocorrelations in repeated
measures in time and the heteroscedasticity of variances among species. Several
autocorrelation models were evaluated and the best model was selected by mean of
Akaike information criterio (AIC) and Bayesian information criterion (BIC) criterion.
Differences in percentages of remaining litter mass (Rem) between species, time and its
combinations were evaluated using Di Rienzo, Guzman and Casanoves (DGC) mean
comparisons test (Di Rienzo et al. 2002).
In order to compare the decomposition rates among species we followed next
steps. First: we performed a non-linear regression model for each species using time as
regressor variable. In order to obtain independent BETA estimations, four regressions
(one for each replicate) for each species using time as regressor variable, were also
obtained.
A simple exponential model was used to obtain αand β as parameters describing
litter decay curves. Second: The four BETA parameters estimated by species were used
to run an ANOVA test for a complete block design, where the main plots were the
species, consider a fixed effect and the replicates or blocks were consider a random
effect. Third: after rejection of the ANOVA null hypothesis, differences in
decomposition rate between species were done using DGC mean comparisons test (Di
Rienzo et al. 2002). Finally, the same steps were repeated to estimate and to evaluate
differences between species in partial decomposition rates (BETA 4). Monthly
decomposition rates (b1, b2, b4, b5) were estimated to perform linear correlations with
litter quality components.
A single value for each species was obtained for litter quality measured as total
macronutrient contents (N, P and C) and C fractions (SOL, HEM, CEL and LIG) in
fresh litter (t0) and remaining litter (t4) after the four months of litter decomposition.
Bar or point plots were used to shows the level of variation founded amongst the species
for each parameter. The percentages of these nutrients measured in litter samples (%)
were used to calculated the their contents in grams (g) within the fresh litter placed in
litterbags (10 grams) and within the mean values of remaining mass by specie (variable
amounts of litter by specie) at the end of the decomposition incubation. The loss of total

128
macronutrients and C fraction with litter decomposition were calculated as the
subtraction between (grams) the initial and final nutrients contents in litter (g) and as the
proportion (%) that these lost amounts in grams represent from the initial content of
nutrients in fresh litter. The content (%) of total macronutrients and C fractions in green
leaves and fresh litter were used to calculate the amounts of total macronutrients and C
fractions lost through senescence process, calculated in grams and as the proportion (%)
lost from the initial content in green leaves. The contents of total macronutrients or C
fraction in percentage (%) express the relative proportion that each component are
having in the leaf material; meanwhile the amounts express in grams express the real
amounts released by component thought senescence and decomposition. The nutrients
loss rates were equivalent to these measurements. Correlations of litter decomposition
measures (BETA 4, BETA 5 and b1, b2, b3, b4) with initial macronutrient (N, P and C)
and C fractions (SOL, HEM, CEL and LIG) and their proportion loosed during
decomposition (%) were evaluated by linear regression and correspondence analyses.
The relationships of tree species overall (BETA 5), partial (BETA 4) and four-
weekly (b1, b2, b3, b4) leaf litter decomposition rates, the percentage of remaining litter
mass at four week intervals (Rem t1, Rem t2, Rem t3, Rem t4) and the rate of nutrient
release with plant morphological traits (whole plant, leaf and dispersal traits) and fresh
and remaining litter quality (macronutrients and C fractions) and population abundance
in seedling, sapling and adult size classes were analyzed. The test used was Spearman
rank correlation due to the lack of normality of some variables, carried out in InfoStat
Professional software (2011). Three main groups of correlation analyses were run
consecutively in order to analyze the relationships between leaf litter decomposition
rates and litter quality, plant traits sets and population abundances by size class. Each
data set of plant traits contains information for a different number of species within the
community of trees in active pasturelands due to constraints on obtaining appropriate
plant samples during the different sampling periods. Therefore, each one of the previous
paired analyses or correspondence coefficients had different n values, reported by each
table and which varied within a range of 20 to 65 species per correlation pair.
Spearman rank correlation coefficients were calculated to test the relationships
of decomposition rates and rates of nutrient release with traits indicating litter quality
and other plant traits. This method was used because of the deviation of data
distributions from normality. Partial correlation analyses were performed to calculate
Spearman rank correlation coefficients between decomposition rates, nutrient release,

129
litter quality and other plant traits/population statistics. In order to do this, the residual
values resulting from the ANOVA to test effects of pasture type on species population
abundance in each size class were correlated with decomposition rates, nutrient release
and litter quality variables once rank transformed using Pearson correlation coefficients.
A Rank transformation arrange the original variables values in rank order, then assign
the smallest a value of 1, the next smallest a value of 2 etc. A Pearson correlation
analyses over two variables rank transformed are equivalent to a Spearman correlation
analyses. This non-parametric analysis produces uniform residuals for the rank-
transformed variable. Therefore, abundances and decomposition values were previously
transformed to RANG to overcome lack of Normality. This partial Spearman
Correlation analyses were able to test the relationships between abundances of
decomposition rates and nutrient release with litter quality and population abundance in
each size class without any interference of grass type effects on the latter. As many
multiple correlations were carrying out we cannot simply accept a standard p < 0.05
threshold as defining which correlations are real and which are non-existent. On
average, one in 20 correlation tests of two variables which are (in fact) not correlated
will show as P < 0.05 by chance. Similarly many correlations which are real will give P
values > 0.05 by chance. Therefore we underlined those correlations having a
significance level of P < 0.1.
4.4 RESULTS
Leaf litter decomposition rates and leaf quality of trees commonly found in
active pasturelands
Differences in decomposition rates between tree species
Tree species commonly found in active pasturelands have a wide variability of
tree litter decomposition rates (Table 4.2, Figure 4.2). ANOVA shows significant
differences between the percentages of remaining litter mass (% Rem) between species
(n=37, F-value= 87.53, p<0.0001), times (n=4, F-value= 1404.18, p<0.0001) and
species*time (n=148, F-value= 4.96, p<0.0001). The mean percentage of remaining
litter mass over the four months of litter incubation for all tree species was 53% (Table
4.2, Figure 4.2). The mean percentages of remaining litter mass dropped from 100% to
67% during the first month (Rem1) of litter decomposition, being the higher losses of
litter mass as expected.
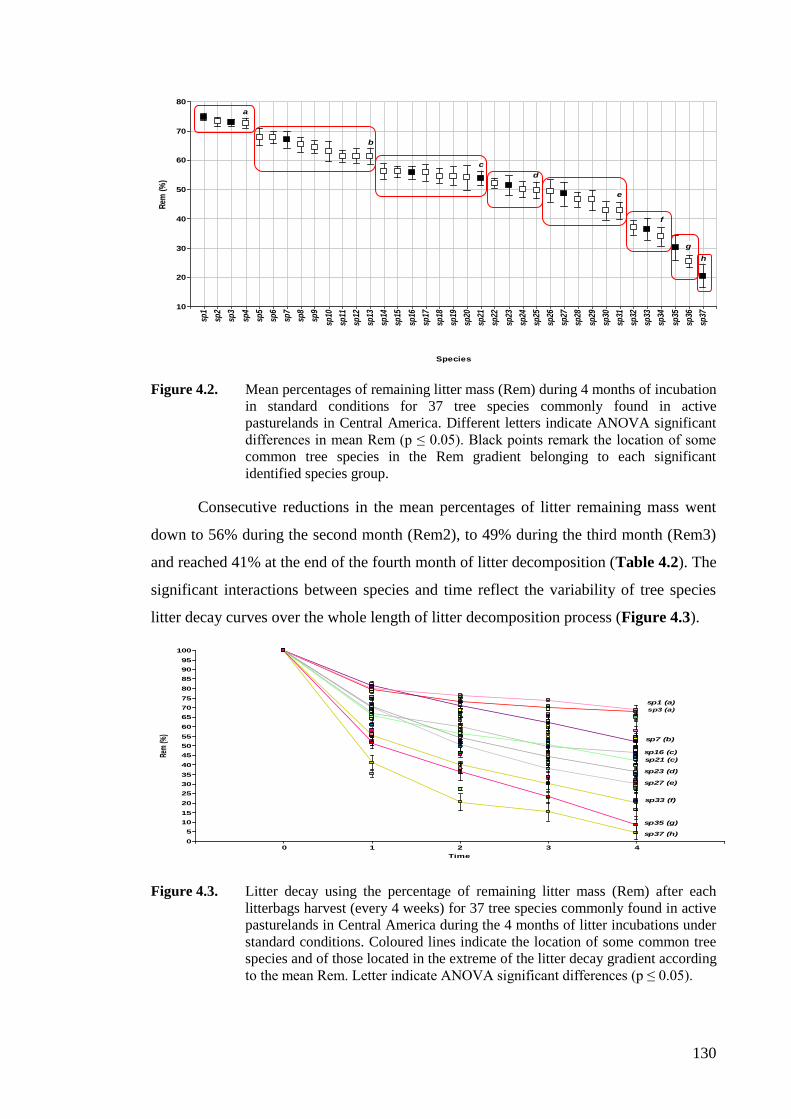
130
Figure 4.2. Mean percentages of remaining litter mass (Rem) during 4 months of incubation
in standard conditions for 37 tree species commonly found in active
pasturelands in Central America. Different letters indicate ANOVA significant
differences in mean Rem (p ≤ 0.05). Black points remark the location of some
common tree species in the Rem gradient belonging to each significant
identified species group.
Consecutive reductions in the mean percentages of litter remaining mass went
down to 56% during the second month (Rem2), to 49% during the third month (Rem3)
and reached 41% at the end of the fourth month of litter decomposition (Table 4.2). The
significant interactions between species and time reflect the variability of tree species
litter decay curves over the whole length of litter decomposition process (Figure 4.3).
Figure 4.3. Litter decay using the percentage of remaining litter mass (Rem) after each
litterbags harvest (every 4 weeks) for 37 tree species commonly found in active
pasturelands in Central America during the 4 months of litter incubations under
standard conditions. Coloured lines indicate the location of some common tree
species and of those located in the extreme of the litter decay gradient according
to the mean Rem. Letter indicate ANOVA significant differences (p ≤ 0.05).
sp1
sp2
sp3
sp4
sp5
sp6
sp7
sp8
sp9
sp10
sp11
sp12
sp13
sp14
sp15
sp16
sp17
sp18
sp19
sp20
sp21
sp22
sp23
sp24
sp25
sp26
sp27
sp28
sp29
sp30
sp31
sp32
sp33
sp34
sp35
sp36
sp37
Species
10
20
30
40
50
60
70
80
Rem
(%
)
a
b
c
d
e
f
g
h
0 1 2 3 4
Time
0
5
10
15
20
25
30
35
40
45
50
55
60
65
70
75
80
85
90
95
100
Rem
(%)
sp1 (a)
sp3 (a)
sp7 (b)
sp16 (c)
sp21 (c)
sp23 (d)
sp27 (e)
sp33 (f)
sp35 (g)
sp37 (h)
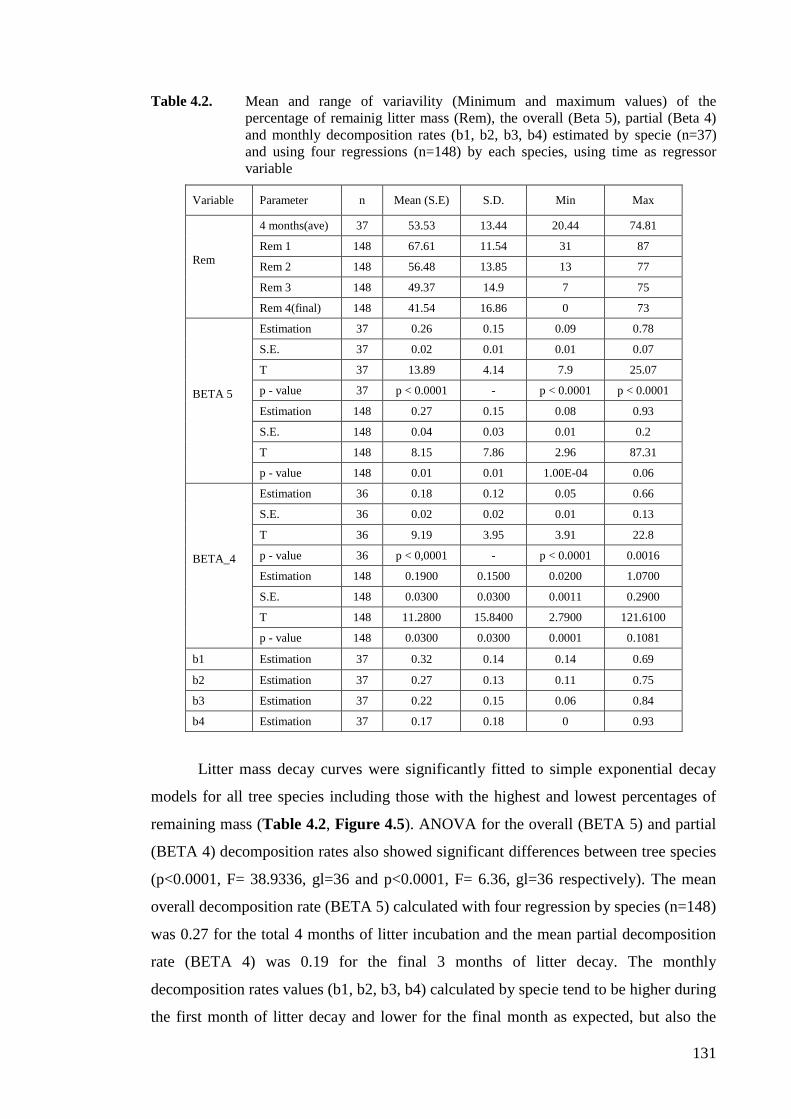
131
Table 4.2. Mean and range of variavility (Minimum and maximum values) of the
percentage of remainig litter mass (Rem), the overall (Beta 5), partial (Beta 4)
and monthly decomposition rates (b1, b2, b3, b4) estimated by specie (n=37)
and using four regressions (n=148) by each species, using time as regressor
variable
Variable Parameter n Mean (S.E) S.D. Min Max
Rem
4 months(ave) 37 53.53 13.44 20.44 74.81
Rem 1 148 67.61 11.54 31 87
Rem 2 148 56.48 13.85 13 77
Rem 3 148 49.37 14.9 7 75
Rem 4(final) 148 41.54 16.86 0 73
BETA 5
Estimation 37 0.26 0.15 0.09 0.78
S.E. 37 0.02 0.01 0.01 0.07
T 37 13.89 4.14 7.9 25.07
p - value 37 p < 0.0001 - p < 0.0001 p < 0.0001
Estimation 148 0.27 0.15 0.08 0.93
S.E. 148 0.04 0.03 0.01 0.2
T 148 8.15 7.86 2.96 87.31
p - value 148 0.01 0.01 1.00E-04 0.06
BETA_4
Estimation 36 0.18 0.12 0.05 0.66
S.E. 36 0.02 0.02 0.01 0.13
T 36 9.19 3.95 3.91 22.8
p - value 36 p < 0,0001 - p < 0.0001 0.0016
Estimation 148 0.1900 0.1500 0.0200 1.0700
S.E. 148 0.0300 0.0300 0.0011 0.2900
T 148 11.2800 15.8400 2.7900 121.6100
p - value 148 0.0300 0.0300 0.0001 0.1081
b1 Estimation 37 0.32 0.14 0.14 0.69
b2 Estimation 37 0.27 0.13 0.11 0.75
b3 Estimation 37 0.22 0.15 0.06 0.84
b4 Estimation 37 0.17 0.18 0 0.93
Litter mass decay curves were significantly fitted to simple exponential decay
models for all tree species including those with the highest and lowest percentages of
remaining mass (Table 4.2, Figure 4.5). ANOVA for the overall (BETA 5) and partial
(BETA 4) decomposition rates also showed significant differences between tree species
(p<0.0001, F= 38.9336, gl=36 and p<0.0001, F= 6.36, gl=36 respectively). The mean
overall decomposition rate (BETA 5) calculated with four regression by species (n=148)
was 0.27 for the total 4 months of litter incubation and the mean partial decomposition
rate (BETA 4) was 0.19 for the final 3 months of litter decay. The monthly
decomposition rates values (b1, b2, b3, b4) calculated by specie tend to be higher during
the first month of litter decay and lower for the final month as expected, but also the

132
values observed for 37 specie showed that their ranges of variability (minimum and
maximum values) increased from the first to the final month of litter incubation (Table
4.2).
Figure 4.4. Litter decay curves fitted to a simple exponential model regression for the four
months of litter decomposition (the estimated BETA 5) in standard conditions
for some of the 37 tree species commonly found in active pasturelands in
Central America (Beta values vary from 0,09 to 0,78 from a) to f); p≤0,001 for
all species)
a)
b)
c)
d)
e)
f)
A total of 8 different groups of species with similar mean percentages of mean
litter remaining mass (Rem) and overall decomposition rates (BETA 5) were observed
by DGC mean comparisons test (p<0.0001, F= 209.18, gl=140) (Figure 4.5).
0 1 2 3 4
Time (months)
0
25
50
75
100
Rem
(%
)
sp_1
0 1 2 3 4
Time (months)
0
25
50
75
100
Rem
(%
)
sp_7
0 1 2 3 4
Time (months)
0
25
50
75
100
Rem
(%
)
Sp_21
0 1 2 3 4
Time (months)
0
25
50
75
100
Rem
(%
)
sp_23
0 1 2 3 4
Time (months)
0
25
50
75
100
Rem
(%
)
sp_27
0 1 2 3 4
Time (months)
0
25
50
75
100
Rem
(%
)
sp_37
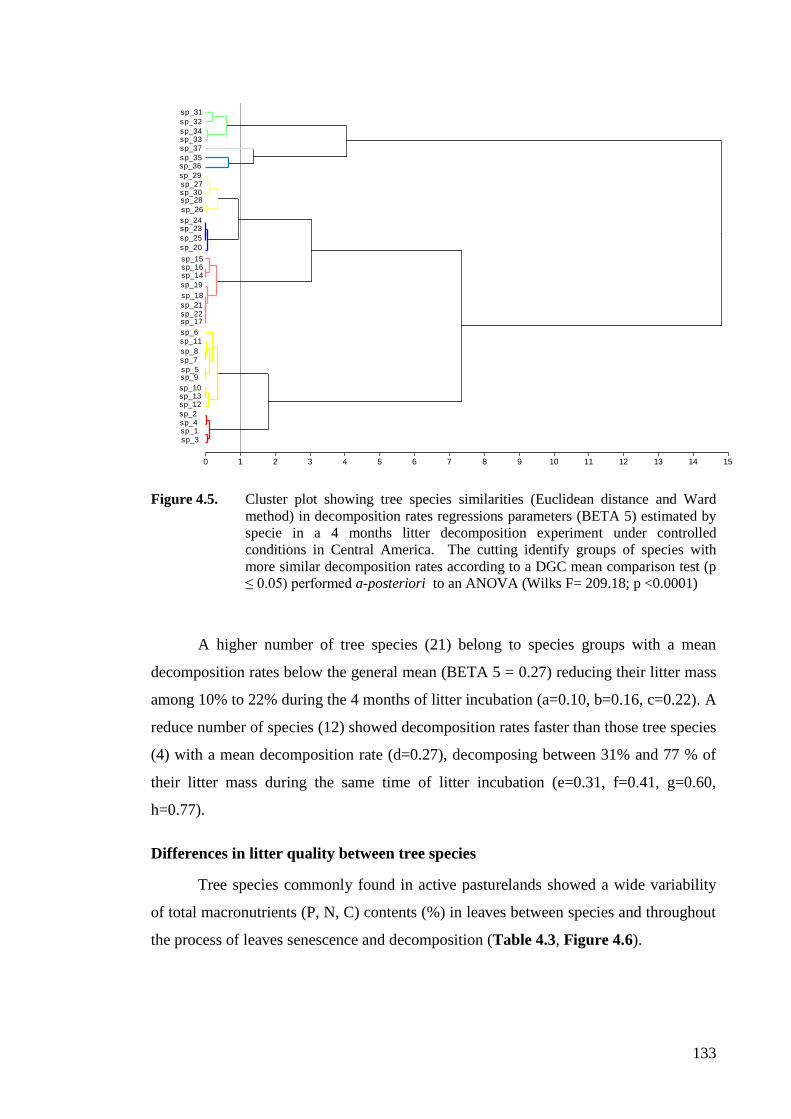
133
Figure 4.5. Cluster plot showing tree species similarities (Euclidean distance and Ward
method) in decomposition rates regressions parameters (BETA 5) estimated by
specie in a 4 months litter decomposition experiment under controlled
conditions in Central America. The cutting identify groups of species with
more similar decomposition rates according to a DGC mean comparison test (p
≤ 0.05) performed a-posteriori to an ANOVA (Wilks F= 209.18; p <0.0001)
A higher number of tree species (21) belong to species groups with a mean
decomposition rates below the general mean (BETA 5 = 0.27) reducing their litter mass
among 10% to 22% during the 4 months of litter incubation (a=0.10, b=0.16, c=0.22). A
reduce number of species (12) showed decomposition rates faster than those tree species
(4) with a mean decomposition rate (d=0.27), decomposing between 31% and 77 % of
their litter mass during the same time of litter incubation (e=0.31, f=0.41, g=0.60,
h=0.77).
Differences in litter quality between tree species
Tree species commonly found in active pasturelands showed a wide variability
of total macronutrients (P, N, C) contents (%) in leaves between species and throughout
the process of leaves senescence and decomposition (Table 4.3, Figure 4.6).
0 1 2 3 4 5 6 7 8 9 10 11 12 13 14 15
sp_3sp_1sp_4sp_2
sp_12sp_13sp_10
sp_9sp_5
sp_7sp_8
sp_11sp_6
sp_17sp_22sp_21
sp_18
sp_19
sp_14sp_16sp_15
sp_20
sp_25
sp_23sp_24
sp_26
sp_28sp_30sp_27sp_29
sp_36sp_35
sp_37sp_33sp_34
sp_32
sp_31
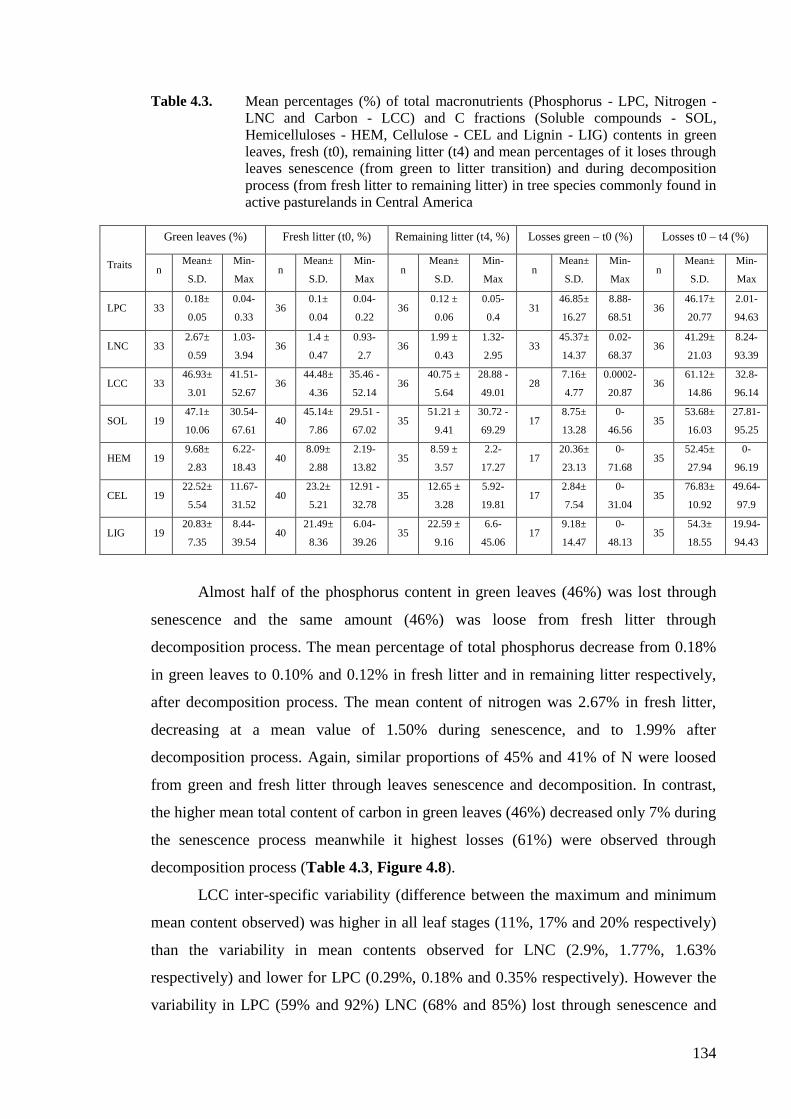
134
Table 4.3. Mean percentages (%) of total macronutrients (Phosphorus - LPC, Nitrogen -
LNC and Carbon - LCC) and C fractions (Soluble compounds - SOL,
Hemicelluloses - HEM, Cellulose - CEL and Lignin - LIG) contents in green
leaves, fresh (t0), remaining litter (t4) and mean percentages of it loses through
leaves senescence (from green to litter transition) and during decomposition
process (from fresh litter to remaining litter) in tree species commonly found in
active pasturelands in Central America
Almost half of the phosphorus content in green leaves (46%) was lost through
senescence and the same amount (46%) was loose from fresh litter through
decomposition process. The mean percentage of total phosphorus decrease from 0.18%
in green leaves to 0.10% and 0.12% in fresh litter and in remaining litter respectively,
after decomposition process. The mean content of nitrogen was 2.67% in fresh litter,
decreasing at a mean value of 1.50% during senescence, and to 1.99% after
decomposition process. Again, similar proportions of 45% and 41% of N were loosed
from green and fresh litter through leaves senescence and decomposition. In contrast,
the higher mean total content of carbon in green leaves (46%) decreased only 7% during
the senescence process meanwhile it highest losses (61%) were observed through
decomposition process (Table 4.3, Figure 4.8).
LCC inter-specific variability (difference between the maximum and minimum
mean content observed) was higher in all leaf stages (11%, 17% and 20% respectively)
than the variability in mean contents observed for LNC (2.9%, 1.77%, 1.63%
respectively) and lower for LPC (0.29%, 0.18% and 0.35% respectively). However the
variability in LPC (59% and 92%) LNC (68% and 85%) lost through senescence and
T
Traits
Green leaves (%) Fresh litter (t0, %) Remaining litter (t4, %) Losses green – t0 (%) Losses t0 – t4 (%)
n Mean±
S.D.
Min-
Max n
Mean±
S.D.
Min-
Max n
Mean±
S.D.
Min-
Max n
Mean±
S.D.
Min-
Max n
Mean±
S.D.
Min-
Max
LPC 33 0.18±
0.05
0.04-
0.33 36
0.1±
0.04
0.04-
0.22 36
0.12 ±
0.06
0.05-
0.4 31
46.85±
16.27
8.88-
68.51 36
46.17±
20.77
2.01-
94.63
LNC 33 2.67±
0.59
1.03-
3.94 36
1.4 ±
0.47
0.93-
2.7 36
1.99 ±
0.43
1.32-
2.95 33
45.37±
14.37
0.02-
68.37 36
41.29±
21.03
8.24-
93.39
LCC 33 46.93±
3.01
41.51-
52.67 36
44.48±
4.36
35.46 -
52.14 36
40.75 ±
5.64
28.88 -
49.01 28
7.16±
4.77
0.0002-
20.87 36
61.12±
14.86
32.8-
96.14
SOL 19 47.1±
10.06
30.54-
67.61 40
45.14±
7.86
29.51 -
67.02 35
51.21 ±
9.41
30.72 -
69.29 17
8.75±
13.28
0-
46.56 35
53.68±
16.03
27.81-
95.25
HEM 19 9.68±
2.83
6.22-
18.43 40
8.09±
2.88
2.19-
13.82 35
8.59 ±
3.57
2.2-
17.27 17
20.36±
23.13
0-
71.68 35
52.45±
27.94
0-
96.19
CEL 19 22.52±
5.54
11.67-
31.52 40
23.2±
5.21
12.91 -
32.78 35
12.65 ±
3.28
5.92-
19.81 17
2.84±
7.54
0-
31.04 35
76.83±
10.92
49.64-
97.9
LIG 19 20.83±
7.35
8.44-
39.54 40
21.49±
8.36
6.04-
39.26 35
22.59 ±
9.16
6.6-
45.06 17
9.18±
14.47
0-
48.13 35
54.3±
18.55
19.94-
94.43
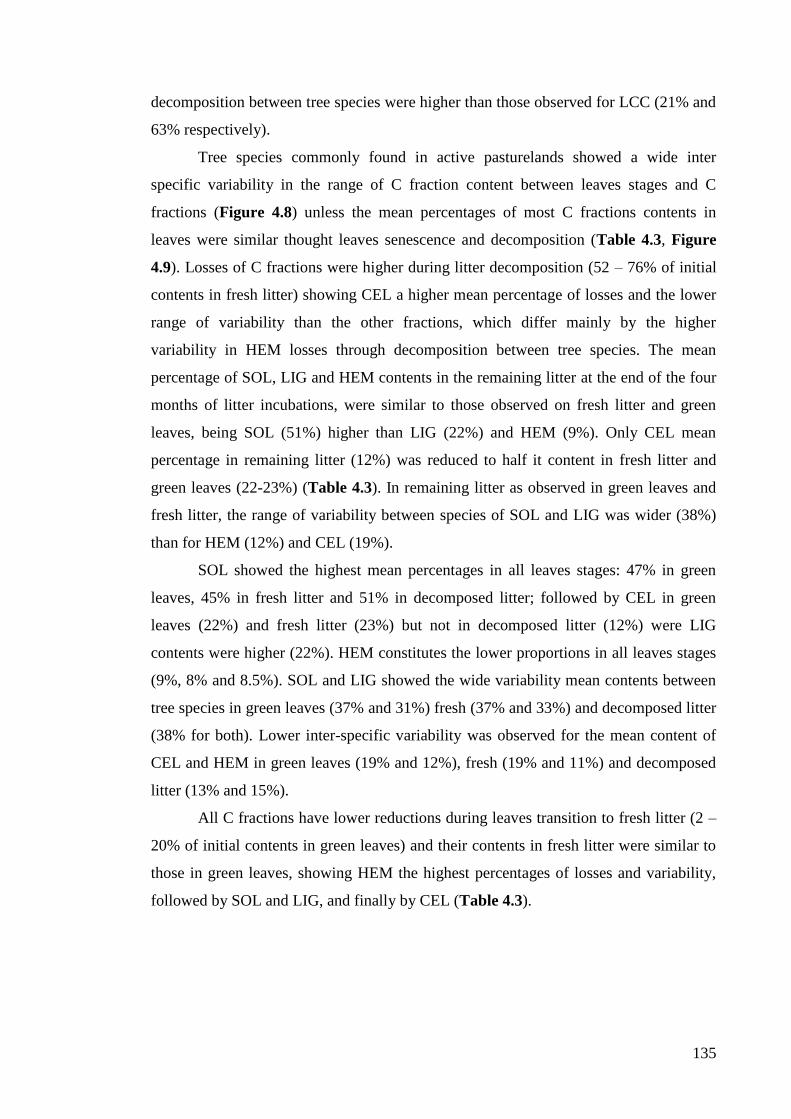
135
decomposition between tree species were higher than those observed for LCC (21% and
63% respectively).
Tree species commonly found in active pasturelands showed a wide inter
specific variability in the range of C fraction content between leaves stages and C
fractions (Figure 4.8) unless the mean percentages of most C fractions contents in
leaves were similar thought leaves senescence and decomposition (Table 4.3, Figure
4.9). Losses of C fractions were higher during litter decomposition (52 – 76% of initial
contents in fresh litter) showing CEL a higher mean percentage of losses and the lower
range of variability than the other fractions, which differ mainly by the higher
variability in HEM losses through decomposition between tree species. The mean
percentage of SOL, LIG and HEM contents in the remaining litter at the end of the four
months of litter incubations, were similar to those observed on fresh litter and green
leaves, being SOL (51%) higher than LIG (22%) and HEM (9%). Only CEL mean
percentage in remaining litter (12%) was reduced to half it content in fresh litter and
green leaves (22-23%) (Table 4.3). In remaining litter as observed in green leaves and
fresh litter, the range of variability between species of SOL and LIG was wider (38%)
than for HEM (12%) and CEL (19%).
SOL showed the highest mean percentages in all leaves stages: 47% in green
leaves, 45% in fresh litter and 51% in decomposed litter; followed by CEL in green
leaves (22%) and fresh litter (23%) but not in decomposed litter (12%) were LIG
contents were higher (22%). HEM constitutes the lower proportions in all leaves stages
(9%, 8% and 8.5%). SOL and LIG showed the wide variability mean contents between
tree species in green leaves (37% and 31%) fresh (37% and 33%) and decomposed litter
(38% for both). Lower inter-specific variability was observed for the mean content of
CEL and HEM in green leaves (19% and 12%), fresh (19% and 11%) and decomposed
litter (13% and 15%).
All C fractions have lower reductions during leaves transition to fresh litter (2 –
20% of initial contents in green leaves) and their contents in fresh litter were similar to
those in green leaves, showing HEM the highest percentages of losses and variability,
followed by SOL and LIG, and finally by CEL (Table 4.3).
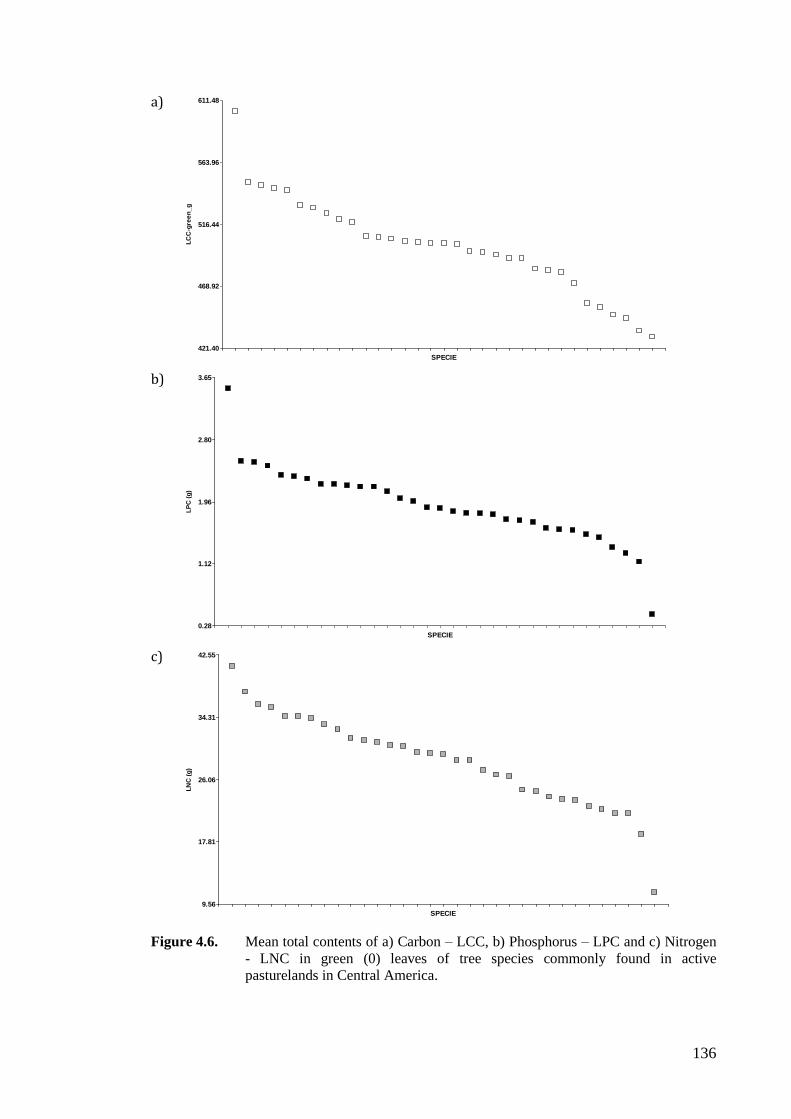
136
a)
b)
c)
Figure 4.6. Mean total contents of a) Carbon – LCC, b) Phosphorus – LPC and c) Nitrogen
- LNC in green (0) leaves of tree species commonly found in active
pasturelands in Central America.
SPECIE
421.40
468.92
516.44
563.96
611.48
LC
C-g
ree
n_
g
SPECIE
0.28
1.12
1.96
2.80
3.65
LP
C (
g)
SPECIE
9.56
17.81
26.06
34.31
42.55
LN
C (
g)
137
a)
b)
Figure 4.7. Mean total macronutrients contents (Phosphorus - LPC, Nitrogen - LNC and
Carbon - LCC) expressed in a) grammes (g) and b) percentages (%) in green
leaves (green), fresh litter (t0), remaining litter (t4) after decomposition and
their looses after leaves senescence (green –t0) and decomposition (t0 – t4)
measured in tree species commonly found in active pasturelands in Central
America. Contents in grams (g) should be divided by 100 to obtain the real
values. LPC contents in black, LNC in gray, LCC in white.
green t0 t4 x green - t0 x t0 - t4
Time
-0.49
0.31
1.11
1.91
2.70
LO
G10_M
acro
nu
trie
nt
co
nte
nt
(g)
green t0 t4 x green - t0 x t0 - t4 /100
Time0.90
1.10
1.30
1.50
1.70
1.90
LO
G10_M
acro
nu
trie
nt
co
nte
nts
(%
)

138
a)
b)
c)
Figure 4.8. Mean contents (g) of C fractions (Soluble compounds - SOL, Hemicelluloses -
HEM, Cellulose - CEL and Lignin - LIG) in a) green leaves, b) fresh (t0) and c)
remaining litter (t4) in tree species commonly found in active pasturelands in
Central America. SOL contents in white, HEM in light gray, CEL in dark grey
and LIG in black
SPECIE
0.00
0.25
0.50
0.75
1.00
Pro
po
rtio
n o
f C
Fra
cti
on
s (
g)
in G
reen
leaves
SPECIE
0.00
0.25
0.50
0.75
1.00
Pro
po
rtio
n o
f C
Fra
cti
on
s (
g)
in F
resh
Lit
ter
(t0)
SPECIES
0.00
0.25
0.50
0.75
1.00
Pro
po
rtio
n o
f C
Fra
cti
on
s (
g)
in R
em
ain
ing
lit
ter
(t4)

139
a)
b).
Figure 4.9. Mean contents of C fractions (Soluble compounds - SOL, Hemicelluloses -
HEM, Cellulose - CEL and Lignin - LIG) expressed in a) litter (g) and b)
percentages (%) in green leaves, fresh litter, remaining litter after
decomposition and their looses after leaves senescence (from green to litter
transition) and decomposition (from fresh litter to remaining litter) measured in
tree species commonly found in active pasturelands in Central America. SOL
contents in white, HEM in light gray, CEL in dark grey and LIG in black
In general, a wide variability in the mean percentages of total macronutrients and
C fractions contents were found in tree species commonly found in active pasturelands.
C fractions contents were more stable through senescence than through litter
decomposition and also than macronutrients. The low differences in the percentage of
Green t0 t4 x green - t0 _CORR x t0 - t4
Time
0.0
0.5
1.0
1.5
2.0
2.5
3.0
3.5
4.0
4.5
5.0
5.5
6.0
C F
racti
on
s
co
nte
nts
(m
g/g
)
green t0 t4 x green - t0 x t0 - t4
Time
0
10
20
30
40
50
60
70
80
C F
racti
on
co
nte
nt
(%)
140
total C contents in from green leaves to fresh litter seem to be related with SOL and
HEM looses, meanwhile the higher looses in total C during litter decomposition seem to
be more related with CEL reductions than with the reduction of the other C fractions
proportions in decomposed litter. Higher inter-specific variability was found in the
amounts of LPC and LNC through senescence and decomposition, comparable only
with the variability in HEM looses through both process.
Relationship of tree leaf litter decomposition rates with quality in leaves
and litter
As expected leaf litter decomposition rates of tree species are correlated with
fresh litter quality. Leaf litter decomposition rates of tree species naturally regenerating
in active pasturelands were correlated with leaves LDMC, with some but not all the
macronutrients i.e. LCC and LPC, and with some C fraction contents like SOL, HEM
and LIG in their fresh litter. Overall, partial and monthly decomposition rates were
negatively correlated with LDMC, C and LIG content (grames and percentages),
positively correlated with P, SOL and HEM contents (grames and percentages), and
there was no correlation with N or CEL content in tree fresh litter (Table 4.4).
Therefore those tree species with lower LDMC, C and LIG content together with the
highest P, SOL and HEM content in fresh litter had higher decomposition rates. The
strongest correlations with decomposition rates were found with LIG, followed by
HEM, P, C, SOL and LDMC.
Tree species’ contents of dry matter, C, P and N in green leaves were found to
be closely correlated with those in fresh litter (Table 4.7). LDMC and LCC in green
leaves were positively correlated with C contents in fresh litter. LPC was positively
correlated with P in fresh litter. LNC was positively correlated with N contents in fresh
litter. Other plant foliar traits measured in green leaves like SLA, LA and FTF were
correlated with litter macronutrients and C fractions but were not correlated with any
decomposition rate measured (Table 4.6). Only SLA tends to be negatively correlated
with the partial decomposition rate for the three final months of decomposition. SLA
tends to be positively correlated with N content in fresh litter. LA was negatively
correlated with N and C (percentages and grams) in fresh litter. FTF was not correlated
with any nutrient content measured in litter.
141
All C fractions measured in green leaves were tightly correlated with the
percentages of C fractions in fresh litter (Table 4.7). SOL content of green leaves was
positively and strongly correlated with SOL, followed by HEM and negatively
correlated with LIG and CEL in fresh litter. HEM in green leaves was positively
strongly correlated with HEM in fresh litter and tends to be positively correlated with
SOL and negatively correlated with LIG in fresh litter. LIG content in green leaves was
strongly and positively correlated with LIG and negatively correlated with SOL and
HEM contents in fresh litter. Finally, CEL content in green leaves was only positively
correlated with CEL contents in fresh litter. The strongest correlation between green
leaves and litter was found for CEL contents, followed by LIG, HEM and SOL
respectively, being SOL more strongly correlated with LIG in fresh litter than with
SOL.
The same correlations observed between decomposition rates and litter quality,
were found between decomposition rates and macronutrient and C fraction contents in
green leaves (¡Error! No se encuentra el origen de la referencia., Table 4.7). LDMC
and total nutrient concentrations (LPC, LNC and LCC) of green leaves were also
correlated with overall, partial and monthly decomposition rates. LCC and LDMC were
negatively correlated with overall and monthly decomposition rates and positively
correlated to remaining litter masses. LPC in green leaves was positively correlated with
overall and partial decomposition rates and negatively correlated with monthly amounts
of remaining litter. LCC and LDMC correlations with monthly decomposition rates
were stronger for the first three months than for the last four month of decomposition
(b4), similar to LPC which was not correlated at all with b4 or with T1. LNC was not
correlated at all with any decomposition rate also in green leaves and was only
negatively correlated with the remaining litter at the end of the first month of
decomposition (T1). LDMC, LCC and LPC in green leaves and fresh litter were also
correlated with decomposition rates. However, the Spearman rank correlation
coefficients were relatively less strong for LPC and LNC in green leaves (0,40 for LPC;
-0,47 for LCC; -0,38 for LDMC) than in fresh litter (0,55 for LPC, -0,39 for LCC; -0,49
for LDMC).
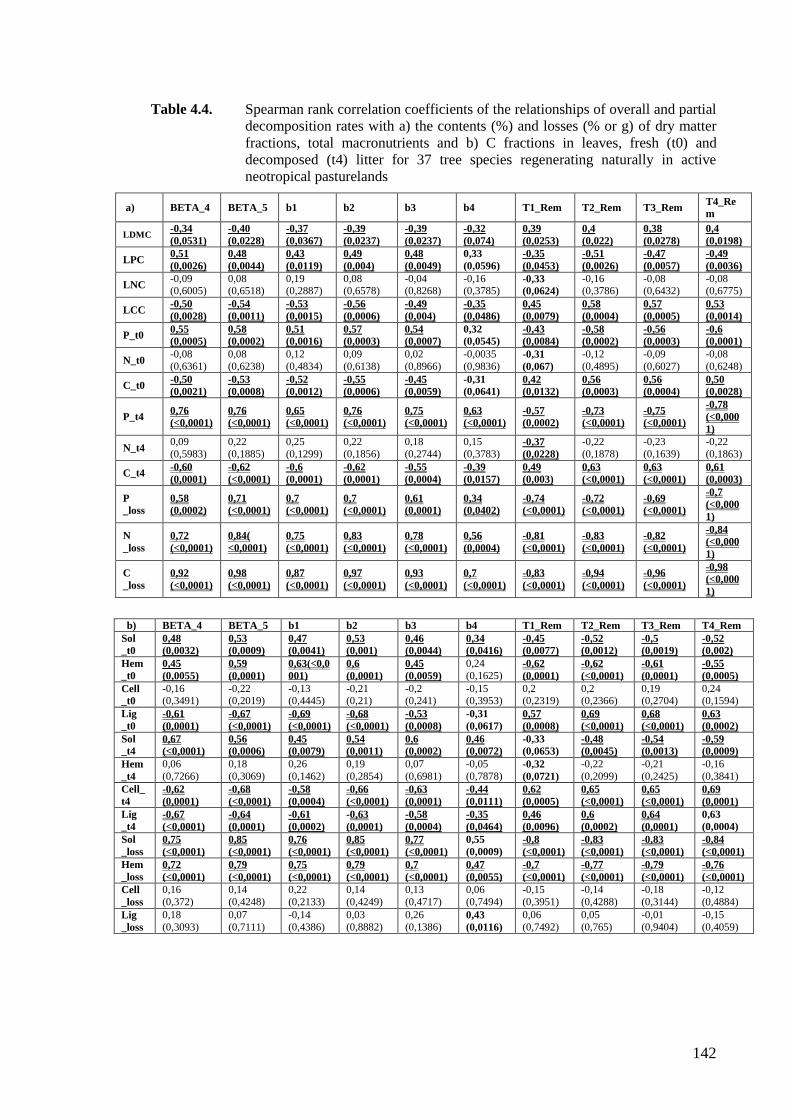
142
Table 4.4. Spearman rank correlation coefficients of the relationships of overall and partial
decomposition rates with a) the contents (%) and losses (% or g) of dry matter
fractions, total macronutrients and b) C fractions in leaves, fresh (t0) and
decomposed (t4) litter for 37 tree species regenerating naturally in active
neotropical pasturelands
a) BETA_4 BETA_5 b1 b2 b3 b4 T1_Rem T2_Rem T3_Rem T4_Re
m
LDMC -0,34
(0,0531)
-0,40
(0,0228)
-0,37
(0,0367)
-0,39
(0,0237)
-0,39
(0,0237)
-0,32
(0,074)
0,39
(0,0253)
0,4
(0,022)
0,38
(0,0278)
0,4
(0,0198)
LPC 0,51
(0,0026)
0,48
(0,0044)
0,43
(0,0119)
0,49
(0,004)
0,48
(0,0049)
0,33
(0,0596)
-0,35
(0,0453)
-0,51
(0,0026)
-0,47
(0,0057)
-0,49
(0,0036)
LNC -0,09 (0,6005)
0,08 (0,6518)
0,19 (0,2887)
0,08 (0,6578)
-0,04 (0,8268)
-0,16 (0,3785)
-0,33
(0,0624)
-0,16 (0,3786)
-0,08 (0,6432)
-0,08 (0,6775)
LCC -0,50
(0,0028)
-0,54
(0,0011)
-0,53
(0,0015)
-0,56
(0,0006)
-0,49
(0,004)
-0,35
(0,0486)
0,45
(0,0079)
0,58
(0,0004)
0,57
(0,0005)
0,53
(0,0014)
P_t0 0,55
(0,0005)
0,58
(0,0002)
0,51
(0,0016)
0,57
(0,0003)
0,54
(0,0007)
0,32
(0,0545)
-0,43
(0,0084)
-0,58
(0,0002)
-0,56
(0,0003)
-0,6
(0,0001)
N_t0 -0,08
(0,6361)
0,08
(0,6238)
0,12
(0,4834)
0,09
(0,6138)
0,02
(0,8966)
-0,0035
(0,9836) -0,31
(0,067)
-0,12
(0,4895)
-0,09
(0,6027)
-0,08
(0,6248)
C_t0 -0,50
(0,0021)
-0,53
(0,0008)
-0,52
(0,0012)
-0,55
(0,0006)
-0,45
(0,0059)
-0,31
(0,0641)
0,42
(0,0132)
0,56
(0,0003)
0,56
(0,0004)
0,50
(0,0028)
P_t4 0,76
(<0,0001)
0,76
(<0,0001)
0,65
(<0,0001)
0,76
(<0,0001)
0,75
(<0,0001)
0,63
(<0,0001)
-0,57
(0,0002)
-0,73
(<0,0001)
-0,75
(<0,0001)
-0,78
(<0,000
1)
N_t4 0,09
(0,5983)
0,22
(0,1885)
0,25
(0,1299)
0,22
(0,1856)
0,18
(0,2744)
0,15
(0,3783) -0,37
(0,0228)
-0,22
(0,1878)
-0,23
(0,1639)
-0,22
(0,1863)
C_t4 -0,60
(0,0001)
-0,62
(<0,0001)
-0,6
(0,0001)
-0,62
(0,0001)
-0,55
(0,0004)
-0,39
(0,0157)
0,49
(0,003)
0,63
(<0,0001)
0,63
(<0,0001)
0,61
(0,0003)
P
_loss
0,58
(0,0002)
0,71
(<0,0001)
0,7
(<0,0001)
0,7
(<0,0001)
0,61
(0,0001)
0,34
(0,0402)
-0,74
(<0,0001)
-0,72
(<0,0001)
-0,69
(<0,0001)
-0,7
(<0,000
1)
N
_loss
0,72
(<0,0001)
0,84(
<0,0001)
0,75
(<0,0001)
0,83
(<0,0001)
0,78
(<0,0001)
0,56
(0,0004)
-0,81
(<0,0001)
-0,83
(<0,0001)
-0,82
(<0,0001)
-0,84
(<0,000
1)
C
_loss
0,92
(<0,0001)
0,98
(<0,0001)
0,87
(<0,0001)
0,97
(<0,0001)
0,93
(<0,0001)
0,7
(<0,0001)
-0,83
(<0,0001)
-0,94
(<0,0001)
-0,96
(<0,0001)
-0,98
(<0,000
1)
b) BETA_4 BETA_5 b1 b2 b3 b4 T1_Rem T2_Rem T3_Rem T4_Rem
Sol
_t0
0,48
(0,0032)
0,53
(0,0009)
0,47
(0,0041)
0,53
(0,001)
0,46
(0,0044)
0,34
(0,0416)
-0,45
(0,0077)
-0,52
(0,0012)
-0,5
(0,0019)
-0,52
(0,002)
Hem
_t0
0,45
(0,0055)
0,59
(0,0001)
0,63(<0,0
001)
0,6
(0,0001)
0,45
(0,0059)
0,24
(0,1625) -0,62
(0,0001)
-0,62
(<0,0001)
-0,61
(0,0001)
-0,55
(0,0005)
Cell
_t0
-0,16 (0,3491)
-0,22 (0,2019)
-0,13 (0,4445)
-0,21 (0,21)
-0,2 (0,241)
-0,15 (0,3953)
0,2 (0,2319)
0,2 (0,2366)
0,19 (0,2704)
0,24 (0,1594)
Lig
_t0
-0,61
(0,0001)
-0,67
(<0,0001)
-0,69
(<0,0001)
-0,68
(<0,0001)
-0,53
(0,0008)
-0,31
(0,0617)
0,57
(0,0008)
0,69
(<0,0001)
0,68
(<0,0001)
0,63
(0,0002)
Sol
_t4
0,67
(<0,0001)
0,56
(0,0006)
0,45
(0,0079)
0,54
(0,0011)
0,6
(0,0002)
0,46
(0,0072)
-0,33
(0,0653)
-0,48
(0,0045)
-0,54
(0,0013)
-0,59
(0,0009)
Hem
_t4
0,06
(0,7266)
0,18
(0,3069)
0,26
(0,1462)
0,19
(0,2854)
0,07
(0,6981)
-0,05
(0,7878)
-0,32
(0,0721)
-0,22
(0,2099)
-0,21
(0,2425)
-0,16
(0,3841)
Cell_
t4
-0,62
(0,0001)
-0,68
(<0,0001)
-0,58
(0,0004)
-0,66
(<0,0001)
-0,63
(0,0001)
-0,44
(0,0111)
0,62
(0,0005)
0,65
(<0,0001)
0,65
(<0,0001)
0,69
(0,0001)
Lig
_t4
-0,67
(<0,0001)
-0,64
(0,0001)
-0,61
(0,0002)
-0,63
(0,0001)
-0,58
(0,0004)
-0,35
(0,0464)
0,46
(0,0096)
0,6
(0,0002)
0,64
(0,0001)
0,63
(0,0004)
Sol
_loss
0,75
(<0,0001)
0,85
(<0,0001)
0,76
(<0,0001)
0,85
(<0,0001)
0,77
(<0,0001)
0,55
(0,0009)
-0,8
(<0,0001)
-0,83
(<0,0001)
-0,83
(<0,0001)
-0,84
(<0,0001)
Hem
_loss
0,72
(<0,0001)
0,79
(<0,0001)
0,75
(<0,0001)
0,79
(<0,0001)
0,7
(<0,0001)
0,47
(0,0055)
-0,7
(<0,0001)
-0,77
(<0,0001)
-0,79
(<0,0001)
-0,76
(<0,0001)
Cell
_loss
0,16
(0,372)
0,14
(0,4248)
0,22
(0,2133)
0,14
(0,4249)
0,13
(0,4717)
0,06
(0,7494)
-0,15
(0,3951)
-0,14
(0,4288)
-0,18
(0,3144)
-0,12
(0,4884)
Lig
_loss
0,18
(0,3093)
0,07
(0,7111)
-0,14
(0,4386)
0,03
(0,8882)
0,26
(0,1386) 0,43
(0,0116)
0,06
(0,7492)
0,05
(0,765)
-0,01
(0,9404)
-0,15
(0,4059)
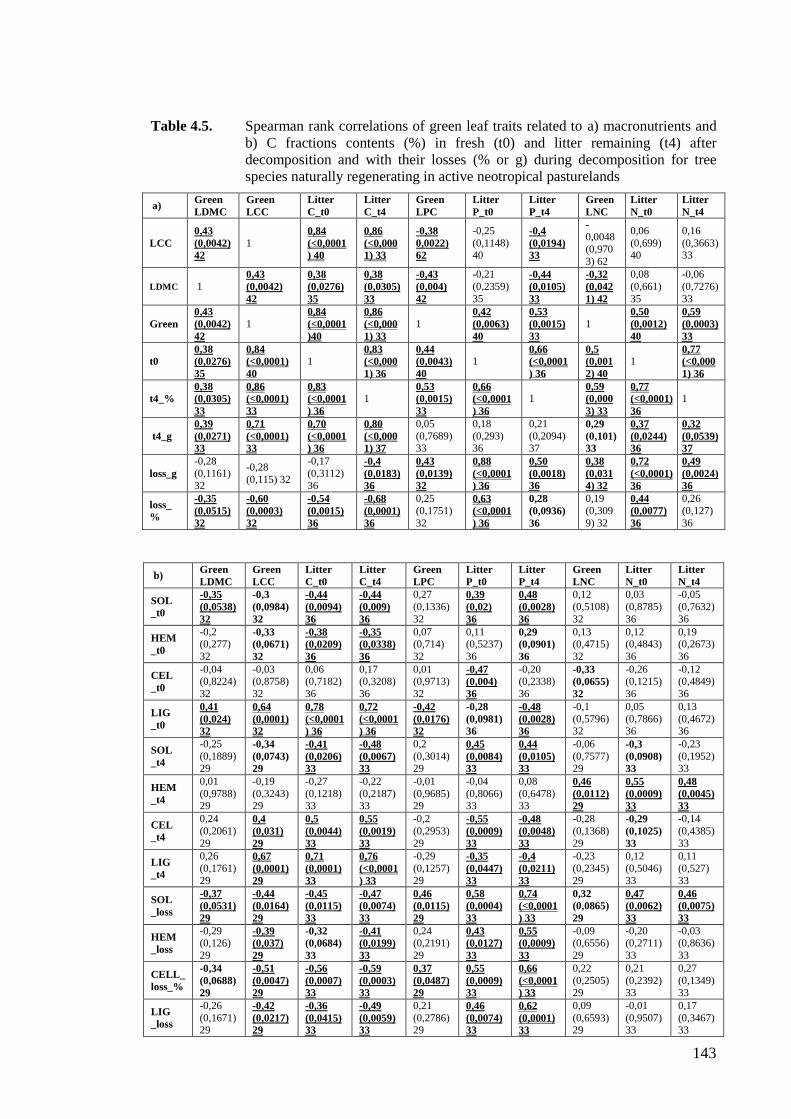
143
Table 4.5. Spearman rank correlations of green leaf traits related to a) macronutrients and
b) C fractions contents (%) in fresh (t0) and litter remaining (t4) after
decomposition and with their losses (% or g) during decomposition for tree
species naturally regenerating in active neotropical pasturelands
a) Green
LDMC
Green
LCC
Litter
C_t0
Litter
C_t4
Green
LPC
Litter
P_t0
Litter
P_t4
Green
LNC
Litter
N_t0
Litter
N_t4
LCC
0,43
(0,0042)
42
1 0,84
(<0,0001
) 40
0,86
(<0,000
1) 33
-0,38
0,0022)
62
-0,25
(0,1148) 40
-0,4
(0,0194)
33
-0,0048
(0,970
3) 62
0,06
(0,699) 40
0,16
(0,3663) 33
LDMC 1 0,43
(0,0042)
42
0,38
(0,0276)
35
0,38
(0,0305)
33
-0,43
(0,004)
42
-0,21
(0,2359)
35
-0,44
(0,0105)
33
-0,32
(0,042
1) 42
0,08
(0,661)
35
-0,06
(0,7276)
33
Green
0,43
(0,0042)
42
1 0,84
(<0,0001
)40
0,86
(<0,000
1) 33
1 0,42
(0,0063)
40
0,53
(0,0015)
33
1 0,50
(0,0012)
40
0,59
(0,0003)
33
t0
0,38
(0,0276)
35
0,84
(<0,0001)
40
1 0,83
(<0,000
1) 36
0,44
(0,0043)
40
1 0,66
(<0,0001
) 36
0,5
(0,001
2) 40
1 0,77
(<0,000
1) 36
t4_%
0,38
(0,0305)
33
0,86
(<0,0001)
33
0,83
(<0,0001
) 36
1 0,53
(0,0015)
33
0,66
(<0,0001
) 36
1 0,59
(0,000
3) 33
0,77
(<0,0001)
36
1
t4_g
0,39
(0,0271)
33
0,71
(<0,0001)
33
0,70
(<0,0001
) 36
0,80
(<0,000
1) 37
0,05
(0,7689) 33
0,18
(0,293) 36
0,21
(0,2094) 37
0,29
(0,101)
33
0,37
(0,0244)
36
0,32
(0,0539)
37
loss_g
-0,28
(0,1161) 32
-0,28
(0,115) 32
-0,17
(0,3112) 36
-0,4
(0,0183)
36
0,43
(0,0139)
32
0,88
(<0,0001
) 36
0,50
(0,0018)
36
0,38
(0,031
4) 32
0,72
(<0,0001)
36
0,49
(0,0024)
36
loss_
%
-0,35
(0,0515)
32
-0,60
(0,0003)
32
-0,54
(0,0015)
36
-0,68
(0,0001)
36
0,25
(0,1751)
32
0,63
(<0,0001
) 36
0,28
(0,0936)
36
0,19
(0,309
9) 32
0,44
(0,0077)
36
0,26
(0,127)
36
b) Green
LDMC
Green
LCC
Litter
C_t0
Litter
C_t4
Green
LPC
Litter
P_t0
Litter
P_t4
Green
LNC
Litter
N_t0
Litter
N_t4
SOL
_t0
-0,35
(0,0538)
32
-0,3
(0,0984)
32
-0,44
(0,0094)
36
-0,44
(0,009)
36
0,27
(0,1336)
32
0,39
(0,02)
36
0,48
(0,0028)
36
0,12
(0,5108)
32
0,03
(0,8785)
36
-0,05
(0,7632)
36
HEM
_t0
-0,2 (0,277)
32
-0,33
(0,0671)
32
-0,38
(0,0209)
36
-0,35
(0,0338)
36
0,07 (0,714)
32
0,11 (0,5237)
36
0,29
(0,0901)
36
0,13 (0,4715)
32
0,12 (0,4843)
36
0,19 (0,2673)
36
CEL
_t0
-0,04 (0,8224)
32
-0,03 (0,8758)
32
0,06 (0,7182)
36
0,17 (0,3208)
36
0,01 (0,9713)
32
-0,47
(0,004)
36
-0,20 (0,2338)
36
-0,33
(0,0655)
32
-0,26 (0,1215)
36
-0,12 (0,4849)
36
LIG
_t0
0,41
(0,024)
32
0,64
(0,0001)
32
0,78
(<0,0001
) 36
0,72
(<0,0001
) 36
-0,42
(0,0176)
32
-0,28
(0,0981)
36
-0,48
(0,0028)
36
-0,1
(0,5796) 32
0,05
(0,7866) 36
0,13
(0,4672) 36
SOL
_t4
-0,25
(0,1889)
29
-0,34
(0,0743)
29
-0,41
(0,0206)
33
-0,48
(0,0067)
33
0,2
(0,3014)
29
0,45
(0,0084)
33
0,44
(0,0105)
33
-0,06
(0,7577)
29
-0,3
(0,0908)
33
-0,23
(0,1952)
33
HEM
_t4
0,01
(0,9788) 29
-0,19
(0,3243) 29
-0,27
(0,1218) 33
-0,22
(0,2187) 33
-0,01
(0,9685) 29
-0,04
(0,8066) 33
0,08
(0,6478) 33
0,46
(0,0112)
29
0,55
(0,0009)
33
0,48
(0,0045)
33
CEL
_t4
0,24
(0,2061)
29
0,4
(0,031)
29
0,5
(0,0044)
33
0,55
(0,0019)
33
-0,2
(0,2953)
29
-0,55
(0,0009)
33
-0,48
(0,0048)
33
-0,28
(0,1368)
29
-0,29
(0,1025)
33
-0,14
(0,4385)
33
LIG
_t4
0,26
(0,1761)
29
0,67
(0,0001)
29
0,71
(0,0001)
33
0,76
(<0,0001
) 33
-0,29
(0,1257)
29
-0,35
(0,0447)
33
-0,4
(0,0211)
33
-0,23
(0,2345)
29
0,12
(0,5046)
33
0,11
(0,527)
33
SOL
_loss
-0,37
(0,0531)
29
-0,44
(0,0164)
29
-0,45
(0,0115)
33
-0,47
(0,0074)
33
0,46
(0,0115)
29
0,58
(0,0004)
33
0,74
(<0,0001
) 33
0,32
(0,0865)
29
0,47
(0,0062)
33
0,46
(0,0075)
33
HEM
_loss
-0,29 (0,126)
29
-0,39
(0,037)
29
-0,32
(0,0684)
33
-0,41
(0,0199)
33
0,24 (0,2191)
29
0,43
(0,0127)
33
0,55
(0,0009)
33
-0,09 (0,6556)
29
-0,20 (0,2711)
33
-0,03 (0,8636)
33
CELL_
loss_%
-0,34
(0,0688)
29
-0,51
(0,0047)
29
-0,56
(0,0007)
33
-0,59
(0,0003)
33
0,37
(0,0487)
29
0,55
(0,0009)
33
0,66
(<0,0001
) 33
0,22
(0,2505)
29
0,21
(0,2392)
33
0,27
(0,1349)
33
LIG
_loss
-0,26
(0,1671) 29
-0,42
(0,0217)
29
-0,36
(0,0415)
33
-0,49
(0,0059)
33
0,21
(0,2786) 29
0,46
(0,0074)
33
0,62
(0,0001)
33
0,09
(0,6593) 29
-0,01
(0,9507) 33
0,17
(0,3467) 33

144
Table 4.6. Spearman rank correlations of green leaf traits related to a) macronutrients with
macronutrient and b) C fractions contents (%) in fresh (t0) and litter remaining
(t4) after decomposition and with their losses during decomposition for tree
species naturally regenerating in active neotropical pasturelands
a)
SLA LA FTF1
P_t0 -0,13 (0,4777) 34 0,1 (0,5843) 35 -0,24 (0,1506) 36
N_t0 0,28 (0,104) 34 -0,53 (0,0011) 35 -0,18 (0,2986) 36
C_t0 -0,02 (0,9111) 34 -0,29 (0,0958) 35 0,06 (0,7073) 36
P_t4 -0,06 (0,7514) 32 -0,17 (0,3492) 33 -0,28 (0,1144) 34
N_t4 0,16 (0,383) 32 -0,48 (0,0049) 33 -0,18 (0,3002) 34
C_t4 -0,06 (0,7518) 32 -0,31 (0,0798) 33 0,06 (0,7492) 34
P_t4_g 0,14 (0,4605) 32 -0,36 (0,0419) 33 -0,25 (0,1554) 34
N_t4_g 0,29 (0,1096) 32 -0,41 (0,0168) 33 0,03 (0,8636) 34
C_t4_g 0,11 (0,5339) 32 -0,2 (0,2734) 33 0,13 (0,4609) 34
P_loss_g -0,14 (0,4366) 31 0,19 (0,3094) 32 -0,26 (0,1391) 33
N_loss_g -0,01 (0,9442) 31 -0,23 (0,2001) 32 -0,09 (0,6072) 33
C_loss_g -0,3 (0,1065) 31 -0,05 (0,7711) 32 -0,24 (0,177) 33
P_loss_% -0,16 (0,3855) 31 0,29 (0,1026) 32 -0,12 (0,5131) 33
N_loss_% -0,12 (0,5312) 31 -0,04 (0,8351) 32 -0,15 (0,3897) 33
C_loss_% -0,25 (0,1773) 31 0,1 (0,592) 32 -0,18 (0,3073) 33
b)
SLA LA FTF1
DF_t0 -0,09 (0,6378) 31 0,09 (0,6378) 32 -0,2 (0,271) 33
Hem_t0 -0,14 (0,4476) 31 0,11 (0,5604) 32 -0,17 (0,3479) 33
Cell_t0 0,08 (0,6738) 31 0,02 (0,9238) 32 0,34 (0,0561) 33
Lig_t0 0,06 (0,7495) 31 -0,21 (0,2528) 32 0,01 (0,9712) 33
Sol_t4_% -0,42 (0,0269) 28 0,31 (0,1027) 29 0,08 (0,6657) 30
Hem_t4_% 0,2 (0,3111) 28 -0,16 (0,4096) 29 0,09 (0,6256) 30
Cell_t4_% 0,13 (0,5139) 28 -0,09 (0,6318) 29 0,14 (0,4708) 30
Lig_t4_% 0,29 (0,1375) 28 -0,3 (0,1192) 29 -0,19 (0,3177) 30
Sol_t4_g -0,07 (0,7181) 28 0,05 (0,7863) 29 0,11 (0,5759) 30
Hem_t4_g 0,29 (0,1283) 28 -0,25 (0,1886) 29 0,14 (0,463) 30
Cell_t4_g 0,24 (0,21) 28 -0,01 (0,9676) 29 0,09 (0,6549) 30
Lig_t4_g 0,28 (0,1515) 28 -0,19 (0,3313) 29 -0,11 (0,5668) 30
Sol_loss_g -0,08 (0,6961) 28 -0,11 (0,5871) 29 -0,19 (0,3023) 30
Hem_loss_g -0,32 (0,0928) 28 0,2 (0,2968) 29 -0,06 (0,7374) 30
Cell_loss_g -0,15 (0,4425) 28 -0,04 (0,8474) 29 0,42 (0,0207) 30
Lig_loss_g -0,16 (0,4286) 28 -0,2 (0,2958) 29 -0,24 (0,2037) 30
Sol_loss_% -0,01 (0,9405) 28 -0,14 (0,4707) 29 -0,23 (0,2279) 30
Hem_loss_% -0,32 (0,098) 28 0,19 (0,3328) 29 -0,13 (0,5012) 30
Cell_loss_% -0,28 (0,1558) 28 0,08 (0,6966) 29 -0,01 (0,9622) 30
Lig_loss_% -0,35 (0,0716) 28 0,17 (0,3816) 29 -0,1 (0,6053) 30
The positive relationships of each macronutrient content in green leaves with
their content in fresh litter imply that the relative concentrations of C, N, P and C
fractions in green leaves amongst species do not change strongly during leaf senescence
or indeed during decomposition, as green leaf LDMC, LCC, LPC, LNC and C fractions
are good predictors of C, P and N contents in fresh litter (Figure 4.7).

145
Table 4.7. Spearman correlations between a) C fractions contents in green leaves (n = 15)
and b) C fractions contents in fresh litter (n = 33) with C fractions contents in
fresh litter (t0), remaining litter (t4) and with their looses during decomposition
process of tree species naturally regenerating in active neotropical pasturelands
a)
Litter Sol_Green Hem_Green Cell_Green Lig_Green
Sol_t0 0,53 (0,0326) 17 0,44 (0,076) 17 -0,4 (0,11) 17 -0,52 (0,0377) 17
Hem_t0 0,51 (0,0359) 17 0,56 (0,0183) 17 -0,1 (0,701) 17 -0,6 (0,0114) 17
Cell_t0 -0,49 (0,0522) 17 -0,07 (0,7687) 17 0,75 (0,0025) 17 0,19 (0,4562) 17
Lig_t0 -0,62 (0,0128) 17 -0,45 (0,0697) 17 0,2 (0,4329) 17 0,71 (0,0047) 17
Sol_t4 0,6 (0,0248) 15 0,22 (0,4074) 15 -0,31 (0,2505) 15 -0,54 (0,0422) 15
Hem_t4 -0,05 (0,8516) 15 0,47 (0,08) 15 -0,1 (0,7083) 15 -0,07 (0,7893) 15
Cell_t4 -0,63 (0,018) 15 -0,34 (0,1995) 15 0,61 (0,0223) 15 0,51 (0,0543) 15
Lig_t4 -0,5 (0,0595) 15 -0,43 (0,1118) 15 0,2 (0,4543) 15 0,67 (0,012) 15
Sol_t0_g 0,57 (0,0166) 17 0,37 (0,1392) 17 -0,45 (0,0725) 17 -0,56 (0,0196) 17
Hem_t0_g 0,55 (0,021) 17 0,49 (0,0475) 17 -0,15 (0,5698) 17 -0,67 (0,003) 17
Cell_t0_g -0,52 (0,0334) 17 -0,08 (0,7682) 17 0,7 (0,0017) 17 0,2 (0,4418) 17
Lig_t0_g -0,57 (0,0235) 17 -0,49 (0,0522) 17 0,15 (0,5368) 17 0,64 (0,0102) 17
Sol_t4_g -0,47 (0,077) 15 -0,0036 (0,9899) 15 0,67 (0,0059) 15 0,36 (0,1815) 15
Hem_t4_g -0,61 (0,0167) 15 0,4 (0,1373) 15 0,39 (0,1532) 15 0,33 (0,2368) 15
Cell_t4_g -0,65 (0,015) 15 -0,3 (0,2617) 15 0,56 (0,0371) 15 0,59 (0,0284) 15
Lig_t4_g -0,65 (0,0156) 15 -0,27 (0,3098) 15 0,39 (0,1416) 15 0,63 (0,0187) 15
Sol_loss_g 0,63 (0,0194) 15 0,25 (0,3565) 15 -0,65 (0,015) 15 -0,59 (0,0284) 15
Hem_loss_g 0,83 (0,0001) 15 -0,23 (0,4005) 15 -0,53 (0,0432) 15 -0,61 (0,0154) 15
Cell_loss_g -0,35 (0,2012) 15 -0,11 (0,6979) 15 0,58 (0,0241) 15 0,05 (0,8589) 15
Lig_loss_g 0,11 (0,6939) 15 -0,34 (0,2203) 15 -0,01 (0,9697) 15 0,13 (0,6336) 15
Sol_loss_% 0,65 (0,0145) 15 0,17 (0,53) 15 -0,73 (0,0064) 15 -0,55 (0,0383) 15
Hem_loss_% 0,75 (0,0048) 15 -0,16 (0,5565) 15 -0,48 (0,0733) 15 -0,53 (0,0495) 15
Cell_loss_% 0,68 (0,0115) 15 0,12 (0,6592) 15 -0,48 (0,0733) 15 -0,66 (0,0139) 15
Lig_loss_% 0,63 (0,018) 15 -0,03 (0,9043) 15 -0,29 (0,2732) 15 -0,5 (0,0614) 15
b)
Litter Sol_t0 Hem_t0 Cel_t0 Lig_t0
Sol_t4_% 0,73 (<0,0001) 33 0,14 (0,4526) 33 -0,44 (0,0128) 33 -0,63 (0,0004) 33
Hem_t4_% 0,1 (0,5775) 33 0,48 (0,005) 33 0,09 (0,6299) 33 -0,41 (0,0169) 33
Cell_t4_% -0,84 (<0,0001) 33 -0,38 (0,0278) 33 0,65 (0,0003) 33 0,73 (<0,0001) 33
Lig_t4_% -0,56 (0,0016) 33 -0,45 (0,0085) 33 0,24 (0,1789) 33 0,86 (<0,0001) 33
Sol_t0_g 0,98 (<0,0001) 36 0,12 (0,4958) 36 -0,56 (0,0004) 36 -0,71 (<0,0001) 36
Hem_t0_g 0,15 (0,3699) 36 0,99 (<0,0001) 36 -0,03 (0,8498) 36 -0,48 (0,0029) 36
Cell_ t0_g -0,55 (0,0005) 36 -0,05 (0,7593) 36 0,97 (<0,0001) 36 0,11 (0,5342) 36
Lig_ t0_g -0,69 (<0,0001) 36 -0,48 (0,0033) 36 0,06 (0,7221) 36 0,99 (<0,0001) 36
Sol_t4_g -0,13 (0,4625) 33 -0,48 (0,0051) 33 0,01 (0,9514) 33 0,31 (0,0838) 33
Hem_t4_g -0,32 (0,0703) 33 0,08 (0,6557) 33 0,28 (0,1098) 33 0,1 (0,5939) 33
Cell_t4_g -0,69 (<0,0001) 33 -0,56 (0,0007) 33 0,44 (0,0109) 33 0,74 (<0,0001) 33
Lig_t4_g -0,58 (0,0004) 33 -0,56 (0,0007) 33 0,27 (0,1248) 33 0,85 (<0,0001) 33
Sol_loss_g 0,8 (<0,0001) 33 0,38 (0,027) 33 -0,53 (0,003) 33 -0,72 (<0,0001) 33
Hem_loss_g 0,23 (0,2063) 33 0,74 (<0,0001) 33 -0,18 (0,3183) 33 -0,41 (0,0167) 33
Cell_loss_g -0,41 (0,0171) 33 0,25 (0,1578) 33 0,83 (<0,0001) 33 -0,09 (0,6296) 33
Lig_loss_g -0,38 (0,0294) 33 -0,03 (0,8774) 33 0,01 (0,9727) 33 0,56 (0,0007) 33
Sol_loss_% 0,6 (0,0007) 33 0,49 (0,0039) 33 -0,36 (0,0402) 33 -0,62 (0,0004) 33
Hem_loss_% 0,31 (0,081) 33 0,48 (0,005) 33 -0,3 (0,0932) 33 -0,35 (0,0486) 33
Cell_loss_% 0,52 (0,0021) 33 0,61 (0,0002) 33 -0,2 (0,2539) 33 -0,72 (<0,0001) 33
Lig_loss_% 0,29 (0,0954) 33 0,41 (0,0183) 33 -0,25 (0,1601) 33 -0,34 (0,0522) 33

146
In general, tree species with higher LCC and LDMC had higher C contents in
fresh and decomposed at a lower rate. Meanwhile, those tree species with higher green
leaf LPC and LNC contents have higher contents in fresh litter and decomposed quickly
(Table 4.7). In addition, those tree species with the lower LDMC, C and LIG content
together with the highest P, SOL and HEM content in green and fresh litter had the
higher decomposition rates. Finally, tree species with the cheapest leaf construction
(high SLA) have a high N content in fresh litter and tend to have low LA, meanwhile
those with a high FTF have higher amounts of CEL in fresh litter but this no-chemical
leaf traits were not correlated with decomposition rates.
Relationship of the overall leaf litter decomposition rates with
macronutrients and C fractions releases
Decomposition rates were correlated with some of the macronutrients and C
fractions contents in the remaining litter at the end of the four months of litter
incubation (Table 4.4). Tree species with the higher decomposition rates have the lower
amounts of P, C, SOL, CEL and LIG (grams or percentages) in remaining litter. Tree
species with higher decomposition rates were also negatively correlated with N and
HEM amounts (grams) in remaining litter but were not correlated with the proportion of
the initial contents in litter of N and HEM (percentage) founded in the remaining litter
(Table 4.4).
These results suggest that those species with higher decomposition rates and the
higher amounts of P, SOL and HEM were releasing the higher amounts and proportions
of these components through faster litter decomposition. In addition, these results imply
that no matter the lowest amounts of Total C and LIG contents in fresh litter, those
species with the higher decomposition rates were also releasing the higher proportion
and amounts o these two components during remaining litter. Meanwhile, tree species
the higher releases of CEL and N during decay process and with faster decomposition
rates were not depending on the amounts of these components in the tree litter.
The measured decomposition rates parameters were also positively correlated
with P, N, C, SOL and HEM contents released during decomposition process (Table
4.4). These results confirm that those tree species with the higher decomposition rates,
release the higher amounts and proportions of the more the labile fractions (P, N, SOL
and HEM) and total C during decomposition process. The proportion (%) of the initial
amounts of CEL and LIG in fresh litter released during decomposition process were

147
also positively correlated with decomposition rates, meanwhile the amount of LIG
losses (grams) was only positively correlated with the decomposition rates during the
last month of litter incubation (b4) (Table 4.4).
These results show that higher decomposition rates also reflect the lost of a
higher proportion of the recalcitrant litter components (LIG and HEM) content in fresh
litter, unless a higher proportion (percentage) released of recalcitrant fractions do not
represent precisely a highest total amount (grams) released of these components
throughout litter decomposition process. Specifically, some tree species having a higher
decomposition rates released lowest amounts (grams) of LIG at the end of litter
incubation, meanwhile others tree species also with higher overall decomposition rates,
released some of the highest total amounts of LIG. Thus, higher percentages of LIG
releases can be observed when higher amounts of total LIG are released from litter or
when lower amounts are released, depending on the initial amounts of LIG in the fresh
litter. This result showed also that the released amounts (grams) of recalcitrant fractions
can be highly variable during all litter decomposition process like in case of CEL,
meanwhile this variability was observed only for the initial stages of litter
decomposition in case of LIG, which showed also higher amounts (grams) with higher
decomposition rates at the final month of litter decay.
Macronutrient content in green leaves were also positively correlated with
macronutrient concentration in remaining litter and to the amounts released after
decomposition process (Figure 4.8). These results imply also that the relative
concentrations of C, N and P in green leaves amongst species do not change strongly
even during decomposition, as green leaf LDMC, LCC, LPC and LNC are good
predictors of C, P and N contents in remaining litter after decomposition process and to
the amounts of these nutrients released. In general, tree species with higher LCC and
LDMC had higher C contents in fresh and decomposed litter and released C at a lower
rate. Meanwhile, those tree species with higher green leaf LPC and LNC contents have
higher contents in fresh litter and decomposed litter but also released higher amounts of
these nutrients (Table 4.5).
More specifically, LDMC and LCC in green leaves were both positively
correlated with total C concentrations in fresh and remaining litter and were also both
negatively correlated with the percentage loss of C mass during litter decomposition.
However, LCC was more strongly correlated with C concentrations in litter and with the
rate of release during decomposition than was LDMC. LPC and LNC in green leaves

148
were positively correlated to P and N contents respectively (percentages or grams) in
fresh and remaining litter and positively correlated to P and N releases (grams)
respectively during decomposition process. LPC in green leaves was also negatively
correlated to C contents (%) in remaining litter and positively correlated to C looses
(percentages or grams) during decomposition. LPC tend also to be negatively correlated
to N content (percentage and grams) in fresh litter and remaining litter (grams).
C fractions measured in green leaves were also correlated with C fraction losses
during litter decomposition (Table 4.7). SOL and LIG contents in green leaves were
respectively positively and negatively correlated with the percentage of initial contents
of all C fractions released during decomposition. CEL contents in green leaves was
strongly and negatively correlated with the initial percentage of SOL released during
decomposition, meanwhile negative correlations between CEL with HEM and CELL
losses were weakest. SOL in addition to LIG and CEL were positive and negatively
correlated respectively with the amounts of SOL and HEM released during
decomposition. In contrast, HEM content in green leaves was not correlated at all with
any C fraction losses during litter decomposition.
Leaf traits different to the chemical contents in leaf tissues like SLA, LA and
FTF were also correlated with macronutrient content in remaining litter and but only
with C releases during decomposition (Table 4.9). SLA tends to be positively correlated
also with N content in remaining litter and negatively correlated with C losses during
decomposition process. LA was also negatively correlated with N, P and C contents
remaining litter, but again was not correlated with any macronutrients losses during
decomposition process.
Changes in content of carbon fractions between green leaves, fresh litter
and litter remaining after decomposition
The correlations between macronutrients and foliar C fractions with their
contents in the following leaf decay stages like fresh litter and decomposed litter state
the relationships and influence that the amounts and proportion of one leaf component
have over the precedent i.e. a higher amount of SOL has been found positively related
with higher amounts of SOL in litter and decomposed litter. Therefore, the initial
amounts of these components in mature leaves covary with the amounts after
senescence in fresh litter, and after decomposition process in the remaining litter.
However, how each component interact with the other ones within each leaf stages

149
gives additional information about if these previously observed changes over leaf stages
are also more stable than others, helping to explain the variability observed in
macronutrients and C fractions though senescence and decomposition.
The strength of some relationships amongst the contents of the three
macronutrients differed between green leaves, fresh litter and decomposed litter. At all
three stages LCC was negatively correlated with LPC but not correlated with LNC.
However, LPC was positively correlated with LNC only in green leaves but not in fresh
or decomposed litter (Table 4.8, Figure 4.8). These results showed that some
macronutrients relationships were more stable though senescence and decomposition,
like the relationships between total C and P. Meanwhile the observed decreasing
concentrations of total P and N varies independently from each other through leaf
decay.
Table 4.8. Spearman rank correlations between a) C fraction and b) macronutrients
contents (%) among green leaves, fresh litter (t0), litter remaining after
decomposition (t4) and C fraction looses (% or g) during decomposition process
of tree species naturally regenerating in active neotropical pasturelands
a)
Green leaves Sol_green Hem_green Cel_green Lig_green
Hem_green -0,09 (0,6987) 19
Cel_green -0,63 (0,0077) 19 0,21 (0,3638) 19
Lig_green -0,73 (0,0019) 19 -0,36 (0,1308) 19 0,27 (0,2486) 19
Fresh litter Sol_t0 Hem_t0 Cel_t0 Lig_t0
Hem_t0 0,14 (0,4275) 36
Cell_t0 -0,58 (0,0007) 36 -0,02 (0,9057) 36
Lig_t0 -0,72 (<0,0001) 36 -0,48 (0,0028) 36 0,1 (0,5638) 36
Remainig litter Sol_t4 Hem_t4 Cel_t4 Lig_t4
Hem_t4 -0,19 (0,2852) 33
Cell_t4 -0,66 (0,0002) 33 -0,29 (0,0984) 33
Lig_t4 -0,78 (<0,0001) 33 -0,23 (0,2033) 33 0,66 (0,0002) 33
Losses Sol_loss_% Hem_loss_% Cell_loss_% Lig_loss_%
Hem_loss_% 0,48 (0,0071) 33
Cel_loss_% 0,85 (<0,0001) 33 0,65 (<0,0001) 33
Lig_loss_% 0,58 (0,0011) 33 0,76 (<0,0001) 33 0,76 (<0,0001) 33
b)
Green leaves LCC_2 LPC_2
LPC -0,38 (0,0022) 62
LNC -0,0048 (0,9703) 62 0,27 (0,0362) 62
Fresh litter C_t0_% P_t0_%
P_t0 -0,29 (0,0545) 44
N_t0 0,09 (0,5782) 44 0,11 (0,4835) 44
Remainig litter C_t4_% P_t4_%
P_t4 -0,45 (0,005) 37
N_t4 0,14 (0,3977) 37 0,25 (0,1293) 37

150
Also the strength of some relationships between C fraction contents varied
between leaf material degradation states i.e between green leaf, fresh litter and
remaining litter (Table 4.8, Figure 4.9). In green leaves SOL content was negatively
correlated with CEL and LIG within green leaves. In addition, C fractions correlations
within fresh litter include also a negative correlation between HEM and LIG content.
SOL was negatively correlated with HEM and CEL within remaining litter, meanwhile
HEM tends to be negatively correlated with CEL and CEL was negatively correlated
with LIG. Therefore, negative correlations between SOL with CEL and LIG were found
in all the degradation states (more conservative relationships) and were stronger within
remaining litter. In contrast, the negative correlation among HEM and LIG was found
just in fresh litter (not in green leaves either remaining litter). In addition, the negative
correlation between HEM with CEL together with the positive correlation of CEL with
LIG, were observed only in the remaining litter. Finally, all the percentages of initial C
fraction lost during decomposition process were negatively correlated with each other.
These results indicate that some correlations between C fractions were stable
during leaf senescence and litter decomposition processes, while the rate of mass loss of
other C fractions was more variable through both processes. Tree species with higher
contents of soluble compounds had lower amounts of celluloses and lignin in green
litter, after leaves senescence and after litter decomposition. In contrast, those tree
species having reduced amounts of hemicelluloses after senescence process had higher
amounts of LIG in fresh litter but lowest contest of CEL after decomposition, no matter
HEM contents were not directly related with LIG or CEL contents in green leaves. In
addition, those species with higher amounts of LIG after decomposition had higher
amounts of celluloses in remaining litter, unless CEL contents were not related with
LIG contents in green or fresh litter.
Relationships of plant traits with decomposition rates, tree litter quality and
nutrient release
Plant traits were correlated with litter decomposition rates
Whole plant, leaf and dispersal traits of tree species naturally regenerating in
active neotropical pasturelands were correlated with leaf litter decomposition rates
(Table 4.9). The whole plant trait H_max was negatively correlated with partial and
monthly decomposition rates but not with overall decomposition rate. Negative
correlations were found between H_max and decomposition rates during the latest

151
months of litter incubation (b3, b4). In contrast, WD and PHE were not correlated with
any measured decomposition rate. These results mean that taller tree species also have
the lowest decomposition rates toward the end of the decomposition process. Taller tree
species has been found also correlated with other whole plant traits like PHE, leaf traits
and with particular dispersal traits and tree natural regeneration capacity (see Chapters 1
and 2).
Dispersal traits of tree species were also negatively correlated with
decomposition rates and positively correlated with remaining litter mass (Table 4.9).
Vol_see, Mass_see and Vol_fru were similarly correlated negatively with i) overall
decomposition rates (strongly to those calculated using the quadratic model) and ii)
partial and monthly decay rates during the first two months of litter decomposition (b1,
b2). However, they were positively correlated with remaining litter mass at the end of
the second and third months of litter incubations (T2, T3). The strongest correlations
were observed for Vol_see, Mass_see and Vol_Fru with decomposition rates and
remaining litter mass during the first month. Only Mass_see was correlated with
decomposition rates during the first month of litter decay.
Whole plant traits were correlated with litter quality
Whole plant traits like H_max, WD and PHE were correlated with the
macronutrient and C fraction contents of fresh litter and their release during the litter
decomposition process (Table 4.11). H_max was positively correlated with total carbon
contents in remaining litter and tended to be negatively correlated with the percentages
of initial total C and N released during litter decomposition. In addition, H_max was
positively correlated with the mass of total P and C within the remaining litter. WD
tends to be negatively correlated with the P concentration in the remaining litter. In
contrast, PHE was not correlated with any macronutrient content or losses either in fresh
or litter remaining after decomposition.
H_max was negatively correlated with HEM and positively correlated with LIG
content in fresh litter and in remaining litter and was also positively correlated with
CEL contents in remaining litter (Table 4.11). WD tends to be positively correlated
with HEM content in fresh litter. PHE was also negatively correlated with HEM in
remaining litter but not with any other C content in fresh litter. In addition, any of these
whole plant traits H_max, WD or PHE were correlated with C fraction losses.

152
Table 4.9. Spearman rank correlation coefficients of overall (Beta_5), partial (Beta_4)
monthly decomposition rates (b1, b2, b3, b4) and percentages of litter mass
remaining after decomposition (T1, T2, T3, T4) with vegetative, leaf and
dispersal traits of tree species commonly found in active neotropical
pasturelands
BETA_5 BETA_4 b1 b2 b3 b4 T1_Rem T2_Rem T3_Rem T4_Rem
H_max
(n=36)
-0,25 (0,1366
-0,31
(0,0648)
-0,1 (0,5744)
-0,22 (0,1948)
-0,34
(0,043)
-0,48
(0,003)
0,24 (0,1667)
0,17 (0,3143)
0,22 (0,192)
0,27 (0,1179)
WD
(n=30)
0,07
(0,707)
0,02
(0,898)
0,05
(0,7934)
0,06
(0,7493)
0,05
(0,8047)
0,06
(0,7691)
-0,15
(0,4308)
-0,06
(0,7343)
-0,07
(0,7118)
-0,05
(0,7962)
PHE
(n=34)
0,15 (0,4098)
0,09 (0,6095)
0,21 (0,2271)
0,19 (0,2823)
0,05 (0,7763)
-0,05 (0,7673)
-0,07 (0,6759)
-0,2 (0,2519)
-0,18 (0,2995)
-0,11 (0,5387)
SLA
(n=32)
-0,16
(0,368) -0,29
(0,0928)
-0,1
(0,5688)
-0,15
(0,4028)
-0,22
(0,2345)
-0,14
(0,4462)
-0,01
(0,9414)
0,08
(0,6502)
0,16
(0,3692)
0,17
(0,3482)
LA
(n=33)
0,09
(0,6333)
0,13
(0,4774)
0,13
(0,4853)
0,1
(0,5944)
0,08
(0,6755)
0,02
(0,9167)
-0,03
(0,8701)
-0,14
(0,4502)
-0,08
(0,6421)
-0,1
(0,5674)
LDMC
(n=33)
-0,4
(0,0195)
-0,37
(0,0366)
-0,39
(0,0266)
-0,4
(0,0195)
-0,4
(0,0211)
-0,32
(0,0665)
0,39
(0,0266)
0,42
(0,0161)
0,4
(0,0231)
0,41
(0,0212)
LCC
(n=34)
-0,55
(0,001)
-0,51
(0,0025)
-0,54
(0,0013)
-0,57
(0,0006)
-0,5
(0,0029)
-0,34
(0,0506)
0,45
(0,0082)
0,58
(0,0003)
0,58
(0,0004)
0,55
(0,001)
LPC
(n=34)
0,48
(0,0044)
0,51
(0,0026)
0,43
(0,0119)
0,49
(0,004)
0,48
(0,0049)
0,33
(0,0596)
-0,35
(0,0453)
-0,51
(0,0026)
-0,47
(0,0057)
-0,49
(0,0036)
LNC
(n=34)
0,09 (0,6272)
-0,08 (0,664)
0,21 (0,2401)
0,09 (0,6203)
-0,02 (0,8933)
-0,15 (0,4161)
-0,35
(0,0448)
-0,17 (0,3487)
-0,09 (0,6038)
-0,08 (0,6659)
FTF
(n=34)
-0,16
(0,3786)
-0,11
(0,5244)
-0,09
(0,6103)
-0,17
(0,3281)
-0,14
(0,4192)
-0,16
(0,3553)
0,14
(0,4211)
0,2
(0,264)
0,15
(0,4076)
0,17
(0,3322)
Sha_Fru
(n=26)
-0,14
(0,5048)
-0,27
(0,1771)
-0,04
(0,8505)
-0,11
(0,5763)
-0,18
(0,3811)
-0,12
(0,5549)
-0,06
(0,7608)
0,11
(0,5804)
0,12
(0,5646)
0,15
(0,4709)
Mas_Fru
(n=25)
-0,12
(0,563)
-0,06
(0,778)
-0,14
(0,5106)
-0,1
(0,649)
-0,01
(0,9598)
0,11
(0,6085)
0,09
(0,6576)
0,16
(0,4385)
0,11
(0,5979)
0,1
(0,6397)
Sha_See
(n=20)
-0,34
(0,1479)
-0,36
(0,1168)
-0,36
(0,1229)
-0,32
(0,1699)
-0,22
(0,3494)
-0,13
(0,573)
0,23
(0,3223) 0,37
(0,1069)
0,42
(0,0676)
0,27
(0,2355)
Mas_See
(n=22)
-0,32
(0,1521)
-0,28
(0,1998) -0,41
(0,0596)
-0,34
(0,1203)
-0,21
(0,353)
-0,0044
(0,9845)
0,21
(0,3383) 0,39
(0,0734)
0,32
(0,1478)
0,29
(0,1833)
Vol_Fru
(n=20)
-0,39
(0,0872)
-0,41
(0,076)
-0,43
(0,0574)
-0,38
(0,0961)
-0,27
(0,2475)
-0,1
(0,6895)
0,23
(0,319) 0,44
(0,0533)
0,42
(0,0654)
0,35
(0,1289)
Vol_See
(n=20)
-0,39
(0,0927)
-0,37
(0,1099)
-0,48
(0,0343)
-0,41
(0,0758)
-0,28
(0,2236)
-0,07
(0,7765)
0,25
(0,2784) 0,44
(0,05)
0,41
(0,073)
0,36
(0,1172)
These results showed that taller species have fresh leaf litter with higher
percentages of lignin but reduced contents of hemicelluloses. The remaining litter of
taller tree species has the same patterns together with higher percentages of total carbon
and cellulose, releasing low percentages of the initial total carbon during
decomposition. Meanwhile, tree species with dense wood tend to have fresh litter with
higher contents of hemicellulose while having lower contents of phosphorus within the
remaining litter, but were not correlated with any macronutrient and C fraction losses.
In addition, the strongest deciduous tree species also have lower percentage of
hemicelluloses in the remaining litter fresh litter but didn’t show a clear pattern in
macronutrients and C fractions losses or contents in fresh litter.

153
Table 4.10. Spearman rank correlation coefficients of a) total nutrient and b) C fraction
contents (%) in fresh (t0), remaining litter (t4) and looses (% or g) during litter
decomposition process with whole plant traits of tree species commonly found
in active neotropical pasturelands
a)
H_max WD PHE
P_t0 0,13 (0,4081) 43 -0,1 (0,5759) 36 0,15 (0,3584) 38
N_t0 -0,14 (0,3801) 43 0,26 (0,1291) 36 -0,23 (0,1697) 38
C_t0 0,23 (0,1429) 43 -0,01 (0,9548) 36 -0,14 (0,3954) 38
P_t4 -0,02 (0,9184) 36 -0,08 (0,6707) 30 0,22 (0,2135) 34
N_t4 -0,11 (0,5247) 36 0,14 (0,475) 30 -0,11 (0,5499) 34
C_t4 0,36 (0,0312) 36 0,14 (0,4598) 30 -0,08 (0,6666) 34
P_t4_g 0,41 (0,0122) 36 -0,34 (0,0688) 30 0,14 (0,4455) 34
N_t4_g 0,26 (0,1209) 36 -0,04 (0,8408) 30 -0,16 (0,3676) 34
C_t4_g 0,37 (0,0256) 36 -0,06 (0,7622) 30 -0,1 (0,5799) 34
P_loss_g -0,04 (0,8257) 35 -0,15 (0,4325) 29 0,1 (0,5881) 33
N_loss_g -0,19 (0,2629) 35 -0,0049 (0,9798) 29 -0,07 (0,7161) 33
C_loss_g -0,22 (0,197) 35 -0,0037 (0,9848) 29 0,07 (0,7035) 33
P_loss_% -0,18 (0,3016) 35 -0,05 (0,7897) 29 0,01 (0,9492) 33
N_loss_% -0,29 (0,093) 35 -0,01 (0,9686) 29 -0,01 (0,9761) 33
C_loss_% -0,3 (0,0781) 35 0,0017 (0,9929) 29 0,11 (0,526) 33
b)
H_max WD PHE
Sol_t0 -0,18 (0,3094) 35 -0,13 (0,4945) 29 0,2 (0,2706) 33
Hem_t0 -0,46 (0,0059) 35 0,34 (0,0742) 29 -0,05 (0,7801) 33
Cell_t0 0,1 (0,5657) 35 0,05 (0,8153) 29 -0,0015 (0,9933) 33
Lig_t0 0,33 (0,055) 35 -0,03 (0,8709) 29 -0,22 (0,2113) 33
Sol_t4 -0,11 (0,5313) 32 -0,19 (0,3519) 26 0,14 (0,4693) 30
Hem_t4 -0,32 (0,0766) 32 0,24 (0,2399) 26 -0,35 (0,0583) 30
Cell_t4 0,37 (0,0399) 32 0,04 (0,8305) 26 0,04 (0,8406) 30
Lig_t4 0,3 (0,093) 32 0,1 (0,6439) 26 -0,06 (0,7728) 30
Sol_t4_g 0,28 (0,1244) 32 -0,18 (0,3825) 26 0,15 (0,444) 30
Hem_t4_g -0,06 (0,7495) 32 0,24 (0,2455) 26 -0,35 (0,0555) 30
Cell_t4_g 0,31 (0,0814) 32 0,02 (0,9193) 26 -0,03 (0,882) 30
Lig_t4_g 0,35 (0,0514) 32 0,04 (0,8343) 26 -0,05 (0,7891) 30
Sol_loss_g -0,18 (0,3154) 32 -0,09 (0,662) 26 0,11 (0,5499) 30
Hem_loss_g -0,25 (0,1682) 32 0,12 (0,5604) 26 0,08 (0,6897) 30
Cell_loss_g 0,02 (0,9182) 32 -0,16 (0,4494) 26 -0,03 (0,8693) 30
Lig_loss_g 0,04 (0,8462) 32 -0,06 (0,7598) 26 -0,05 (0,7918) 30
Sol_loss_% -0,26 (0,149) 32 -0,01 (0,9735) 26 0,03 (0,8731) 30
Hem_loss_% -0,23 (0,2135) 32 -0,01 (0,963) 26 0,2 (0,2927) 30
Cell_loss_% -0,27 (0,1299) 32 -0,07 (0,7435) 26 0,08 (0,6846) 30
Lig_loss_% -0,28 (0,1231) 32 -0,05 (0,8008) 26 -0,01 (0,9726) 30
Dispersal traits were correlated with litter quality
Dispersal traits were correlated with macronutrient contents in fresh and
remaining litter and were also correlated with macronutrient release during litter
decomposition (Table 4.11). Sha_Fru was positively correlated with N content in fresh
litter and with C and N contents in remaining litter, but was not correlated with rates of
loss of any macronutrients during decomposition. Sha_see, Mass_Fru and Vol_Fru were
154
positively correlated with C contents in fresh and remaining litter and only Vol_Fru and
Sha_see tended to be negatively correlated with C loss during decomposition. Sha _see
was also positively correlated with N content (grams) in remaining litter and tended also
to be negatively correlated with N losses. Mass_see and Vol_see were not correlated
with any macronutrient contents in fresh or remaining litter but both were negatively
correlated with P losses. Vol_see also tended to be positively correlated with C contents
(grams) in remaining litter.
These results show that tree species with the biggest and heaviest fruits have
higher C content in fresh and remaining litter and higher rates of C loss during litter
decomposition. Tree species with longer fruits also have higher amounts of nitrogen in
fresh litter (tending to be legumes) and higher nitrogen and carbon contents in
remaining litter, meanwhile those tree species with longer seeds also had higher rates of
nitrogen and carbon release during litter decomposition. Finally those species with the
biggest and heaviest fruits had higher rates of phosphorus release during decomposition.
Dispersal traits were also correlated with C fraction contents in fresh and
remaining litter but were not correlated with C fraction release during decomposition
(Table 4.11). Mas_Fru and Vol_fru were positively correlated with LIG percentages in
fresh and remaining litter and were negatively correlated with CEL percentages in
remaining litter. Mas_fru tends also to be negatively correlated with SOL percentages in
fresh litter. Mass_see and Vol_see were negatively correlated with HEM percentage in
fresh litter and Vol_see tended also to be positively correlated with LIG percentages in
remaining litter. Sha_fru, in contrast, was not correlated with any C fraction in fresh or
remaining litter.
These results show that tree species with bigger and heavier fruits have higher
amounts of lignin in fresh and remaining litter, together with higher contents of CEL in
remaining litter and lower soluble compounds in fresh litter. Fruit length, in contrast,
was not correlated at all with content of litter fractions; however those tree species with
the longest seeds had higher LIG contents in the remaining litter. Finally those species
with the biggest and heaviest fruits have lower contents of HEM in fresh litter but
higher contents of LIG.

155
Table 4.11. Spearman rank correlation coefficients of a) total nutrient and b) C fraction
contents in fresh litter with fruit and seed traits of tree species commonly found
in active neotropical pasturelands
a)
Sha_Fru Mas_Fru Sha_See Mas_See Vol_Fru Vol_See
P_t0 -0,24 (0,1828) 32 -0,16 (0,3959) 30 -0,24 (0,2678) 24 -0,07 (0,7177) 26 -0,31 (0,1357) 24 -0,01 (0,9771) 24
N_t0 0,5 (0,0035) 32 -0,002 (0,9991) 30 0,21 (0,3152) 24 -0,04 (0,8643) 26 0,12 (0,5916) 24 -0,18 (0,4055) 24
C_t0 0,27 (0,131) 32 0,5 (0,0073) 30 0,52 (0,0129) 24 0,11 (0,6075) 26 0,83 (0,0001) 24 0,11 (0,5877) 24
P_t4 -0,21 (0,3029) 26 -0,17 (0,4205) 25 -0,28 (0,2296) 20 -0,09 (0,6764) 22 -0,24 (0,2994) 20 -0,09 (0,7131) 20
N_t4 0,61 (0,001) 26 0,13 (0,5294) 25 0,3 (0,1939) 20 -0,03 (0,879) 22 0,33 (0,1551) 20 -0,11 (0,6335) 20
C_t4 0,43 (0,0283) 26 0,6 (0,0034) 25 0,65 (0,0049) 20 0,24 (0,2625) 22 0,91 (0,0001) 20 0,31 (0,1707) 20
P_t0_g -0,24 (0,1907) 32 -0,21 (0,2694) 30 -0,28 (0,1794) 24 -0,02 (0,9069) 26 -0,28 (0,1886) 24 0,01 (0,955) 24
N_t0_g 0,49 (0,0049) 32 -0,03 (0,8904) 30 0,14 (0,4993) 24 -0,0017 (0,9934) 26 0,11 (0,582) 24 -0,15 (0,4681) 24
C_t0_g 0,25 (0,1666) 32 0,48 (0,01) 30 0,36 (0,085) 24 0,08 (0,6878) 26 0,79 (0,0001) 24 0,05 (0,8089) 24
P_t4_g -0,12 (0,5435) 26 -0,31 (0,126) 25 -0,11 (0,6276) 20 0,15 (0,4962) 22 0,03 (0,9113) 20 0,19 (0,4089) 20
N_t4_g 0,55 (0,0038) 26 0,11 (0,603) 25 0,48 (0,0377) 20 0,3 (0,1647) 22 0,64 (0,0051) 20 0,3 (0,1877) 20
C_t4_g 0,33 (0,1039) 26 0,32 (0,117) 25 0,55 (0,0156) 20 0,35 (0,1139) 22 0,68 (0,003) 20 0,41 (0,0757) 20
P_loss_g -0,24 (0,2294) 26 -0,25 (0,2264) 25 -0,31 (0,1812) 20 -0,37 (0,0891) 22 -0,28 (0,2278) 20 -0,38 (0,0959) 20
N_loss_g 0,22 (0,2789) 26 -0,12 (0,5642) 25 -0,16 (0,4954) 20 -0,05 (0,8259) 22 0,01 (0,953) 20 -0,1 (0,6605) 20
C_loss_g 0,01 (0,9564) 26 -0,01 (0,9489) 25 -0,18 (0,4354) 20 -0,18 (0,418) 22 -0,05 (0,8339) 20 -0,19 (0,4089) 20
P_loss_% -0,15 (0,453) 26 -0,16 (0,4354) 25 -0,19 (0,3978) 20 -0,42 (0,0552) 22 -0,27 (0,246) 20 -0,46 (0,047) 20
N_loss_% -0,09 (0,6768) 26 -0,27 (0,1822) 25 -0,37 (0,104) 20 -0,24 (0,2647) 22 -0,34 (0,1385) 20 -0,32 (0,1667) 20
C_loss_% -0,16 (0,4289) 26 -0,18 (0,3698) 25 -0,4 (0,0801) 20 -0,28 (0,2058) 22 -0,41 (0,0725) 20 -0,31 (0,1769) 20
b)
Sha_Fru Mas_Fru Sha_See Mas_See Vol_Fru Vol_See
Sol_t0 -0,1 (0,611) 26 -0,35 (0,0871) 25 -0,07 (0,7481) 20 -0,08 (0,7152) 22 -0,32 (0,1588) 20 -0,1 (0,6701) 20
Hem_t0 -0,02 (0,926) 26 -0,03 (0,901) 25 -0,18 (0,4201) 20 -0,38 (0,0853) 22 -0,35 (0,13) 20 -0,48 (0,0354) 20
Cell_t0 0,11 (0,6016) 26 0,09 (0,6484) 25 -0,03 (0,8957) 20 -0,04 (0,8583) 22 0,01 (0,9739) 20 0,02 (0,9373) 20
Lig_t0 0,18 (0,3848) 26 0,43 (0,0361) 25 0,35 (0,1219) 20 0,33 (0,1288) 22 0,69 (0,0026) 20 0,39 (0,0883) 20
Sol_t4 -0,3 (0,1702) 23 -0,22 (0,3217) 22 -0,23 (0,3517) 17 0,05 (0,8233) 19 -0,34 (0,1699) 17 0,06 (0,8064) 17
Hem_t4 0,16 (0,4669) 23 -0,29 (0,1793) 22 -0,13 (0,6033) 17 -0,23 (0,3259) 19 -0,35 (0,1639) 17 -0,28 (0,2679) 17
Cell_t4 0,23 (0,2979) 23 0,43 (0,0501) 22 0,34 (0,1761) 17 0,01 (0,9822) 19 0,47 (0,0625) 17 0,08 (0,7612) 17
Lig_t4 0,19 (0,3858) 23 0,37 (0,0862) 22 0,41 (0,1016) 17 0,17 (0,4749) 19 0,66 (0,0081) 17 0,25 (0,3269) 17
Sol_t0_g -0,07 (0,7462) 26 -0,34 (0,0931) 25 -0,12 (0,5909) 20 -0,07 (0,7503) 22 -0,29 (0,2106) 20 -0,08 (0,7283) 20
Hem_t0_g 0,0044 (0,9828) 26 -0,04 (0,8636) 25 -0,21 (0,3849) 20 -0,4 (0,0663) 22 -0,35 (0,127) 20 -0,5 (0,0257) 20
Cell_t0_g 0,07 (0,745) 26 0,1 (0,6296) 25 -0,07 (0,753) 20 -0,05 (0,8299) 22 0,04 (0,8544) 20 0,02 (0,9425) 20
Lig_t0_g 0,19 (0,3443) 26 0,44 (0,0282) 25 0,35 (0,1263) 20 0,34 (0,1216) 22 0,69 (0,0007) 20 0,4 (0,0836) 20
Sol_t4_g 0,02 (0,9286) 23 -0,1 (0,6577) 22 0,14 (0,5989) 17 0,26 (0,2911) 19 0,07 (0,7789) 17 0,33 (0,1922) 17
Hem_t4_g 0,21 (0,3345) 23 -0,2 (0,3652) 22 0,01 (0,9702) 17 -0,11 (0,665) 19 -0,09 (0,7183) 17 -0,1 (0,7148) 17
Cell_t4_g 0,08 (0,708) 23 0,23 (0,3117) 22 0,33 (0,2028) 17 0,09 (0,7234) 19 0,33 (0,1888) 17 0,14 (0,5858) 17
Lig_t4_g 0,17 (0,4324) 23 0,28 (0,2133) 22 0,46 (0,0602) 17 0,11 (0,6522) 19 0,66 (0,0041) 17 0,21 (0,422) 17
Sol_loss_g -0,03 (0,8843) 23 -0,16 (0,4577) 22 -0,14 (0,5696) 17 -0,13 (0,592) 19 -0,15 (0,5498) 17 -0,2 (0,4214) 17
Hem_loss_g -0,15 (0,4809) 23 0,15 (0,511) 22 -0,4 (0,1143) 17 -0,17 (0,4974) 19 -0,3 (0,2413) 17 -0,28 (0,2749) 17
Cell_loss_g 0,11 (0,6066) 23 0,11 (0,6414) 22 -0,29 (0,2617) 17 -0,05 (0,8331) 19 -0,05 (0,8553) 17 -0,01(0,9963) 17
Lig_loss_g 0,16 (0,4556) 23 0,25 (0,2669) 22 0,1 (0,6906) 17 0,32 (0,1874) 19 0,29 (0,2599) 17 0,37 (0,1448) 17
Sol_loss_% -0,02 (0,9447) 23 -0,09 (0,6694) 22 -0,17 (0,505) 17 -0,22 (0,3445) 19 -0,15 (0,5564) 17 -0,29 (0,2433) 17
Hem_loss_% -0,2 (0,3562) 23 0,08 (0,7307) 22 -0,33 (0,1923) 17 -0,13 (0,5869) 19 -0,24 (0,3318) 17 -0,23 (0,3619) 17
Cell_loss_% -0,06 (0,7709) 23 -0,09 (0,6884) 22 -0,35 (0,1609) 17 -0,17 (0,4612) 19 -0,34 (0,1761) 17 -0,19 (0,4444) 17
Lig_loss_% 0,02 (0,9144) 23 0,12 (0,578) 22 -0,06 (0,8216) 17 0,09 (0,7042) 19 -0,01 (0,9609) 17 0,12 (0,6379) 17

156
Relationships between abundances of tree natural regeneration and leaf
litter quality, decomposition rates and nutrient release.
Tree species regeneration abundance was correlated with decomposition rates in
active pasturelands
The population density in three life stages of tree species commonly found in
active pasturelands was positively correlated with leaf litter decomposition rates.
BETA_4, b3 and b4 were positively correlated with abundance of seedlings, saplings
and adult trees (Table 4.13). In addition, the percentages of remaining litter at the end
of litter incubations were negatively correlated with species population density in all
three life stages, strongly for adult abundances and T4.
Tree regeneration abundance was correlated with chemical quality of fresh litter
Tree species population density in three life stages was positively correlated with
total P and N contents in fresh leaf litter but was not correlated with total C content
(Table 4.13). Population densities in all three life stages were positively correlated with
P contents in fresh litter and only sapling density was positively correlated with N
contents in fresh litter. In contrast population densities were not correlated at all with
total C contents in fresh litter.
In addition, population density was negatively or positively correlated with some
of the C fraction contents in fresh leaves litter (Table 4.14). Population density at all
three life stages was negatively correlated with CEL content in fresh litter; however
only tree sapling abundance was positively correlated with LIG content in fresh litter
and with LDMC in green leaves. Population densities were not correlated with SOL or
HEM contents in fresh litter.
Table 4.12. Spearman rank correlation coefficients between population densities at three life
stages of tree species in active anthropogenic neotropical pasturelands and leaf
litter decomposition rates
Descomposition rates Seedlings Saplings Adults
BETA_4 0,17 (0,0701) 37 0,19 (0,0427) 37 0,2 (0,0392) 37
BETA_5 0,15 (0,105) 37 0,15 (0,1268) 37 0,17 (0,0829) 37
T1_Rem -0,02 (0,8124) 37 -0,01 (0,9175) 37 -0,03 (0,7164) 37
T2_Rem -0,11 (0,2544) 37 -0,06 (0,5289) 37 -0,13 (0,1834) 37
T3_Rem -0,13 (0,1763) 37 -0,13 (0,1717) 37 -0,15 (0,1091) 37
T4_Rem -0,18 (0,0615) 37 -0,17 (0,0679) 37 -0,18 (0,0554) 37
b1 0,08 (0,4073) 37 0,03 (0,7871) 37 0,09 (0,3704) 37
b2 0,14 (0,1346) 37 0,13 (0,1823) 37 0,16 (0,09) 37
b3 0,19 (0,0464) 37 0,22 (0,0177) 37 0,19 (0,0451) 37
b4 0,16 (0,1011) 37 0,24 (0,0122) 37 0,16 (0,1015) 37

157
Table 4.13. Spearman rank correlation coefficients for relationships between fresh litter
total macronutrients contents and tree species population densities in three life
stages in active pasturelands
Seedlings Saplings Adults
LDMC 0,15 (0,07) 47 0,23 (0,0063) 47 0,1 (0,2496) 47
P_t0 0,28 (0,0012) 44 0,22 (0,0099) 44 0,29 (0,0007) 44
N_t0 0,13 (0,1237) 44 0,24 (0,0051) 44 0,09 (0,3135) 44
C_t0 0,02 (0,7825) 44 0,11 (0,1906) 44 -0,07 (0,4109) 44
P_t4 0,3 (0,0016) 37 0,27 (0,0049) 37 0,25 (0,0087) 37
N_t4 0,26 (0,0056) 37 0,4 (<0,0001) 37 0,25 (0,0087) 37
C_t4 0,13 (0,1815) 37 0,17 (0,0789) 37 0,08 (0,426) 37
P_t0_g 0,26 (0,003) 44 0,19 (0,0269) 44 0,28 (0,0012) 44
N_t0_g 0,12 (0,1666) 44 0,22 (0,0108) 44 0,08 (0,3642) 44
C_t0_g -0,01 (0,9145) 44 0,06 (0,5118) 44 -0,06 (0,4795) 44
P_t4_g 0,2 (0,0345) 37 0,14 (0,1312) 37 0,28 (0,0028) 37
N_t4_g -0,06 (0,5241) 37 -0,02 (0,8473) 37 -0,03 (0,7247) 37
C_t4_g -0,09 (0,3701) 37 -0,07 (0,4507) 37 -0,08 (0,3776) 37
P_loss_g 0,25 (0,0095) 36 0,15 (0,1324) 36 0,27 (0,0052) 36
N_loss_g 0,2 (0,0355) 36 0,22 (0,0235) 36 0,32 (0,0006) 36
C_loss_g 0,13 (0,1817) 36 0,13 (0,1746) 36 0,19 (0,053) 36
P_loss_% 0,11 (0,2636) 36 0,0035 (0,9715) 36 0,11 (0,2454) 36
N_loss_% 0,17 (0,0877) 36 0,14 (0,1589) 36 0,27 (0,0054) 36
C_loss_% 0,11 (0,2605) 36 0,08 (0,4248) 36 0,17 (0,0726) 36
Table 4.14. Spearman rank correlation coefficients of the relationships between fresh litter
C fraction contents and tree species population densities in three life stages in
active pasturelands
Seedlings Saplings Adults
LDMC 0,15 (0,07) 47 0,23 (0,0063) 47 0,1 (0,2496) 47
Sol_t0 0,07 (0,4493) 36 0,04 (0,7046) 36 0,11 (0,2432) 36
Hem_t0 0,01 (0,9296) 36 0,09 (0,3716) 36 0,08 (0,4367) 36
Cel_t0 -0,27 (0,005) 36 -0,3 (0,0015) 36 -0,23 (0,0149) 36
Lig_t0 0,12 (0,2213) 36 0,16 (0,0891) 36 0,02 (0,8118) 36
Sol_t4 0,2 (0,0507) 33 0,17 (0,1012) 33 0,24 (0,0157) 33
Hem_t4 -0,06 (0,5583) 33 0,11 (0,2786) 33 -0,02 (0,8184) 33
Cell_t4 -0,14 (0,1556) 33 -0,21 (0,033) 33 -0,2 (0,0528) 33
Lig_t4 -0,03 (0,7743) 33 -0,03 (0,7579) 33 -0,12 (0,2307) 33
Sol_t0_g 0,01 (0,8873) 36 -0,03 (0,7903) 36 0,08 (0,399) 36
Hem_t0_g 0,0048 (0,9607) 36 0,09 (0,3491) 36 0,09 (0,3728) 36
Cell_t0_g -0,33 (0,0005) 36 -0,35 (0,0002) 36 -0,29 (0,0024) 36
Lig__t0_g 0,14 (0,1413) 36 0,19 (0,0541) 36 0,05 (0,5898) 36
Sol_t4_g 0,03 (0,7681) 33 -0,02 (0,8454) 33 0,01 (0,8989) 33
Hem_t4_g -0,16 (0,1154) 33 0,0012 (0,9903) 33 -0,18 (0,0745) 33
Cell_t4_g -0,22 (0,0264) 33 -0,25 (0,013) 33 -0,32 (0,0011) 33
Lig_t4_g -0,12 (0,2304) 33 -0,11 (0,2757) 33 -0,18 (0,0678) 33
Sol_loss_g 0,18 (0,0759) 33 0,18 (0,0755) 33 0,27 (0,0065) 33
Hem_loss_g 0,06 (0,5453) 33 0,06 (0,5647) 33 0,12 (0,2326) 33
Cell_loss_g -0,18 (0,0795) 33 -0,17 (0,093) 33 -0,03 (0,7369) 33
Lig_loss_g 0,36 (0,0002) 33 0,44 (<0,0001) 33 0,34 (0,0006) 33
Sol_loss_% 0,16 (0,1186) 33 0,18 (0,0777) 33 0,24 (0,0181) 33
Hem_loss_% 0,08 (0,4471) 33 0,03 (0,7953) 33 0,15 (0,1424) 33
Cell_loss_% 0,18 (0,0744) 33 0,19 (0,0609) 33 0,28 (0,0047) 33
Lig_loss_% 0,3 (0,0026) 33 0,33 (0,001) 33 0,33 (0,0009) 33
158
These results show that those species with higher population densities of
seedlings, saplings and adults had higher contents of phosphorus and lower contents of
cellulose in fresh leaf litter. Meanwhile the tree species with the higher densities of tree
saplings had fresh litter with higher contents of nitrogen and lignin. In addition those
species with higher population densities of both early life stages (seedlings and
saplings) had higher green leaf dry matter content. Finally, total contents of carbon,
soluble compounds and hemicelluloses in fresh litter were variable amongst species
with different population densities.
Tree regeneration abundance was correlated with litter nutrient release during
litter decomposition
Tree population density was positively correlated with the amounts of P, N and
C in remaining litter and with the rate of release of the same macronutrients during
decomposition (Table 4.13). Population density in all three life stages was positively
correlated with the concentrations of P and N in remaining litter after four months of
litter decomposition. Only the density of tree saplings was positively correlated with the
percentage of total carbon in remaining litter. Seedling, sapling and adult densities were
also positively correlated with the amounts of N and P in grams released during
decomposition, meanwhile, just adult density was positively correlated with the total
amounts of carbon (grams and percentages) released. In addition, only seedling and
adult densities were positively correlated with the percentage of initial N released
during the four months of litter decomposition process.
Population densities of trees in active pastures were also positively or negatively
correlated with different C fractions in remaining litter and with release of C fractions
during decomposition (Table 4.14). Densities in all three life stages were positively
correlated with SOL contents and negatively correlated with CEL contents in the
remaining litter. Stronger correlations were found for densities at seedling and adult
stages with SOL, and at sapling and adult stages with CEL. LIG and HEM contents in
remaining litter were not correlated at all with population densities. The percentages of
initial SOL, CEL and LIG contents released during decomposition were positively
correlated with populatino densities at all three stages, being strongest for adult
densities. Population densities were not correlated at all with HEM rereleases during
leaf litter decomposition.
These results show that those species with higher population densities of
seedlings, saplings and adults in active pasturelands had the highest contents of total

159
nitrogen, phosphorus and soluble carbon but also the lower contents of cellulose in their
remaining litter. In addition, those tree species with higher sapling densities had higher
amounts of total carbon within their remaining litter. Tree species with higher densities
at all three life stages had higher percentages of nitrogen, soluble carbon compounds,
celluloses and lignin released during litter decomposition. Finally, higher amounts of
carbon released from litter were observed for those species with the higher adult
densities. However, the proportion of initial P content released from litter during
decomposition was not correlated with tree population densities.
These results indicate that those tree species with higher population densities in
active pasturelands had a faster rate of release of total N, C and SOL during leaf litter
decomposition independently of the contents of these components in their fresh litter.
Meanwhile, these species also showed higher rates of release of total P and higher rates
of decomposition of LIG together with lower rates of decomposition of CEL matching
the concentrations of those fractions in fresh litter. Therefore, P release was high for
abundant tree species which have also the high P content in their fresh litter. The case of
N was different, because independently of the absence of significant correlations
between population abundance and total N content in fresh litter, the most abundant
species had the highest rates of released of N during litter decomposition.
4.5 DISCUSSION
Leaf litter decomposition rates and leaf quality of trees commonly found in
active pasturelands
Differences in decomposition rates between tree species
As expected, there are significant differences in the remaining litter masses
(Rem %) and decomposition rates (Beta) of tree species commonly found in active
pasture sites. The community of broadleaved tree species commonly found in tropical
active pasturelands decompose in average half of their leaf litter in four months having
even a tendency to faster decompositions rates. Litter decomposition rates have an
approximated normal distribution with most of the range the species formed a
continuum of decomposition rates: some species were clustered around the modal value
of ca. 55% like Platymicium parviflorum, Tabebuia rosea and Enterolobium

160
cyclocarpum; meanwhile have some tree species with higher or lower decomposition
rates.
This normal distribution has a slight tendency to have more number of tree
species with faster rates of litter decomposition (average Rem ≤ 40%) of beyond the
main range of species’ rates, including species like Guazuma ulmifolia, Crescentia
alata, Maclura tictonia and Genipa americana (ca. 6 species, labelled f, g and h).
Variability of slowly decomposition rates was less than variability of faster
decomposition rates as only two different groups with statistically significant
differences were observed for species with average Rem ≥60%) in contrast to four
observed for faster decompositions rates. Slowly decomposition rates were observed for
species like Cordia panamensis, Albizia saman and Hymenaea coubaril. A log-normal
distribution has been observed also in decomposition rates for several experiments in
North America (Forney and Rothman 2012).
The fact that litter decomposition of tropical tree species found outside the forest
distributes normally increase the scope of actual ecosystems models, searching to
predict global climate effects on carbon and nutrients cycles. As stated by Forney and
Rothman (2012) the ubiquity of log-normally distributed degradation rates suggests that
a focus on factors that affect rate heterogeneity, rather than specific rates themselves,
will lead to a greater understanding—and improved predictions —of the ways in which
the carbon cycle interacts with climate. However, the common use of normally
distributed decay rates in ecosystem models to predict carbon turnover and storage still
require careful parameterizations of the variability of distribution parameters (u and σ)
with climatic, soil and compositional parameters (Brovkin et al 2012).
The inter-specific variability in litter decomposition rates of this tree community
is comparable to the variability of decomposition ranges observed inside tropical forest
and even between biomes worldwide which include greater number of species and
variability of plant growth forms and phylogenies. Decomposition rate of tree species in
active pasturelands during the overall 4 months of incubation (Beta 5) varied by a factor
of 8.6 from a minimum of 0.78 for Hymenanea coubaril to a maximum 0.78 for Genipa
americana when estimated by specie (n=37), or by a factor of more than 11 when using
four regressions (n=148) by specie, ranging from a minimum of 0.08 to a maximum of
0.93 (Table 3.3, Figure 3.2/3.3). Mass remaining percentages (Rem) estimated as the
average of the four monthly remaining masses values by specie (Rem 1 to Rem 4)
varied by 3.5 orders of magnitude (21%-75%) amongst the species. The percentages of

161
remaining mass after 4 months of litter incubation (Rem 4) varied by a factor of more
than 70, ranged from 0.1% to 73% for G. americana and H. coubaril respectively
(Table 3.3, Figure 3.2/3.3). Similar ranges of variability in decomposition rates (10) but
lower ranges of variability in mass remaining mass (35) were observed by Santiago et al
(2010) in lowland tropical forest on the Caribbean coast of Central Panama (dry season,
3100 mm y-1
, 26 °C y-1
, 140 masl) during 2 years of litter incubation. Santiago et al
(2010) used a wider variety of plant species from contrasting growth forms including
together canopy and pioneer trees with lianas, palms and even herbs. Cornwell et al
(2008) used a comparison between 818 species from 66 decomposition experiments
across the world, founding an average 18.4-fold range in decomposition rates. Again,
they used a higher growth and phylogeny diversity for a worldwide comparison mixing
diverse growth forms: 580 eudicot species, 118 monocots, 22 species from the
Magnoliid lineage, 39 Gymnosperms, 37 Pteridophytes (ferns and fern allies) and 20
Bryophytes (Corwnell et al 2008).
The mean decomposition rates observed in tree community in active
pasturelands follows the expected patterns of faster decomposition rates in tropical
lands compared to tree litter decomposition in temperate regions. The observed
decomposition rates of neotropical tree species are similar to reports for African tree
species but faster than temperate trees in Nordic and Austral regions. Albizia gummifera
and Cordia africana decomposed 59% and 43% of its initial litter mass at the end of 16
weeks during the dry season spanning November to March 2000 in a coffee plantation
with tree cover in southern Ethiopia with an altitude of ca. 1900 m a.s.l., mean annual
rainfall and temperature of 1240 mm and 19.5 °C (Teklay and Malmer 2004). The
observed tree decomposition rates were faster that those observed for tree species
decomposing in chestnut forests in Cevennes hills on south France with altitudes
between 380 – 860 m.a.s.l., mean annual rainfall and temperature between 1212 – 2355
mm and 8.1 – 12.8 °C. Fagus sylvatica decomposed 38% of initial litter biomass,
Quercus ilex and Q. petraea decomposed 63-63% and Castanea sativa decomposed
65% of leaf litter after 2 years of incubation (Cortez 1997). Lightly narrowed ranges of
remaining mass during decomposition have been reported for woody species in northern
Argentina. Deciduous and evergreen woody species have lower means and narrowed
ranges of Rem values: 20% (0 – 60%) and 40 % (0 – 55%) respectively during 9 weeks
of litter incubation (Pérez-Harguindeguy et al. 2000). At the same two months of litter
incubations we observed that tree species in tropical conditions: 56 % (13% to 77%)
162
(Table 3.3). Scots Pinus spp. needle litter has lower decomposition rates in Pinus spp.
forest in Sweden, where 82 to 89% of Rem persist after 7 months of decomposition
(Berg and Staff 1980). Decomposition of Mediterranean grasses showed similar ranks
of variability in litter decay rates. A total 12 of the most abundant herbaceous species
characteristics of three stages of the old-field succession in communities of a
Mediterranean successional sere decomposed between 26.5% and 74.2% or litter mass
during 8 weeks of incubation (Kazakou et al 2006).
All tree species were fitted significantly to simple exponential decays (p <
0.0001; Table 3.3) allowing the direct comparisons between species litter decay curves
over the four months of litter incubation using one estimation by specie (BETA5).
However, the gradients of decomposition rate did vary considerably between species
over time (Fig. 3.3) and there is considerable cross-over between species, evidenced
also by the significant interactions species*time in the ANOVA test (p < 0.0001). These
differences in decomposition rates with incubation time were reflected on the estimated
monthly decomposition rates (b1, b2, b3, b4). Average monthly decay rates for the 37
tree species clearly showed that decomposition slowest down by a factor of almost 2
from 0,32 during the first month of litter incubation to 0,17 during the fourth month,
decreasing about 1.2 fold per month. Inter-specific differences in decomposition rates
depend on time of litter incubation and therefore probably species’ early decomposition
rate did not predict well subsequent rate. The variability of species’ monthly
decomposition rates increases with time (Table 3.3.) from a change in a factor of almost
5 during the first month of decomposition (b1) to factors of 7, 14 and almost 100 for the
consecutive months (b2, b3, b4 respectively) of litter incubation. The higher Species’
differences in the process/trajectory of decomposition, is likely to be linked to
differences in their leaf structure/chemistry.
The observed variability on overall litter decomposition values (Rem and Beta5)
imply that meanwhile for some tree species only one quarter of the initial biomass have
decomposed, others tree species has almost completely decomposed at the end of the
same time of incubation under standard environmental (temperature) and substrate
conditions (soil moisture and microorganisms) in a tropical environment. The results
support the hypothesis that large inter-specific variation exist in leaf decomposability of
tree species commonly find active pasturelands when placed under the same
environmental conditions. These differences could be related to variations in leaf

163
composition and the higher abundance of faster decomposition rates probably suggest
that tree species with a highly quality levels are also more abundant.
Inter-specific variability in leaf and litter quality composition
Macronutrient contents
In general, tree species founded in active pasturelands showed a high variability
of macronutrient concentrations in leaves and litter. Five main observations come out
from all the observed concentrations of macronutrients in mature leaves, litter and
decomposed litter: i) macronutrients contents of these tree species were widely variable
at green and litter leaf stages; ii) N and P concentration were more strongly reduced
than C from green leaves to litter during senescence; iii) the range of variability of P and
N concentrations in leaves of these tree species was lower for litter than for green
leaves; iv) the range of variability of P contents was higher than for N contents at both
stages and v) C concentrations were higher than N and P but less variable at both leaf
stages. This wide variability in the total contents (%) of leaf macronutrients (P, N, C)
affect the observed variability in litter decomposition rates.
Macronutrients contents in leaves and litter
Tree species commonly found in active pasturelands showed a high variability of
macronutrients concentration in leaves, litter and in the percentage of nutrient looses
between mature leaves and fresh litter. Macronutrients concentration of tree species
commonly found in active pasturelands were widely variable at green and litter leaf
stages. Leaves have in average 0.18 % of P (ranging from 0.04% to 0.33%) and 2.67%
of N (1.03 to 3.94), which decreased in 46% to 45% to the average contents observed in
fresh litter of 0.10% (0.04% to 0.22%) for P and to 1.47% (0.93% to 2.70%) for N. In
contrast to N and P, the highest C contents in green leaves of 46% (41% to 52%) were
reduced only 8% to an average 44% (35% to 52%) in fresh litter. These wide ranges of
nutrients contents probably influence the also high variability in leaf decomposition
rates but also give us a good look to inter-specific variability of nutrient contents in a
tropical tree community.
The observed ranges of nutrients concentration in tree leaves and litter traslape
with the variability of nutrients concentration reported for other topical species but
showed a wider extent. Constantinides and Fowdes (1994) reported that nutrients
concentration in tree litter of 12 tree species in Hawaii were varied from 0.86% to

164
1.62% for N and from 0.02% to 0.12% for P contents. Global studies about the trends in
nutrient distributions in different vegetal ecosystems worldwide have found that in
general, leaf N and P decline toward the equator as average temperature and growing
season length increase for different growth forms including trees (Reich and Oleskin
2004). Leaf N and P increase from the tropics to the cooler and drier mid latitudes
because of temperature-related plant physiological stoichiometry (P and N levels
increase as a metabolic adaptation to enhance growth rates in cooler environments) and
bio-geographical gradients in soil substrate age (tropical soils are considered on average
to be older, to be more leached, and to have lower N and P) and then plateau or decrease
at high latitudes because of cold temperature effects on biogeochemistry. The leaf
nutrient concentrations we observed here for tropical tree species were lower than the
contents of N (from 3.4% to 8.5%) of Pinus sp. stands in Scotland as reported by Berg
and Staff (1980). However, ours results translape partially scot pinus P contents (0.14%
to 0.42%). According with the global patterns of nutrients distribution in relation to
temperature (Reich and Oleskin 2004), our results probably give additional information
to support the idea that tropical tree species have lower nutrients contents than
temperate trees, as more similar values of N and P have been observed for other tropical
trees than for temperate conifers. However the wide ranges of nutrients variability
observed for these tropical species traslape even those values observed for temperate
species, especially in case of P concentrations.
The global patterns in nutrients distributions presented by Reich and Oleskin
(2004) showed also that N:P ratio increases with mean temperature and toward the
equator, because P is a major limiting nutrient in older tropical soils and N is the major
limiting nutrient in younger temperate and high-latitude soils. Koerselman and
Meuleman (1996) proposed the leaf N:P nutrient limitation breakpoint index which
stated that N:P values lower than 14 between imply N-limitation growing and that N:P
values higher than 16 indicate P-limitation growing. The average N:P values of this tree
community indicate P and N co-limitations and not only P limitations. This community
N:P index however do not reflect the condition of the majority of tree species, in
contrast is reflecting the occurrence of species within a wide range of variability in
possible nutrient growth limitation: from strongly N limited to strongly P limited
species. In agreement to the global pattern in leaf nutrients, a higher number of tree
species (57%) observed in pasturelands showed N:P ratios in mature leaves greater than
16 (data not shown) indicating a higher frequency tree species with P limited growing as
165
expected in tropics vegetation. A following, number of tree species (33%) however
showed N:P ratios lower than 14, indication that also tree species with N limitation
growing are frequent in this pasturelands. Only 10% showed a possible growing co-
limitation by P and N concentration according to N:P index values between 14 and 16.
Once again, the wide variability of N and P concentration and in N:P values in tree
leaves quality could be responsible for the variable decomposition rates observed for
this species.
Macronutrients variability among mature leaves and litter
In addition the range of concentrations i.e. the ratio between maximum and
minimum concentration values, change at different factors between leaves stages (green
and litter) and between nutrients (N, P and C). N and P variability was higher in leaves
than in litter. P and N concentration varied by factors of 8 and 3.8 respectively in green
leaves and just by factor of 5.5 and 2.9 respectively in fresh litter. In contrast, ranges of
C contents observed at both leaf stages were narrowed and varied by similar factors in
green (1.3) and fresh litter (1.5). The fact that the range of variability is higher for
Phosphorus than for nitrogen in both leaves stages probably reflect the higher limitation
of phosphorus for these tree species in tropical lands.
Macronutrient losses in senescence
As expected and stated previously, macronutrients contents in litter were lower
than those observed for green leaves. We observed that 45% -46% of total phosphorus
and nitrogen contents in green leaves together with 7% of total carbon are removed
from tree leaves previous to litter production. This reduction in contents of nutrients in
litter respect to green leaf responds more probably to nutrient re-allocation during the
process of senescence. Nutrient leaching from leaves during senescence could be also
responsible for the decreasing values of nutrients from leaves (Aerts and Chapin 2000).
However, the proportion of nutrients loosed from mature leaves and fresh litter seem to
be reduced in comparison with senescence (Freschet et al 2010). In addition, fresh litter
collected for this study was done using weakly harvest (by litter traps and manual
selection) during dry season were daily rain was almost scarce (data not shown) to
reduce leaching looses after senescence. Therefore we a-priory estimate that the
reductions on leaf macronutrients observed in these tree species from mature leaves to
litter respond mainly to nutrient recycling during senescence.

166
The strongest and similar reductions observed for nitrogen and phosphorus
concentrations during tree leave senescence reflect the limitation of both nutrients in
tropical soils. During leaves senescence, soluble nutrients from old leaves are moved via
phloem to new growing tissues (i.e new leaves, flowers or apical stems) or to developed
seeds (Himelblau and Amasino 2001). Metabolically, during senescense carbon
assimilation (photosynthesis) is replaced by catabolism of chlorophyll and
macromolecules such as proteins, membrane lipids, and RNA from which some of the
released nutrients can be recycled (Gan and Amasino 1997). This nutrient salvage from
older or damaged leaves has the adaptive value of recycling nutrients that may be
limiting in the environment or that are energetically costly to acquire (Himelblau and
Amasino 2001). At any given time, 95-99% of the potentially available nitrogen in soils
is in organic forms, either in plant and animal residues, in the relatively stable soil
organic matter or in living soil organisms, mainly microbes such as bacteria and is not
directly available for plants. Similarly, P concentration inside plants is well below the
potencial (Km) for plant uptake and although bound P is quite abundant in many soils, it
is largely unavailable for uptake because it rapidly forms insoluble complexes with
cations, particularly aluminum and iron under acid conditions (Vance et al 2002). In
fact, N and P are well known to regulate the carbon gain plant efficiency and therefore
the efficiency in their reabsortion capacities is especially relevant for tree species fitness
and is a key aspect of plant life strategies (Aerts and Chapin 2000).
The lowest percentages of decrease in C levels during senescence could respond
to mainly to C mobilization and respiration. The accelerated metabolism of membrane
lipids during senescence results in a decline in the structural and functional integrity of
cellular membranes (Thompson et al. 1998). Thylakoid membranes provide an abundant
source of carbon that can be mobilized for use as an energy source during senescence
(Ryu and Wang 1995). Carbon drop could result from C mobilization. However,
respiration, to provide energy for senescence, is likely to result in significant CO2 loss
(Himelblau and Amasino 2001). As little CO2 assimilation occurs during senescence,
respiration can result in a net loss of C (Noodén and Guiamet 1989). It is unclear
whether mobilization or respiration or both are responsible for the observed decrease in
C levels (Himelblau and Amasino 2001). We agree Vergutz et al (2012) when states
that the main cause of mass loss is likely the resorption of C and nutrients, while
leaching and even in situ decomposition probably play a secondary role. Taking into
account the higher C concentrations in leaf and litter in relation to the other nutrients,
167
this even small C resorption efficiencies can have cause substantial effects on plant
fitness beyond the inherent decreases in the total mass of the leaf. However such
relationships have been less addressed in related literature.
The observed mean percentages of resorption observed for neotropical trees
(45% and 46%) are lower than estimation done by initial models which assume a value
of 50% resorption for nitrogen and phosphorus (Aerts and Chapin 2000). However, the
variability on the reported reabsortion capacities in literature has been high and this
initial model clearly lack resorption data for specific vegetation types, environmental
variability worldwide and growth groups like neo-tropical trees. Lim and Cousens
(1986) found that in old Scots pine Pinus sylverstris stands nutrients resorption
efficiency (%) from senescing foliage increases with latitude of pine populations.
Nutrients reapsortion supplies about 55% on N and 64% of P in Scotland. Again the
observed means of nutrient reapsortion (%) for these neotropical trees are lower than
those reported for temperate tree species. Unfortunately the resorption capacity has been
less reported for tropical species than for temperate vegetation and only recently efforts
to understand the global patterns in nutrients resorption have been reported
Ours results shows that mean nutrient resorption (NuR) for tropical tree species
can be even lower than those values proposed by the recent global NuR pattern. The
recent observed global patterns in NuR includes values for six plant types: ferns, forbs,
graminoids, conifers, and evergreen and deciduous woody angiosperms and states that
mean NuR differed substantially among nutrients, growth forms and climate (Vergutz et
al 2012). Also states that N and P resorption differed significantly from the commonly
used global value of 50%, but in contrast to our observations, mover this mean to higher
values of 62.1% and 64.9% respectively. C, N and P resorption values (CR, NR and PR)
has been estimated in 18.4%, 50.2% and 61.2% respectively for tropical lands; 23.9%,
61.2% and 58.5% respectively for evergreen woody angiosperms and in 20.8%, 56.1%
and 58.4% respectively for deciduous woody angiosperm. Our mean NuR for tropical
trees including both evergreen and deciduous species are lowest, especially for CR
(18% vs 8%) and PR (46% vs 56.5%) meanwhile NR means were quiet similar (45% vs
46.5%). This observation are in agreement with the general pattern stated in the global
NuR distribution when states that C, N and P resorption efficiencies are positively
correlated with latitude because of significant negative relationships with mean annual
temperature and/or precipitation. Therefore, among the studied climatic groups, dry
climates tended to have the highest NuR for most nutrients, while tropical climates had
168
the lowest. However our results states that the lower limits of the global ranges can be
ever lower for tropical trees.
The lowest nutrient resorption capacities we observed for tropical tree species
probably reflects a wider variability in nutrient contents in leaves and litter. Our mean N
and P contents in green and litter were higher than those reported by Vergutz et al
(2012) but only by a factor of 1.4 and 1.3 respectively meanwhile the mean C contents
at both leaf stages were similar. The highest differences were observed in the extend of
the 95% confidence intervals (data not shown) which were around 3 times wider for N
and two times wider for P in both green and litter for the tree species we observed. NuR
was correlated with greater plant nutrient status and therefore greater resorption
efficiency can be expected in fresh leaves with lower nutrient concentrations (Vergutz et
al 2012). Therefore as we found tree species with higher but also with very low N and P
contents, can be expected that tree species with the lowest values are responsible for the
lowest mean PR and NR.
Macronutrient losses variability during senescence
In addition to a wide variability in nutrients contents in mature leaves and litter,
also nutrient looses nutrients looses (%) from mature leaves to leaf litter were highly
between species and also varied between nutrients. The proportion of leaf N, P and C
reallocated during senescence was highly variable between tree species and also
between nutrients. Phosphorus losses from leaves to litter (46%) vary by a factor of 8
(ranging from 8% to 68%) meanwhile nitrogen losses (45%) varied by factor of 3 (19%
to 68%). In addition, the variability of C looses from green leaves to litter (7%) were
surprisingly height and varied similarly than P looses by a factor of 8 (from 2.4% to
20%).
The inter-specific variability of foliar P and C reabsorbed during senescence was
higher than those observed for N. High inter-specific variability in nutrients contents
and resorption percentages could also be reflecting diverse plant nutrients dynamics
associated with diverse plant strategies. However if we compare our mean values of
nutrients contents in green, litter and its nutrient reabsortion (NuR) with those observed
by Vergutz et al (2012) no so clear relationships seems appear between the nutrient
contents in leaves with NuR. Unless both data sets have similar mean C contents in
leaves, we observed more than two times lower CR. In contrast, as stated previously we
observed highest means of P and N contents in leaves, but meanwhile NR was quiet
similar for both studies, PR was quit lower than the observed global pattern. The higher
169
abundance of more acquisitive tree species i.e. more tree deciduous species within this
tree community in a dry to sub-humid transition environment in tropical lands could be
also pushing down the mean NuR values especially for C and P. However, it is clear
that not universal patterns can be drowed for all macronutrients and particular
relationships between NuR and leaf chemical composition contents could arise with an
increased variability in nutrients contents.
Macronutrients looses during decomposition
Tree species in active pasturelands releases a high variability of total leaf
phosphorus, nitrogen and carbon contents. The mean percentages of total P (46%) and
N (41%) were similar and lower than the mean percentages of total C released (61%).
The range of total P released (2-94%) were slightly higher than the range of total N (8-
93%) loosed and both were higher than the range of C contents (32-96%). These results
highlighted our initial hypothesis about that tree species in active pasturelands have a
wide variability in nutrient releases to the pasture system.
Macronutrient losses variability during senescence and decomposition
The loss of P and N are very similar both during senescence and decomposition,
which is perhaps surprising. During senescence the % loss of C is much less;
presumably it is mainly proteins that (as well as soluble carbohydrates) that are broken
down and withdrawn, leaving most of the C in the remaining structural carbohydrates.
C fraction contents
Tree species commonly found in agricultural lands like active pastureland
showed a wide inter specific variability in the range of each C fraction contents and
between leaf stages. The mean contents of each C fraction measured in proportion by
gram (percentage) or it relative mass within the sample (grams) changed differently in
function of time from mature green leaves thought fresh and decomposed litter (Figure
4.8). The variability of C fractions contents was high and change also between leaf
stages and between species (Table 3.4).
C fractions contents in mature leaves and litter
Foliar C fraction contents of tree species commonly found in active pasturelands
differ from general models of carbon fractioning proposed by Berg and McClaughert.
(2008) based on boreal tree species. The water-soluble fraction (SOL), a chemically
170
complex group resulting from heterogeneous substrates has been accounting for around
50% of boreal tree leaves and litter. Cellulose (CEL) and Hemicelluloses (HEM),
considered the most common polymer carbohydrates compounds in litter, has been
estimated between 10 to 50% and between 1 to 10% respectively for boreal litter types.
Finally, Lignin (LIG) content may reach even above 50% for boreal species (Berg
McClaughert 2008). In agreement with this model, we observed that the mean contents
of soluble compounds is the highest fraction (47 and 45%) meanwhile hemicelluloses
mean contents are the lowest proportions (8 and 9%) of total carbon content in pre-
decomposition leaf stages (mature leaves and fresh litter). In contrast, we observed a
lower mean of celluloses and lignin contents than expected, corresponding respectively
to the second (22 to 23%) and third (20 and 21%) more abundant components in both
pre-decomposition leaf stages.
Substantial variation in the content of foliage and litter C fraction seem to be
observed also between these 35 trees species commonly found in active pasturelands on
a semi-humid dry forest area, compared with C fraction contents in tree species in a
tropical rainforest community. Observed differences are not related only with mean
contents but also with C fractions variability according with the range of C fraction
contents observed for both tree communities. Hättenschwiler et al (2008) found a
community if tropical forest tree species that SOL were also around 32% of total
carbon; HEM and CEL means were 15% and 20% and LIG was around 32% for tropical
species (Hättenschwiler et al 2008). Our observed means and ranges for HEM (8% from
2 to 18%) and LIG (21% from 6 to 39%) foliar contents were half lower than HEM
(15% from 4 to 48%) and LIG (34% from 13 to 61%) contents in the tropical forest. In
contrast, our mean estimation of SOL (46% from 29 to 67%) is higher than those
observed for humid forest species unless the range of possible values was quite similar
(32% from 8 to 48%). Only the mean content of CEL foliage and litter of the
pastureland tree community (22% from 11 to 32%) is quite similar than CEL
estimations for the humid tropical trees species (20% from 10 to 27%).
C fractions relationships with PHE
The lower variability and mean contents of HEM and LIG in the more semi-
deciduous community in active pasturelands in comparison with the forest humid
community probably reflect communities’ differences in the predominant leaf strategies
of tree species growing under different environmental resources and limitations. The
studied tree community in active pasturelands has a higher proportion of deciduous

171
species (75% of tree species reduced in 50% their canopy for at least one month)
meanwhile the majority of humid forest community belong to the rather well-defined
functional group of evergreen trees with long-lived, leathery leaves (Hättenschwiler et
al 2008). Variability in lignin and hemicelluloses content has been mostly correlated
with leaf phenology, physical and chemical leaf composition affecting plant growth
rates, litter decomposition and palatability. In comparison with deciduous species,
evergreens generally had innately slow growth, which corresponded to their longer-
lived leaves of lower specific leaf area, higher tensile strength and lower palatability to
generalist invertebrate herbivores therefore producing more resistant leaf litter
(Cornelissen et al 2003).
In fact, different proportions of C fractions like lignin, for example, appears to
provide structural strength allowing plants to resist wilting as defense mechanisms
against harsh environments, and herbivore damage reducing palatability (Cooper and
Smith 1985). Hemicelluloses composition and contents has been found to vary greatly
between species and growth forms i.e. deciduous leaves are lower in mannans and the
ratios of hemicelluloses to cellulose often seen higher in deciduous litter than in
coniferous litter. In addition, the lignin content of deciduous species has been observed
generally lower than that of the coniferous ones, although the variation is large in both
groups (Berg and McClaughert 2008). Therefore lower mean levels of more recalcitrant
fiber components like LIG and HEM can be expected for those semi deciduous
communities with a lower proportion of evergreen tree species.
The higher SOL contents in the dry-sub humid pasturelands tree community
probably reflect only the indirect effects of increases in correlated components like
HEM and LIG (i.e. a decrease in one fraction will result necessarily in an increase by
similar proportions of another fraction). However, the lower investments in more
insoluble leave components like HEM and LIG and the high availability or more mobile
components i.e. simple sugars, lower fatty acids and protein remains such as amino
acids and peptides, could be also relevant for nutrient and water conservation strategies
in more water limited environments like those of dry semi-seasonal tree communities
were deciduous tree species domain. A higher proportion of soluble contents in
deciduous tree species probably imply a higher capacity of nutrients mobility to reuse
nutrients and water more efficiently previous leaves senescence and litter disposal. In
fact, we observed that PHE was positively correlated with SOL contents in green mature
leaves and fresh litter but only at significant levels when the extreme deciduous tree

172
species (those with 5 or 6 months of reduce tree canopy) were not included (data not
shown). In addition, we observed that the positive correlation between percentages of
SOL resorption during senescence (the concentrations changes during the foliar
transition from green mature leaf to fresh litter) and PHE were significant only when
evergreen and faster deciduous tree species were not included (data not shown). Unless
evergreen tree species have low proportions of SOL fractions in leaves and litter, the
proportions of SOL resorption were more variable than those observed for deciduous
species hiding the significant relationships with PHE. In contrast, SOL content in green
and litter and their recycled proportions tend to increase when leaf longevity decreases.
Therefore, deciduous tree species did have more SOL contents than evergreen species
and such differences could be then reflected on mean SOL contents among tropical dry
to humid tree communities and forest humid tree communities.
Only CEL contents were similar between both tropical tree communities
reflecting probably the variability in fiber structure development and the functional role
of each C fraction. Old accepted models of cell fibbers structure have shown a matrix of
lignin and hemicelluloses encrusted in the cellulose fibrils (Kerr and Goring 1975).
More recently, has been postulated that the formation of lignin in the fibers
(lignification) of the live plant is a slower process than that of cellulose forming,
resulting in fibers with different levels of lignifications that probably different among
tree species (Berg and McClaughert 2008). In addition, the distribution of hemicellulose
parallels that of lignin within the wall surroundings the cellulose microfibrils, and
occupies the spaces between the fibrils (Berg and McClaughert 2008). This fiber
structure and the slowest process of lignification and hemicelluloses insertion suggest a
higher probability of hemicelluloses and lignin variability as components surrounding
the primordial cellulose fibers which provides the main strengthen of the cell wall.
Probably are this variability in lignifications process and hemicellullose integration to
the more stable cellulose fibers the most related with species leaf strategies like
evergreens resulting in slow growing rates (that allow more lignified mature leaves) and
highest investments of C resources for herbivore defense (via lower digestibility with a
higher lignifications levels).
PHE has been found correlated with chemical and physical foliar characteristics
in mature leaves and litter. PHE was negatively correlated (p ≤ 0.05) with FTF and LIG
contents (data not shown), positively correlated with LPC and also with a positive
tendency with SOL in tree mature leaves, indicating that more deciduous tree species
173
are softer have lower lignin but more P and soluble c contents than evergreen species.
Unless we dint find any direct correlation between PHE and C fraction contents in fresh
leaf litter when the entire leaf phenological spectrum i.e from evergreen to extremely
deciduous species was explored. However, correlations between PHE and C fractions
are observed for different sections in the phonological spectrum or phenological types
i.e. exclusive evergreens (tree species without canopy cover reductions through the
year), evergreens to medium deciduous species (tree species with no one to four months
with canopy cover reductions) and medium to extreme deciduous species (species with
more than 5 months of canopy reductions). Tree phenological status (PHE) from
evergreens to medium deciduous species, has a positive correlation with SOL together
with a negative correlation with LIG and a negative tendency with CEL contents in
fresh litter (data not shown).
In general there was an increase in soluble compounds together with a reduction
in recalcitrant C fractions like CEL and LIG from evergreen to deciduous species.
However CEL contents showed two different directions in relations to the phonological
status: was negative correlated with PHE from evergreen tree species to middle
deciduous (those with 4 months of tree cover reductions) but was positively correlated
with medium to extreme deciduous species (those tree species having 3 to 6 months
with a reduced tree canopy were). These results imply that in fact more recalcitrant C
fractions like CEL and LIG decreases from evergreen through faster and medium
deciduous species, until a break point when deciduousness can be combined with high
leaf CEL contents. Those species with five or six months with a reduced tree canopy
during probably have alternative leaf or whole plant strategies to deal with dry
environments like wood water storing. However the inclusion of the entire phonological
spectrum with all the possible CEL values to obtain a mean CEL was possible the
reason for the similar CEL means among the studied tree community in the dry to sub-
humid tropical site when compared with the humid forest tree community.
C fractions were also correlated with total nutrients contents and biomass in
fresh litter contents and with leaves physical structure. LIG content was correlated
positively with LCC, negatively with LPC and tends to be positively correlated with
LDMC. In addition CEL tends to be positively correlated with FTF. Therefore those
tree species with higher biomass and total carbon did have more investments on carbon
recalcitrant fractions like LIG and CEL developing tougher leaves, but lower P contents.
Hemicellullose contents followed however different patterns. HEM content was

174
negatively correlated with LCC in addition correlated with Hmax and tends to be
positively correlated with WD and no clear patterns were observed for HEM contents in
relation to any phonological group. Hemicelluloses independence from the relationships
between other recalcitrant and labile C fractions in relation to leaf characteristics and
phenology, probably due to a high variability between species and along the
phenological continuum.
Unfortunately to date a global assessment about how foliage C fractions vary
with environmental gradients and geographical locations have been not addressed. This
is one of the few studies generating values of C fractions for a major number of tree
species in tropical and also anthropogenic lands. All this differences probably are
reflecting not only climatic and environmental effects over foliar tree quality as plant
strategy but also possible anthropogenic management effects. However, there is not a
generalized knowledge about how C fractions could change due to anthropogenic
management to be able also to differentiated between environmental and the possible
anthropogenic induced variation in standing tree foliage quality and ever less it possible
implications for carbon and nutrients cycling. We are trying to address how the C
fractions contents in tree community are affecting not only litter decomposition rates but
also C fraction and nutrient releases.
Leaf lignifications must be higher for evergreen communities due to increased
specific values or due to population structure i.e. an increased proportion of evergreen
versus deciduous species, which reflect higher mean values at community level in
humid forest tree communities that in dry-semi humid transitional forest communities.
Aerts and Chapin 2000) found that litter decomposition rates of evergreen shrubs
and trees are significantly lower than those of deciduous shrubs and trees. No difference
in leaf litter decomposability between evergreen and deciduous species have been
observed for Mediterranean species possible because slow-growing deciduous species
also contains high concentrations of hemi-) cellulose, insoluble sugars and lignin
(Niemann et al., 1992;
Low litter decomposability and the resulting low rate of nutrient release from
that litter, as observed in evergreen species, leads to longer dominance of the evergreen
species. This implies that the plant characteristics of evergreens do not only lead to high
NUE, but also keep soil fertility low and thereby influence the competitive balance with
deciduous species in their favor.
175
C fractions changes in senescence
The mean content of all C fraction components in tree leaves are similar to those
observed in leaf litter (Table). SOL is the higher C fraction, followed by similar
proportions of CEL and LIG and finally having HEM the lowest proportions in mature
leaves and litter. These results underline that quantitatively dominant groups of polymer
carbohydrates and lignin are ubiquitous within a big group of tropical trees and those
similar mean proportions of C fractions can be found in green leaves and fresh litter of
tree species. The fact that C fractions contents in mature tree leaves are similar to those
in their litter confirm the possible afterlife effect that different plant strategies like those
reflected in the leaf economic spectrum i.e. conservative vs acquisitive tree species
could have over ecosystem processes like litter decomposition, nutrient cycling and soil
formation.
C fractions differ in their amounts of carbon recycled during leaf senescence.
The similar proportions of mean C fractions founded among green and fresh litter
suggest that senescence the proportions reused must be probably similar between C
fraction and therefore C fraction proportion didn’t change among leaf stages. In
contrast, according to the different C fractions nature can be expected that SOL
fractions have a higher resorption capacity than recalcitrant fractions. However, the
mean percentages of SOL contents loosed during senescence (8%) were not
significatively higher than the percentages of LIG loses (9%), CEL (2%) and HEM
(20%). In contrast with the expected differences in the recycle capacity of C fraction
according with their nature, a considered recalcitrant C fraction like HEM has higher
mean proportion of looses from green to fresh litter meanwhile CEL was the more
stable C fraction during senescence. In addition, the mean proportions of the water
soluble fractions SOL were almost identical to the mean recycled proportions of most
recalcitrant fraction LIG. More according with c fraction nature, the mean amounts
(grams) of SOL fraction reused during senescence (0.52 g) were followed by HEM
(0.20 g), LIG (0.16g) and CEL (0.07g). However, not significant differences were
observed probably due to the wider variability in SOL releases. The fact that CEL
contents were the less recycled fraction and HEM the more recycled, probably reflects it
contrasting structure in cell walls: CEL is a more recalcitrant component according with
their fundamental role in the main fiber structure, in contrast with a more labile HEM
which surround it.
176
The recycled amounts of C resources are highly variable between C fractions.
The lack of evidence for differences between the mean contents of LIG and SOL loosed
during senescence as expected, probably reflect mainly the higher inter-specific
variability of this components in green and fresh litter. LIG content has the highest
variability coefficients (CV) in mature leaves and litter, when mean contents changed
by factors of 5 and 6.5 respectively. Unless SOL varying only by factors around 2 in all
leaf stages and showed lowest CV in opposition to LIG mean contents, SOL range
values in green leaves and litter were as wider as the range observed for LIG and was
even wider for SOL looses than for LIG losses during senescence. Therefore, SOL and
LIG were the C fractions with highly variable contents in pre-decomposed leaves and
with also variable amounts of losses through senescence avoiding finding differences
within it recycle proportions according with their contrasting nature.
In addition, C fraction variability also changed through leaf stages and it looses
during senescence do not reflect always the variability in pre-decomposed leaf tissues.
The high variability of LIG and SOL contents contrasted with the lower variability of
HEM and CEL contents in green leaves and litter. However, the lower variability of
these C fractions in mature leaves and litter was only partially reflected on the
variability of HEM and CEL looses in senescence, implying that besides inter-specific
variability in leaves contents, some components are more stable than others. The range
of HEM content in mature leaves and litter was narrowed than the observed range from
CEL content unless CV was higher for CEL than for HEM. Therefore, more variable
CEL looses during senescence could be expected from a higher variability of CEL
contents in leave tissues, but in contrast, CEL loses through senescence were less
variable than HEM losses. The narrowed range of CEL looses expressed in percentages
probably determine the significant differences among these C fractions losses during
senescence; no matter than CEL loses has a higher CV. Therefore, trees recycled
considerable less proportions of the initial CEL content in green leaves than from the
other C fractions, no matter it higher variability in leaf tissues. Equally, HEM loses
during senescence were highly variability unless it contents in pre-decomposed leaf
tissues were the less variable C fraction. Tree species recycle around 20% of
Hemicelluloses but only 2% of it CEL content, but meanwhile one tree species can
recycle up to 71% of HEM content in green leaves only 31% was observed for CEL.
The variability of the proportions of HEM recycled was even higher than the variability
177
observed for SOL and LIG, C components with a wide variability in pre-decomposed
leaf tissues.
C fractions changes during decomposition
The mean content of C fractions in decomposed litter was different to the C
fraction contents in green leaves and fresh litter. The absolute amounts of all C fractions
in decomposed litter were lower than C fractions contents in fresh litter (Figure).
Absolute amounts (grams) of SOL, HEM and LIG in decomposed litter were reduce
nearly to half, meanwhile CEL were reduced more than four times it initial total
amounts in fresh litter. However the proportions of C fractions do not always decreased.
After four months of litter incubation CEL contents decreased significatively from 22-
23% in leaves and litter to 12% in remaining litter. In contrast, SOL contents increased
from 47-45% in pre-decomposed tissues to 51% in decomposed litter. In addition, either
HEM or LIG contents showed any significant change during the same litter incubation
time. In consequence, unless all C fractions contest were reduces, the proportion of C
fractions in remaining litter changed differently in comparison with pre-decomposed
leaf stages. SOL mean contents continue being the more abundant C fraction (around
50%) and now in addition to HEM, CEL has also the lower C fractions in remaining
litter. LIG contents in contras continue having middle proportion within the C fraction
partitioning in remaining litter as have been in pre-decomposed leaf stages.
These results imply that Cellulose contents of tree litter have been the C fraction
most decomposed, during four months of litter decomposition in tropical environment,
drooping initial concentrations to half, no matter it recalcitrant nature. Instead, the
proportions of C soluble components in tree leaves do not decrease from fresh litter to
remaining litter after the four initial months of litter decomposition in tropical
environment. In fact, the concentration of soluble carbon increase probably related with
cellulose break down which could release soluble C components to refill continually C
soluble pools prior leached to soil environment. In contrast, HEM or LIG contents were
the most recalcitrant C components in litter tending in fact to increase they mean
concentrations in decomposed litter. However, either Hemicelluloses or Lignin
concentrations in remaining litter after 4 months in tropical lands showed difference
with pre-decomposed stages.
In addition, variability of C fraction contents in remaining litter differs from pre-
decomposed stages and between C components. In general, variance of absolute
contents (grams) of all C fraction decreases from fresh to decomposed litter. CEL
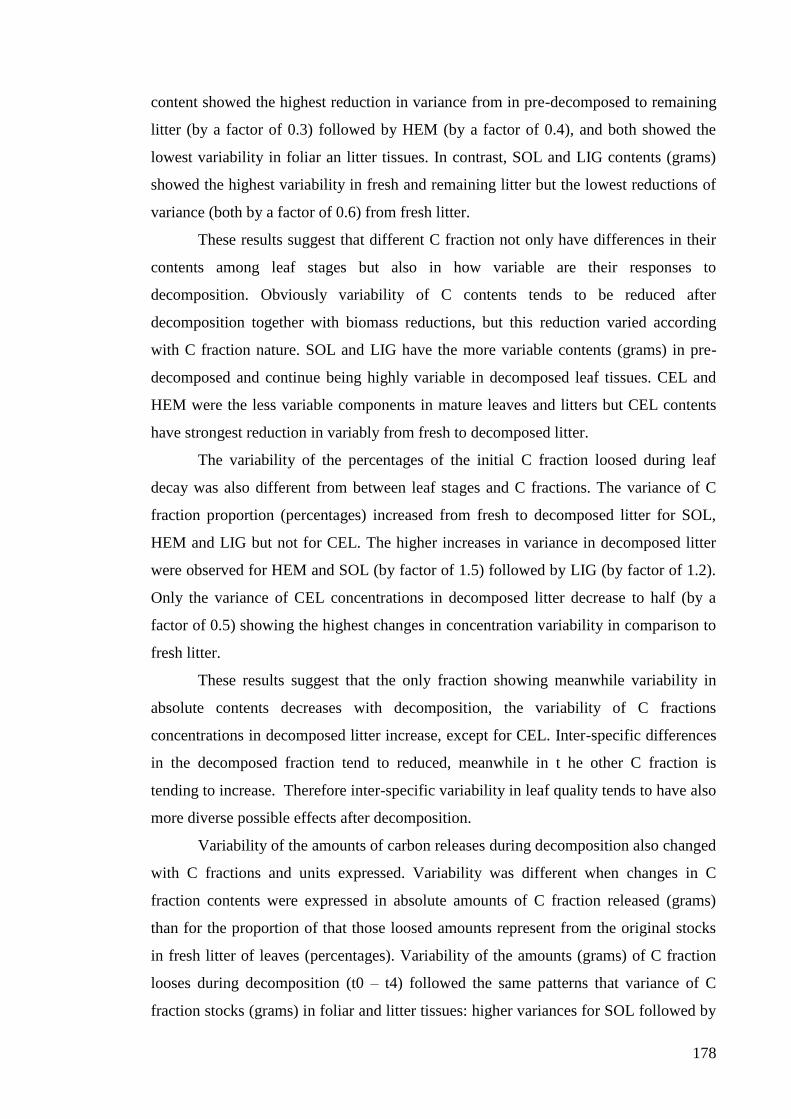
178
content showed the highest reduction in variance from in pre-decomposed to remaining
litter (by a factor of 0.3) followed by HEM (by a factor of 0.4), and both showed the
lowest variability in foliar an litter tissues. In contrast, SOL and LIG contents (grams)
showed the highest variability in fresh and remaining litter but the lowest reductions of
variance (both by a factor of 0.6) from fresh litter.
These results suggest that different C fraction not only have differences in their
contents among leaf stages but also in how variable are their responses to
decomposition. Obviously variability of C contents tends to be reduced after
decomposition together with biomass reductions, but this reduction varied according
with C fraction nature. SOL and LIG have the more variable contents (grams) in pre-
decomposed and continue being highly variable in decomposed leaf tissues. CEL and
HEM were the less variable components in mature leaves and litters but CEL contents
have strongest reduction in variably from fresh to decomposed litter.
The variability of the percentages of the initial C fraction loosed during leaf
decay was also different from between leaf stages and C fractions. The variance of C
fraction proportion (percentages) increased from fresh to decomposed litter for SOL,
HEM and LIG but not for CEL. The higher increases in variance in decomposed litter
were observed for HEM and SOL (by factor of 1.5) followed by LIG (by factor of 1.2).
Only the variance of CEL concentrations in decomposed litter decrease to half (by a
factor of 0.5) showing the highest changes in concentration variability in comparison to
fresh litter.
These results suggest that the only fraction showing meanwhile variability in
absolute contents decreases with decomposition, the variability of C fractions
concentrations in decomposed litter increase, except for CEL. Inter-specific differences
in the decomposed fraction tend to reduced, meanwhile in t he other C fraction is
tending to increase. Therefore inter-specific variability in leaf quality tends to have also
more diverse possible effects after decomposition.
Variability of the amounts of carbon releases during decomposition also changed
with C fractions and units expressed. Variability was different when changes in C
fraction contents were expressed in absolute amounts of C fraction released (grams)
than for the proportion of that those loosed amounts represent from the original stocks
in fresh litter of leaves (percentages). Variability of the amounts (grams) of C fraction
looses during decomposition (t0 – t4) followed the same patterns that variance of C
fraction stocks (grams) in foliar and litter tissues: higher variances for SOL followed by

179
LIG and lower variances for CEL and HEM. In contrast, the proportion of HEM loosed
from fresh litter (percentage) were the most variable C fraction, followed by LIG and
SOL, meanwhile the proportion of CEL looses during decomposition were the less
variable C fraction. These results means that unless the higher contents (grams or
percentages) and variability of SOL in fresh and remaining litter and unless showed the
highest and most variable looses (grams) during decomposition, was not necessarily the
C fraction with ether highest proportions loosed or either the more variable during
decomposition; or in other word the most decomposed and variable fraction during
decomposition. In contrast, besides the lowest HEM contents (grams and percentages)
and variability in fresh and remaining litter together with its lowest amounts released
during decomposition, the proportion that this releases represent in relation to HEM
stocks unless also lower like for SOL and LIG, were the most variable. Both CEL and
LIG have similar middle contents (grams and percentages) and variability in fresh litter
and its looses during decomposition, but the highest proportion loosed from the original
stock were significatively higher and less variable for CEL than for LIG. Therefore the
more variable responses in decomposition were observed for HEM followed for LIG,
SOL and finales the less variable responses to decomposition were observed for CEL.
C fractions decomposition rates
C fractions have different decomposition rates and releases different amounts of
C component during four months of litter decomposition. The absolute released
amounts (grams) of SOL were higher than the other C fractions as expected. CEL was
the recalcitrant fraction releasing higher amounts during decomposition followed by
LIG; meanwhile HEM released the lowest absolute amounts. Decomposition rates of C
fractions followed similar patterns but showed that CEL components could decomposed
as faster as SOL. At the same time confirm also that HEM were the most recalcitrant C
fraction decomposing even slowest than LIG. In contrast, the proportions of the initial C
fraction content in fresh litter released during decomposition only found significant
differences between CEL and the other C fractions. The amounts of CEL released
during decomposition represent a higher proportion of the initial CEL stocks in litter
than those proportions released for SOL, HEM and LIG. The proportions of C fraction
released between SOL, HEM and LIG didn’t show any significant differences between,
probably due to the higher variability in initial C fraction concentrations and in its
releases. In fact, the variability of the proportions of C fractions releases (percentages)
was higher than the variability observed for absolute amounts (grams) loosed from leaf
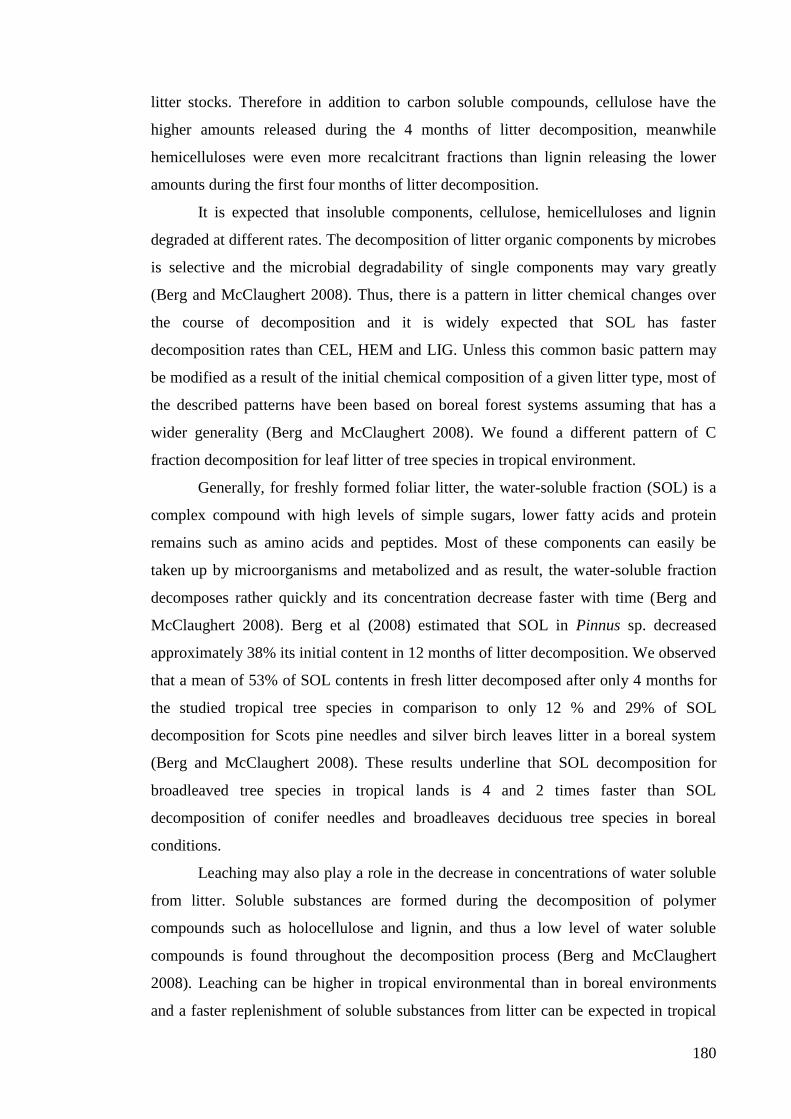
180
litter stocks. Therefore in addition to carbon soluble compounds, cellulose have the
higher amounts released during the 4 months of litter decomposition, meanwhile
hemicelluloses were even more recalcitrant fractions than lignin releasing the lower
amounts during the first four months of litter decomposition.
It is expected that insoluble components, cellulose, hemicelluloses and lignin
degraded at different rates. The decomposition of litter organic components by microbes
is selective and the microbial degradability of single components may vary greatly
(Berg and McClaughert 2008). Thus, there is a pattern in litter chemical changes over
the course of decomposition and it is widely expected that SOL has faster
decomposition rates than CEL, HEM and LIG. Unless this common basic pattern may
be modified as a result of the initial chemical composition of a given litter type, most of
the described patterns have been based on boreal forest systems assuming that has a
wider generality (Berg and McClaughert 2008). We found a different pattern of C
fraction decomposition for leaf litter of tree species in tropical environment.
Generally, for freshly formed foliar litter, the water-soluble fraction (SOL) is a
complex compound with high levels of simple sugars, lower fatty acids and protein
remains such as amino acids and peptides. Most of these components can easily be
taken up by microorganisms and metabolized and as result, the water-soluble fraction
decomposes rather quickly and its concentration decrease faster with time (Berg and
McClaughert 2008). Berg et al (2008) estimated that SOL in Pinnus sp. decreased
approximately 38% its initial content in 12 months of litter decomposition. We observed
that a mean of 53% of SOL contents in fresh litter decomposed after only 4 months for
the studied tropical tree species in comparison to only 12 % and 29% of SOL
decomposition for Scots pine needles and silver birch leaves litter in a boreal system
(Berg and McClaughert 2008). These results underline that SOL decomposition for
broadleaved tree species in tropical lands is 4 and 2 times faster than SOL
decomposition of conifer needles and broadleaves deciduous tree species in boreal
conditions.
Leaching may also play a role in the decrease in concentrations of water soluble
from litter. Soluble substances are formed during the decomposition of polymer
compounds such as holocellulose and lignin, and thus a low level of water soluble
compounds is found throughout the decomposition process (Berg and McClaughert
2008). Leaching can be higher in tropical environmental than in boreal environments
and a faster replenishment of soluble substances from litter can be expected in tropical

181
sites. However, we found that in tropical lands the SOL with possible higher leaching,
the levels of SOL contents in remaining litter after 4 months of litter incubation were
similar and even slightly higher than pre-decomposed stages.
The decomposition rates of leaf insoluble C components like Cellulose,
Hemicellulloces and Lignin’s has been expected to be different and lower than soluble
compounds. Berg and McClaughert (2008) have observed that in the early stage of
decomposition, cellulose, hemicelluloses and lignin were degraded at different rates and
that the concentration of cellulose decreases slowly. Somewhat later in the decay
process, the degradation rates of these components were similar. In later stages of decay
when lignin dominates the degradation process, the degradation rates of insoluble
components decrease and maintain similarly low levels. Thus, during this late stage, the
concentrations of cellulose remain rather constant. In addition, Berg and McClaughert
(2008) propose that Hemicelluloses starts insoluble decomposition meanwhile the
concentration of cellulose decreases slowly.
We have observed a different pattern of C fraction decomposition for leaf litter
of neotropical tree species. In contrast to Berg and McClaughert (2008) proposed model
of C fractions decomposition, we observed that CEL decomposed almost as faster as
soluble compounds and even faster than the insoluble C fractions. In agreement with
previous models, we observed different decomposition rates for different C fractions,
but specific values of C fraction decomposition rates followed a contrasting model. We
observed that CEL mean losses of cellulose during decomposition reach 70% of the
original CEL stocks in fresh litter, meanwhile the other insoluble and soluble fractions
were around 50%. In addition, the estimated decomposition rate of CEL (0.35 g day-1)
was similar to SOL dates (0.32 g day-1) and both were higher than LIG (0.12 g day-1)
and HEM (0.04 g day-1).
Decomposition rates of C fractions are higher than temperate and Mediterranean.
The observed patter of C fraction decomposition in leaf litter of tropical tree
species differ from boreal models mainly in the fact that concentration of cellulose do
not decreases slowly than soluble fractions. Cellulose decomposition rates (0.35 g day -
1) can be as faster as soluble compounds rates (0.32 g -day
) releasing the highest absolute
amounts (20 g) and proportions (70%) of C components initial stocks in fresh litter
(22%) and reducing almost to half (12%) its concentrations in remaining litter during
the four months of litter incubation. Conversely in addition, no matter the different
concentrations in fresh litter of LIG (21.5%) and HEM (8%) and they contrasting
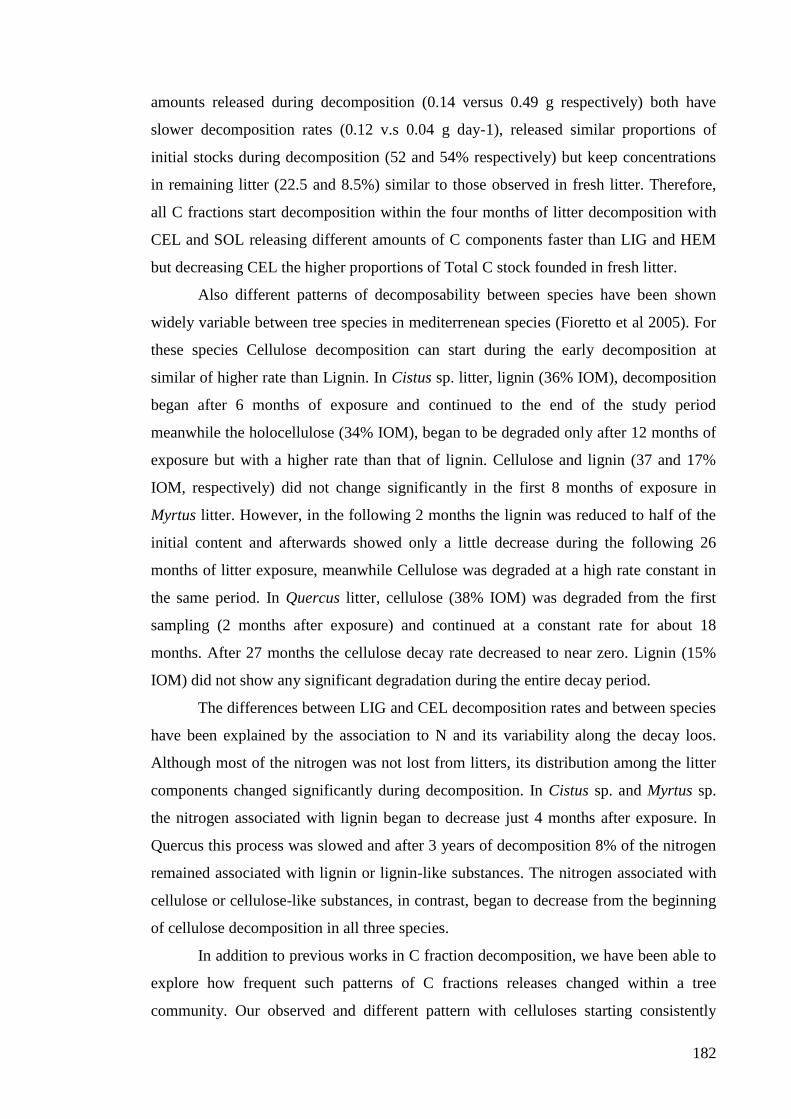
182
amounts released during decomposition (0.14 versus 0.49 g respectively) both have
slower decomposition rates (0.12 v.s 0.04 g day-1), released similar proportions of
initial stocks during decomposition (52 and 54% respectively) but keep concentrations
in remaining litter (22.5 and 8.5%) similar to those observed in fresh litter. Therefore,
all C fractions start decomposition within the four months of litter decomposition with
CEL and SOL releasing different amounts of C components faster than LIG and HEM
but decreasing CEL the higher proportions of Total C stock founded in fresh litter.
Also different patterns of decomposability between species have been shown
widely variable between tree species in mediterrenean species (Fioretto et al 2005). For
these species Cellulose decomposition can start during the early decomposition at
similar of higher rate than Lignin. In Cistus sp. litter, lignin (36% IOM), decomposition
began after 6 months of exposure and continued to the end of the study period
meanwhile the holocellulose (34% IOM), began to be degraded only after 12 months of
exposure but with a higher rate than that of lignin. Cellulose and lignin (37 and 17%
IOM, respectively) did not change significantly in the first 8 months of exposure in
Myrtus litter. However, in the following 2 months the lignin was reduced to half of the
initial content and afterwards showed only a little decrease during the following 26
months of litter exposure, meanwhile Cellulose was degraded at a high rate constant in
the same period. In Quercus litter, cellulose (38% IOM) was degraded from the first
sampling (2 months after exposure) and continued at a constant rate for about 18
months. After 27 months the cellulose decay rate decreased to near zero. Lignin (15%
IOM) did not show any significant degradation during the entire decay period.
The differences between LIG and CEL decomposition rates and between species
have been explained by the association to N and its variability along the decay loos.
Although most of the nitrogen was not lost from litters, its distribution among the litter
components changed significantly during decomposition. In Cistus sp. and Myrtus sp.
the nitrogen associated with lignin began to decrease just 4 months after exposure. In
Quercus this process was slowed and after 3 years of decomposition 8% of the nitrogen
remained associated with lignin or lignin-like substances. The nitrogen associated with
cellulose or cellulose-like substances, in contrast, began to decrease from the beginning
of cellulose decomposition in all three species.
In addition to previous works in C fraction decomposition, we have been able to
explore how frequent such patterns of C fractions releases changed within a tree
community. Our observed and different pattern with celluloses starting consistently

183
decomposition during the first four months of litter decomposition meanwhile mean
Soluble compounds, Hemicelluloses and Lignin mean concentrations increasing slightly
was a general pattern. Most of tree species (87%) showed an increase in the percentage
of SOL compounds from litter establishment to end of the four months of litter
incubation, only 6 showed the expected decreases in the soluble compound
concentrations in decomposed litter. Almost half of the tree species (45%) showed a
decrease in the hemicelluloses concentrations. In contrast, all the tree species showed
decreases in CEL concentration, meanwhile a reduce proportion of tree species (24%)
showed also decreases in LIG concentrations.
In contrast to the model proposed by Berg and McClaughert (2008) was CEL
and not HEM the first component which was strongly decreasing during the first stage
of litter decomposition after litter shed. In addition, unless a decreasing in the HEM was
also observed this was not the most frequent pattern: tree species showing decreases in
HEM concentration during the first 4 months of litter decomposition were was even
slightly lower (45%) than those which increasing it (55%). Ours results also differ in
Berg and McClaughert (2008) model because SOL compound are not consistently
decreasing in early decomposition. In fact a higher proportion of tree species showed
increases in SOL concentration during the 4 months, resulting probably from higher
sugar accumulation during Celluloses and Hemicellullosses degradation. Only LIG
fraction showed agreement with Berg and McClaughert (2008) model when a higher
frequency of tree species showed LIG contents increase during decomposition (76%).
Comparison of C fractions losses during senescence and decomposition
Losses of C fraction (grams and percentage) were obviously lower during
senescence than during 4 months of litter decomposition. CEL releases during
decomposition were 27 times higher than during senescence, followed by LIG and SOL
which changed by factors of 7 and 5 during senescence, and the lower differences were
observed HEM which only double its losses during senescence. Variability of C fraction
looses thought senescence and decomposition also differs between leaf decay process
and C fractions. In general, the variability of C fractions losses (grams) decreases
meanwhile variability of C fraction proportions loosed increase. The amounts (grams)
of SOL and HEM were the more and less variable C fractions during senescence and
decomposition, meanwhile HEM and CEL showed the more variable proportions of C
fractions released. The higher changes in variability between senescence and
decomposition were observed for LIG releases amounts (grams) and for the proportion
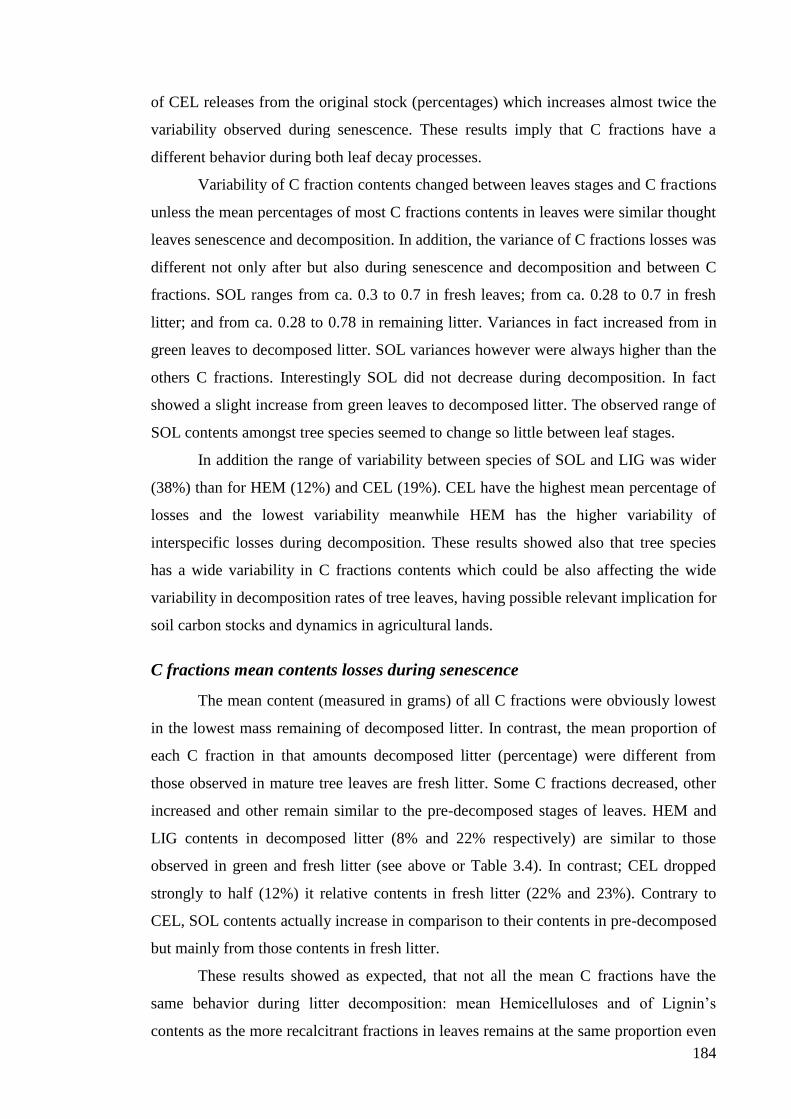
184
of CEL releases from the original stock (percentages) which increases almost twice the
variability observed during senescence. These results imply that C fractions have a
different behavior during both leaf decay processes.
Variability of C fraction contents changed between leaves stages and C fractions
unless the mean percentages of most C fractions contents in leaves were similar thought
leaves senescence and decomposition. In addition, the variance of C fractions losses was
different not only after but also during senescence and decomposition and between C
fractions. SOL ranges from ca. 0.3 to 0.7 in fresh leaves; from ca. 0.28 to 0.7 in fresh
litter; and from ca. 0.28 to 0.78 in remaining litter. Variances in fact increased from in
green leaves to decomposed litter. SOL variances however were always higher than the
others C fractions. Interestingly SOL did not decrease during decomposition. In fact
showed a slight increase from green leaves to decomposed litter. The observed range of
SOL contents amongst tree species seemed to change so little between leaf stages.
In addition the range of variability between species of SOL and LIG was wider
(38%) than for HEM (12%) and CEL (19%). CEL have the highest mean percentage of
losses and the lowest variability meanwhile HEM has the higher variability of
interspecific losses during decomposition. These results showed also that tree species
has a wide variability in C fractions contents which could be also affecting the wide
variability in decomposition rates of tree leaves, having possible relevant implication for
soil carbon stocks and dynamics in agricultural lands.
C fractions mean contents losses during senescence
The mean content (measured in grams) of all C fractions were obviously lowest
in the lowest mass remaining of decomposed litter. In contrast, the mean proportion of
each C fraction in that amounts decomposed litter (percentage) were different from
those observed in mature tree leaves are fresh litter. Some C fractions decreased, other
increased and other remain similar to the pre-decomposed stages of leaves. HEM and
LIG contents in decomposed litter (8% and 22% respectively) are similar to those
observed in green and fresh litter (see above or Table 3.4). In contrast; CEL dropped
strongly to half (12%) it relative contents in fresh litter (22% and 23%). Contrary to
CEL, SOL contents actually increase in comparison to their contents in pre-decomposed
but mainly from those contents in fresh litter.
These results showed as expected, that not all the mean C fractions have the
same behavior during litter decomposition: mean Hemicelluloses and of Lignin’s
contents as the more recalcitrant fractions in leaves remains at the same proportion even

185
after 4 months of litter decomposition. The fraction that is more strongly reduced during
the same period of litter decomposition is the mean Celluloses content. During these
initial 4 months of litter decomposition the more labile fraction, the soluble
carbohydrates, in contrast increases their relative proportions in decomposed litter from
those observed in fresh litter. These results support the model of decomposition which
states that the mean proportions of hemicelluloses and lignins did remain invariable
during the initial stages of decomposition as the most recalcitrant fractions. The rapid
decreasing of celluloses proportion implies that this was the structural C fraction more
actively decomposing during this initial stage of litter decay. It is probably the
breakdown of this cellulose compounds which is actually replenishing the increased
proportion of soluble fractions in a way that mean proportion in decomposed litter even
increase from those observed in fresh litter. These results shows that during 4 months of
litter decomposition in tropic lands mostly celluloses is being decomposed meanwhile
hemicelluloses and lining proportions still remains intact.
Relationship of tree leaf quality with litter decomposition rates
Decomposition rates of tree species commonly found in Central American active
pasturelands are correlated with nutrient and C fraction concentrations in fresh leaves
and in fresh litter. Tree species with lower LDMC, C and LIG content together with the
highest P, SOL and HEM content in fresh litter had the higher decomposition rates
(Table 3.5). Foliar macronutrients and C fractions were good predictors of tree leaf litter
quality and decomposition rates. These results followed the decomposition models
which described higher litter quality with higher k values by higher contents of nutrients
like total P in addition with higher level of labile carbon components like SOL, together
with low contents of total C contents, LDMC and more recalcitrant C fractions like LIG.
In addition to previous models we found that litter with also higher contents of HEM
were related with higher K values meanwhile CEL contents didn’t show any particular
relationships with decomposition rates. However, in contrast, we didn’t find any
correlation between total N contents in mature leaves or either tree litter with litter
decomposition rates during the four initial months of litter incubation.
Decomposition rates were negatively correlated with LDMC, C and LIG content
in fresh litter and positively correlated with P, SOL and HEM contents. There was no
correlation with N or CEL content in tree fresh litter. Strongly correlations were for
lignin contents in fresh litter (LIG) with decomposition rates (-0.53 to -0.69) and

186
remaining litter (0.63 to 0.69) values, followed by hemicelluloses (HEM) (0.45 to 0.64
and -0.55 to -0.62 respectively), total phosphorus (P) (0.32 to 0.58 and -0.43 to -0.60
respectively),Total carbon (C) (0.31 to -0.53 and 0.42 to 0.56 respectively), soluble
compound (SOL) (0.34 to 0.53 and -0.45 to 0.52 respectively) and finally with leaf dry
matter content LDMC (-0.32 to -0.40 and (0.38 to 0.40 respectively).
All these leaf components especially LIG, LPC, LCC, LDMC and SOL have
been found correlated with decomposition rates in different floras and plant species.
Decomposition rate has been found to correlate positively with litter nitrogen (Parsons
and Congdon 2008), phosphorus (Cornwell et al. 2008) while it correlates negatively
with large carbon chains, such as lignin and cellulose (Vaieretti et al. 2005, Kurokawa
& Nakashizuka 2008). Decomposer organisms tend to have very high nitrogen and
phosphorus contents (Vadstein and Olsen 1989) indicative of high requirements for
these nutrients. Therefore litter with high nitrogen and phosphorus content should
decompose fast because of the associated fast growth of the microbial populations,
whereas excess carbon in the plant litter should lead to nutrient-controlled carbon
remineralization (Vadstein and Olsen 1989).
Several studies have demonstrated that a strong negative linear relationship
existed between decay rates and the lignin content, the ratio lignin:N, the phenol content
or the ratio (lignin+ phenols):N (Aerts 1997, Mesquita et al. 1998). As lignin physically
protects most of the cellulose and hemicellulose from enzymatic hydrolysis, neither
group of compounds decompose independently (Cooke and Whipps 1993). High
contents of lignin have a rate-reducing influence on litter decomposition both in the
early and later stages, in particular, when associated with high N content, because new
and stable complexes are formed (Berg and Ekbohm, 1991; Couˆteaux et al., 1995).
Nevertheless, high nitrogen content generally regulates the early stages by enhancing
the growth of microorganisms that degrade labile compounds, and repress the formation
of lignolytic enzymes (Keyser et al., 1978). In a high N environment, the growth of
many microorganisms able to decompose lignin, such as the basidiomycetes, is reduced,
because such slow-growing fungi are unable to compete with fast-growing microbes
and are eliminated from the decomposer community (Couˆteaux et al. 1991). The high
variability of such lignin concentrations and N contents open a high variability effects
on decomposition rates.
Fewer studies have found additional effects of other insoluble C fractions over
decomposition rates. Other studies showed that the long-term decomposition rate was

187
increased by high cellulose content (i.e. Berg and McClaugherty 2008). The role of both
cellulose and lignin as regulating factors of litter decomposition rate have been reported
mainly in temperate and boreal coniferous and deciduous forests (Berg et al. 1996,
Couteaux et al. 1998) and some in for Mediterranean ecosystems (Rutigliano et al.
1996, Di Nardo et al., 2001). In contrast, HEM content was positively correlated with
litter decay meanwhile we didn’t find any strong correlation between CEL contents with
litter decomposition rates. Either N concentrations in fresh litter or no-chemical foliar
traits like SLA, LA or FTF didn’t predict tree litter decomposition rates. The absence of
such significant correlations between these traits frequently related with decomposition
rates could be reflecting the wide variability in leaf phenology in this tree community.
Deferent rates of decomposition have been found for tree species with
contrasting leaf phonological status related with lignin, nitrogen and phenols. Lower
decomposition rates of evergreen leaves species has been also correlated with high
lignin content. In Tazmania (Wedderburn and Carter 1999) found that high rate of litter
decay was linked to high amounts of microbial activity affected by the differences in N
and lignin content of the leaves. The leaf litter which exhibited the most rate of rapid
decay and cycling of nutrients was that from the deciduous N-fixing tree species, which
contained low amounts of lignin and C and high amounts of N. Also different
decomposition fraction has been found correlated with particular decomposition stages
in tree species of semi-evergreen tropical forests in French West Indies (Loranger et al
2002). Between 1 month and 2.5 months, the mass loss was correlated negatively with
the initial phenol content and with initial lignin:N and (lignin+phenol):N ratios. From
2.5 to 5.5 months, the mass loss was correlated negatively with the initial phenol
content and positively with the initial cellulose content. At later stages of decomposition
(9–14 months), the mass loss was correlated negatively with the initial tannin content
(Loranger et al 2002). However wider explorations of the relationships with other foliar
traits related with leaf phenology and decomposition rates are scarse.
Unless not directly correlated with decomposition rates leaf phenology was
correlated with leaf and litter quality and C fraction contents in remaining litter. These
correlations probably have particular effect their relationships with litter decay rates.
Tree species with the cheapest leaf construction (high SLA) tend to have a high N
content in fresh litter and tend to have a low LA meanwhile those with a high FTF have
higher amounts of CEL in fresh litter but were not correlated with decomposition rates.
PHE was negatively correlated with FTF and positively with LPC, and unless was not
188
correlated with any macronutrient content or losses either in fresh or litter remaining
after decomposition, PHE also negatively correlated with HEM in remaining litter.
Specific evaluations of the relationships between each phenological status in this tree
community and its correlations with decomposition rates of biomass, macronutrients
and C fractions probably give us strongest correlations with those chemical and no
chemical leaf traits with low correlations like CEL, N, SLA, LA or FTF.
These results support our previous hypothesis stating that foliar quality of tree
species in active pastureland predicts decomposition rates. In addition, we observed that
foliar nutrient and C fraction concentrations are tightly correlated with fresh litter
concentrations across species and therefore the same correlations observed between
litter quality and fresh litter are extended to chemical foliar quality in green mature
leaves. In addition to the ecological implications of these correlations, these results are
relevant for the increasing actual research on plant traits at regional scales suggesting
that foliar chemical quality can be used to make inferences about the patterns on
biomass decomposition and nutrients releases.
Relationships of plant traits with decomposition rates, tree litter quality and
nutrient release
SLA, LA and FTF were correlated with macronutrient content in remaining litter
but only with C releases during decomposition.
Only SLA was negatively correlated with C losses during decomposition
process, tending to be also positively correlated with N content in remaining litter. SLA
was negatively correlated with SOL in remaining litter and tends to be negatively
correlated with HEM and LIG losses. LA was negatively correlated with N, P and C
contents remaining litter, but again was not correlated with any macronutrients losses
during decomposition process. LA tends to be positively correlated with SOL in
remaining litter. FTF was positively correlated with CEL contents in fresh litter and
with the CEL amounts released during decomposition.
These results imply that leaf traits like SLA, LA and FTF could be related with
total C and C fraction losses but not necessarily predict leaf decomposition rates. In
addition, tree species with bigger leaves have low N in fresh and remaining litter
together with lower amounts of P and higher SOL amounts in remaining litter, but not
necessarily predict N either P releases. Only tree species with more expensive leaf
construction tend to have a lower decomposition rate and to have lower SOL in

189
remaining litter and tend to have lower losses of HEM and LIG during decomposition
process. Meanwhile tree species with more hard leaves have higher contents of CEL in
fresh litter but higher amounts of CEL loosed during a faster leaf decomposition.
Whole plant and dispersal traits were also correlated with leaf litter decomposition
rates and with nutrient releases during litter decay.
Whole plant and dispersal traits were correlated with decomposition rates.
H_max was negatively correlated with monthly decomposition rates during the third
and four months of litter incubation. Meanwhile Mass_see, Vol_fru and Vol_see were
negatively correlated with decomposition rates during the first month of litter
incubation. Whole plant traits were correlated with C fractions but not with
macronutrient contents in fresh litter, were correlated with both quality of remaining
litter and tend to be correlated with macronutrients but not with c fractions releases
during decomposition.
H max was positively correlated with P and C amounts within remaining litter,
negatively correlated with C percentages in remaining litter, and tend to be only
negatively correlated with percentages of N and C looses during decomposition. WD
tends only to be negatively correlated with P contents in remaining litter. PHE was not
correlated with macronutrients contents in fresh, remaining litter or with macronutrient
losses.
H max, WD and PHE were correlated with HEM contents in fresh or remaining
litter: H_maxand PHE were negatively correlated with HEM in fresh and/or remaining
litter, meanwhile WD was positively correlated HEM in fresh litter. H_max was in
addition positively with LIG content in fresh litter and with CEL and LIG contents also
in remaining litter. However, no one of these vegetative traits was correlated with any C
fraction losses during decomposition process.
Dispersal traits were also correlated with both macronutrients and C fractions
contents in fresh and remaining litter and with macronutrients releases during
decomposition, but not with C fractions releases. Mass_fru, Vol_fru and Sha_see were
positively correlated with C contents in fresh litter, and together with Sha_fru were also
positively correlated with C contents in remaining litter. Mass_see and Vol_see tend to
be positively correlated with C contents in remaining litter. SHa_fru was positively
correlated with N content in both fresh and remaining litter, and together with Sha_see
and Vol_fru also with N in remaining litter.
190
Mass_see and Vol_see tendi were negatively correlated with P losses,
meanwhile just Sha_see and Vol_fru tend to be negatively correlated with C and N loses
during decomposition. Vol_see and Mass_see were negatively correlated with HEM in
fresh litter, Mas_fru and VOl_Fru in addition to VOl_see were positively correlated
with LIG, meanwhile Mass_fru tend to be negatively correlated with SOL. Vol_fru,
Mass_fru and Sha _see tend to be positively correlated with LIG in remaining litter.
Mass_Fru and Vol_fru were positively correlated also with CEL contents. However
dispersal traits were not correlated at all with C fractions losses during decomposition.
These results means that taller tree species have lower decomposition rates at the
end of decomposition process related with lower percentages of C loses resulting from
high LIG and low HEM contents in fresh litter, together with higher amounts of total P,
C, CEL and LIG but low HEM in the remaining litter. Tree species with denser woods
and more deciduous canopies had leaves with low HEM contents and were not related
with litter decomposition either with nutrient or C fraction releases.
Tree species with bigger dispersules and heaviest seeds have lower
decomposition rates during the first month of decomposition. Tree species with bigger
and heaviest fruits and longest dispersule have higher percentages of total C and N in
fresh litter and remaining litter, but just those with bigger fruits and longest seeds tend
to have lowest percentages of initial total C and N released during decomposition. Tree
species with heaviest and biggest seeds had the lower percentages of initial P released
during decomposition, but not particular relationships were observed with fresh and
remaining litter quality. Tree species with biggest and heaviest fruits have higher
percentages of LIG in fresh litter and remaining litter; and tend to have lower contents
of SOL in fresh litter and higher CEL content in remaining litter. Tree species with
bigger and heaviest seeds were more related with lower percentages of HEM in fresh
litter, but not with C fractions patterns in remaining litter or C fraction losses during
decomposition.
These results support our previous proposed hypothesis stating that plant traits
measuring non-foliar tree organs like whole-plant and dispersal traits were correlated
with foliar litter quality and decomposition rates. This result express also important
trade-off between leaf qualities with other plant organs linked to the plant resource use-
conservation axis.
191
Relationships between abundances of tree natural regeneration and leaf
litter quality, decomposition rates and nutrient release.
Abundance of tree natural regeneration was also correlated with decomposition
rates, leaf litter quality and macronutrients and C fractions releases through
decomposition process.
Abundance of tree natural regeneration at all developmental stages (seedlings,
saplings and adults) were positively correlated with tree litter decomposition rates
Correlations were strongly with monthly decomposition rates during the late
decomposition stages (third and four months of litter incubation). Decomposition rates
of leaf litter from adult trees were more strongly correlated with saplings abundances
than with seedlings and adults abundances.
These results showed that tree species with higher regeneration capacity in
active pasturelands have also higher decomposition rates of leaf litter. In addition, those
species with more abundance of seedlings and saplings were those with the higher
capacity to persist in active pasturelands and were also the species with the higher
decomposition rates during the late stages of tree litter incubation.
These results imply that possible changes in species composition of tree
community in active pasturelands due to the negative effects of pasture management on
seedlings abundances affect also other important ecosystems processes like tree litter
decomposition rates. The possible local extinction of those tree species with a higher
lower decomposition rate could potentially increase decomposition rates in active
pasturelands. This changes in litter decomposition rates affect mainly the early stages of
decomposition process but could have potentially stronger effects over the second phase
of litter decomposition beyond 4 months of litter decomposition.
The abundance of tree natural regeneration in active pasturelands was correlated
with macronutrients litter quality and releases.
Abundances of tree species in all developmental stages were positively
correlated with percentages of total P in fresh litter, with N and P contents in remaining
litter and with total N releases during litter decomposition process. Adult and saplings
abundances were also correlated with total P contents in remaining litter Only adults
abundances were correlated with higher total carbon looses during
decomposition.Higher LDMC and N contents in fresh litter were strongly correlated
with saplings abundances together with the higher C contents in remaining litter.
192
These results imply that those species with more capacity to regenerate in active
pasturelands are those having higher litter quality and releasing also the higher amounts
of nutrients during a faster litter decomposition process. These results imply also that
changes in tree species abundances could potentially affect N, P and C releases to the
pasturelands. Both results are implying that effectively a higher litter quality including
high levels of N and reducing C contents in leaves were related with species
survivorship within these agro ecosystems and at the same time that was affecting this
system decomposition rates and nutrient cycling.
Abundance of tree natural regeneration in active pasturelands was also strongly
correlated with C fractions content and releases from tree litter.
Abundances of all developmental stages were negatively correlated with CEL in
fresh litter, CEL and SOL in remaining litter and with CEL and LIG looses during
decomposition. Saplings abundances were also positively correlated with LIG
percentages in fresh litter, CEL in remaining litter and together with adults also with
SOL looses.
These results imply that those tree species with the higher capacity to regenerate
in active pasturelands have higher percentages of recalcitrant’s C fractions like LIG and
CEL in fresh litter. higher proportions of Carbon recalcitrant fractions in leaves of the
more abundant species in active pasturelands could help them to survive the water and
herbivore stress within these environments.
In addition, the more abundant tree species were those releasing the higher
amounts of LIG and SOL but releasing the reduced amounts of CEL during
decomposition process. These higher releases of LIG and SOL could be explaining the
higher decomposition rates during the late stages of decomposition process.
These results seem to be implying also that tree survivorship within this agro
ecosystem is related with high lignified leaves construction to overcome droughts and
herbivores attack. Finally also those more abundant tree species are affecting also C
nutrient cycling releasing higher amounts of recalcitrant’s fractions to these systems
through leaves litter decomposition.
Finally, we are awarded that there is not a simple relationship between the rate
of litter decomposition and its impact on ecosystem (net primary) productivity. Slow
rate of release from litter, during the growing season, of a nutrient whose availability is
a key limiting factor to growth may limit productivity. On the other hand, rapid release
193
of a nutrient (beyond the capacity for growing plants to take it up) especially in wet
conditions, may well result in greater rates of leaching of that nutrient from the system.
This may reduce longer-term ecosystem productivity. Soil organic matter is essentially
composed of litter that has not fully decomposed and, of course its high concentration
may be vital for retention of moisture and nutrients. However to know how much the
inter-specific variability of tree species in relation to it litter quality affects the nutrient
decomposition rates helps to be set a more strong mechanistic understanding of nutrient
cycling/soil (organic matter) functioning.
4.6 CONCLUSIONS
Tree species in active pasturelands have a wide array of different decomposition
rates and litter qualities. More specifically:
The percentage of leaf litter mass remaining vary between 20 to 74%
(mean of 53%) during four months of litter incubation, with overall
decomposition rates (BETA 5) varying from 0.09 to 0.78 (mean 0.26) for
37 tree species. Monthly decomposition rates (b1, b2, b3, b4) also vary
between tree species with faster decomposition rates occurring in the first
month of litter incubation (0.32) and slowest during the fourth month
(0.17). Macronutrients and C fractions contents varied also between
species: mean Phosphorus content varied from 0.04 to 0.22% (mean
0.10%), Nitrogen content from 0.93 to 2.7% (mean 1.5%), Carbon
content from 35 to 52% (mean 44%), Soluble compounds varied from 29
to 67% (45%), Hemicelluloses from 2 to 13%(mean 8%), Celluloses
from 12 to 32% (mean 23%) and Lignin from 6 to 39% (21%).
The variability in decomposition rates and nutrient releases of tree species in
active pasturelands are strongly related with the leaf variability spectrum but also with
reproductive and whole plant traits and with tree abundances.
Our results confirm and extend the afterlife effect of the leaf economic
variability for a wide sample of tree tropical species. Tree species with acquisitive
leaves having high P, N but low C and also high SOL, HEM but low LIG in green
leaves and fresh litter, decompose faster and release more N, P, C, SOL, HEM and LIG
than more conservative tree species.
194
In addition, the variability of whole plant and reproductive traits of tree species
commonly found in active pasturelands are also related with tree species differences in
decomposition rates and nutrient releases. Particularly,
Taller tree species with low HEM but high LIG content in fresh leaves
and litter decompose slowly during the last months of litter incubation
and release the lowest amounts of C and N than shorter tree species.
Tree species with expensive (big, heavy, long) fruit and seeds
construction have leaf litter (with more C, N and more C and recalcitrant
fractions like LIG but low C soluble compound like SOL and HEM) that
decompose slowly during the first months of litter incubation releasing
less C, P and N than litter from tree species with cheap constructed fruit
and seeds (small, light, spherical).
Finally, the relationships among tree species variability in decomposition and
nutrient release with tree abundances show that tree species with active capacity to
naturally regenerate in active pasturelands have faster decomposition rates in the last
months of litter decay releasing more N and LIG than tree species with limited
regeneration capacity. More specifically,
Tree species with abundant adult populations have leaf litter with high P,
low CEL decomposing faster and releasing higher N and LIG amounts
than tree species less abundant in adult tree cover.
Instead, tree species with more abundant saplings population have litter
with more N and LIG, faster decomposition rates in last months of litter
decay and release lower C, CEL and SOL amounts than those tree
species with more abundant adult population.
Therefore, the high variability of leaf, reproductive and whole plant traits of the
tree cover commonly found in active pasturelands is related with different
decomposition rates of tree litter which directly affect nutrient and C fractions releases
and cycling in tropical agricultural lands.
Our findings indicate that plant characteristics are linked with ecosystem
processes such as litter decomposition and tree natural regeneration with implications
for the sustainability of ecological services that could be offered by trees in agricultural
systems.

195
CHAPTER 5. GENERAL DISCUSSION
5.1 INTRODUCTION
Land use changes, largely driven by expansion of agricultural lands in tropical
areas, imply intense and abrupt habitat transformations from massive natural vegetation
to simplified ecological systems increasing global biodiversity loss. Generally, land use
change results in vast areas of agricultural land and strong forest fragmentation limiting
the capacity of species to restore their populations in the landscape. The consequential
disruptions of ecological processes providing ecological services are strongly related to
biodiversity loss and forest fragmentation. Trees outside the pristine forest have an
important role in restoring ecosystem processes at landscape level such as increasing
habitat diversity, food availability for local fauna, pollen interchange and dispersal
patterns. Conventional management practices are reducing actual tree cover diversity in
tropical agricultural landscapes but we have no information on the functional
characteristics of the relative high taxonomical diversity of tree species that persist
today after land use change from forest to pastures and their potential effects on
ecosystem processes.
Understanding the variability of functional diversity of tree species outside
pristine forest after land use change helps us to understand i) how tree species respond
to anthropogenic land disturbances so widely spread world-wide and ii) how the
maintenance of reduction of such functional variability in managed areas can affect
ecological processes providing ecological services offered by natural diversity. In a
novel approach, we try to address the link among tree characteristics or plant traits and
ecosystem processes outside pristine forest borders. Our results can help improve the
sustainable management of a globally-considerable land use cover as pasturelands. The
following lines recall the three main questions addressed during this research and
summarize and integrate the key finding of each chapter specially focusing on their
cross-links.
5.2 Tree functional strategies in Central American active
pasturelands
In the first chapter we asked which are the plant strategies of tree species
commonly found in active pasturelands. We show that tree species commonly found in
active pasturelands have diverse and inter-linked whole-plant, leaf and reproductive

196
traits, that combined define different “trees functional strategies” (Figure 5.1). This
result is especially relevant because this is the first approximation to describe the plant
functional strategies of an important group of tropical tree species outside forest
remnants in agricultural landscapes. We previously knew that a considerable proportion
of the tropical taxonomical biodiversity can be found in agricultural lands but we had no
information about the functional profile of such remnant or emergent biodiversity.
Today we have an extended description of the tree functional strategies outside pristine
forest remnants.
Figure 5.1. Methodological approaches used to describe the tree functional strategies as
particular combination of plant traits strongly related with the main dimensions
of plant variability i.e. leaf, whole plant and reproductive traits, for 65 tree
species commonly found in active pasturelands (chapter1). Intra and inter-
dimensional relationships among plant traits were tested with correspondence
analyses (CA) for paired correlations, principal components analyses (PCA) for
multiple correlations and logistic regressions (LoRe) for paired correlations
with categorical traits.
The methodological scheme in Figure 5.1 shows how the understudied
relationships of reproductive traits with other plant dimensions give us new insights on
species location in the trade off continuum among mortality to growth rates. This helps

197
increasing today holistic understanding about relative the tree species investments to
different dimensions of life history development. for example; it is not new that a high
investment in leaf carbon and leaf defense to reduce plant mortality, probably imply
slow decay rates and slow growth rates. However, it is still not clear how these
strategies are related with either species fruit and seeds characteristics (expressing
differences on disperser’s attraction investments, dispersion distances, germination and
establishment rates) or with light requirements during a particular tree successional
stage. The identification of tree functional strategies (Chapter 1), in the following
research steps integrating the species abundance component, helps us understand how
tree species responds to natural or anthropogenic disturbances like agricultural activities
(Chapter 2) as well as their possible effects on ecosystems processes (Chapter 3).
At least four main key findings must be outlined from the results in this first
chapter: 1) the four main spectrums of plant traits variability (leaf, height, wood and
reproductive spectrums) are correlated for tree species in agricultural lands. 2) The
highest proportion of tree species variability was explained by several main axes linking
together different whole plant, leaf and dispersal traits. 3) Tree dispersal mode is
correlated not only with reproductive traits but also with whole plant and leaf traits. All
these information combined together allowed us to describe the functional strategies of
tree species commonly found in anthropogenic environments. In these respect, tree
dispersal modes were good examples of tree strategies that split species’ traits
variability with particular combinations of the main spectrums of variability i.e. leaf,
wood, height and reproductive spectrums. The following lines extend in more detail
these key finding for chapter 1 describing tree functional strategies in active
pasturelands.
We confirm the presence of two main spectrums of species variability and their
close inter-relationship: i) the leaf variability spectrum which split apart conservative
leaf species (high LDMC, LCC, FTF but low SLA and LPC) from those with more
acquisitive leaves (conservative - acquisitive); and ii) the tree phenology and stem
variability spectrum showing that taller deciduous trees have softer woods than shorter
evergreens (deciduous softer – denser evergreen). Both spectrums are interlinked in a
iii) Leaf and phenology spectrum, confirming that deciduous tree species with short leaf
life span have fragile acquisitive leaves with low investments in carbon but high
198
contents of nutrients like P than evergreen species which have conservative leaves
(deciduous, softer, acquisitive vs evergreens, denser, conservative).
A novel result was to find that tree species vary also in a iv) fruit and seed
investment spectrum, which split apart tree species with bigger and heavier fruits from
those with small and lighter fruits and seeds (cheap – expensive). This fruits and seed
investment spectrum was also correlated with leaf, stem and phenology spectrums.
Acquisitive leaves have cheap fruits and seeds in a v) leaf and reproductive investment
spectrum (acquisitive and cheap) in contrast to conservative tree species with expensive
fruits and seed construction. finally, a vi) phenological, stem and reproductive spectrum
split apart deciduous trees with softer woods, small and lighter seeds from evergreen
tree species with denser woods and more expensive fruits and seeds (deciduous trees
with softer woods and cheap fruits and seeds).
Another novel result is that a holistic association occurs in several diverse axes
of plant traits variability. More than 70% of tree species variability was explained at
least by 5 main axes, each one explaining between 10 to 20% of tree species variability
when all plant traits were placed together in a unique principal component analyses.
This observation implies that the complexity of the pattern of plant trait associations do
not show a tendency to form tightly-defined “functional groups”, in contrast diverse
spectra of variability are linking together whole plant, leaf and reproductive traits. These
diverse multidimensional interactions were better described by tree “dispersal modes”,
which being correlated with all plant traits, make good examples of the tree functional
strategies in active pasturelands, displaying each one a particular combination of the
main spectrums of plant traits variability. Tree species dispersed by wind were taller,
deciduous with rich phosphorus leaves, bigger and longest fruits carrying lighter seeds.
Tree species dispersed by local fauna were shorter with big but cheap constructed leaves
(low LCC) carrying small, lighter and spherical fruits with spherical seeds. In contrast,
tree species dispersed by big mammals like cattle, have strong and expensive leaves
(high LDMC and LCC), low nutrients contents (LPC and LNC) and big and heavy fruits
with heavy seeds. Tree species with parental dispersion have dense woods but fragile
nutrient rich leaves (high LNC) having longest fruits.
5.3 Tree population responses to anthropogenic disturbances
In the second chapter we test whether functional morphology of tree species is
related to the capacity to maintain their populations through natural regeneration in

199
active pasturelands (Figure 5.2). We hypothesized that tree species’ capacity to
naturally regenerate in active pasturelands is associated to those plant traits that are
related to the four different main trait dimensions namely i) leaf variability spectrum, ii)
stem density spectrum, iii) variability on canopy height at maturity and iv) reproductive
investment spectrum, as well as to adult tree abundances. Our findings support this
hypothesis showing that leaf, reproductive and whole plant traits together with adult tree
abundances are correlated with the abundances at early developmental stages of tree
species typically founded in agricultural lands. This is the first time to date that the
persistence in anthropogenic environments of a representative sample of tropical tree
species is predicted by seedlings and saplings abundances using a wide array of plant
traits and adult abundances.
Figure 5.2. Methodological approaches used to evaluate the relationships between tree
capacities to naturally regenerate under anthropogenic disturbances and the
main dimensions of plants variability i.e. leaf, whole plant (stem height and
density) and reproductive traits for 65 tree species commonly found in active
pasturelands (Chapter 2).
The scheme in Figure 5.2 shows that tree density at 3 different developmental
stages like seedlings (germinated plants under 30 cm tall), saplings (woody plants with
stem diameter at breast height (DBH) fewer than 10 cm but more than 30 cm height)
and adult trees (dbh higher than 10 cm) were sampled on nested plots inside a total of
46 active managed pastures (paddocks) using exotic (Brizantha sp. and Cynodon sp.)
200
and naturalized grasses (Paspalum sp.) commonly found in Central American region.
Relationships among tree densities and plant traits were tested using Correspondence
Analyses (CA) for paired correlations with quantitative variables, and Logistic
Regressions (LoRe) for paired correlations with categorical traits. Adult tree densities
and plant traits capacity to predict seedling and saplings abundances were tested using
Multiple Regression Analyses (MRA).
Five key findings can be outlined from the results of the second chapter: 1) leaf,
reproductive and whole plant traits are correlated with tree species abundances in active
pasturelands, 2) the strength of these relationships between plant traits and species
abundances depend on tree developmental stages, 3) tree dispersal modes are
consistently correlated with the abundances of tree species in all developmental stages,
4) adult tree abundances are the strongest predictor of tree seedlings and saplings
abundances in active pastures, and therefore, 5) adult tree species abundances and plant
traits explained together a higher variability of seedlings and sapling abundances in
these areas in comparison to only plant traits. These results are especially relevant in the
context of diversity conservation outside forest ecosystems in tropical regions where
agricultural uses domain landscapes at expenses of the reductions of the original forest
remnants. The following lines expand these key finding for chapter 2 and their
relevance to understand tree population responses to anthropogenic disturbances.
First, we showed that the most abundant tree species in active pasturelands have
a particular combination of leaf, whole plant and reproductive traits. Only those taller
deciduous trees with softer woods having also small and more conservative leaves (low
sla, high lcc) toguether with expensive (big, heavy) and longest fruits carrying big and
longest seeds dispersed mainly either by wind or cattle, are the most abundant species of
the adult tree cover. The tree species most abundant at early developmental stages show
some similar traits. Taller tree species with conservative leaves (high LDMC) and
expensive fruits dispersed by cattle were also more abundant at both saplings and
seedlings stages. These results indicate that present tree cover in pasturelands is
dominated by particular tree characteristics in response to historical and ongoing both
natural or anthropogenic disturbances and this affect also the functional composition of
future tree community cohorts.
Secondly, we observed that relationships among tree abundances and some plant
traits were different at early developmental stages in comparison to adult tree cover.
201
Tree species with denser woods, P poor leaves and expensive seeds (heaviest) have
more sapling abundances, instead those tree species with C and N rich leaves have more
abundant seedlings. As stated previously, tree adult’s stages were dominated by species
with softer woods with a high variability in leaf macronutrients contents and seed
masses. This result shows that not only the characteristics of the most abundant adult’s
tree species are spreading successfully having more abundant seedlings and saplings
populations. In contrast, these results suggest that actual pasturelands management and
environmental conditions are also filtering tree species abundances at early
developmental stages, favoring species of future tree populations with particular plant
traits independently from those observed in the most abundant adult trees species. A
reduce mortality at early stages due to higher resistance to plant damages by cattle
grazing and browsing could be achieved by tree species with denser woods (Poorter et
al 2008). In addition, tree species with higher parental resources in seeds, faster growing
rates and higher photosynthetic rates together with a low palatability of leaves are
probably favoring a higher population of saplings in active pasturelands to overcome the
low fertility soils, the full sun exposures and herbivorous damages (Kitajima 2002).
Thirdly, we observed that dispersal mode of tree species is consistently related
with abundance of trees at all developmental stages. Only the species dispersed by big
mammals like cattle have more abundant seedlings and saplings populations, despite
those dispersed by wind are also the more abundant adult’s trees. In contrast, tree
species dispersed by local fauna were limited in all developmental stages.
These results confirm that the fragmented agricultural landscapes impose
barriers for successful natural tree regeneration, additional to the reduced amount of
mature trees already present as seed source inside these areas, which tree species have
to confront having different functional strategies. The reduction of the vertical structure
for example, the high soil temperatures and the excessive grass cover in pastureland
could represent examples of such filters by reducing the seed rain of already reduced
community of tees species dispersed by local fauna inside these areas. No matter the
high abundance of wind dispersed tree species inside the pastures, those dispersed by
mammals have more abundant seedlings and saplings populations. Although not yet
fully tested, several reasons can increase the probably of cattle dispersed seeds to have
more abundant populations: a higher number of fruits can be eaten by animals
increasing the seed rain in these areas, cattle reach longer dispersal distances increasing
the probability to colonize new adequate microenvironments, cattle dungs reduce grass

202
competition during the early seedlings´ establishment and can provide additional
nutrients sources to soils for the early growth phases of saplings.
Fourthly, ours results show that adult tree abundances were the strongest
predictor of tree seedlings and saplings abundances in active pasturelands. Correlation
and regression coefficients between adults´ abundances and seedlings´ and saplings´
abundances were higher (0.55 and 0.51 respectively) than those among plant traits and
early stages abundances (whole plant traits = 0.15 to 0.25; leaf traits = 0.13 to 0.23;
reproductive traits = 0.12 to 0.36). These results showed that the abundance of seed
sources inside agricultural lands is the strongest independent predictor of natural
regeneration abundances, simply because a higher density of mature trees increases seed
rain and thus the probability to successfully develop seedlings and saplings of this
species inside the managed areas. This result is particularly relevant for conservation
purposes because reinforces the importance of maintaining an abundant and diverse
adult tree cover within managed areas to encourage tree natural regeneration in
agricultural lands.
Finally, both adult’s tree cover abundances and plant traits explain together the
highest proportion of variability in saplings and seedlings relative abundances. Between
60 and 67% of species abundance variability was explained by adult tree abundances
and plant traits, meanwhile whole plant, leaf and dispersal traits explain only 55 and
56% of saplings and seedlings abundances respectively. Therefore, although adult
abundances are the per se the strongest predictors of tree natural regeneration
abundances, tree plant traits increase the prediction capacity of tree species variability in
composition and abundances at early tree developmental stages. The variability of
saplings and seedlings population of tree species in active pastures is better predicted by
most abundant adult trees together with highest contents of leaf dry matter or total
carbon and longest fruits or seeds. Abundant adult tree populations inside pastures
assure the availability of abundant seed sources; longest fruits and seeds are correlated
with successful dispersal modes in open grasslands like mammalochory which increase
seed rain and seed germination; meanwhile stronger leaves reduce mortality risk due to
herbivorous damages like during cattle grazing. Together all this tree characteristics
define an optimal plant strategy to successfully overcome the limited dispersal, early
establishment and growth of tree species in active pasture sites.
All these results in the second chapter define clearly that some of the tree
functional strategies observed in the first chapter for the actual tree cover in active

203
pastures, are successfully maintaining tree populations in agricultural lands meanwhile
others are not. Now we have a clear understanding of the characteristics of those tree
species having active or having limited natural regeneration after strong disturbances
caused by deforestation for pasturelands establishment and livestock production. As a
consequence of this disturbance, present tree cover is dominated by particular tree
characteristics like taller deciduous trees with softer woods, small and more
conservative leaves (low SLA, high LCC) with expensive (big, heavy) and longest fruits
carrying big and longest seeds dispersed mainly by wind and cattle. Trees with these
characteristics are more abundant seed sources and therefore are more able to
regenerate. However only those abundant tree species with also strongest leaves (high
LDMC or LCC) and dispersed by cattle (longest fruits or seeds) have also abundant
seedlings and saplings populations, possibly dominating future tree cover. In contrast,
the populations of tree species with contrasting characteristics like those dispersed by
wild fauna, will probably continue to decrease inside active pasturelands. These results
suggest that the diversity of actual tree functional strategies in active pastureland will
decrease possibly affecting other ecosystems process more directly linked with the
productive system like litter decomposition and nutrient cycling.
5.4 Tree effects on ecosystem processes
In the final third chapter of results we test if tree functional diversity and natural
regeneration capacity is related to differences in decomposition rates and nutrient
releases of tree species in active pastures (Figure 5.3). We hypothesized that tree
species in managed pasturelands have different litter and nutrient decomposition rates
related to the previously identify tree functional strategies and natural regeneration
capacities. The fact that tree species have different decomposition rates related with
their life strategies and natural regeneration capacities, imply that the productivity of the
agricultural system and not only tree cover diversity per se, will be affected with the
reduction of actual tree functional strategies. These results are highly relevant by
providing for the first time in agricultural landscapes, a better understanding of the
direct links among tree characteristics and ecosystem functioning for a wide sample of
tropical tree species.

204
Figure 5.3. Methodological approaches to evaluate the relationships between the variability
of tree species in litter quality, decomposition and nutrient releases rates with
the main dimensions of plants variability (leaf, whole plant and reproductive
traits) and tree capacities to naturally regenerate for 37 tree species commonly
found in Central American active pasturelands (Chapter 3).
The scheme in Figure 5.3 shows the standard decomposition experiment method
used in chapter 3. Here, tree litter collected by litter traps in pastures were used to fill
litter bags (375 cm 2 nylon bags with 2mm mesh) with 10 grams of foliar litter
fragments (app. 4 cm2 each), incubated in a block design arrangement on litter beds.
These beds were filled with pasture soils inside a glasshouse with homogenized
environmental conditions (temperature and moisture). Four litter bags by species (one
from each litter bed) were harvested monthly to measure i) the percentage of remaining
litter mass during 4 consecutive months (Rm1, Rm2, Rm3, Rm4) and ii) fit decay
curves to simple exponential models and obtain the overall decomposition rates (BETA
5), partial (Beta 4) and monthly decomposition rates (b1, b2, b3, b4). Samples from
initial (fresh litter) and final remaining litter at the end of 4 months of litter incubation
(decomposed) were used to measure total macronutrients (N, P, C) and C fractions
contents (initial litter quality) so that their difference was used to calculate nutrient

205
losses during decomposition process (releases). The relationships between litter
decomposition rates, quality and nutrient releases with the main dimensions of plants
variability (leaf, whole plant and reproductive) and with tree capacities to naturally
regenerate under anthropogenic disturbances were tested using correspondence analyses
(CA) for paired correlations.
The links among decomposition rates, plant traits and regeneration capacity of
this tree community in active pasturelands can be summarize it into five key results: 1)
tree species in active pasturelands have a wide array of different decomposition rates
and litter qualities. 2) a wide sample of tree tropical species and leaf traits show the
afterlife effect of their leaf economic variability, 3) in addition to leaf traits, whole plant
traits and reproductive traits are both related with differences in litter quality,
decomposition rates and macronutrients releases during decomposition. 4) more
abundant tree species have faster decomposition rates in late months of litter decay than
less abundant tree species; and, finally, 5) the strength of the correlations among tree
abundances, litter quality, decomposition rates and nutrient releases depend on tree
developmental stage. Therefore, litter quality of those tree species more abundant at
early developmental stages and more probability to succeed naturally in these areas, is
different from the litter of more abundant of adult’s tree species, probably affecting
future decomposition rates and nutrient releases. These results are particularly relevant
in the context of the biodiversity conservation and its effects on ecosystems processes
linking the importance of tree cover maintenance in agricultural lands with nutrient
cycling.
The following lines expand on the key finding of chapter 3 and their relevance to
improve our understanding on the effects of tree functional diversity on ecosystem
processes. Tree species commonly found in active pasturelands have a wide variability
in litter quality, decomposition rates and nutrient releases. Macronutrients and C
fractions contents varied also widely among species. On average, half of litter mass
decomposed during four months ranging from 20 to 74% for 37 tree species. Overall
and monthly decomposition rates vary also between species from 0.09 to 0.78, with
faster decomposition rates during the first month (0.32) and slowest during decay rates
during the fourth month (0.17). This high variability imply that tree cover commonly
found in active pastures can have also variable effects over ecosystems processes like
nutrient cycling and soil carbon formation according to tree functional strategies.

206
Our results extend the scope of the afterlife effects of leaf variability spectrum
from macronutrients to C fractions contents of green leaves. We confirm that tree
species with high P, N, C in green leaves have also high P, N, C in fresh litter. However,
we find in addition that tree species with high C fractions in green leaves have also high
C fractions in fresh litter. Therefore, leaves of tree species with acquisitive leaves, high
SOL and HEM, but low LIG contents decompose faster and release more N, P and C,
particularly more SOL, HEM and LIG than those of more conservative tree species.
These results show that leaf characteristics of trees have clear effects on ecosystems
processes far beyond their effects on living tree strategies, potentially influencing other
system components like soil fertility and grass productivity.
Whole-plan and plant and reproductive traits were also correlated with
decomposition rates and nutrient releases’ variability. Taller tree species with high LIG
but low HEM contents in litter have slow decomposition rates during the last months of
litter incubation and releases lowest C and N than shorter species. Leaf litter of tree
species with expensive fruits and seeds construction and with more longest dispersules
have more C, N and LIG but low SOL and HEM, decompose slowly during the first
months of litter incubation and release low C, N and P contents than cheap and more
spherical dispersules. These results show that other spectrums of plant variability like i)
tree phenology and stem variability and ii) fruits and seeds investment (which are more
related with growth rates and reproduction capacity) are also related with the afterlife
effect of leaf variability. According to these results, tree natural regeneration capacity
after disturbances could be also related with decomposition rates variability affecting
nutrient cycling and carbon storing according with the functional strategies of the tree
cover capable to maintain their populations in agricultural lands.
In fact, abundances of tree species commonly found in active pasturelands were
correlated with litter quality, decomposition rates and nutrient releases. Tree species
with abundant populations (i.e. with high capacity to naturally regenerate in these areas)
showed faster decomposition rates than less abundant tree species. Leaf litter of the
more abundant tree species have high P but low CEL contents and release higher
amounts of N and LIG during its faster decomposition than less abundant tree species.
In addition, the strength of correlations between tree abundances at early developmental
stages with litter quality, decomposition rates and nutrient releases, differ from those at
adult stages. Tree species with larger saplings population, for example, have litter with
more N and LIG contents, faster decomposition rates only during the last months of

207
litter decay and release less CEL than those tree species showing more abundant adult
populations, faster overall decomposition rates and larger P, C and SOL releases. These
results imply that actual tree cover dominated by tree species with faster decomposition
rates might be replaced by a tree cover with species with slower early-decomposition
rates due to higher N and LIG litter contents. This change in tree cover composition
might affect macronutrients cycling and soil carbon due to a more variable P, C and Sol
release rates and lower CEL rates and higher N and LIG releasing rates. Together all
these results provide strong evidence of the links between tree species characteristics,
population dynamics and ecosystems processes in agricultural lands.
5.5 PRACTICAL RECOMMENDATIONS
The livestock sector, a major driver of land use change in neo-tropical areas,
accounts for 30% of global land area (Havlík et al. 2013) while only15% is covered by
globally protected forest areas (Lindenmayer et al 2012). The remaining and sometimes
high diversity tree cover outside fragmented forest in agricultural lands represent a high
proportion of regional diversity (Harvey and Saenz 2008) but is also endangered
worldwide (Fisher et al 2009). The different capacities of tree species to reproduce and
maintain viable population within managed areas is predicted to reduced by half of the
actual tree diversity in Central America (Esquivel et al 2008).
Non-sustainable management pactices of tropical pastures such as eliminating or
reducing original tree cover in favor of extensive natural or exotic grasslands have often
to deal with a gradual decline in soil fertility and forage yields some years after pasture
establishment (Fearnside and Barbosa 1998). Maintaining or increasing tree cover in
active pasturelands can potentially increase productivity and avoid degradation of
pasturelands by providing nutrients and organic matter to soils while providing
additional goods and services such as wood and fruits, reduced cattle heat-stress
(Velasco et al 1999). Since agricultural production is a major driver of the tropical
deforestation, improvements in agricultural productivity should be a part of the strategy
for addressing deforestation (i.e. given the potential reduction in the need to expand to
new areas after degradation-induced abandonment of pasturelands), a significant global
source of greenhouse gas emissions and an historical contributor to climate change
(Rose et al 2013). Given the reduced area of protected forests and the continuous high
rates of deforestation, finding management approaches that will sustain the multiple
208
environmental and economic values of the tree cover remaining into the vast
agricultural lands is imperative.
Agroforestry Systems are alternative agricultural land uses which grow
herbaceous plants (crops and grasses) and animal production (cattle) in association with
different woody species (shrubs and trees) in diverse spatial arrangements. Silvopastoral
Systems (SPS) include specifically the different spatial and temporal associations
among woody species and grasses to maintain or increase pasture productivity. These
sustainable livestock production systems vary widely in terms of spatial arrangements,
density and diversity of the woody components and therefore in their implementation
costs. Some of the most common SPS consist in one or a combination of practices such
as isolated trees in pastures, live fences, cattle grazing in forest plantations, tree-grasses
alley farming, high wood-density systems for cattle browsing and forage banks. The
intensification of SPS in products, management and investment also vary incrementally
from isolated trees where naturally-growing trees are protected to obtain forage, fruits,
woods and shadow for cattle to protein and energy forage banks where woody species
with high quality leaves are sown in dense plantations, harvested and feed to stabled
cattle. All these systems have widely been reported to increase livestock productivity
and sustainability, while helping to reduce the negative effects of forest-fragmented
agricultural landscapes on connectivity and regional biodiversity (Harvey et al 2004).
To expand the adoption of SPS, some issues related to resources needed for
establishment and available knowledge guiding management decisions should be
considered. More specifically, farmers’ decisions to convert conventionally-managed
pastures to SPS depend, among many factors, also on establishment costs. In this
respect, conventional methods for reintroducing trees in pasturelands have relied largely
on costly forestry methods starting by growing saplings in greenhouses and then
planting them in the field. The management of tree natural regeneration has been
proposed as a cheapest strategy for the the maintenance of isolated trees in active
pasturelands and the establishment of SPS. However, our knowledge to date is mainly
based on research focusing on ecological interactions among SPS components such as
light and soil nutrient competition among a limited number of trees and grasses. In this
respect, the lack of understanding on the relationship at different spatial and temporal
scales (and the correspondent benefits provided) among tree cover variability and their
ecological interactions with SPS components (grasses, soils and cattle) has limited the
dissemination of this strategy and thus farmers’ adoption, although they have been

209
proposed as cheap way for the establishment of these systems. In this context ours
results can help to improve our understanding on sustainable pasture management at
different levels.
The description of tree plant functional strategies increases our knowledge the
on which are the characteristics of species commonly found in active pasturelands and
how one more obvious tree characteristic like ldmc is associated with another like wood
density or fruit and seed masses. This knowledge about tree characteristics associations
could help farmers to determine the multidimentional effects of tree species over the
pasture, as well as the investments required to maintain such species within the system.
The identification of a “leaf variability spectrum” for tree species commonly found in
active pastures, which split apart conservative leaf species from those with the opposite
characteristics (i.e. acquisitive) will help to identify tree species with potential forage
uses. Tree species in pastures with high leaf quality for example, can be desired for
potential cattle consumption fortending to have low leaf dry matter contents, low total
carbon and low recalcitrant fractions which increases rumen digestibility and
palatability of leaves.
The identification of a “stem and phenological variability spectrum” (i.e. stating
that taller deciduous trees have softer woods than shorter evergreens) help also to
identify properly the pros and cons of including particular tree canopies into pastures.
For example, when high quality woody resources are desired inside pastures, potential
higher increases in light interference (i.e. affecting grass growth) can be expected with
the evergreen tendency of denser wood species, probably reducing to some extend grass
productivity. These relationships are particularly relevant to model and predict properly
the productivity of each component of the system (grasses and trees) previous any
particular decision making.
The identification of a “fruit and seed investment spectrum”, splitting apart tree
species with bigger and heavier fruits from those with small and lighter fruits and seeds
(cheap – expensive) help also to identify tree species with different capacities to
naturally colonize disturbed areas for SPS or even forest restoration purposes. Tree
species with small, light and more spherical dispersules disseminated by local fauna
require more assistance to reach open pasture sites due to the reduced availability of
maternal sources thus decreasing their chances to successfully germinate and establish
at early developmental stages. In fact, seed rain and seedling banks of these tree species
with cheap spherical dispersules has been found mainly restricted to microsites like
210
under-canopy areas of previously established isolated trees frequently visited by birds
and bats. In contrast, those tree species with expensive (big and heavy) and longest
dispersules are those requiring a reduced dispersal assistance mainly due to their cattle-
based wide dispersion of their seed banks in open pastures.
The observation that these leaf, stem and reproductive variability spectrums, and
whole plant traits are associated increases the capacity to predict other unknown tree
characteristics from other few and most commonly available traits. Moreover, our
findings on the interactions among traits of diferent dimensions can help to make
inferences about over holistic effects of tree species in sps and to better calculate the
investments required to maintain useful tree species using tree natural regeneration
management. For example, those tree species with higher nutrient contents but fragile
acquisitive leaves tend also to be also the more deciduous tree species with a shorter
leaf life associated to their low carbon investments in leaves and woods (deciduous-
softer-acquisitive). Tree species with acquisitive leaves have also cheapest fruits and
seeds as evidenced by their reproductive investment spectrum (acquisitive and cheap
fruit and seeds) in contrast to conservative tree species with more expensive fruits and
seed construction. Finally, a phenological, stem and reproductive spectrum split apart
deciduous tree species with small and lighter seeds from evergreen species with more
expensive fruits and seeds (deciduous cheap fruits and seeds).
These results are relevant for the selection of tree species in SPS according not
only to forage but also to additional tree services offered to cattle during dry season
such as wood, shadow and fruits. The identification of tree species with higher
investments in carbon (e.g. those evergreen species with denser woods and conservative
leaves) helps also to distinguish the reltive potential of SPS on environmental services
like carbon sequestration. More specifically, evergreen tree species with conservative
leaves and expensive fruits are probably presenting higher carbon investments, with
potential interest for environmental payments schemes interested in mitigation of
climate change in agricultural landscapes.
The fact that the fruits and seed investment spectrum were correlated with leaf,
stem and phenology spectrums provides additional insights on adequate mechanism for
the establishment and management of tree species in pasturelands. Dispersal modes
were correlated with leaf, whole plant and reproductive traits providing directions about
the requirements for tree species establishment as well as of their tree adult
characteristics affecting the productive system. Tree species dispersed by wind were
211
taller, deciduous with rich phosphorus leaves, bigger and longest fruits carrying lighter
seeds. Tree species dispersed by local fauna were shorter with big but cheap constructed
leaves (low LCC) carrying small, lighter and spherical fruits with spherical seeds. In
contrast, tree species dispersed by big mammals like cattle, have strong and expensive
leaves (high LDMC and LCC) with low nutrient content (LPC and LNC) and carried
big and heavy fruits with heavy seeds. Tree species with parental dispersion have dense
woods but fragile nutrient rich leaves (high LNC) having the longest fruits. Tree species
dispersed by cattle will require lower investments by farmers than tree species with
richer forages but mainly dispersed by wind and local fauna.
This research results provide guidance to promote low cost establishment of tree
cover in SPS given the correlation among tree species capacity to naturally regenerate
and those plant traits strongly related with the three main dimensions of plant variability
(leaf, stem and phenology, and reproductive investment spectrums), as well as to adult
tree abundances is especially relevant to develop management schemes which assure the
sustainability of diverse SPS at low expenses.
Under actual management practices overlooking the importance of maintaining
tree cover diversity, the highly variable characteristics of tree species in active
pasturelands will not persist in the following tree cover generations. The present adult
tree cover is dominated by tree species characteristics such as taller deciduous with
softer woods, small and more conservative leaves with expensive and longer fruits,
carrying bigger and longer seeds dispersed by wind and cattle. Since more abundant tree
species in these agricultural lands have a higher probability to regenerate due to higher
seed availability, the future tree cover will continue to be dominated by some of these
characteristics (i.e.conservative leaves and expensive fruits dispersed by cattle),
associated to tree species with more abundant seedlings and saplings banks. If more
nutritive forages are desired for future tree cover in agricultural lands then management
schemes should promote species providing more seed rain, seedlings banks and saplings
survivorship .
The fact that both adult tree abundances and plant traits were predicting a higher
proportion of the early relative abundances and composition is relevant for landscapes
conservation and management. Adult tree abundances and plant traits explained
between 60 and 67% of species abundance variability. Increases in adult abundance of
tree species with limited natural regeneration (e.g. dispersed by wind, local fauna or
parental trees are required to increase the probability of this species to persist inside

212
agricultural landscapes. In contrast, tree species dispersed by big mammals like cattle
which have active and abundant natural regeneration in active pastures can be managed
to increase their additional potential incomes to the grazing systems designing more
structured SPS.
Tree species in managed pasturelands have different litter and nutrient
decomposition rates, related to tree functional strategies and natural regeneration
capacity. This result is of huge relevance to point out how tree diversity and
characteristics have direct link to ecosystems services like biomass decomposition,
nutrient and carbon cycling inside agricultural lands. The fact that also the natural
regeneration capacity of trees is linked to decomposition and plant characteristics
suggests that farmers can potentially manage tree cover to stir tree diversity and
composition towards a desirable nutrient and carbon cycling performance for
sustainable production.
The afterlife effect of the leaf variability spectrum for this wide sample of tree
tropical species underlined that quality of tree leaves are not only strong predictors of
litter decomposition rates but also predictors of nutrient and carbon cycling. Therefore,
acquisitive tree species with a high leaf litter quality decomposes almost 4 times faster
than tree species with the more conservative leaves with low litter quality. The
implementation of pasture management strategies increasing the abundance of tree
species with faster decomposition rates will probably speed up grasslands’ litter
decomposition increasing perhaps the turnover of nutrients from trees, to soil and
grasses. In contrast, management practices promoting the opposite tree cover
composition i.e. tree species with more conservative leaves, will probably slow down
grasslands’ decomposition, tending to increase carbon stocks in soils.
The fact that not only leaf traits, but also other tree characteristics were related
with differences in litter quality, decomposition rates and macronutrients releases
implies that SPS-management decisions affecting the provision of tree cover services
like wood, shadow or fruits forages can also have direct effects on carbon and nutrient
cycling. Taller tree species which can be desired to reduce pasture shadow have leaves
with low hem and high lig which decomposed slowly during the third and fourth
months of litter incubation and release less c and n than shorter tree species. Tree
species with expensive fruit and seed construction can be desired as alternative forage
for cattle having more C, N and LIG but low SOL, HEM and P in leaf litter,

213
decomposing slowly during the first months of litter incubation and releasing less C, N
and P than cheap constructed fruit and seeds (small light spherical fruits/seeds).
The observation that also tree regeneration capacity is related with
decomposition rates and macronutrients releases during decomposition gives us insight
about the actual and futures states of such ecosystems processes in active pasturelands.
The most abundant adult tree cover have litter with high P and low CEL decompose
faster and release higher LIG, P, N, C and SOL amounts than less abundant adult tree
species. However, decomposition rates and macronutrients releases from leaf litter of
the more abundant tree species in adult stages are different from those tree species
having more abundant early developmental stages. Tree species with a higher capacity
to naturally regenerate under actual management practices (most abundant seedlings and
saplings populations) have more N and LIG in leaf litter, more variable initial
decomposition but higher decomposition rates during the last months of litter
incubation. Therefore, decomposition dynamics and nutrient releases will probably
change in further generations of tree cover, releasing less CEL and more variable P, C
and SOL than those tree species with more abundant adult populations today but
making more N and LIG relesesreleases. These results show that the management of
tree natural regeneration is an accessible practice to drive actual and future nutrient
cycling services searching to maintain or increase soil fertility or carbon stocks in active
pasturelands.
Our results show clearly that altering the variability of tree characteristics has a
direct effect on the functioning of ecosystems processes like decomposition, carbon and
nutrient cycling which are relevant for fertility replenishment and productivity in
managed pasturelands. The effects of the variability in tree decomposition rates and
nutrient releases on grass litter decomposition, soil fertility and grass productivity
remains unknown (being beyond the scope of this research) but are imperative to fulfill
understanding of tree variability effects on grasslands ecosystems. However, the
relationships between decomposition rates and nutrient releases with plant traits and
species abundances outline a clear link between tree species characteristics and
ecosystem processes. Present tree cover has wide differences in litter quality tending to
faster decomposition rates for more abundant tree species. Decreases of tree cover
functional diversity due to the limited regeneration capacity of less abundant tree
species with particular relationships with leaf, reproductive and whole plant traits

214
probably decrease decomposition rates of tree leaves affecting nutrient and carbon
cycling in Central American pasturelands.
5.6 GENERAL CONCLUSIONS
Plant strategies: Tree species in active pasturelands have wide variability of
plant traits. These plant traits interact in several plant spectrums defining different plant
strategies where investments in fruit and seed construction are related with leaf and
whole plant traits like i) leaf - reproductive and the ii) phenology – stem – reproductive
investment spectrums.
Tree responses: Tree capacity to naturally regenerate in active pasturelands is
related with leaf, reproductive and whole plant traits, being adult abundances the main
predictors of early stages abundances. Adult abundances are dominated by taller
deciduous trees with conservative leaves and expensive investments in fruits and seeds
dispersed mainly by wind and cattle. However tree species with denser woods, low P,
high N and more expensive seeds dispersed by cattle have more abundant early
development stages in response to disturbances.
Ecosystem effects: The variability in decomposition rates and nutrient releases
of tree species in active pasturelands are strongly related with leaf spectrum but also
with reproductive and whole plant traits as well as with tree abundances. Tree species
with more conservative leaf decompose slowly and release less SOL, HEM and LIG.
Taller tree species decompose slower at the last months meanwhile those with higher
investments on fruits at seed tend to decompose slowly during the first months,
releasing less nutrients and C fractions. The most abundant adult tree species were
related with faster decomposition rates at the end of litter incubation time, but litter
quality of tree species with more abundant saplings have more N and LIG resulting in
less CEL and more variable P, C, SOL releases.
Therefore this links between plant traits, species responses to disturbances and
ecosystems processes imply that tree species with contrasting functional strategies have
different capacity to naturally regenerate in Central America pasturelands and have
contrasting effects on litter decomposition and nutrient driven future ecosystems
services in SSP.
215
CHAPTER 6. REFERENCES
Ackerly, D.D., W. K. Cornwell (2007) A trait-based approach to community assembly:
partitioning of species trait values into within- and among-community
components. Ecology Letters Volume 10, Issue 2, pages 135–145
Ackerly, D.D. (2009) Conservatism and diversification of plant functional traits:
Evolutionary rates versus phylogenetic signal Proceedings of the National
Academy of Sciences USA 106: Supplement 2. 19699-19706
Aerts, R. (1997) Climate, leaf litter chemistry and leaf liltter decomposition in terrestrial
ecosystems: a triangular relationship. Oikos, 79, 439–449.
Aerts, R. and Chapin III, F.S. (2000) The Mineral Nutrition of Wild Plants Revisited: A
Re-evaluation of Processes and Pattern. Advances in Ecological Research 30: 67
pp.
Aide, T.M., Zimmerman, J.K., Pascarella, J.B., Marcano-Vega, H. (2000) Forest
Regeneration in a Chronosequence of Tropical Abandoned Pastures:
Implications for Restoration Ecology. Restoration Ecology 8: 4, 328–338.
Altieri, M.A. (1999). The ecological role of biodiversity in agroecosystems. Agric.
Ecosyst. Environ., 74, 19–31.
Alvarez-Clare, S.and Kitajima, K. (2007) Physical defence traits enhance seedling
survival of neotropical tree species. Functional Ecology 21: 1044–1054.
Archer, S. (1995) Herbivore mediation of grass-woody plant interactions. Tropical
Grasslands 29: 218235.
Arnaiz, A.O; Castillo, S; Meave, K; Ibarra, G. (1999) Isolated pasture trees and the
vegetation under their canopies in the Chiapas Coastal Plain, Mexico. Biotrópica
31(2): 243-254
Auspurger, C.K. y Kitajima, K. (1992) Experimental studies of seedling recruitment
from contrasting seed distributions. Ecology 73 (4): 1270-1484
Baraloto, C., Paine, C. E. T., Poorter, L., Beauchene, J., Bonal, D., Domenach, A. M., et
al. (2010). Decoupled leaf and stem economics in rain forest trees. Ecology
Letters, 13, 1338–1347.
Barnard, H.R. and Ryan, M.G. (2003) A test of the hydraulic limitation hypothesis in
fast-growing Eucalyptus saligna. Plant, Cell and Environment 26, 1235–1245.

216
Barrios, C.A. (1999). Pastoreo regulado de bostas de ganado como herramientas
forestales para protección de arbolitos en potreros. Tesis Mag. Sc. Turrialba,
Costa Rica. CATIE. 127 p.
Belsky, A. J., Amndson R.G., Dexbury J.M., Riha S.J., Ali A.R. and Mwonga S.M.
(1989) ironmens in a semi-arid savanna in Kenya. J.Appl. Ecol. 26:1005-1024.
Belsky, A.J. (1992) Effects of trees on nutritional quality of understorey gramineous
forage in tropical savannas. Tropical Grassland 26: 12-20.
Belsky, A.J. (1994) Influence of trees on savanna productivity: tests of shade, nutrients,
and tree-Grass competition. Ecology 75 (4): 922-932.
Berg, B.and Staaf, H. (1980) Decomposition rate and chemical changes in Scots pine
needle litter. 2. Influence of chemical composition. Ecol Bull (Stockholm)
32:363–372
Berg, B. and Ekbohm, G. (1991) Litter mass-loss rates and decomposition patterns in
some needle and leaf litter types. Long-term decomposition in a Scots pine
forest. VII. Canadian Journal of Botany, 1991, 69(7): 1449-1456.
Berg, B., Ekbohm G, Johansson M,McClaugherty C, Rutlgliano F,Virzo de Santo A
(1996) Maximum decomposition limits of forest litter types: a synthesis. Can J
Bot 74:659–672
Berg, B., Laskowski R., Virzo De Santo, A. (1999) Estimated N concentration in humus
as based on initial N concentration in foliar litter – a synthesis. Can J Bot
77:1712–1722.
Berg, B. and McClaugherty, C. (2003) Plant Litter: Decomposition, Humus Formation,
Carbon Sequestration. Springer, 286 pp.
Berg, B. and McClaughert, C. (2008) Plant Litter: Decomposition, Humus Formation,
Carbon Sequestration. Second edition, Springer, Verlag Berlin Heidelberg,
Germany, 338 pp.
Blanco-Canqui, H., Gantzer, C.J., Anderson, S.H. and Alberts, E.E. (2004) Tillage and
crop influences on physical properties for an epiaqualf. Soil Sci. Soc. Am. J. 68:
567-576.
Blomberg, S.P., Garland, T. Jr and Ives, A.R. (2003). Testing forphylogenetic signal in
comparative data: behavioral traits are more labile. Evolution, 57, 717–745.
Boege, K., and Marquis, R.J. (2005) Facing herbivory as you grow up: the ontogeny of
resistance in plants.Trends in Ecology and Evolution 20(8), 441-448.

217
Brienen, R.J.W., P.A. Zuidema, and Martínez-Ramos, M. (2010) Attaining the canopy
in dry and moist tropical forests: Strong differences in tree growth trajectories
refl ect variation in growing conditions. Oecologia 163 : 485 – 496 .
Bullock, S.H., Mooney, H.A. and Medina, E. (1995) Seasonally dry tropical forests.
Cambridge University Press, New York.
Cadisch, G. and Giller, K.E. (1997) Driven by nature: plant litter quality and
decomposition. Wallingford: CAB International. p.175-186.
Cajas-Giron, Y.S., Sinclair, F.L. (2001) Characterization of multistrata silvopastoral
systems on seasonally dry pastures in the Caribbean region of Colombia.
Agroforestry Systems 53: 215-225.
Calvo-Alvarado, J.C., McLennan, B.B., Sánchez-Azofeifa, A.G., Garvin, T. (2009)
Deforestation and forest restoration in Guanacaste, Costa Rica: putting
conservation policies. For. Ecol. Manage. 258, 931–940.
Camargo, J. (1999) Factores ecológicos y socioeconómicos que influyen en la
regeneración natural de Cordia alliodora ((Ruiz y Pavon) Oken) en sistemas
silvopastoriles del tropico humedo y subhúmedo de Costa Rica. Tesis Mag. Sc.
Turrialba, CR, CATIE. 127
Camargo, J.C., Ibrahim, M., Somarriba, E., Finegan, B., and Current, D. (2000)
Factores ecológicos y socioeconómicos que influyen en la regeneración natural
de laurel en sistemas silvopastoriles del trópico húmedo y subhúmedo de Costa
Rica. Agroforestería en las Américas. 7 (26): 46-49.
Cannell, M.G.R., van Noordwijk, M., & Ong, C.K. (1996) The central agroforestry
hypothesis: the trees must acquire resources that the crop would not otherwise
acquire. Agroforestry Systems 34, 27-31.
Cardoso Da Silva, JM., Uhl, C., Murria, G. (1996) Plant succession, landscape
management and the ecology of frugivorous birds in abandoned Amazonian
pastures. Conservation Biology 10:491503
Chambers, J.C., MacMahon, J.A. (1994) A day in the life of a seed: Movements and
fates of seed and their implications for natural and managed systems. Annual
Review of Ecology and Systematics 25:263-92.
Chapin, F.S. III, Zavaleta, E.S., Eviner, V.T. et al. (2000) Consequences of changing
biotic diversity. Nature 405, 234–242.
218
Chave, J., Muller-Landau H. C., Baker T. R., Easdale T. A., ter Steege H., Webb C. O.
(2006) Regional and phylogenetic variation of wood density across 2456
neotropical tree species. Ecological Applications 16: 2356–2367.
Chave, J, Coomes, D., Jansen, S., Lewis, S.L., Swenson, N.G., Zanne, A.E. (2009)
Towards a worldwide wood economics spectrum. Ecology Letters 12: 351–366.
Chen, H., Niklas, K.J., Yang D.M., Sun, S.C. (2009) The effect of twig architecture and
seed number on seed size variation in subtropical woody species. New
Phytologist 183: 1212–1221
Choong, M.F, Lucas, P.W, Ong, J.S.Y., Pereira, B., Tan, H.T.W., Turner, I.M. (1992).
Leaf fracture toughness and sclerophylly: their correlations and ecological
implications. New Phytologist 121: 597±610.
Clark, G.L. (1954) Elements of Ecology, Wiley, New York.
Coley, P.D. (1983a) Herbivory and defensive characteristics of tree species in a lowland
tropical forest. Ecological Monographs 53:209-233.
Coley, P.D. (1983b) Intra-specific variation in herbivory on two tropical tree species.
Ecology 64:426-433.
Coley, P.D., Bryant, J.P., Chapin, F.S., (1985) Resource availability and plant
antiherbivore defense. Science 230(4728), 895-899.
Coll, L., Potvin, C., Messier, C., Delagrange, S. (2008). Root architecture and allocation
patterns of eight native tropical species with different successional status used in
open-grown mixed plantations in Panama. Trees 22:585–596
Collins, S. L., Koerner, S. E., Plaut, J. A., Okie, J. G., Brese, D., Calabrese, L. B.,
Carvajal, A., Evansen, R. J. and Nonaka, E. (2012) Stability of tallgrass prairie
during a 19-year increase in growing season precipitation. Functional Ecology
2012, 26, 1450–1459.
Constantinides, M. and Fownes, J.H. (1994). Nitrogen mineralization from leaves and
litter of tropical plants: relationship to nitrogen, lignin and soluble polyphenol
concentrations. Soil Biol. Biochem 26: I, 49-55,
Cooke RC, Whipps JM (1993). Resource Acquisition and Utilization in: Ecophyciology
of Fungi. Blackwell Scientific Publications. University Press Cambridge, Great
Britain. Pp. 46-50.
Cooper, S.M. and Owen-Smith, N. (1985) Condensed tannins deter feeding by browsing
ruminants in a South African Savanna. Oecologia 67:142-146
219
Cornelissen, J.H.C., Pérez-Harguindeguy, N., Díaz, S., Grime, J.P., Marzano, B.,
Cabido, M., Vendramini, F. & Cerabolini, B. (1999) Leaf structure and defence
control litter decomposition rate across species, life forms and continents. New
Phytol. 43: 191-200.
Cornelissen, J.H.C., Lavorel, S., Garnier, E., Díaz, S., Buchmann, N., Gurvich, D.E.,
Reich, P.B., ter Steege, H., Morgan, H.D., van der Heijden M.G.A., Pausas, J.G.,
Porter, H. (2003) Handbook of protocols for standardised and easy measurement
of plant functional traits worldwide. Australian Journal of Botany 51: 335-380.
Corner, E.J.H. (1949) The durian theory or the origin of the modern tree. Ann. Bot. 13:
367-414.
Cornwell, W.K., Cornelissen, J.H.C., Amatangelo, K., Dorrepaal, E., Eviner, V.T.,
Godoy, O., Hobbie, S.E., Hoorens, B., Kurokawa, H., Perrez-Harguindeguy,N.
et al. (2008) Plant species traits are the predominant control on litter
decomposition rates within biomes worldwide.Ecology Letters, 11,1065–1071.
Cosyns, E., Claerbout1, S., Lamoot, I., Hoffmann, M. (2005) Endozoochorous seed
dispersal by cattle and horse in a spatially heterogeneous landscape. Plant
Ecology 178:149–162.
Coûteaux, M.M, McTiernan, K., Berg, B., Szuberla, D., Dardennes, P. (1998) Chemical
composition and carbon mineralisation potential of Scots pine needles at
different stages of decomposition. Soil Biol Biochem 30:583–595
Coûteaux, M.M., M. Mousseau, M.L. Célérier, Bottner, P. (1991) Increased
atmospheric CO2 and litter quality: decomposition of sweet chestnut leaf litter
with animal food web of different complexity. Oikos 61:54-64.
Coûteaux, M.M., Bottner, P., Berg, B. (1995) Litter decomposition, climate and litter
quality. Tree 10:2, 63-66.
Daily, G.C., Ceballos, G., Pacheco, J., Suzán, G. and Sánchez-Azofeifa, A. (2003)
Countryside biogeography of Neotropical mammals: Conservation opportunities
in agricultural landscapes of Costa Rica. Conservation Biology 17(6): 1814-
1826.
Dalling, J.W., Hubbell, S.P., Silverai, K. (1998) Seed dispersal, seedling establishment
and gap partitioning among tropical pioneer trees. Journal of Ecology 1998, 86,
674-68.
Di Nardo, C., Papa, S., Fuggi, A., Fioretto A. (2001). Variazioni nel contenuto di
lignina e cellulosa durante la decomposizione della lettiera in un ecosistema
220
Mediterraneo. Proceedings on CD of XI National Congress of the Italian Society
of Ecology, sect. 4 ‘Sistemi Agroforestali’, 7 pp.
Di Rienzo, J.A., Guzman, A.W., Casanoves, F. (2002). A multiple-comparisons method
based on the distribution of the root node distance of a binary tree. Journal of
Agricultural, Biological, and Environmental Statistics Volume 7, Number 2
(2002), 129-142.
Di Rienzo, J.A., Casanoves F., Balzarini M.G., Gonzalez L., Tablada M., Robledo C.W.
(2011) InfoStat, Grupo InfoStat, FCA, Universidad Nacional de Córdoba,
Argentina.
Díaz, S. and Cabido, M. (2001) Vive la différence: Plant functional diversity matters to
ecosystem processes. Trends in Ecology and Evolution 16, 646–655.
Díaz, S., Hodgson, J.G., Thompson, K., Cabido, M., Cornelissen, J.H.C., Jalili, A.,
Montserrat-Marti, G., Grime, J.P., Zarrinkamar, F., Asri, Y., Band, S.R.,
Basconcelo, S., Castro-Diez, P., Funes, G., Hamzehee, B., Khoshhevi, M.,
Perez-Harguindeguy, N., Perez-Rontome, M.C., Shirvany, F.A., Vendramini, F.,
Yazdani, S., Abbas-Azimi, R., Bogaard, A., Boustani, S., Charles, M., Dehghan,
M., de Torres-Espun, L., Falczuk, V., Guerrero-Campo, J., Hynd, A., Jones, G.,
Kowsary, E., Kazemi-Saeed, F., Maestro-Martinez, M., Romo-Diez, A., Shaw,
S., Siavash, B., Villar-Salvador, P., Zak, M.R. (2004) The plant traits that drive
ecosystems: evidence from three continents. Journal of Vegetation Science 15:
295-304.
Díaz, S., Quétier, F., Cáceres, D.M., Trainor, S.F., Pérez-Harguindeguy, N., Bret-Harte,
M.S., Finegan, B., Peña-Claros, M., Poorter, L. (2011) Linking functional
diversity and social actor strategies in a framework for interdisciplinary analysis
of nature's benefits to society. PNAS 108 (3): 895-902
Dominy, N.J., Grubb, P.J., Jackson, R.V., Lucas, P.W., Metcalfe, D.J., Svenning, J.C.,
Turner, I.M. (2008) In tropical lowland rain forests monocots have tougher
leaves than dicots, and include a new kind of tough leaf. Annals of Botany
101:1363-1377.
Duesberg, S., O’Connor, D., Dhubháin, Á.N. (2013) To plant or not to plant—Irish
farmers’ goals and values with regard to afforestation. Land Use Policy 3: 155–
164

221
Easdale, T.A., Gurvich, D.E., Sersic, A.N., Healey, J.R. (2007). Tree morphology in
seasonally dry montane forest in Argentina: relationships with shade tolerance
and nutrient shortage. Journal of Vegetation Science 18: 313-326.
Easdale, T.A. and Healey, J.R. (2009) Resource-use-related traits correlate with
population turnover rates, but not stem diameter growth rates, in 29 subtropical
montane tree species. Perspectives in Plant Ecology, Evolution and Systematics
11 (2009) 203–218
Ehrlich, P.R., and Ehrlich, A.H. (1981) Extinction. Random House, New York.
Elger, A. and Willby, N.J. (2003) Leaf dry matter content as an integrative expression
of plant palatability: the case of freshwater macrophytes. Functional Ecology17,
58 –65
Elger, A., Damien, G., Lemoine, M.F. and Hanley, M.E. (2009) Plant ontogeny and
chemical defence: older seedlings are better defended. Oikos 118: 767-773
Elton, C.S. 1927. Animal Ecology. Sidgwick and Jackson, London, UK.
Esquivel, M.J. y Calle, Z. (2002) Árboles aislados en potreros como catalizadores de la
sucesión en una localidad de la Cordillera Occidental Colombiana.
Agroforestería en las Américas 9 (33-34):2530.
Esquivel, M.J., Harvey, C.A., Finegan, B., Casanoves, F., Skarpe, C. (2008) Effects of
pasture management on the natural regeneration of neotropical trees. Journal of
Applied Ecology 45, 371–380.
Falster, D.S. and Westoby, M. (2005) Tradeoffs between height growth rate, stem
persistence and maximum height among plant species in a post-fire succession
OIKOS 111: 1. 57-66
Estrada, A., Cammarano, P., Coates-Estrada, R. (2000) Bird species richness in
vegetation fences and in strips of residual rain forest vegetation at Los Tuxtlas,
MExico. Biodiversity and Conservation 9: 1399-1416.
Evans, J.R. (1996) Developmental constraints on photosynthesis: Effects of light and
nutrition. In Baker N.R. (ed.) Photosythesis and the Environment, 281–304.
Kluwer, Dordrecht, the Netherlands.
Evans, J.R. and Poorter, H. (2001) Photosynthetic acclimation of plants to growth
irradiance: the relative importance of specific leaf area and nitrogen partitioning
in maximizing carbon gain. Plant, Cell and Environment 24, 755–767
222
Fearnside, P.M. and Barbosa, R.I. (1998) Soil carbon changes from conversion of forest
to pasture in Brazilian Amazonia. Forest Ecology and Management 108, 1–2:
147–166
Felsenstein, J. (1985) Phylogenies and the comparative method. Am. Nat., 125: 1–15.
Fioretto, A., Di Nardo, C., Papa, S., Fuggi, A. (2005) Lignin and cellulose degradation
and nitrogen dynamics during decomposition of three leaf litter species in a
Mediterranean ecosystem. Soil Biol. Biochem. 37, 1083–1091
Fischer, S.F., Poschlod, P. and Beinlich, B. (1996) Experimental studies on the dispersal
of plants andanimals on sheep in calcareous grasslands. Journal of Applied
Ecology 33: 1206-1222.
Fischer, J., Stott, J., Zerger, A., Warren, G., Sherren, K., and Forrester, R.I. (2009)
Reversing a tree regeneration crisis in an endangered ecoregions. PNAS. 106:
10386-10391.
Forney, D. C., Rothman D. H. (2012) Inverse method for estimating respiration rates
from decay time series. Biogeosci. Discuss. 9, 3795–3828.
Fowler, D., Cape, J.N., Deans, J.D., Leith, I.D., Murray, M.B., Smith, R.I., Sheppard
L.J., Unsworth, M.H. (1989) Effects of acid mist on the frost hardiness of red
spruce seedlings. New Phytol. 113:321-335.
Freschet, G.T., Aerts, R. and Cornelissen, J.H.C. (2012) Multiple mechanisms for trait
effects on litter decomposition: moving beyond home-field advantage with a
new hypothesis. Journal of Ecology 100: 3, 619–630
Funes G, Basconcelo S, Díaz S, Cabido M. (1999) Seed size and shape are good
predictors of seed persistence in soil in temperate mountain grasslands of
Argentina. Seed Sci. Res. 9:341–45
Gan, S. and Amasino, R.M. (1997) Making Sense of Senescence. Molecular Genetic
Regulation and Manipulation of Leaf Senescence. Plant Physiol. (1997) 113:
313-319.
Garnier, E., Cortez, J., Bille,`S.G., Navas, M-L., Roumet, C., Debussche, M., Laurent,
G., Blanchard, A., Aubry, D., Bellmann, A., Neill, C., Toussaint, J-P. (2004).
Plant Functional Markers Capture Ecosystem Properties During Secondary
Succession. Ecology, 85(9): 2630–2637
Gautier-Hion, A. et al. (1985) Fruit characters as a basis of fruit choice and seed
dispersal in a tropical forest vertebrate community. Oecologia 65, 324–337

223
Gentry, A.H. (1982) Patterns of neotropical plant species diversity. In M.K. Hecht, B.
Wallace and G.T. Prance, editors. Evolutionary Biology 15: 1-84. Ple-num
Press, New York, New York, USA.
Gerhardt, K. (1999) Tree seedling development in dry abandoned pasture and secondary
forest in Costa Rica. Journal of Vegetation Science, 4, 95–102.
Gibbons, P., Lindenmayer, D. B., Fischer, J., Manning, A. D., Weinberg, A., Seddon, J.,
Ryan, P. and Barrett, G. (2008), The Future of Scattered Trees in Agricultural
Landscapes. Conservation Biology, 22: 1309–1319.
Gilbert, G.S; Harás, K.E; Hamill, D.N. (2001) Effects of seedling size, El Niño drought,
seedling density, and distance to nearest conspecific adult on 6 year survival of
Ocotea whitei seedlings in Panamá. Oecología 127: 509-516.
González, J.E. and Fisher, R.F. (1994) Growth of native forest species planted on
abandoned pasture land in Costa Rica. Forest Ecology and Management 70: 159-
167.
Gordon, L.J., Finlayson, C.M., Falkenmark, M. (2010) Managing water in agriculture
for food production and other ecosystem services. Agricultural Water
Management 97: 512–519.
Grime J., Thompson K., Hunt R., Hodgson, J., Cornelissen, J.H.C., Rorison I., Hendry
G., Ashenden T., Askew A., Band S., Booth R., Bossard C., Campbell B., JEL
C., Davison A., Gupta P., Hall W., Hand D., Hannah M., Hillier S., Hodkinson
D., Jalili A., Liu Z., Mackey J., Matthews N., Mowforth M., Neal A., Reader R.,
Reiling K., RossFraser W., Spencer R., Sutton F., Tasker D., Thorpe P. and
Whitehouse J. (1997). Integrated screening validates primary axes of
specialisation in plants. Oikos 79: 259-281.
Grime, J.P. (1998) Benefits of plant diversity to ecosystems: immediate, filter and
founder effects. Journal of Ecology 86: 901-910.
Guariguata, M.R., Rheingans, R., Montagnini, F. (1995) Early wood invasion under tree
plantations in Costa Rica: implications for forest restoration. Restor. Ecol. 3,
252–260.
Guevara, S; Purata, E; Van der Maarel, E. (1986) The role of remnant trees in tropical
secondary succession. Vegetatio 66: 77-84
Guimarães, P.R., Galetti, M. and Jordano, P. (2008). Seed dispersal anachronisms:
rethinking the fruits extinct megafauna ate. PLoS ONE, 3(3), e1745.

224
Hacke, U.G., Sperry, J.S, Pockman, W.T, Davis, S.D, McCulloh, K.A. (2001) Trends in
wood density and structure are linked to prevention of xylem implosion by
negative pressure. Oecologia 126: 457–461.
Hanley, M.E. and Lamont, B.B. (2002) Relationships between physical and chemical
attributes of congeneric seedlings: how important is seedling defence?.
Functional Ecology 16, 216–222.
Harguindeguy, N.P., Díaz, S., Cornelissen, J.H.C., Vendramini, F., Cabido, M.,
Castellanos, A. (2000) Chemistry and toughness predict leaf litter decomposition
rates over a wide spectrum of functional types and taxa in central Argentina.
Plant and Soil 218: 21-30.
Harms, K.E. and Dalling, J.W. (1997) Damage and herbivory tolerance through
resprouting as an advantage of large seed size in tropical trees and lianas.
Journal of Tropical Ecology 3:617-62 1.
Harvey, C.A; Haber, W.A. (1999) Remnant trees and the conservation of biodiversity in
Costa Rican pastures. Agroforestry systems 44: 37-68.
Harvey, C.A. (2000) Colonization of agricultural windbreaks by forest trees: effect of
conectivity and remnant trees. Ecological Applications 10 (6): 1762-1773.
Harvey, C.A., Guindon, C.F., Haber, W.A., DeRosier, D.H., Murray, K.G. (2000) The
importance of forest patches, isolated trees and agricultural windbreaks for local
and regional biodiversity: the case of Monteverde, Costa Rica. XXI IUFRO
World Congress, 7-12 August 2000, Kuala Lumpur, Malaysia, International
Union of Forestry Research Organizations, Subplenary sessions, Vol 1: p 787-
798.
Harvey, C.A., Medina, A., Merlo Sánchez, D., Vilchez, S., Hernández, B., Sáenz, J.,
Maes, J.M., Casanoves, F., Sinclair, F.L. (2006) Patterns of animal diversity in
different forms of tree cover in agricultural landscapes. Ecological Applications
16 (5), 1986–1999.
Harvey, C.A., Tucker, N., & Estrada, A. (2004) Live fences, isolated trees and
windbreaks: tools for conserving biodiversity in fragmented tropical landscapes?
Chapter 11. 261-289. In Schroth, G., Fonseca, G.A.B., Harvey, C.A. (eds.)
Agroforestry and biodiversity conservation in tropical landscapes. Island Press,
Washington, DC, EU.

225
Harvey, C.A. and Sáenz, J. (2008) Evaluación y Conservación de Biodiversidad en
Paisajes Fragmentados de Mesoamérica. Primera edición, Editorial InBio, Costa
Rica, 620 pp.
Harvey, C.A., Villanueva, C., Esquivel, H., Gómez, R., Ibrahim, M., López, M.,
Martínez, J., Muñoz, D., Restrepo, C., Saénz, J., Villacis, J., and Sinclair, F.
(2011) Conservation value of dispersed tree cover threatened by pasture
management. Forest Ecology and Management. 261(10): 1664-1674.
Hättenschwiler, S. and Vitousek, P.M. (2000) The role of polyphenols in terrestrial
ecosystem nutrient cycling. Trends Ecol. Evol., 15, 238–243.
Hättenschwiler, S., Aeschlimann, B., Couteaux, M.M., Roy, J., Bonal, D. (2008) High
variation in foliage and leaf litter chemistry among 45 tree species of a
neotropical rainforest community. New Phytologist 179: 165–175.
Heal, O.W., Anderson, J.M., Swift, M.J. (1997) Plant litter quality and decomposition:
an historical overview. In: Cadisch G & Giller KE (Eds) Driven by Nature –
Plant Litter Quality and Decomposition (pp 3–30). CAB International,
Wallingford
Henery, M., Westoby, M. (2001) Seed mass and seed nutrient content as predictors of
seed otput variation between species. Oikos 92:479–90
Henríquez, C.; Bertsch, F.; Salas, R. (1995) Fertilidad de suelos, Manual de
Laboratorio. Asociación Costarricense de la Ciencia del Suelo. San José, C.R. 64
p.
Hikosaka, K. and Terashima, I. (1996) Nitrogen partitioning among photosynthetic
components and its consequence in sun and shade plants. Functional Ecology 10,
335–343
Himelblau, E. and Amasino, R.M. (2001) Nutrients mobilized from leaves of
Arabidopsis thaliana during leaf senescence. J. Plant Physiol. 158. 1317–1323
(2001)
Holdridge, L.R. (2000) Ecología basada en zonas de vida. San José (CR): IICA. 216 p
Holl, K. (1998) Do bird perching structures elevate seed rain and seedling establishment
in abandoned tropical pasture? Restoration Ecology 6(3): 253-261.
Holl, K.D. (1999) Factors limiting tropical rain forest regeneration in abandoned
pasture: seed rain, seed germination, microclimate, and soil. Biotropica 31:229–
242.
226
Howe, H.F. and Smallwood, J. (1982) Ecology of seed dispersal. Annual Review of
Ecology and Systematic 13: 201-28.
Howe, H.F. (1990) Seedling survival in a Central American tree (Virola surinamensis)
Effects of herbivory and canopy closure. Journal of Tropical Ecology 6: 259-
280.
Hutchinson, G.E. (1957) Concluding remarks. Cold Spring Harbor Symposia on
Quantitative Biology 22, 415–427.
Infostat 2011. Di Rienzo, J.A., Casanoves F., Balzarini M.G., Gonzalez L., Tablada M.,
Robledo C.W. 2009. InfoStat versión 2009. Grupo InfoStat, FCA, Universidad
Nacional de Córdoba, Argentina.
Jansen, P.A.; Bongers, F., Hemerik, L. (2004) Seed mass and mast seeding enhance
dispersal by a Neotropical scatter-hoarding rodent. Ecological Monographs 74:
569-589.
Janson, C.H. (1983) Adaption of Fruit Morphology to Dispersal in a Neotropical Forest.
Science 219: 187-189.
Janzen, D.H. and Martin, S. (1982) Neotropical anachronisms: the fruits the
Gomphotheres ate. Science 215:19-27
Janzen, D.H. (1986) The future of tropical ecology. Ann. Rev. Ecol. Syst. 17, 305-24.
Jordano, P. (1987) Avian fruit removal: effects of fruit variation, crop size, and insect
damage. Ecology 68, 1711–1723.
Kazakou, E., Vile, D., Shipley, B., Gallet, C., Garnier, E. (2006) Co-variations in litter
decomposition, leaf traits and plant growth in species from a mediterranean old-
field succession. Functional Ecology 20, 21-30.
Keddy, P.A. (1992) Assembly and Response Rules: Two Goals for Predictive
Community. Journal of Vegetation Science 3: 2 157-164.
Kellman, M. (1979) Soil enrichment by Neotropical Trees. The Journal of Ecology, 67
(2): 565-577.
Kerr, A.J. and Goring, D.A.I. (1975) The role of hemicellulose in the delignification of
wood. Can. J. Chem. 53, 952-959
Kitajima, K. (1994) Relative importance of photosynthetic traits and allocation patterns
as correlates of seedling shade tolerance of 13 tropical trees. Oecologia 98: 419–
428.

227
Kitajima, K. and Fenner, M. (2000) Seedling regeneration ecology. Seeds: Ecology of
Regeneration in Plant Communities, 2nd edn (ed. M. Fenner), pp. 331–360.
CAB International, Wallingford, UK.
Kitajima, K. (2002) Do shade-tolerant tropical tree seedlings depend longer on seed
reserves? Functional growth analysis of three Bignoniaceae species. Functional
Ecology 16, 433–444.
Kitajima, K., and Poorter, L. (2010) Tissue-level leaf toughness, but not lamina
thickness, predicts sapling leaf lifespan and shade tolerance of tropical tree
species. New Phytologist 168: 708-721.
Kremen, C., Williams, N.M., Bugg, R.L., Fay, J.P., Thorp, R.W. (2004). The area
requirement of an ecosystem service: crop pollination by native bee
communities in California. Ecol. Lett., 7, 1109–1119.
Kurokawa, H. and Nakashizuka, T. (2008) Leaf herbivory and decomposability in a
Malaysian tropical rain forest. Ecology 89 (9):2645-56.
Lake, P.S., Bond, N. and Reich, P. (2007) Linking ecological theory with stream
restoration. Freshwater Biology 52, 597–615.
Lamb, D., Erskine, P. D., Parrotta, J.A. (2005) Restoration of Degraded Tropical Forest
Landscapes, Science 310, 1628-1632.
Lavorel, S. and Garnier, E. (2002) Predicting changes in community composition and
ecosystem functioning from plat traits: revisiting the Holy Grail. Functional
Ecology 16: 545-556.
Lawton, J.H. (1994) What do species do in ecosystems? Oikos 71:367–374.
Legendre, P. and Legendre, L. (1998) Numerical ecology. Second English edition.
Elsevier Publishers: Amsterdam, Holanda, 853 pp.
Leishman, M.R., Westoby, M., Jurado, E. (1995) Correlates of seed size variation: a
comparison among five temperate floras. J. Ecol. 83:517–29
Leishman, M.R. and Westoby, M. (1998) Seed size and shape are not related to
persistence in soil in Australia in the same way as in Britain. Funct. Ecol.
12:480–85
Leishman, M.R., Wright, I.J., Moles, A.T., Westoby, M. (2000) The evolutionary
ecology of seed size. In Seeds: The Ecology of Regeneration in Plant
Communities, ed.MFenner, pp. 31– 57. Wallingford, UK: CAB Int.
Levey, D.J., Moermond, T.C. and Denslow, J.S. (1994) Frugivory: An overview. In La
Selva: Ecology and Natural History of a Neotropical Rainforest (L.A. McDade,
228
K.S. Bawa, H.A. Hespenheide and G.S. Hartshorn, eds), pp. 282–294. Chicago,
IL: University of Chicago Press.
Lim, M.T., Cousens, J.E. (1986) The internal transfer of nutrients in a Scots pine stand.
II. The patterns of transfer and the effects of nitrogen availability. Forestry 59
(1), 17±27.
Lindenmayer, D.B., Franklin, J.F., Lõhmus, A., Baker, S.C., Bauhus, J., Beese, W.,
Brodie, A., Kiehl, B., Kouki, J., Pastur, G. M., Messier, C., Neyland, M., Palik,
B., Sverdrup-Thygeson, A., Volney, J., Wayne, A. and Gustafsson, L. (2012), A
major shift to the retention approach for forestry can help resolve some global
forest sustainability issues. Conservation Letters, 5: 421–431.
Loranger, G., Ponge, J.F., Imbert, D. and Lavelle, P. (2002) Leaf litter decomposition in
two semi-evergreen tropical forests: Influence of litter quality. Biol. Fertility
Soils, 35: 247-252.
Lord, J., Egan, J., Clifford, T., Jurado, E., Leishman, M., Williams, D., Westoby, M.
(1997) Larger seeds in tropical floras: consistent patterns independent of growth
form and dispersal mode. Journal of Biogeography, 24, 205–211.
Loreau, M. and Hector, A. (2001) Partitioning selection and complementarity in
biodiversity experiments. Nature, 412, 72–76.
Loreau, M., Naeem, S. and Inchausti, P. (2002) Biodiversity and Ecosystem
Functioning. Oxford University Press, Oxford, UK.
Loreau, M., Naeem, S., Inchausti, P., Bengtsson, J., Grime, J.P., Hector, A., Hooper,
D.U., Huston, M.A., Raffaelli, D., Schmid, B., Tilman, D., Wardle, D.A. (2001)
Biodiversity and ecosystem functioning: current knowledge and future
challenges. Science 294: 804-808
Loreau, M. and Hector, A. (2001) Partitioning selection and complementarity in
biodiversity experiments. Nature, 412, 72–76.
Lugo, A.E., Helmer, E. (2004) Emerging forests on abandoned land: Puerto Rico’s new
forests, Forest Ecology and Management 190: 145–161.
Mafongoya, P.L., Nair, P.K.R. and Dzowela, B.H (1998) Mineralization of nitrogen
from decomposing leaves of multipurpose trees as affected by their chemical
composition. Biol. Fert. Soils 27, 143–148.
Mafongoya, P.L., Giller, K.E. and Palm, C.A. (1998) Decomposition and nitrogen
release patterns of tree prunings and litter. Agroforestry Systems 38:77-79

229
Maharjan, S. K., Poorter, L., Holmgren, M., Bongers, F., Wieringa, J. J. and Hawthorne,
W. D. (2011) Plant Functional Traits and the Distribution of West African Rain
Forest Trees along the Rainfall Gradient. Biotropica, 43: 552–561.
Malo, J.E., and Suárez, F. (1995) Establishment of Pasture Species on Cattle Dung: The
Role of Endozoochorous Seeds. Journal of Vegetation Science 6: 2, 169-174.
Markesteijn, L., Poorter, L., Bongers, F., Paz, H., Sack, L. (2011) Hydraulics and life
history of tropical dry forest tree species: coordination of species’ drought and
shade tolerance. New Phytol. 191 480–495.
Martínez-Garza, C. and Howe, H.F. (2003) Restoring tropical diversity: beating the time
tax on species loss. Journal of Applied Ecology 40: 423–429.
Martinez-Garza, C., Peña, V., Ricker, M., Campos, A., Howe, H. (2005) Restoring
tropical biodiversity: Leaf traits predict growth and survival of late-successional
trees in early successional environments. Forest Ecology and Management. 217:
365-379.
Mayfield, M.M., and Daily, G.C. (2005) Countryside biogeography of neotropical
herbaceous and shrubby plants. Ecological Applications 15:423–439
Mazer, S.J. (1990) Seed mass of Indiana Dune genera and families: Taxonomic and
ecological correlates. Evolutionary Ecology 4: 4, 326-357.
Mc Donnell, M.J. and Stiles, E.W. (1983) The structural complexity of old field
vegetation and the recruitment of bird-dispersed plant species. Oecologia 56:
109-116.
McGill, B.J., Enquistb, B. J., Weiherc, E., Westoby, M. 2006. Rebuilding community
ecology from functional traits. Trends in Ecology and Evolution 21: 4,: 178–
185.
McGill, B.J., Maurer, B.A., Weiser, M.D. (2006) Empirical Evaluation of Neutral
Theory. Ecology 87:1411–1423.
McLaren, K.P., and McDonald, M.A. (2003a) Seedling dynamics after different
intensities of human disturbance in a tropical dry limestone forest in Jamaica.
Journal of Tropical Ecology 19:567–578.
McLaren, K.P., and McDonald, M.A. (2003 b) The effects of moisture and shade on
seed germination and seedling survival in a tropical dry forest in Jamaica. Forest
Ecology and Management 183:61–75.
Melillo, J.M., Aber, J.D., Muratore, J.F. (1982) Nitrogen and lignin control of hardwood
leaf litter de-composition dynamics. Ecology 63, 621-626.

230
Mesquita, R.C.G., Workman, S.W., Neely, C.L. (1998) Slow decomposition in a
Cecropia-dominated secondary forest of Central Amazonia. Soil Biol Biochem
30:167–175
Meyrat, A. (2000) Los Ecosistemas y Formaciones Vegetales de Nicaragua.
Protierra/MARENA/CBA, Managua, Nicaragua.
Milchaunas, D.G. and Lauenroth, W.K. (1993) Quantitative effects of grazing on
vegetation and soils over a global range of environments. Ecological
Monographs 63: 327-366
Moles, A.T., Hodson, D.W., Webb, C.J. (2000). Do seed size and shape predict
persistence in soil in New Zealand? Oikos 89:541–45
Moles, A.T. and Westoby, M. (2004a) Seedling survival and seed size: a synthesis of
the literature Journal of Ecology 92: 3, 372-383.
Moles, A.T. and Westoby, M. (2004b) Seed mass and seedling establishment after fire
in Ku-ring-gai Chase National Park, Sydney, Australia Austral Ecology 29: 4.
383-390
Moles, A.T. and Westoby, M. (2004c) What do seedlings die from and what are the
implications for evolution of seed size? Oikos 106: 1. 193-199
Moles, A. T., Warton, D. I., Stevens, R. D. and Westoby, M. (2004) Does a latitudinal
gradient in seedling survival favour larger seeds in the tropics? Ecology Letters
7: 911-914.
Moles, A. T.; Ackerly, D. D.; Webb, C. O.; Tweddle, J. C.; Dickie, J. B. and Westoby,
M. (2005) A brief history of seed size. Science 307: 576-580
Moles, A.T. and Westoby, M. (2006) Seed size and plant strategy across the whole life
cycle. Oikos 113: 1, 91-105
Moles, A.T. and Leishman, M.R. (2008) The seedling as part of a plant's life history
strategy. In: Leck, M. A.; Parker, V. T. and Simpson, R. L. (eds) Seedling
Ecology and Evolution. Cambridge University Press.
Moles, A.T., Gruber, M.A.M., Bonser, S.P. (2008) A new framework for predicting
invasive plant species. Journal of Ecology 96: 1, 13–17
Mouillot, D., Mason, N.W.H., Wilson, J.B. (2007) Is the abundance of species
determined by their functional traits? A new method with a test using plant
communities. Oecologia Volume 152, Number 4 (2007), 729-737.
Muller-Landau, H.C. (2004) Interspecific and Inter-site Variation in Wood Specific
Gravity of Tropical Trees. Biotropica 36(1): 20-32.

231
Muller-Landau, H.C. and Hardesty, B.D. (2005) Seed dispersal of woody plants in
tropical forests: Concepts, examples, and future directions. In: Burslem DFRP,
Pinard MA, Hartley S, editors. Biotic interactions in the tropics. Cambridge:
Cambridge University Press. 580 p.
Muller-Landau, H.C. (2008) Colonization-related tradeoffs in tropical forests and their
role in the maintenance of plant species diversity. In W. P. Carson and S. A.
Schnitzer, editors. Tropical Forest Community Ecology. Blackwell Scientific.
182-195 p
Murphy, P.G. and Lugo, A.E. (1995) Dry forests of Central America and the Caribbean,
p. 9-34. In: S.H. Bullock, H.A. Mooney and E. Medina, eds. Seasonally Dry
Tropical Forests, Cambridge University Press. 429 pp.
Naeem, S. (1998) Species redundancy and ecosystem reliability. Conserv. Biol. 12, 39 –
45
Nath, C.D., Dattaraja, H.S., Suresh, H.S., Joshi, N.V., Sukumar R. (2006) Patterns of
tree growth in relation to environmental variability in the tropical dry deciduous
forest at Mudumalai southern India. J Biosci.31:651–669.
Nepstad, D.C., VerõÂssimo, A., Alencar, A., Nobre, C., Lima, E., Lefebvre, P.,
Schlesinger, P., Potterk, C., Moutinho, P., Mendoza, E., Cochrane, M., Brooks,
V. (1999) Large-scale impoverishment of Amazonian forests by logging and
fire. Nature 398, 505-508.
Niemann, G.J., Pureveen, J.B.M., Eijkel, G.B., Poorter, H., Boon, J.J. (1992) Diferences
in relative growth rate in 11 grasses correlate with di€ erences in chemical
composition as determined by pyrolysis mass spectrometry 89: 4, 567-573
Niinemets, Ü. (1998) Growth of young trees of Acer platanoides and Quercus robur
along a gap-understory continuum: Interrelationships between allometry,
biomass partitioning, nitrogen, and shade tolerance. International Journal of
Plant Sciences, 159, 318 - 330.
Niinemets, Ü. and Kull, O. (1998) Stoichiometry of foliar carbon constituents varies
along light gradients in temperate woody canopies: implications for foliage
morphological plasticity. Tree Physiology, 18, 467 - 479.
Niinemets, Ü. (1999a). Components of leaf dry mass per area - thickness and density -
alter leaf photosynthetic capacity in reverse directions in woody plants. New
Phytologist, 144, 35 - 47.
232
Niinemets, Ü. (1999b) Differences in chemical composition relative to functional
differentiation between petioles and laminas of Fraxinus excelsior. Tree
Physiology, 19, 39 - 45.
Niinemets, Ü. (2006) The controversy over traits conferring shade-tolerance in trees:
ontogenetic changes revisited. Journal of Ecology 94: 464–470.
Niinemets, Ü., Portsmuth, A., Tena, D., Tobias, M., Matesanz, S., Valladares, F. (2007)
Do we underestimate the importance of leaf size in plant economics?
Disproportional scaling of support costs within the spectrum of leaf
physiognomy. Annals of Botany 100: 283-303.
Niklas, K.J. (1995) Size-dependent allometry of tree height, diameter and trunk taper.
Ann. Bot., 75, 217–227.
Noodén, L.D. and Guaim, J. (1989) Regulation of assimilation and senescence by the
fruit in monocarpic plants. Physiol. Plant. 77: 267-274
Havlík, P., Valin, H., Mosnier, A. Obersteiner, M., Baker, J.S., Herrero, M., Rufino,
M.C. and E. Schmid. Crop Productivity and the Global Livestock Sector:
Implications for Land Use Change and Greenhouse Gas Emissions. Am. J. Agr.
Econ. (2013) 95(2): 442-448.
Keyser, P., Kirk, T.K., Zeikus, J.G. (1978) Ligninolytic enzyme system of
Phanaerochaete chrysosporium: synthesized in the absence of lignin in response
to nitrogen starvation. Journal of bacteriology, 135: 3 790-797
Parsons, S. A. and Congdon, R. A. (2008) Plant litter decomposition and nutrient
cycling in north Queensland tropical rainforest communities of differing
successional status. Journal of Tropical Ecology 24, 317-327
Parton, W., Silver, W.L., Burke, I.C., Grassens, L., Harmon, M.E. (2007) Global-scale
similarities in nitrogen release patterns during long-term decomposition. Science
315:361– 64
Paz, H., Mazer, S.J., Martínez-Ramos, M. (2005) Comparative ecology of seed mass in
Psychotria (Rubiaceae): within- and between-species effects of seed mass on
early performance. Functional Ecology 19:707–718.
Pérez-Harguindeguy, N., Díaz, S., Cornelissen, J.H.C., Vendramini, F., Cabido, M. and
Castellanos, A. (2000) Chemistry and toughness predict leaf litter decomposition
rates over a wide spectrum of functional types and taxa in central Argentina.
Plant Soil 218: 21-30.
233
Pérez-Harguindeguy, N., Díaz, S., Vendramini, F., Cornelissen, J.H.C., Gurvich, D.E.
and Cabido, M. (2003) Leaf traits and herbivore selection in the field and in
cafeteria experiments. Austral Ecology, 28: 642–650.
Pickup, M., Westoby, M., Basden, A. (2005) Dry mass costs of deploying leaf area in
relation to leaf size. Functional Ecology19: 88-97.
Pimentel, D., Stachow, U., Takacs, A., Brubaker, W., Dumas, A.R., Meaney, J.S.
(1992) Conserving biological diversity in agricultural/forestry systems.
Bioscience, 432, 354–362.
Poorter, L, Bongers, F., Sterck, F.J., Wöll, H. (2003) Architecture of 53 rain forest tree
species differing in adult stature and shade tolerance. Ecology 84:602–608
Poorter, L., and Rose, S. A. (2005) Light-dependent changes in the relationship between
seed mass and seedling traits: a meta-analysis for rain forest tree species.
Oecologia 142:378–387.
Poorter, L., Bongers, F., Sterck, F. J., Wöll, H. (2005) Beyond the regeneration phase:
differentiation of height-light trajectories among tropical tree species. Journal of
Ecology 93:256–267.
Poorter, L., Bongers, F. (2006) Leaf traits are good predictors of plant performance
across 53 rain forest species. Ecology 87: 1733–1743.
Poorter, H., Pepin, S., Rijkers, T., de Jong, Y., Evans, J.E. and Körner, C. (2006)
Construction costs, chemical composition and payback time of high- and low-
irradiance leaves. Journal of Experimental Botany, Vol. 57, No. 2, pp. 355–371.
Poorter, L., Hawthorne, W.D., Sheil, D., Bongers, F. (2008a) Maximum size
distributions in tropical forest communities; relationships with rainfall and
disturbance. Journal of Ecology 96: 495–504.
Poorter, L., Paz, H., Wright, S.J., Ackerly, D.D., Condit, R., Ibarra-Manrıíquez, G.,
Harms, K., Licona, J.C., Martínez-Ramos, M., Mazer, S. (2008b) Are functional
traits good predictors of demographic rates? Evidence from 5 neotropical forests.
Ecology 89: 1908–1920.
Poorter, L. (2008) The Relationships of Wood-, Gas- and Water Fractions of Tree Stems
to Performance and Life History Variation in Tropical Trees. Annals of Botany
102: 367–375
Poorter, L., McDonald, I., Alarcón, A., Fichtler, E., Licona, J.-C., Peña-Claros, M.,
Sterck, F., Villegas, Z. and Sass-Klaassen, U. (2010) The importance of wood

234
traits and hydraulic conductance for the performance and life history strategies
of 42 rainforest tree species. New Phytologist, 185: 481–492.
Powers, J.S., Becknell, J.M., Irving, J., Perez-Aviles, D. (2009) Diversity and structure
of regenerating tropical dry forests in Costa Rica: geographic patterns and
environmental drivers. For Ecol Manag 258:959–970.
Prajjwal, D., Sharma, G.P., Raghubanshi, A.S. and J.S. Singh (2011) Leaf traits and
herbivory as indicators of ecosystem function. Current Science 100: 3, 313-320.
Radford, I.J; Nicholas, D.M; Brown, J.R; Críticos, D.J. (2001) Paddock-scale patterns
of seed production and dispersal in the invasive shrub Acacia nilotica
(Mimosaceae) in northern Australian rangelands. Austral Ecology 26: 338-348
Read, J. and Stokes, A. (2006) Plant biomechanics in an ecological context. American
Journal of Botany 93: 1546-1565.
Reich, P.B. and Oleksyn, J. (2004) Global patterns of plant leaf N and P in relation to
temperature and latitude. PNAS, 101: 30, 11001–11000
Rhoades, C.C. (1997) Single-tree influences on soil properties in agroforestry: lessons
from natural forest and savanna ecosystems. Agroforestry Systems 35, 71-94.
Rhoades, C.C., Eckert, G.E., Coleman, D.C. (1998). Effect of pasture trees on soil
nitrogen availability and soil organic matter cycling: Implications for montane
forest restoration. Restoration Ecology 6:262-270.
Rhoades, C.C., Eckert, G.E., Coleman, D.C. (2000) Soil carbon changes among forest,
agriculture and secondary vegetation in lower montane Ecuador. Ecological
Applications 10:497-505.
Robinson, G.R. and Handel, S.N. (1993) Forest restoration on a closed landfill: Rapid
addition of new species by bird dispersal. Conservation Biology 7(2): 271-277
Rose, S.K., Golub, A.A., Sohngen, B. (2013) Total Factor and Relative Agricultural
Productivity and Deforestation. Am. J. Agr. Econ. 95 (2): 426-434.
Rosenfeld, J.S. (2002) Functional redundancy in ecology and conservation. Oikos 98: 1,
156–162.
Rutigliano, F.A., Virzo de Santo, A., Berg, B., Alfani, A., Fioretto, A. (1996) Lignin
decomposition in decaying leaves of Fagus sylvatica L. and needles of Abies
alba Mill. Soil Biology & Biochemistry 28, 101–106
Sala, O.E., Austin, A.T. (2000) Methods of estimating aboveground net primary
productivity. In: O.E. Sala., R.B. Jackson., H.A. Mooney., R.W. Howarth,
editors. Methods in Ecosystem Science. Springer, New York. p. 31-43.
235
Sanchez, P.A. and Logan, T.J. (1992) Myth and science about the chemistry and fertility
of soils in the tropics pp. 34-46. In: R. Lal & P.A. Sanchez (eds.) Myth and
Science of Soils of the Tropics. SSSA Publ. No. 29. ASA, CSSA and SSSA.
Sánchez-Azofeifa, G.A., Quesada, M., Rodriguez, J.P., Nassar, M., Stoner, K.E.,
Castillo, A., Garvin, T., Zent, E.L., Calvo, J.C., Kalacska, M., Fajardo, L.,
Gamon, J., Cuevas-Reyes, P. (2005) Research Priorities for Neotropical Dry
Forests. Biotropica 37: 477-485.
Sanson, G. (2006) The biomechanics of browsing and grazing. American Journal of
Botany 93:1531-1545.
Santiago, L.S., Goldstein, G., Meinzer, F.C., Fisher, J.B., Machado, K., Woodruff, D.,
Jones, T. (2004) Leaf photosynthetic traits scale with hydraulic conductivity and
wood density in Panamanian forest canopy trees. Oecologia (2004) 140: 543–
550
Sariyildiz, T., and Anderson, J.M. (2003) Decomposition of sun and shade leaves from
three deciduous tree species, as affected by their chemical composition. Biology
and Fertility of Soils 37, 137–146.
Schädler, M., Jung, G., Auge, H., Brandl, R. (2003) Palatability, decomposition and
insect herbivory: patterns in a successional old-field plant community. Oikos
103:121–132.
Schädler, M., Schroth, G., Beer, J., Jiménez, F. (2003) Root interactions between young
Eucalyptus deglupta trees and competitive grass species in contour strips. Forest
ecology and management 179: 1, 429-440.
Schläpfer, F., Schmid, B. and Seidl, I. (1999) Expert estimates about effects of
biodiversity on ecosystem processes and services. Oikos, 84, 346–352.
Shipley, B. (1995) Structured interspecific determinants of specific leaf area in 34
species of herbaceous angiosperms. Functional Ecology, 9, 312–319.
Shipley, B., Vile, D., Garnier, E. (2006) From Plant Traits to Plant Communities: A
Statistical Mechanistic Approach to Biodiversity. Science 314: 5800, 812-814
Simón, M., Ibrahim, M., Finegan, B. Pezo, D. (1997) Efectos del pastoreo bovino sobre
la regeneración de tres especies arbóreas comerciales del chaco argentino: un
método de protección. Agroforestería en las Américas 5 (17-18).
Sobral, M., Larrinaga, A.R., Guitián, J. (2010) Do seed-dispersing birds exert selection
on optimal plant trait combinations? Correlated phenotypic selection on the fruit

236
and seed size of hawthorn (Crataegus monogyna). Evolutionary Ecology 24: 6,
1277-1290.
Somariba, E. and Beer, J. (1985) Árboles de guayaba (Psidium guajava L.) en
pastizales. III. Producción de leña. Turrialba 35 (4): 333-338.
Somarriba, E. (1995) Guayaba en potreros: establecimiento de cercas vivas y
recuperación de pasturas degradadas. Agroforestería en las Américas 2 (6): 27-
29.
Sterck, F.J., Poorter, L., and Schieving, F. (2006) Leaf Traits Determine the Growth-
Survival Trade-Off across Rain Forest Tree Species. The american naturalist
167, 5: 758–765
Suding, K.N., Collins, S.L., Gough, L., Clark, C., Cleland, E.E., Gross, K.L.,
Milchunas, D.G., Pennings, S. (2005) Functional and abundancebased
mechanisms explain diversity loss due to N fertilization. PNAS 102: 12, 4387–
4392.
Swift, M.J., Heal, O.W., Anderson, J.M. (1979) Decomposition in terrestrial
ecosystems. Blackwell, London, UK.
Szott, L. Ibrahim, M. and Beer J. (2000) The Hamburger connection hangover: cattle,
pasture land degradation and alternative land use in Central America. CATIE,
DANIDA, GTZ. 71 pp.
Teague, W.R. and Dowhower, S.L. (2003) Patch dynamics under rotational and
continuos grazing management in large, heterogeneous paddocks. Journal of
Arid Environments 53: 211–229.
Teklay, T. and Malmer, A. (2004) Decomposition of leaves from two indigenous trees
of contrasting qualities under shaded-coffee and agricultural land-uses during the
dry season at Wondo Genet, Ethiopia. Soil Biol. Biochem. 36:777–786.
Thompson, J.E., Froese, C.D., Madey, E., Smith, M.D., Hong, Y. (1998) Lipid
metabolism during plant senescence. Prog Lipid Res 372: 119–141
Thompson, J.E, Hopkins, M.T, Taylor, C., Wang, T.W. (2004) Regulation of
senescence by eukaryotic translation initiation factor 5A: implications for plant
growth and development. Trends Plant Sci 9: 174–179
Thompson, K., Green, A., Jewels, A.M. (1994) Seed in soil and worm casts from a
neutral grassland. Func.Ecol. 8: 29-35.
Thompson, K., Band, S.R., Hodgson, J.G. (1993) Seed size and shape predict
persistence in soil. Functional Ecology 7: 236-241.
237
Thompson, K., Green, A., Jewels, M. (1994) Seeds in soil and worm casts from a
neutral grassland, Funct. Ecol. 8 29–35.
Thompson, K., Hodgson, J.G., Grime, J.P., Burke, M.J.W. (2001) Plant traits and
temporal scale: evidence from a 5-year invasion experiment using native species.
Journal of Ecology, 89: 1054–1060.
Thomson, F.J., Moles, A.T., Auld, T.D. and Kingsford, R.T. (2011) Seed dispersal
distance is more strongly correlated with plant height than with seed mass.
Journal of Ecology, 99, 1299–1307.
Tilman, D. (1996) Biodiversity: population versus ecosystem stability. Ecology 77:350-
363.
Tilman, D., Wedin, D., Knops, J. (1996) Productivity and sustainability influenced by
biodiversity in grassland ecosystems. Nature 379: 718-720
Tilman, D. (1999) Diversity and production in European grasslands. Science 286:1099–
1100
Tilman, D., Cassman, K.G., Matson, P.A., Naylor, R. and Polasky, S. (2002)
Agricultural sustainability and intensive production practices. Nature 418: 671-
677.
Toh, I; Gillespie, M; Lamb, D. (1999) The role of isolated trees in facilitating tree
seedling recruitment at a degraded sub-tropical rainforest site. Restoration
Ecology 7(3): 288-297.
Toledo, J.M., Morales, V.A. and Serrao, E.E.S. (1982) Pasture and Animal Production
in Amazonia. In: S.B. Hecht, ed. Amazonia: Agriculture and Land Use
Research. CIAT, Cali, Colombia, Series OSES (82), 428 pp.
Traba, J., Levassor, C., Peco, B. (2003) Restoration of Species Richness in Abandoned
Mediterranean Grasslands: Seeds in Cattle Dung. Restoration Ecology, 11: 378–
384.
Tscharntke, T., Klein, A.M., Kruess, A., Steffan-Dewenter, I., Thies, C. (2005)
Landscape perspectives on agricultural intensification and biodiversity-
ecosystem service management. Ecol. Lett. 8, 857–874.
Turner, B.L. II, Lambin, E.F., Reenberg, A., (2007) The emergence of land change
science for global environmental change and sustainability. Proc Natl Acad Sci
USA 104: 20666–20671
Uhl, C., Busbacher, R., Serrao, A.S. (1988) Abandoned pastures in eastern Amazonia.
Journal of Ecology 76: 633-681.

238
Brovkin, V., van Bodegom, P.M., Kleinen, T., Wirth, C., Cornwell, W.K., Cornelissen,
J.H.C., Kattge, J. (2012) Plant-driven variation in decomposition rates improves
projections of global litter stock distribution.
Vadstein, O. and Olsen, Y. (1989) Chemical composition and phosphate uptake kinetics
of limnetic bacterial communities cultured in chemostats under phosphorus
limitation. Limnol. Oceanogr. 34: 939-946.
Vaieretti, M.V., Perez-Harguindeguy, N., Gurvich, D.E., Cingolani, A.M., Cabido, M.
(2005) Decomposition dynamics and physico-chemical leaf quality of abundant
species in a montane woodland in central Argentina. Plant and Soil 278:223–
234.
Vance, C.P., Graham, P.H., Allan, D.L. (2000) Biological nitrogen fixation.
Phosphorus: a critical future need. In Pedrosa, F.O., Hungria, M., Yates, M.G.
eds. Nitrogen Fixation: From Molecules to Crop Productivity. Newton WE
(Kluwer Academic Publishers, Dordrecht, The Netherlands), pp 506–514.
Vance, C.P. (2002) Root-bacteria interactions: symbiotic nitrogen fixation. in Plant
Roots: The Hidden Half, eds Waisel Y, Eshel A, Kafkati U (Marcel Dekker
Publishers, New York), Ed 3, pp 839–867. Search Google Scholar
Vance, C., Uhde-Stone, C., Allan, D. (2003) Phosphorus acqui sition and use: critical
adaptations by plants for securing a non- renewable resource. New Phytol. 157,
423–447.
Velasco, J., Camargo, J., Andrade, H., Ibrahim, M. (1999) Mejoramiento del suelo por
Acacia mangium en un sistema silvopastoril con B. humidicola. In: Memorias VI
Seminario Internacional sobre sistemas agropecuarios sostenibles. 28-30 de
Octubre 1999. CIPAV – FAO. Cali, Colombia.
Velasco, A., Ibrahim M., Kass D., Jiménez F. and Rivas G. (1999) Concentraciones de
fosforo en suelo bajo sistema silvopastoril de Acacia mangium y B. humidicola.
Agroforesteria en las Americas 6:23, 41-47.
Vergutz, L., Manzoni, S., Porporato, A., Novai, R.F., Jackson, R.B. (2012) Global
resorption efficiencies and concentrations of carbon and nutrients in leaves of
terrestrial plants. Ecological Monographs 82: 205–220.
Vieira, D.L.M. and Scariot, A. (2006) Principles of Natural Regeneration of Tropical
Dry Forests for Restoration. Restoration Ecology 14: 1, 11–20.

239
Vitousek, P.M., Aber, J.D., Howarth, R.W., Likens, G.E., Matson, P.A., Schindler,
D.W., Schlesinger, W.H., Tilman, D.G. (1997) Human alteration of the global
nitrogen cycle: sources and consequences. Ecol. Appl. 7, 737–750.
Walker, B.H. (1992) Biological diversity and ecological redundancy. Conservation
Biology 6.-18-23.
Walters, M.B. and Reich, P.B. (1999) Low-light carbon balance and shade tolerance in
the seedlings of woody plants: do winter deciduous and broad-leaved evergreen
species differ?. New Phytologist, 143: 143–154.
Wardle, D.A., Bonner, K.I., Nicholson, K.S. (1997) Biodiversity and plant litter:
experimental evidence which does not support the view that enhanced species
richness improves ecosystem function. Oikos 79, 247–258.
Wardle, D.A, Bonner, K.I., Barker, G.M. (2002) Linkages between plant litter
decomposition, litter quality, and vegetation responses to herbivores. Funct.
Ecol. 16:585–95.
Wardle, D.A., Nilsson, M.C., Zackrisson, O., Gallet, C. (2003) Determinants of litter
mixing effects in a Swedish boreal forest. Soil Biol Biochem 35(6):827-835
Wardle, D.A., Bardgett, R.d., Klironomos, J.N., Seta, H., van der Putten, W.H., Wall,
D.H. (2004) Ecological linkages between aboveground and belowground biota.
Science 304, 1629–1633
Wassenaar, T., Gerber, P., Verburg, P.H., Rosales, M., Ibrahim, M., Steinfeld, H. (2007)
Projecting land use changes in the Neotropics: the geography of pasture
expansion into forest. Glob Environ Change 17:86–104.
Wedderburn, M.E., Carter, J., 1999. Litter decomposition by four functional tree types
for use in silvopastoral systems. Soil Biology & Biochemistry 31, 455–461.
Westoby, M. (1998) A leaf-height-seed (LHS) plant ecology strategy scheme. Plant and
Soil 199: 213-227.
Westoby, M., Falster, D.S., Moles, A.T., Vesk, P.A; Wright, I.J. (2002) Plant ecological
strategies: some leading dimensions of variation between species. Annual
Review of Ecology and Systematics 33: 125-159
Westoby, M., M Leishman, J Lord (1996) Comparative Ecology of Seed Size and
Dispersal Philosophical Transactions of the Royal Society of London Series B-
Biological Sciences 351: 1345, 1309-1317.

240
Willson, M.F., Irvine, A.K, Walsh, N.G. (1989) Vertebrate Dispersal Syndromes in
some Australian and New Zealand plant communities, with geographic
comparisons. Biotropica 21: 133-147.
Wright, I.J. and Cannon, K. (2001) Relationships between leaf lifespan and structural
defences in a low nutrient, sclerophyll flora. Functional Ecology 15: 351-359.
Wright, I.J. and Westoby, M. (2002) Leaves at low versus high rainfall: coordination of
structure, lifespan and physiology. New Phytologist 155, 403-416.
Wright, I.J. and Westoby, M. (2004) The economics of leaves. Australasian Science 25,
34-38
Wright, I.J., Reich, P.B., Westoby, M., Ackerly, D.D., Baruch, Z.,Bongers, F.,
Cavender-Bares, J., Chapin, T., Cornelissen, J.H.C., Diemer, M., Flexas, J.,
Garnier, E., Groom, P.K., Gulias, J., Hikosaka, K., Lamont, B.B., Lee, T., Lee,
W., Lusk, C., Midgley, J.J., Navas, M.L., Niinemets, U., Oleksyn, J., Osada, N.,
Poorter, H., Poot, P., Prior, L., Pyankov, V.I., Roumet, C., Thomas, S.C.,
Tjoelker, M.G.,Veneklaas, E.J., Villar, R. (2004) The worldwide leaf economics
spectrum. Nature 428: 821-827.
Wright, I.J., Falster, D.S., Pickup, M., Westoby, M. (2006) Cross-species patterns in the
coordination between leaf and stem traits, and their implications for plant
hydraulics. Physiologia Plantarum 127, 445-456.
Wright, I.J., Leishman, M.R., Read, C., Westoby, M. (2006) Gradients of light
availability and leaf traits with leaf age and canopy position in 28 Australian
shrubs and trees. Functional Plant Biology 33, 407-419.
Wright, I.J., Ackerly, D.D., Bongers, F., Harms, K.E., Ibarra-Manriquez, G., Martinez-
Ramos, M., Mazer, S.J., Muller-Landau, H.C., Paz, H., Pitman, N.C.A., Poorter,
L., Silman, M.R., Vriesendorp, C.F., Webb, C.O., Westoby, M., Wright, S.J.
(2007) Relationships among ecologically important dimensions of plant trait
variation in seven Neotropical forests. Annals of Botany 99, 1003-1015
Wright, S.J., Kitajima, K., Kraft, N.J.B., Reich, P.B., Wright, I.J., Bunker, D.E., Condit,
R., Dalling, J.W., Davies, S.J., Díaz, S., Engelbrecht, B.M.J, Harms, K.E.,
Hubbell, S.P., Marks, C.O., Ruiz-Jaen, M.C., Salvador, C.M., Zanne, A.E.
(2010) Functional traits and the growth-mortality tradeoff in tropical trees.
Ecology 91:3664-3674.
Wright, W., Illius, A.W. (1995) A comparative study of the fracture properties of ®ve
grasses. Functional Ecology 9: 269-278.
241
Yang, D.M., LI, G.Y., Sun, S.C. (2009) The effects of leaf size, leaf habit, and leaf form
on leaf/stem relationship in plant twigs of temperate woody species. J. Veg. Sci.
20: 359-366.
Young, A. (1989) Agroforestry for Soil Conservation. CAB International, UK. 276 pp.
Young A. (1997) Agroforestry for Soil Management. 2nd Ed. C.A.B. International.
Wallingford, UK, 320 pp
Zanne, A.E., Lopez-Gonzalez, G., Coomes, D.A., Ilic, J., Jansen, S., Lewis, S.L., Miller,
R. B. (2009) Global wood density database [online]. Website:
http://hdl.handle.net/10255/dryad.235
Zanne, A.E., Chapman, C.A., Kitajima, K. (2005) Evolutionary and ecological
correlates of early seedling morphology in East African trees and shrubs. Am. J.
Bot. 92: 6, 972-978.
Zanne, A.E., Westoby, M., Falster, D.S., Ackerly, D.D., Loarie, S.R., Arnold, S.E.J. and
Coomes, D.A. (2010) Angiosperm Wood Structure: Global Patterns In Vessel
Anatomy And Their Relation To Wood Density And Potential Conductivity.
American Journal of Botany 97(2): 207–215.
Zimmerman, J.K., Pascarella, J. B., Aide, T.M. (2000) Barriers to Forest Regeneration
in an Abandoned Pasture in Puerto Rico. Restoration Ecology Vol. 8 No. 4, pp.
350–360