plant metabolomics and its potential for systems biology research
TRANSCRIPT

Provided for non-commercial research and educational use only. Not for reproduction, distribution or commercial use.
This chapter was originally published in the book Methods in Enzymology, Vol. 500, published by Elsevier, and the attached copy is provided by Elsevier for the author's benefit and for the benefit of the author's institution, for non-commercial research and educational use including without limitation use in instruction at your institution, sending it to specific colleagues who know you, and providing a copy to your institution’s administrator.
All other uses, reproduction and distribution, including without limitation commercial reprints, selling or licensing copies or access, or posting on open internet sites, your personal or institution’s website or repository, are prohibited. For exceptions, permission may be sought for such use through Elsevier's permissions site at:
http://www.elsevier.com/locate/permissionusematerial
From: J. William Allwood, Ric C. H. De Vos, Annick Moing, Catherine Deborde, Alexander Erban, Joachim Kopka, Royston Goodacre, and Robert D. Hall, Plant
Metabolomics and Its Potential for Systems Biology Research: Background Concepts, Technology, and Methodology. In Daniel Jameson, Malkhey Verma, and Hans V.
Westerhoff, editors: Methods in Enzymology, Vol. 500, Burlington: Academic Press, 2011, pp. 299-336.
ISBN: 978-0-12-385118-5 © Copyright 2011 Elsevier Inc.
Academic Press.

Author's personal copy
C H A P T E R S I X T E E N
M
IS
ethods
SN 0
* MaUn
{ PlanWa
{ INRBor
} Max} MaMa
k Cen# Plat
de B
Plant Metabolomics and Its Potential
for Systems Biology Research:
Background Concepts, Technology,
and Methodology
J. William Allwood,* Ric C. H. De Vos,†,k Annick Moing,‡,#
Catherine Deborde,‡,# Alexander Erban,§ Joachim Kopka,§
Royston Goodacre,*,} and Robert D. Hall†,k
Contents
1. A
in
076
nchitedt RgenA,deaPl
nchnchtreeforord
n Introduction to Plant Metabolomics
Enzymology, Volume 500 # 2011
-6879, DOI: 10.1016/B978-0-12-385118-5.00016-5 All rig
ester Interdisciplinary Biocentre, School of Chemistry, University of Manchester,Kingdomesearch International, Wageningen University and Research Centre (Wageni
ingen, The NetherlandsUMR1332 Biologie du Fruit & Pathologie Centre INRA de Bordeaux, INRA—Uux, IBVM, BP 81, Villenave d’Ornon, Franceank Institute of Molecular Plant Physiology, Am Muhlenberg 1, Golm, Germanyester Centre for Integrative Systems Biology, Manchester Interdisciplinary Biocentre, Uester, Manchester, United Kingdomfor BioSystems Genomics, Wageningen, The Netherlandsme Metabolome-Fluxome Bordeaux, Genomique Fonctionnelle Bordeaux, IBVM, Ceaux, BP 81, Villenave d’Ornon, France
Else
hts
Ma
nge
niv
ni
ent
301
1
.1. T he concept 3011
.2. F ields of application 3011
.3. S ampling: From whole plant to single cell 3021
.4. M etabolite profiling technologies 3031
.5. T he “utopia” of a systems level understanding 3042. C
onsiderations in Plant Growth and Preparation of Plant Material 3052
.1. E xperimental design and plant growth 3052
.2. H arvest 3062
.3. S ampling 3072
.4. S ample storage 3083. G
C-TOF/MS Metabolite Profiling, Recommended ExperimentalReference Protocols, and Data Preprocessing Approaches
3093
.1. A n introduction to GC-TOF/MS metabolite profiling 309vier Inc.
reserved.
nchester,
n UR),
ersite de
versity of
re INRA
299

300 J. William Allwood et al.
Author's personal copy
3
.2. G C-TOF/MS plant metabolite profiling: Recommendedexperimental procedures
3103
.3. D ata preprocessing and metabolite classification in plantGC-TOF/MS profiling
3114. H
PLC–PDA–QTOFMS Metabolite Profiling, RecommendedExperimental Reference Protocols, and Data Preprocessing
Approaches
3144
.1. A n introduction to LC–MS metabolite profiling 3144
.2. H PLC-PDA-QTOFMS plant metabolite profiling: Recommendedexperimental procedures
3154
.3. D ata preprocessing of plant LC–MS profiling experiments 3155. 1
H NMR: Experimental Reference Protocols and Data Preprocessingfor Plant Metabolite Profiling
3175
.1. A n introduction to NMR spectroscopy 3175
.2. E xtraction of polar metabolites 3175
.3. C onsiderations and recommendations for spectral acquisition 3216. C
oncluding Remarks 326Ackn
owledgments 327Refe
rences 327Abstract
The “metabolome” comprises the entire complement of small molecules in a
plant or any other organism. It represents the ultimate phenotype of cells,
deduced from the perturbation of gene expression and the modulation of
protein function, as well as environmental cues. Extensive advances over the
past decade, regarding the high-throughput (HTP) nature of “omics” research,
have given birth to the expectation that a type of “systems level” overview may
soon be possible. Having such a global overview of the molecular organization
of a plant in the context of a particular set of genetic or environmental condi-
tions, be it at cell, organ, or whole plant level, would clearly be very powerful.
Currently, we are far from achieving this goal; however, within our hands, plant
metabolomics is an HTP and informative “omics” approach to both sample
generation and data generation, as well as raw data preprocessing, statistical
analysis, and biological interpretation. Within this chapter, we aim to describe
the great attention given to experimental design to ensure that the correct
sample set and control are included and to, thereby, enable reliable statistical
analysis of the data. For as comprehensive metabolite coverage as possible, we
advocate the use of multiparallel approaches; thus, we describe a step-by-step
standardized method for Nuclear magnetic resonance spectroscopy, as well as
discussing with reference to standardized methodologies the techniques of gas
chromatography-time of flight/mass spectrometry, and liquid chromatography–
mass spectrometry.
Plant Metabolomics and Its Potential for Systems Biology Research 301
Author's personal copy
1. An Introduction to Plant Metabolomics
1.1. The concept
Science is facts. Just as houses are made of stones, so is science made of facts:but a pile of stones is not a house and a collection of facts is not necessarilyscience.
Henri Poincare, French philosopher and mathematician
The “metabolome” comprises the entire complement of small moleculesin a plant or any other organism. It represents the ultimate phenotype ofcells, deduced from the perturbation of gene expression and the modulationof protein function. These, in turn, are under the influence of genomemutation and environmental cues (Saito and Matsuda, 2010). The metabo-lome of an individual plant is therefore a highly dynamic component whichhas both temporal (developmental, seasonal, etc.) and spatial (location,cultivation conditions, etc.) constraints (Fiehn, 2002). Furthermore, withinthe individual plant, the metabolome can be further spatially defined asorgans, tissues, and even individual cells that have readily distinguishablemetabolite profiles (Ebert et al., 2010; Schad et al., 2005; Sumner et al.,2011). Plants have been considered as nature’s most prolific biochemists(Hall, 2006) and therefore represent huge, natural, compound librarieswhich have to date been poorly mined and exploited (Fernie, 2007; SaitoandMatsuda, 2010). The vast majority of plant species have never been fullycharacterized biochemically, and further, the great majority of plant com-pounds, which have been detected, have never been structurally identified.The vast richness of this natural resource represents huge potential for futureefforts both in scientific research (allowing a more holistic understanding ofthe complexity of plant metabolism and its control) and in an appliedcontext (e.g., novel drug, flavor, biocidal, compound discovery).
1.2. Fields of application
For all the above reasons, ever since the first scientific publication on plantmetabolomic analysis (Roessner et al., 2000), the field has expanded enor-mously and has opened up into a wide range of contrasting areas ofapplication. Through metabolomics, plant biologists have gained theopportunity to delve deeply into cell biochemistry, and the technologyhas quickly gained a strong foot-hold in research, as shown, for example,by all the chapters in Harrigan and Goodacre (2003), Saito et al. (2006),Weckwerth (2007), and Hall (2011). Early efforts concentrated on a few“model” species (e.g., Arabidopsis, tomato, and potato); however,
302 J. William Allwood et al.
Author's personal copy
approaches have subsequently been applied to many species, both cultivatedand wild, to answer considerably diverse biological questions of scientificand industrial relevant nature. Extensive use of metabolomics approacheshas been made to enhance our understanding of the broad influences onplant metabolism due to, for example, mutations (Bino et al., 2005;Yonekura-Sakakibara et al., 2008), environmental perturbation (Ahujaet al., 2010; Allwood et al., 2006, 2008, 2010; Choi et al., 2006; Jansenet al., 2008; Kaplan et al., 2004; Sanchez et al., 2008, 2010; van Dam and vander Meijden, 2011; Ward et al., 2010a), genetic introgression (Fernie andSchauer, 2009; Keurentjes et al., 2006; Schauer et al., 2006), and organdevelopment (Tikunov et al., 2010) to name but a few. Many previousinvestigations have focused on the primary metabolites where the pathwaysare generally well known, and the genetic background is also well docu-mented (Fernie and Schauer, 2009; Giavalisco et al., 2009; Schauer et al.,2005). Further, authentic standards are generally available thus entailingboth definitive identification and full quantification. However, extensiveinvestigations have also been initiated on the highly diverse and much lesswell characterized secondary metabolite pathways. Such pathways are oftenbiologically significant in that they are associated with, for example, abioticor biotic stress resistance and other environment and organism interactions,food quality traits, such as taste and fragrance, or biocidal/pharmaceuticalactivity. Advances have been made particularly in the areas of polyphenolics(Bovy et al., 2010; Tikunov et al., 2010), alkaloids (Kim et al., 2010),brassinosteroid and glucosinolate (Hall et al., 2010) research. For an extensiveoverview of novel developments, the reader is referred to recent volumessuch as Saito et al. (2006), Baginsky and Fernie (2007), and Hall (2011).
1.3. Sampling: From whole plant to single cell
Key to any metabolomics experiment is the experimental design in order toensure that the correct sample set and control are included and thus toenable reliable statistical analysis of the data. As with all “omics”-typeapproaches, it is recommended to seek advice from an experienced statisti-cian at the earliest possible stage. Full account must be taken of the keystatistical challenge which is that the number of metabolite features gener-ally exceeds the number of samples. This entails that correct experimentaldesign and sampling regimes in terms of numbers of repetitions, treatments,time intervals, control samples, etc. are essential. Plant metabolomicsexperiments are generally performed at the organ level (developing fruit,whole leaf, root etc.), and it is often recommended to have pooled samplesper replicate to reduce the level of biological variation. Strict control of thepreharvest conditions (both cultivation conditions and harvesting regime—time of day, location on the plant, time from harvesting to metabolicquenching, etc.) is essential for sample uniformity (Beale and Ward, 2011;

Plant Metabolomics and Its Potential for Systems Biology Research 303
Author's personal copy
Biais et al., 2011; Gibon and Rolin, 2011). Taking materials from the fieldor wild, as required for environmental metabolomic studies, where little orno control of sample prehistory is possible, entails that even greater accountmust be taken of biological variation. Recently, improvements in instru-ment sensitivity and opportunities, for example, laser dissection microscopyand microinjection/microextraction, have generated opportunities toreduce sample size (Ebert et al., 2010; Moco et al., 2009; Schad et al.,2005; Sumner et al., 2011). Single cell metabolomic imaging has alsobecome possible, for example, extracellular leaf trichomes (Sumner et al.,2011). Whereas pools of identical cell types should become accessible tometabolomic studies, true single cell metabolomics may still be far off. Usingwhole organs entails that even known, significant differences in tissuebiochemistry have to be ignored due to sampling limitations. Therefore,we typically obtain only a global overview of metabolism which takes littleaccount of the intercellular differences which are often of great biologicalrelevance (e.g., see Moco et al., 2007a).
1.4. Metabolite profiling technologies
Any sufficiently advanced technology is indistinguishable from magic.
Arthur C. Clarke, physicist and science fiction author
The measurement of plant metabolites is difficult (Fernie, 2007), andthe challenges faced in analysis of plant material are clear from the outset.The structural diversity and the associated contrasting physicochemicalproperties of many common plant metabolites (e.g., monoterpenoid vola-tiles, polar amino acids, or hydrophobic lipids; cf. Fernie, 2007; Saito andMatsuda, 2010) are a potential analytical nightmare. The large variation inrelative abundance (up to 6 orders of magnitude concentration difference,i.e., “dynamic range”) has the inevitable consequence that no single extrac-tion/separation/detection methodology will even come close to suffice ourneeds. Common approaches have arisen for both separation (liquid chro-matography and gas chromatography, as well as capillary electrophoresis;Kopka, 2006; Sumner, 2006; Timischl et al., 2008) and detection (nuclearmagnetic resonance (NMR) and mass spectrometry; Allwood andGoodacre, 2010; Verhoeven et al., 2006; Ward and Beale, 2006) beingthe most routinely applied. Many efforts have focused on method standar-dization to produce comparable data between different instruments andlaboratories (Allwood et al., 2009; De Vos et al., 2007; Lisec et al., 2006;Ward et al., 2010b). To gain as comprehensive coverage as possible requiresmultiparallel complementary approaches, combining appropriate extrac-tion, separation, and detection technologies. The Holy Grail of truly holistic

304 J. William Allwood et al.
Author's personal copy
coverage will likely never be possible or indeed even, affordable, despitethe increasing technological sophistication. These purely practical andeconomic reasons introduce a degree of bias into the generation of results.However, educated choices for suitable technology combinations and com-bined hyphenated approaches have already been widely reported (see Hall,2011; Hardy and Hall, 2011; Saito et al., 2006; Weckwerth, 2007).Complementary approaches require increasingly sophisticated proceduresfor the handling of multiplexed datasets, data merging, and efficient androbust integrative data mining strategies (Fiehn et al., 2011; Goodacre et al.,2004; Kopka et al., 2011; Redestig et al., 2011).
1.5. The “utopia” of a systems level understanding
Nothing shocks me – I’m a scientist.
Indiana Jones, fictitious Professor of Archaeology, and adventurer
The recent trends and extensive advances regarding the HTP nature of“omics” research have given birth to the expectation that a type of “systemslevel” overview may soon be possible (see Baginsky and Fernie, 2007).Having such a global overview of the molecular organization of a plant inthe context of a particular set of genetic or environmental conditions, be itat cell, organ, or whole plant level would clearly be very powerful. How-ever, we are far from achieving this goal, although taking steps toward itshould be loudly applauded. Current “omics” methodologies are alreadyproviding the most detailed insights ever into how genomes are organizedand how plants function at the molecular level. There are clear opportu-nities to exploit Arabidopsis as a model organism (Beale and Sussman,2010), and simpler systems such as suspension cell cultures (Allwood et al.,2010; Farag et al., 2008) offer certain advantages regarding rapidity anduniformity of experimentation, isotopic labeling, and flux analyses (Huegeet al., 2007; Sulpice et al., 2010). However, individual technological limita-tions, as detailed above, for example, for metabolomics, when piled up in amulti-omics manner, still represent a significant bottleneck to designing atruly holistic, systems level approach. Further, for whole plants, parallelplatforms for HTP (nonmolecular) phenotyping are also still in their infancy(Keurentjes, 2009). These remaining challenges are by no means facile—only the future will reveal how far and fast we can proceed to overcomethese hurdles. Nevertheless, large steps are already being made, and ourambition to develop appropriate methodologies and procedures to combinediverse datasets from multidisciplinary approaches will help enhance andfinally establish systems biology fully within the field of plant science. In thefollowing sections, an overview is given on considerations in plant growth,

Plant Metabolomics and Its Potential for Systems Biology Research 305
Author's personal copy
harvest, and preparation of material, and the current standardized meth-odologies being used across our laboratories for GC-TOF/MS andHPLC–PDA–MS will be discussed with reference to published standar-dized methodologies, a previously unpublished reference protocol for 1HNMR will also be presented. Of course, robust statistical analysis with anarray of multivariate and univariate statistical tools is essential for miningthe key information from the vast amounts of data that are generatedby metabolomics platforms. Further metabolite identification at later exper-imental stages is also of key importance and introduces yet further analyticalplatforms such as FT-ICR–MS (Allwood et al., 2011), Orbitrap MS (Dunnet al., 2008; van der Hooft et al., 2011), and HPLC–NMR (Glauser et al.,2008). To present methodologies for complex metabolite identificationtechnologies and statistical analyses is beyond the scope of this chapter, andin the case of plant metabolomics, the selection of appropriate tools for bothstatistical analyses and in-depth metabolite identification is very muchdependent upon the experiment and biochemistry (Kopka et al., 2011).
2. Considerations in Plant Growth and
Preparation of Plant Material
Plant science experiments generally involve the variation of at leastone genetic or environmental factor in order to induce responses which willprovide information for knowledge generation. In order to decrease theexperimental error for all the steps preceding that of biochemical analysis,the experiment has to be designed and planned from plant growth to organharvest, sample constitution, and distribution to the chemical analyst(s).
2.1. Experimental design and plant growth
A plant metabolomics study is usually characterized by several hundreds(even thousands) of metabolites or metabolite features that by far exceedthe sample number, increasing false discovery risks. In order to decrease theexperimental error, it is crucial to identify the major sources of error atthe environmental, biological, and technical levels, for each step from plantgrowth to sample storage and distribution. This will help to optimizethe “experimental design,” that is, the procedure planning each step ofthe experiment in order to obtain data describing the relationships betweenthe factor(s) and variables affecting the process of interest and its conse-quences (Anderson and Whitcomb, 2007). This can be facilitated byperforming limited preliminary experiments before planning full-scaleexperiments. Then, for plant growth, a design has to be chosen (Andersonand Whitcomb, 2007; Hinkelmann and Kempthorne, 2008; Rocke, 2004)
306 J. William Allwood et al.
Author's personal copy
such as factorial design or optimal design, blocking, or randomization, withlabeling of individual plants and possibly organs per plant. Beyond recordingminimum information about plant growth conditions as advised in themetabolomics standard initiative (Fiehn et al., 2007, 2008), managementof the environment during culture and recording the changes of some majorenvironmental variables (e.g., fertilization, temperature, and/or light) arecrucial. This is the case even in controlled environments such as green-houses or growth chambers, as small variations (e.g., location and seasonalvariations in greenhouse or limited malfunctioning of growth chambercontrol) can cause changes in the biochemical status. In the field, recordingof daily minimum and maximum temperatures, rainfall, insulation duration,and irrigation dates and recording of chemical compounds and treatmentdates for pathogen/pest control may be valuable. Plant growth metadatadocumentation and storage in databases is crucial not only for the ongoingexperiment but also for the data reanalysis and the possibility to perform datameta-analyses combining several experiments (Hannemann et al., 2009).Therefore, the format of the metadata concerning plant growth shouldallow easy recording and sharing. Replication of biological samples isindispensable, and should be preferred to extraction and analytical replica-tion, if all are not feasible due to high analytical cost (for further statisticalanalysis of the metabolic profiles using univariate or multivariate methods,see Broadhurst and Kell, 2006; Goodacre et al., 2007; Kopka et al., 2011;Trygg et al., 2006). A compromise has to be made between sample numberand throughput. The number and constitution of biological replicates has tobe defined in the experimental design. Replication is crucial to incorporateand measure biological variations and also provides a sample set representa-tive of the population of plants, organs, or tissues.
2.2. Harvest
For harvest, the plant or organ age or developmental stage, time withreference to the light period, and duration of harvest and sample processingconstitute a potential source of uncontrolled variability if their proceduresare not carefully standardized. This is especially important when the harvestsessions of a given experiment are numerous or when each session requestsseveral operators to limit its duration. The age, or preferably the develop-mental stage, of the plants or their organs needs to be defined relative tostandardized growth conditions and/or phenology descriptors, by usingdedicated ontology’s (e.g., Plant Ontology at http://www.plantontology.org/ for phenology) or reference articles (e.g., Boyes et al., 2001,for Arabidopsis, or Brukhin et al., 2003, for tomato) when available.For seedlings in controlled conditions, hours or days postimbibitionmay be used. For fruits, in cases of controlled pollination and growthunder the same temperature conditions, harvest is usually expressed as

Plant Metabolomics and Its Potential for Systems Biology Research 307
Author's personal copy
days-post-anthesis but degree-days post-anthesis can also be used(Bonhomme, 2000). If the age of the organ is unknown, well-definedcriteria, such as organ aspect, color (e.g., a color code with a standardscale for fruit maturation of a given species), and size, will improve samplehomogeneity. Even for a given organ with clearly defined developmentstage(s), the time and method of sampling must be precise (Fiehn et al.,2007). As the metabolite composition of the leaf (Gibon et al., 2006; Kimand Verpoorte, 2010; Urbanczyk-Wochniak et al., 2005) and also fruit(Klages et al., 2001; Ma and Cheng, 2003) has been shown to vary duringa day and night cycle, the time of harvest has to be precisely defined and itsduration limited. The position of the organ has to be defined (e.g., fruitposition in a cluster or sun vs. shade exposition), as it may also have animpact on its composition (Gautier et al., 2005; Ma and Cheng, 2003;Nothmann and Rylski, 1983; Pereira et al., 2005, 2006). For harvest in anopen field, similar weather conditions for each harvest are recommended.The harvested organs should be handled with care and stored in adaptedpackaging whilst preventing shocks and oxygen limitation. Enzyme activ-ities need to be quenched (AP Rees and Hill, 1994) which is ideallyachieved by freeze clamping or immediately plunging small organs (e.g.,leaves, flowers, or small fruits) or dissected tissues into liquid nitrogen. Forlarger organs, transportation has to be performed quickly with precautions(avoiding temperature fluctuation or hygrometry stresses), and their proces-sing has to then be undertaken immediately after harvest. To ensure repre-sentativeness of the physiological variations of the organ of interest, it isrecommended to harvest several organs of each variety in a given conditionto constitute a sample set. For instance, for cherry tomato, 18 fruits from 9plants were pooled to make a representative fruit sample in a study onvolatiles (Tikunov et al., 2005). For Arabidopsis, harvest of 15 plant rosettesto constitute 5 samples of 3 rosettes at each time point was carried out in astudy of diurnal changes of primary metabolism (Gibon et al., 2006). Several(at least three, or better, at least five) sample sets of each variety have to beindependently prepared. Pooling of plants or organs that will average thevariability arising from uncontrolled factors is especially interesting whenthe cost of sample preparation is low but that of biochemical analysis is high.
2.3. Sampling
Sampling should provide samples in a form and quantity suitable for metabo-lomic analyses and representative of the total population of plants or organs tobe analyzed. Special care must be taken if the plant material is intrinsicallyheterogeneous (e.g., an organ such as a flower or a fruitmade of several tissues).Contamination, loss, metabolism, and any other alteration of the sample haveto be minimized (Markert, 1995;Wagner, 1995). Plant organs may have to becleaned (Markert, 1995), but usually for plant metabolomics studies, sterile

308 J. William Allwood et al.
Author's personal copy
conditions are not required.When a specific tissue needs to be dissected beforefreezing, as the sample must be representative of the entire tissue in the organ,material must be taken from several parts of the organ, which should bedefined. As the use of knives and scalpels causes wound stresses affecting themetabolism, working as fast as possible is recommended. Ideally, surfaces thatare exposed after cutting should be minimized, while volume should allowrapid freezing of the organ pieces as indicated above. Microdissection requiresspecific devices and procedures (Balestrini and Bonfante, 2008; Ebert et al.,2010). After complete freezing in liquid nitrogen, the pieces can be groundimmediately, or transferred into tagged plastic bags and stored at�80 �C untilgrinding is possible, before distribution into tubes and storage at�80 �C. It isrecommended that all samples for a given experiment follow exactly the sameprocedure before, during, and after grinding. Sample grinding is usuallyrequired to optimize solvent extraction and also helps to homogenize thesample material (Markert, 1995); however, possible contamination or volatili-zation of certain compounds of interest (Markert, 1995) has to be minimized.For metabolomics, samples are usually ground frozen despite the possiblemodification of the volatile composition upon freezing as shown for straw-berry (Douillard andGuichard, 1990). ForHTPmetabolomics studies, robot-ized automation of grinding has to be considered. Labeling and traceability ofsamples is crucial in quality assurance and quality control (QC) throughout thesample preparation process, from the field to the sample storage location andthrough distribution to chemical analysts. At each step (harvest, constitution ofbiological replicates, storage, and distribution of samples), the samples shouldbe clearly identified (possibly by barcoding) and referenced in a file, or better adatabase, with a unique identifier.
2.4. Sample storage
All samples of an experiment should follow the same storage conditions. Theconditions and duration of sample storage have to be controlled and recorded.Studies on the effect of long-term storage of plant samples on their metabolitesremain rare (Phillips et al., 2005; Ryan and Robards, 2006). Therefore, whenworking on several families of compounds using a combination of extractionsand analytical methods, it would be helpful to propose a few compounds as“markers” of good storage conditions and duration. Samples can be stored asorgan, tissue pieces, or ground tissue(s) at�80 �C, although solid phase microextraction trapping of volatile compounds (Tholl et al., 2006) can be per-formed upon entire organs when small or tissue pieces. Depending on theintended analyses, tissue samples can be stored as fresh-frozen or lyophilizedsamples. Fresh-frozen samples are necessary for analytical determination ofhighly volatile compounds as freeze-drying will result in a loss of volatiles( Julkunen-Titto and Tahvanaiem, 1989; Keinanen and Julkunen-Titto,1996). It must also be carefully considered that freeze-drying can also cause a

Plant Metabolomics and Its Potential for Systems Biology Research 309
Author's personal copy
loss of some metabolites through irreversible binding to cell walls or mem-branes, although positively it protects against enzyme activities and microbialdecomposition during storage (Dunn et al., 2005a). Storage conditions have tobe controlled, as stability during sample storage is an important factor that israrely measured. The time in frozen storage was shown to modify somearomatic components in fruit (Ma et al., 2007). Usually, samples for metabo-lomics are stored at �80 �C. It is recommended that lyophilized samples arestored at �20 �C (Salminem, 2003) and in dry conditions (e.g., in tubesenclosed in sealed plastic bags containing a desiccant such as silica gel). Forspecific purposes, tissue samples and extracts may have to be stored in tubesflushed with nitrogen or argon gas to protect them against oxidation (Erbanet al., 2007). For sample transport to the analytical laboratory, rapid transportof samples using an ice-chest, a Dewar, and liquid nitrogen is recommended. Ifshipment is necessary, dry ice is recommended for fresh-frozen samples. Iflyophilized samples are shipped to the analytical laboratory, dry conditionsneed to be ensured. During storage or after shipment, sample quality has to beverified using at least visual inspection or ideally physicochemical analyses ortargeted biochemical analyses performed at different time points (Fish andDavis, 2003; Phillips et al., 2005).More detailed information and guidelines forexperimental design and sampling for plantmetabolomics are provided in Biaiset al. (2011), Gibon and Rolin (2011), and Kim and Verpoorte (2010).
3. GC-TOF/MS Metabolite Profiling,
Recommended Experimental Reference
Protocols, and Data Preprocessing
Approaches
3.1. An introduction to GC-TOF/MS metabolite profiling
Since early studies on herbicide modes of action (Sauter et al., 1988), GC–MS has experienced a renaissance in HTP fingerprinting and profiling ofgenetically modified (e.g., Fernie et al., 2004; Roessner et al., 2001a,b) orexperimentally challenged plant samples (e.g., Cook et al., 2004; Kaplanet al., 2004; Urbanczyk-Wochniak and Fernie, 2005), and the spatial analy-sis of individual plant organs (Biais et al., 2009, 2010), of tissues (Schad et al.,2005), and even of individual cell types (Ebert et al., 2010). Metabolicphenotyping via GC–MS profiling has become an integral part of plantfunctional genomics (Fernie et al., 2004; Fiehn et al., 2000a; Roessner et al.,2002) and is on the verge of becoming a routine technology with thepotential to generate comparable data between laboratories (Allwoodet al., 2009). This fact substantially contributes to the development ofmetabolomics as a fourth Rosetta stone for plant functional genomics andmolecular physiology (Fiehn et al., 2000a; Trethewey, 2004; Trethewey

310 J. William Allwood et al.
Author's personal copy
et al., 1999). Metabolite profiling with GC–MS involves six general steps: (i)extraction of metabolites, which should be as comprehensive as possible,while avoiding degradation or modification of metabolites (e.g., Kopkaet al., 2004). (ii) Derivatization of metabolites making them amenable toGC. (iii) GC separation. High-resolution GC and also 2D GC � GC canbe highly reproducible as it involves automated sample injection robotics,highly standardized conditions of gas flow, temperature programming,and standardized capillary column material. (iv) Ionization of compounds.Electron impact (EI) is most widely used, as it has low susceptibility tosuppression effects and produces reproducible fragmentation. (v) Timeresolved detection of molecular and fragment ions. Mass separation anddetection preferably by TOF detectors that can be tuned to fast scanningrates. (VI) Acquisition and evaluation of GC–MS data files.
3.2. GC-TOF/MS plant metabolite profiling: Recommendedexperimental procedures
The essence of metabolite profiling is discovery of novel marker metabolitesand determination of relative changes of metabolite pool sizes in compari-son to reference samples (Bino et al., 2004; Fernie et al., 2004). Currentsystems biology approaches add further demands for multiparallel absolutequantification of pool sizes. Both absolute and relative quantificationnecessitate thorough control experiments, monitoring of GC–MS systemperformance and contaminations. QC samples are of key importance, andthese are best prepared by pooling equal volumes of material from all of thebiological samples to be analyzed. Alternatively, with long-standing experi-ence, a chemically defined mixture of authenticated reference compounds(e.g., Strehmel et al., 2008) that mimics the metabolic composition of theinvestigated biological material can be employed. Both the synthetic mix-tures and biological QC samples are then subjected to the same sampleextraction, instrumental analyses (ideally distributed across the analyticalrun), and data processing, thus providing quality checks for technical andanalytical error, and quantitative calibration for the final processed data.The perhaps most widely applied extraction protocol for GC–MS plantprofiling involves a fractionation of nonpolar (chloroform fraction) andpolar metabolites (water–methanol fraction comprising largely primarymetabolites, e.g., sugars, alcohols, organic acids, amino acids, amines)(e.g., Erban et al., 2007; Lisec et al., 2006; Roessner et al., 2000). Thismethod focused on primary metabolism is highly recommended by theauthors and available as full reference protocols within Lisec et al. (2006) andErban et al. (2007), an overview is also provided (Fig. 16.1). GC–MSdetection of polar, nonvolatile metabolites demands a two-step derivatiza-tion by methoxyamination and silylation (Fiehn et al., 2000a,b; Roessneret al., 2000, 2001a). The imprecise dispensing of reagent volumes and the

GC-TOF/MS
In-line derivatization
(1) To 60mg plant material, 360mL 100% methanol, 30mL polar IS mix, and 30mL non-polar IS are added and vortexed
(2) Samplesshaken at70 °C for15minwith athermalmixer(950 rpm)
(3) Add 200mL of chloroform and vortex
(4) Add400mLof waterandvortex
(5)Centrifuge5min at22,000 � g
(6) 10mL of polar upper phase sampled to a crimp cap-tapered vial
(7) Dry theextract in avacuumconcentratorfor 2 h, sealsamples underargon ornitrogen, andstore at -80 °C
(8) Dry theextract in avacuumconcentratorfor 30min afterremoval from-80 °C storage
(9) Add 10mLmethoxyaminhydrochlorideand heat at40 °C withagitation for90min
(11) 1mL splitlessinjection
(10) Add 17.5mL MSTFAand 2.5mL n-alkane retention time standard mixture and heatat 40 °C with agitation for 45min
Figure 16.1 Preparation of polar plant extracts and chemical derivatization for GC-TOF/MS analysis. An illustration of the plant polar metabolite extraction scheme andin-line derivatization (gray box) as presented in the reference protocol of Erban et al.(2007).
Plant Metabolomics and Its Potential for Systems Biology Research 311
Author's personal copy
variable timing of the silylation reaction are major sources of analyticalvariability. Typically, 50–100 samples are processed, and thus, the exposuretime to the silylation reagent between the first and the last analyzed samplecan differ considerably. We therefore recommend employing automatedand timed in-line derivatization and sample injection as fully detailed in thereference protocol of Erban et al. (2007). Our recommended approach toGC-TOF/MS metabolite profiling demands that standardized consumablesand parameters be applied to each of the autosampler and GC, as well asTOF/MS settings for mass ion detection, all of which are fully detailed inthe reference protocol of Erban et al. (2007). Example chromatogramsproduced via this reference protocol are given (Fig. 16.2).
3.3. Data preprocessing and metabolite classification in plantGC-TOF/MS profiling
Automated data processing tools are required to (i) generate numericalsample/metabolite or sample/chemical feature matrices for statistical cal-culations and (ii) need to provide means of linking such chemical features

600,000
A
B
500,000
400,000
300,000
200,000
100,000
600 800 1000 1200
87+85+217+361+73
Masses: 85+87+217+361+73
0.2
0.40.6
0.8
16001400 1800 2000 2200Time (s)
370870
13701870
Figure 16.2 An example GC chromatogram for a polar extract of red wine. (A)Although a method is not presented for GC � GC-TOF/MS analyses, an exampleof a GC � GC chromatogram (B) is given for the same derivate sample; this illustratesthe complexity of metabolites that can be resolved by GC x GC compared to conven-tional GC.
312 J. William Allwood et al.
Author's personal copy

Plant Metabolomics and Its Potential for Systems Biology Research 313
Author's personal copy
to a metabolite identity. In GC–MS profiling studies, retention indicesand mass spectra are used for this purpose (Wagner et al., 2003). Toolswhich enable mass spectral deconvolution and retention index calculationfor compound recognition, and peak height or peak area retrieval forrelative or absolute quantification, plus last but not least the analysis ofmass isotopomer distributions for stable isotope tracing and flux studieshave been developed; refer for example to the motivation of the TagFin-der software development (Luedemann et al., 2008). Different datapreprocessing approaches have been implemented in academia. One gen-eral approach first applies mass spectral deconvolution and subsequentlyquantifies based on deconvoluted (mass fragment) abundances; care mustbe taken to avoid deconvolution errors (Dunn et al., 2005b). An alterna-tive approach first retrieves peak height or peak areas of all recorded masstraces for statistical analysis prior to metabolite identification. Standardizeddata preprocessing procedures have been described earlier, for example,MetAlign (Lommen, 2009; Lommen et al., 2010) and TagFinder(Luedemann et al., 2008, 2011). A recent study explored seven alternativemodes of data preprocessing and established high agreement of all alterna-tive preprocessing modes (Allwood et al., 2009). Both of the abovementioned approaches to GC–MS data preprocessing are indeed valid,and the selection of the most appropriate is experimentally dependent. Ifthe objective is a long-term metabolomic profiling study, then it is indeedbest to attempt to identify all metabolite features requiring use of full dataset deconvolution through either AMDIS (Lisec et al., 2006) or LECOChromaTOF (Begley et al., 2009). However, if the experiment involves ametabolite fingerprinting approach where the investigator only wishes toidentify statistically significant metabolite differences between experimen-tal groups, for example, in gene function analyses, then a more rapidapproach would involve use of generic software such as TagFinder(Luedemann et al., 2008, 2011) or MetAlign (Lommen, 2009; Lommenet al., 2010). The current more urgent challenge may be seen in solvingthe automated and exact identification of metabolites within complexmixtures. Even today, matching and classification of mass spectra ormass spectral tags (MSTs) requires human evaluation and judgment.Many software tools exist, which either support MST recognition incomparison to reference libraries such as NIST or freely available librariessuch as the GMD (Golm Metabolome Database: Kopka et al., 2005) or aidthe interpretation of unknown mass spectral features that in the absence ofauthenticated reference compounds cannot be linked to a compoundstructure (e.g., Hummel et al., 2010). However, for unambiguous identi-fication, a laboratory performing routine metabolic profiling shouldestablish an in-house library of pure authenticated reference standardsanalyzed after subjection to the same derivatization and analytical para-meters as the profiled samples.

314 J. William Allwood et al.
Author's personal copy
4. HPLC–PDA–QTOFMS Metabolite Profiling,
Recommended Experimental Reference
Protocols, and Data Preprocessing
Approaches
4.1. An introduction to LC–MS metabolite profiling
HPLC coupled to MS (in short LC–MS) is the preferred method for meta-bolic profiling of semi-polar secondary metabolites such as phenolic acids,flavonoids, alkaloids, polyamines, saponins, and glucosinolates. These com-pounds can be effectively extracted with aqueous alcohol solutions anddirectly analyzed without prior derivatization. In contrast to EI applied inGC-TOF/MS, ionization in the liquid phase of LC–MS typically involvessoft ionization techniques, such as electrospray ionization (ESI) or atmo-spheric pressure chemical ionization, resulting in protonated (in positivemode) or deprotonated (in negative mode) molecular ions. Modern high-resolution instruments with exact mass detection, such as TOF/MS, ioncyclotron FT-MS, or Orbitrap FT-MS, nowadays enable the profiling ofhundreds to thousands of compounds in crude plant extracts, combined withelemental formulae calculations of the detected masses (Allwood andGoodacre, 2010). Using an essentially unbiased procedure that takes intoaccount all metabolite mass signals from the LC–MS raw data files, detailedinformation on the relative abundance of hundreds of both known and, asyet, unknown semi-polar metabolites can be obtained (de Vos et al., 2007;von Roepenack-Lahaye et al., 2004). LC–MS-based metabolomicsapproaches frequently make use of C18-based reversed phase columns toobtain optimal separation of the large variety of semi-polar compounds thatcan be present in crude plant extracts (de Rijke et al., 2003; de Vos et al., 2007;Hanhineva et al., 2008; Huhman and Sumner, 2002; Iijima et al., 2008; Mocoet al., 2006; Stobiecki et al., 2006; von Roepenack-Lahaye et al., 2004).However, by choosing dedicated columns, a range of primary metabolitesincluding several polar organic acids and amino acids can also be reliablyanalyzed using LC–MS (Tolstikov and Fiehn, 2002). Many semi-polar meta-bolites present in plant materials, such as glucosinolates, (poly)phenols, and arange of other glycosylated compounds, can be readily detected by LC–MS inESI-negative mode. However, plant metabolites that easily form protonadducts, for example, polyamines, alkaloids, and anthocyanins, can be betterdetected in positive mode. Thus, LC–MS analysis of samples in both positiveand negative ionization mode will provide the most comprehensive insightinto the plant metabolic composition (Fait et al., 2008; Hanhineva et al., 2008;von Roepenack-Lahaye et al., 2004). This approach has proven valuablefor the profiling of secondary metabolites in many plant species includingArabidopsis, cabbage, tomato, potato, strawberry, apple, lettuce, etc. (de Vos

Plant Metabolomics and Its Potential for Systems Biology Research 315
Author's personal copy
et al., 2007; Keurentjes et al., 2006; Moco et al., 2006; Vorst et al., 2005) aswell as different plant tissues (Adato et al., 2009; Moco et al., 2007a) and plantproducts (Capanoglu et al., 2008).
4.2. HPLC-PDA-QTOFMS plant metabolite profiling:Recommended experimental procedures
As for GC-TOF/MS metabolic profiling, for LC–MS analysis, QC samplesshould be employed to monitor technical and analytical performance, andquality assurance checks upon the preprocessed data during statistical analy-sis. For LC–MS extraction and analysis, we recommend the referenceprotocols fully detailed within de Vos et al. (2007). The extraction typicallyuses 500 mg fresh weight and 1.5 mL of extraction solvent (99.875%MeOH þ 0.125% formic acid, FA), that is, a volume:fresh weight ratioof 3:1, which will result in a final concentration of 75%MeOH þ 0.1% FA,assuming 95% water content of plant material. The mixture is sonicated for15 min prior to centrifugation, and the supernatant is filtered through 0.45or 0.22 mm PTFE filters and directly analyzed (De Vos et al., 2007).Detection sensitivity and mass spectra obtained by soft ionization LC–MSare highly dependent on the type of mass spectrometer, ionization sourceand mode, and chromatographic system used. The recommended LC–MSprotocol is based on a Waters Alliance 2795 HT HPLC with a 2996 PDAdetector and a QTOF MS Ultima detector with an ESI lock spray (0.1 mg/mL leucine enkephaline) for online mass correction (De Vos et al., 2007;Moco et al., 2006). The LC–MS instrumentation is operated precisely asdescribed within the protocol of De Vos et al. (2007). Although it is possibleto attain a global profile in a single ionization mode, it is highly recom-mended to perform analysis across both polarities due to preferential ioni-zation of different compound classes in the two ionization modes. Theprotocol applies relatively long chromatographic runs of 1 h per a sample.A typical chromatogram obtained by this LC–QTOF MS protocol is givenin Fig. 16.3. After adequate modification of the protocol according toinstrument-specific settings and analysis conditions, it is also applicable toUltra (U)HPLC (permitting shorter sample run times) and alternative MSplatforms, such as LC-Orbitrap FT-MS and LC–QTOF MS Premier.
4.3. Data preprocessing of plant LC–MS profiling experiments
MetAlign is one of the free software packages available for untargetedprocessing of LC–MS, and GC–MS, raw data files from various instrumentvendors (download at www.metalign.wur.nl). It performs local baselinecorrection, unbiased peak picking, and mass peak alignment for up tohundreds of samples, resulting in a matrix of mass signal intensities �samples (Lommen, 2009). It is specifically suitable for MS instruments

Time2.00 4.00 6.00 8.00 10.00 12.00 14.00 16.00 18.00 20.00 22.00 24.00 26.00 28.00 30.00 32.00 34.00 36.00 38.00 40.00 42.00 44.00 46.00 48.00 50.00
%
0
100
M15366 1: TOF MS ES-BPI2.59e4
26.131314.5717
24.27609.1319
22.21741.1786
2.84292.9218
3.29191.0176
12.79443.1943
18.46381.1781
42.75271.0437
28.451152.5332
32.731078.5317
39.28677.148734.39
693.2750
43.561455.6295
Figure 16.3 LC-QTOFMS chromatogram (base-peak intensity) of an aqueous-meth-anol extract from peel of ripe tomato fruit numbers at peaks indicate retention time andaccurate mass on top of peak. Typically, thousands of mass signals representinghundreds of metabolites, both known and unknown compounds, are detected in sucha tomato sample, depending upon variety, tissue, and developmental stage (Iijima et al.,2008; Moco et al., 2006).
316 J. William Allwood et al.
Author's personal copy
with a limited dynamic range in mass accuracy, such as the describedQTOF Ultima, as it provides the option to select an intensity windowfor accurate mass calculation. Postprocessing, the data of the QC samplescan be used to check for consistent peak picking and alignment. Typically,about 70–80% of all peaks should be present in all QC samples with anoverall intensity variation of less than 20% and a mass deviation of less than3 ppm for known compounds. The generated peak table can be furtherfiltered for inconsistent and low (noisy) or saturated signals. Mass signalsderived from the same metabolite can be grouped according to theircorresponding retention time and relative intensities across the samples,for example, by using a mass spectra reconstruction approach (Tikunovet al., 2005, 2010). In this approach, the LC–MS signals originating fromthe same metabolite (molecular ion and its fragments, adducts, and isotopes)are all clustered and replaced by a single representative metabolite signal.Assignment of metabolites can be performed by matching the exact mass ofthe observed molecular ion with plant accurate mass databases, for example,MotoDB (http://appliedbioinformatics.wur.nl/moto/), KNapSAck(http://kanaya.naist.jp/knapsack_jsp/top.html), and Massbank (http://www.massbank.jp/index.html). Data-dependent tandem-MS/MS andMSn fragmentation experiments may be performed to further identify thesignificant secondary metabolites (de Vos et al., 2007; Moco et al., 2007b;Muth et al., 2008; van der Hooft et al., 2011).
Plant Metabolomics and Its Potential for Systems Biology Research 317
Author's personal copy
5.1H NMR: Experimental Reference Protocols
and Data Preprocessing for Plant Metabolite
Profiling
5.1. An introduction to NMR spectroscopy
Despite NMR spectroscopy having been one of the leading technologiesin metabolomics since 2000 (Ludwig and Viant, 2010), this technique isunderused in plant compared to mammalian metabolomics. NMR canbe mono- or multidimensional. Until recently, largely, 1D 1H NMR hasbeen applied in metabolomics, but use of HSQC (heteronuclear single-quantum coherence spectroscopy) and 2D JRES (2D 1H 1J-resolved)spectroscopy are powerful and often essential tools for metabolite iden-tification. The success of 1D 1H NMR in metabolomics stems fromrapid spectral acquisition and the possibility to achieve relative or abso-lute quantification. In addition, NMR provides detailed molecular struc-tural information, and the sample is not destroyed during the NMRmeasurement. Detailed technical issues involved in the NMR methodsare beyond the scope of this chapter, and hence it is recommended toconsult previous publications for comprehensive descriptions of NMRtechnology (Ross et al., 2007) and applications in plant biochemistry(Eisenreich and Bacher, 2007).
5.2. Extraction of polar metabolites
Plant sample preparation for NMR typically consists of multiple steps.Samples are always analyzed immediately after extraction, and themethod of extraction has a crucial bearing on the proceeding detectionof metabolites. In contrast to tissues, sap or fruit juice sample preparationis rapid, but nevertheless, enzymes in sap or juice should be deactivated,either with deuterated methanol and/or with a heating step (Biais et al.,2009; Moing et al., 2004). In comparison to chromatographic methodscoupled or not with mass spectrometry, the amount of sample materialrequired for NMR analysis is much larger: 20–50 mg dry weight(�200–500 mg fresh weight) instead of 60 mg fresh weight for GC–MS, for instance. As water is the main component of plant tissue and iscomposed of two hydrogen atoms which are NMR detectable, it isimportant to remove it by lyophilization or cryodessication. To bemore efficient, this step should be performed after cryogrinding, as fineplant powder helps facilitate the freeze-drying process as well as that ofextraction (Kim and Verpoorte, 2010). Sap or fruit juice samples are notlyophilized, but application of a presaturation technique to suppress thesignal of water is required (see Section 5.2.2). Several extraction
318 J. William Allwood et al.
Author's personal copy
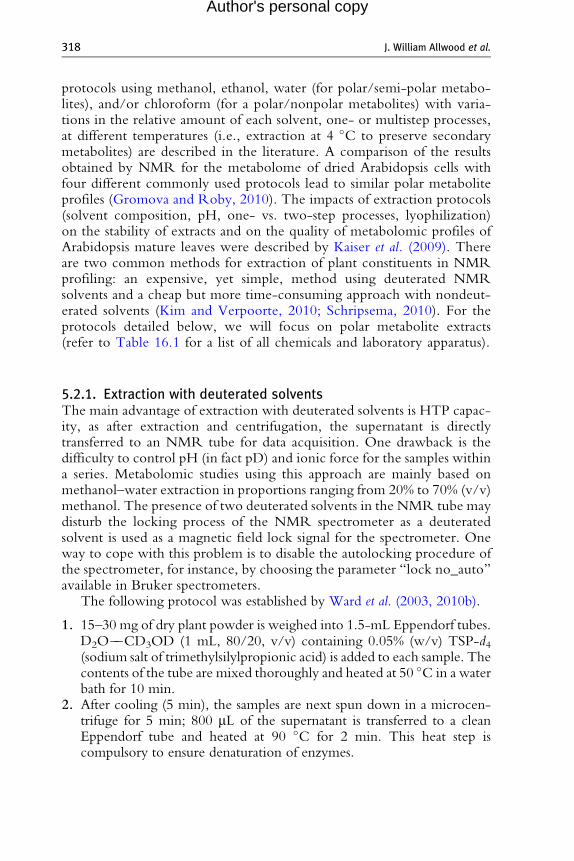
protocols using methanol, ethanol, water (for polar/semi-polar metabo-lites), and/or chloroform (for a polar/nonpolar metabolites) with varia-tions in the relative amount of each solvent, one- or multistep processes,at different temperatures (i.e., extraction at 4 �C to preserve secondarymetabolites) are described in the literature. A comparison of the resultsobtained by NMR for the metabolome of dried Arabidopsis cells withfour different commonly used protocols lead to similar polar metaboliteprofiles (Gromova and Roby, 2010). The impacts of extraction protocols(solvent composition, pH, one- vs. two-step processes, lyophilization)on the stability of extracts and on the quality of metabolomic profiles ofArabidopsis mature leaves were described by Kaiser et al. (2009). Thereare two common methods for extraction of plant constituents in NMRprofiling: an expensive, yet simple, method using deuterated NMRsolvents and a cheap but more time-consuming approach with nondeut-erated solvents (Kim and Verpoorte, 2010; Schripsema, 2010). For theprotocols detailed below, we will focus on polar metabolite extracts(refer to Table 16.1 for a list of all chemicals and laboratory apparatus).
5.2.1. Extraction with deuterated solventsThe main advantage of extraction with deuterated solvents is HTP capac-ity, as after extraction and centrifugation, the supernatant is directlytransferred to an NMR tube for data acquisition. One drawback is thedifficulty to control pH (in fact pD) and ionic force for the samples withina series. Metabolomic studies using this approach are mainly based onmethanol–water extraction in proportions ranging from 20% to 70% (v/v)methanol. The presence of two deuterated solvents in the NMR tube maydisturb the locking process of the NMR spectrometer as a deuteratedsolvent is used as a magnetic field lock signal for the spectrometer. Oneway to cope with this problem is to disable the autolocking procedure ofthe spectrometer, for instance, by choosing the parameter “lock no_auto”available in Bruker spectrometers.
The following protocol was established by Ward et al. (2003, 2010b).
1. 15–30 mg of dry plant powder is weighed into 1.5-mL Eppendorf tubes.D2O��CD3OD (1 mL, 80/20, v/v) containing 0.05% (w/v) TSP-d4(sodium salt of trimethylsilylpropionic acid) is added to each sample. Thecontents of the tube are mixed thoroughly and heated at 50 �C in a waterbath for 10 min.
2. After cooling (5 min), the samples are next spun down in a microcen-trifuge for 5 min; 800 mL of the supernatant is transferred to a cleanEppendorf tube and heated at 90 �C for 2 min. This heat step iscompulsory to ensure denaturation of enzymes.

Table 16.1 Chemicals, materials, equipment, and instrumentation required forextraction with nondeuterated solvents
Chemicals 1. D2O (Euriso-TopTM 99.9%)
2. Dipotassium phosphate K2HPO4 (MM ¼ 174.2 g/mol)
and monopotassium phosphate KH2PO4
(MM ¼ 136.1 g/mol) (VWRTM Normapur)
3. Ethanol (VWRTM Normapur 95%)
4. EDTA disodium salt (MM ¼ 374.28 g/mol) (SigmaTM)
5. Liquid nitrogen (Air LiquideTM)
6. MilliQTM water
7. Potassium hydroxide KOH (MM ¼ 56.1 g/mol)
(VWRTM Normapur)
8. 3-Trimethylsilyl[2,2,3,3-2H] propionic acid sodium salt
(TSP) (Sigma-AldrichTM 26,991-3)
Materials 1. 13-mL polypropylene tubes (SarstedtTM ref 55.515 & ref
60.541.003)
2. Gilson tips for PipetManÒ P5000, P1000, P100, and P10
3. NMR tube Wilmad 507-PP-7
Equipment 1. Safety glasses
2. Cryogenic gloves (TempshieldTM, blue)
3. Lab coat
Instrumentation 1. Centrifuge (JouanTM KR25i)
2. Cryogrinder (Freezer/Mill 6750 SPEX or UMC5
STEPHAN)
3. Dessicator/Silica gel (VWRTM Chameleon C 2.5–6 mm)
4. Desktop mini centrifuge (QualitronTM DW41)
5. Freeze-drier (BioblockTM DURA-DRY)
6. Heating bath (HeidolphTM)
7. pH-Meter (MeterLabTM PHM210)
8. PipetManÒ P5000, P1000, P100, and P10
9. Sonicator (BioblockTM 88155)
10. Speed-vac (ThermoTM SC210A)
11. Vortex (HeidolphTM 94323)
12. Weighing scale (SartoriusTM, 1602MP, d ¼ 0.1 mg)
Plant Metabolomics and Its Potential for Systems Biology Research 319
Author's personal copy
3. The samples are then cooled at 4 �C for 45 min prior to furthercentrifugation for 5 min (4 �C); 700 mL of the supernatant is transferredto a 5-mm NMR tube (5-mm economy NMR tubes WG-1226).
4. Deuterated water can be replaced by potassium phosphate buffer in D2O(pH 6) to avoid shift of resonances due to different pH values of extracts.However, the concentration of the buffer is limited by its stability in thepresence of methanol; precipitation should be avoided.

320 J. William Allwood et al.
Author's personal copy
5.2.2. Extraction with nondeuterated solventsThe following describes the three steps of a typical analysis of broccoliflorets adapted from the method of Moing et al. (2004).
1. For the first extraction, approximately 50 mg (�2 mg) of driedpowder is put in a 15-mL polypropylene tube with screw cap.Next, 2 mL of ethanol/water (80/20, v/v) is added and mixed witha vortex for 5 s. The tube is heated for 15 min at 80 �C. Every 5 min,the sample is mixed with a vortex for 5 s. The tube is then centri-fugated for 10 min at 30,000�g (4 �C). The first supernatant (S1) istransferred into a 15-mL polypropylene tube. The second and thirdextractions are carried out as the first on the remaining pellet onlywith 2 mL of ethanol/water (50/50, v/v) and 3 mL of ultrapurewater, respectively. The third supernatant (S3) is transferred intothe tube containing S1 and S2 and mixed with a vortex for 5 s.The combined supernatants are centrifuged for 10 min at 30,000�g(4 �C). The resulting supernatant is transferred into a 15-mL poly-propylene tube, frozen and dried under vacuum (Speed-vacuumconcentrator) over night in order to remove three-quarters of theinitial volume and is then frozen in liquid nitrogen and freeze-driedfor 24 h to remove nonbound water.
2. The dried extracts are solubilized in 500 mL of 400 mM phosphatebuffer in D2O supplemented with 5 mM Na2EDTA (ethylenediamine tetraacetic acid disodium salt) and titrated to pH6.0 � 0.05 with 1 M KOH in D2O. The phosphate buffer andKOD solutions have to be prepared the day of the titration toavoid D/H exchange. It is recommended to use EDTA addition tobuffer solution in order to improve spectral resolution of organicacids (like malic and citric acids). It is noteworthy that addition ofEDTA will in some cases add supplementary signals in the 1H NMRspectrum (Han et al., 2007). The titrated extracts are frozen in liquidnitrogen and lyophilized again for 24 h to decrease the signal ofresidual water. The dried, purified, titrated extracts are stored in adry atmosphere (dessicator) or at �20 �C (if storage is longer than aweek) before 1H NMR analysis.
3. The samples should be reconstituted on the day of NMR measure-ment with 500 mL of D2O from a freshly opened bottle and 5 mL of a2% (v/v) TSP/D2O solution, corresponding to 0.02% of TSP. Thesample is mixed with a vortex for 5 min and then centrifuged for5 min at 20,000�g (room temperature). The supernatant is trans-ferred into a clean 5-mm NMR tube and closed with a cap, andNMR acquisition is performed within 12 h.

Plant Metabolomics and Its Potential for Systems Biology Research 321
Author's personal copy
5.3. Considerations and recommendations forspectral acquisition
5.3.1. InstrumentationMetabolomic profiling by NMR demands the use of high-field instrumentswith superconducting magnet coils operating at liquid helium temperature.At present, the highest commercially available field is 23.5 T, equivalent to a1H frequency of 1 GHz. For plant metabolite profiling, the routine fieldsused have a 1H frequency of 400–600 MHz. An NMR spectrometer isalso composed of a console (high-frequency channels for, excitation andacquisition, gradient amplifier unit), a probe head, and an autosampler.Automatically, tuneable broadband inverse gradient probe heads (i.e.,ATMA-BBi by Bruker and ProTune Auto-X ID by Varian) flushed withnitrogen gas (coming from a nitrogen separator which enriches N2 to about98% of the compressed air) and temperature controlled are recommended.The chemical shift of water is temperature dependant. Inverse or indirectdetection probe heads provide optimal signal-to-noise ratio for 1H detec-tion. The diameter of such standard probe heads is usually 5 mm andrequires a sample volume of 500–600 mL (Ross et al., 2007). Autosampleror robotic sample changers permit the mechanical change of NMR tubes bya preset program, thus allowing HTP sample handling. Concerning tubes,the use of the same quality of tube and cap from the same vendor for thewhole series of samples is recommended. Tubes with outer diameter of5 mm or less are convenient. The acquisition method described within thefollowing section is designed for a capillary or coaxial NMR system, ratherthan performing quantification via locking to the TSP signal, and it isperformed using an internal standard solubilized within deuterated solvent.
5.3.2. AcquisitionMost commonly, one-pulse sequence methods are preferred for quantita-tive NMR profiling of polar metabolites in samples depleted of water. Forsamples that contain water, the water signal must be suppressed and a pulsesequence based on the start of the nuclear Overhauser effect spectroscopy,known as noesy-presat, is used. The noesy-presat technique, with its highestchemical shift selectivity over the other presaturation methods, is thetechnique of choice for the acquisition of high-quality and reproduciblespectra from aqueous samples (Ross et al., 2007). Nevertheless, this pulsesequence is very sensitive to lock phase, and this parameter should bechecked at the beginning of the workflow. Tables 16.2 and 16.3 describethe spectral acquisition and processing parameters used for a typical quanti-tative 1D 1H NMR analysis and for a semi-quantitative 1D 1H NMRanalysis with presaturation (noesy-presat), respectively. Some care shouldbe taken with sample temperature equilibration before NMR measure-ment. When the tube is placed in the probe head, a delay of 2–3 min is

Table 16.2 Recommended spectral acquisition parameters for quantitative 1D 1H NMR spectrum and for semi-quantitative 1D 1H NMR withpresaturation (noesy-presat) of polar metabolites using a 500-MHz NMR spectrometer with an automatically tuneable inverse probe
Parameter Setting 1D 1H qNMR Setting noesy-presat
Lock solvent D2O D2O
Solvent 100–400 mM potassium
or sodium phosphate buffer in
D2O (pH 6 or 7)a
100–400 mM potassium or sodium
phosphate buffer in D2O/H2O
(10%/90%, v/v) (pH 6 or 7)
Chelating agent 1–5 mM Na2EDTA in D2O 1–5 mM Na2EDTA in D2O
Calibrating standard for chemical shift scale 0.5 mM TSP 0.5 mM TSP
Sample temperature (K) 300 or 303b 300 or 303
Pulse sequence in Bruker library Normal one-pulse sequence (zg) Noesyzgpr1d
Water suppression — Mixing time 100 ms
Quantification standard ERETICc ERETIC
Excitation pulse angle (�) 90 90
Relaxation delay (s) 20–35d 2–4
Number of data points 32,768 or 65,536 65,536
Sweep width (ppm) 12 20
Number of transients or scans 64 64
Typical acquisition time (min) Typically 15–20 Typically 5
a The choice of pH for a given extract preparation may be governed by the need not only to resolve signals of certain metabolites (Kaiser et al., 2009) but also to avoid theprecipitation of certain metabolites (oxalate buffer in D2O, pH 4, to protect tartaric acid in berry extracts; Pereira et al., 2005).
b The choice of the temperature for a given extract NMR acquisition may be governed by the need to resolve signals of certain metabolites. Gromova and Roby (2010)used 293 K in order to shift the residual water peak and detect oxidized glutathione peak.
c ERETIC (Electronic REference To access In vivo Concentrations; Akoka et al., 1999). This electronic reference is generated by the spectrometer with an adaptedintensity and chemical shift position chosen by the spectroscopist. The main advantage is no chemical interaction between the internal standard and the constituents ofthe extract leading to erroneous quantification and no spectral overlapping with the resonances of the constituents of the extract. Attention should be paid when TSP isused as internal standard, especially with sap, or “juice” or samples where proteins were not removed. TSP can then interact with proteins and became less NMR visiblethus impairing quantification (Kriat et al., 1992). In addition, to be an accurate internal quantification standard, the intensity of the TSP signal should be as high as themedian intensities of the spectrum, not too small but also not too high. It should be kept in mind that the receptor gain of the spectrometer is calculated on the biggestsignal of the spectrum. The ERETIC method is an alternative to the use of internal standards. Recent Bruker spectrometers include ERETIC (indirect mode) in theirbasic configuration. Gromova and Roby (2010) used maleic acid (singlet at 6.023 ppm at pH 7) as internal standard for quantification.
d In order to take in account long T1 relaxation times of compounds like organic acids (malate, citrate, etc.). Quantitative conditions require a relaxation delayd1 � 5 � T1 longest. In beer, Rodrigues et al. (2010) reported 3.8 s for acetic, 1.1 s for citric, 1.3 s for lactic, 1.5 s for malic, 2.9 s for pyruvic, and 1.7 s for succinic acids.
Author's personal copy

Table 16.3 Recommended spectral processing parameters for quantitative 1D 1HNMR spectrum and for semi-quantitative 1D 1H NMR with presaturation (noesy-presat) of polar metabolites using a 500-MHZ NMR spectrometer with inverse ambientprobe
Parameters Setting 1D 1H qNMR Setting noesy-presat
Fourier
transformation
Exponential with line
broadening of 0.3 or
0.5 Hz
Exponential with line
broadening of 0.3 or
0.5 Hz
No of (real and
imaginary) data
points
32,768 or 65,536 65,536 to 4 � 65,536
Phasing Required
Manual
Required
Manual
Baseline corrected Manual (polynomial) Manual or automated
(polynomial)
Chemical shift
calibration
Chemical shift of the TSP
singlet signal set to
0 ppm
Chemical shift of the TSP
singlet signal set to
0 ppm
Plant Metabolomics and Its Potential for Systems Biology Research 323
Author's personal copy
required for this equilibration to take place, especially with “salted” samples.Special care should be also taken with spectrometer adjustments for eachsample like shimming and determination of the 90� pulse angle. With recentNMR spectrometers, the determination and optimization of these para-meters are routinely achieved by automation. NMR spectra of the techno-logical replicate samples have to be acquired in a randomized order(Defernez and Colquhoun, 2003). In addition to biological samples, it isrecommended to run a solvent blank and an extraction blank to identifyimpurities originating from the solvents (Kaiser et al., 2009) or the extrac-tion procedure (i.e., phthalates from plastic ware). For quantification pur-poses, reference samples with known concentrations of metabolites ofinterest should be measured in the same analytical run. For example, thecalibration curve for glucose can be performed with five concentrationsranging from 0 to 50 mM using the same solvent as the biological samples.The mid-concentration of the calibration range should be equivalent to theexpected concentration within the sample. The calibration curve of glucoseis used for scaling the integral of the ERETIC signal. The absolute quantityof a metabolite in the NMR sample is determined from the measurement ofthe integral of one of its specific resonances scaled with ERETIC intensity.The integration limits are chosen at the valleys on each side of the peak orpattern base, and in the cases where these points are not at the baseline level,manual local baseline correction is applied. In addition, specific calibrationcurves for fructose, glutamate, and glutamine have to be performed sepa-rately, and this is governed by the requirement of having a response factor of

324 J. William Allwood et al.
Author's personal copy
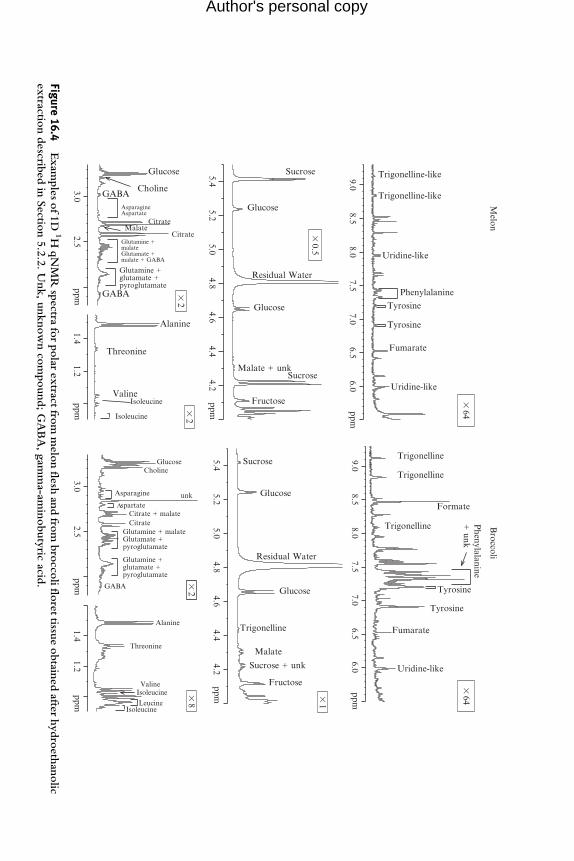
a part of their signal to accurately quantify (Moing et al., 2004). Automationof phasing and baseline correction can be used, but only with limitedreliability and human visual inspection of processed spectra is compulsoryto detect artifacts of automated processing. Figure 16.4 provides examples of1D 1H qNMR spectra of polar extracts from melon flesh and broccoli floretobtained after hydroethanolic extraction described in Section 5.2.2.Table 16.4 demonstrates a spectral processing method that is applied tothe raw data in order to permit latter statistical analysis. The presentedpostacquisition data processing steps differ if the entire spectral signature isanalyzed with data reduction into about 300–1200 spectral regions (finger-printing), or if absolute quantification of identified compounds is chosen.For binning or bucketing, commercially available softwares include Amix(Bruker) or KnowItAll Metabolomics Editions (BioRad). The file contain-ing the intensity values of each bin or bucket could be either transferred togeneric statistical softwares like SIMCA-P (Umetrics) or processed in statis-tics modules of the above softwares.
5.3.3. Metabolite identification or spectral assignmentIt is worth noting that the chemical shift range of 1H is small and rarelybeyond 10 ppm, which means that 1H NMR spectra of complex mixtureslike plant extracts are crowded and resonance overlap occurs. In addition,most of the 1H signals have a multiplet structure. Most metabolites havemultiple interdependent resonances across the spectrum. So checking forthe presence of all the chemical shifts and patterns of the suspected metabo-lite and crosschecking for the expected proportions of these resonancesbetween patterns are the traditional way of performing metabolite structuralelucidation with 1D 1HNMR. The following describes a typical pipeline ofNMR spectral assignment. The first step for the assignments of metabolitesin the NMR spectra is made by comparing the observed proton chemicalshifts.
1. With literature, for example, using Fan (1996) as a good start.2. With in-house or public/commercial database values of authentic com-
pounds acquired under the same solvent conditions (see Saito andMatsuda, 2010), for example, Prime (http://prime.psc.riken.jp/),HMDB (http://www.hmdb.ca/), and commercial databases (ChenomxMetabolite Database and BBIOREFCODE, Bruker NMR MetabolicProfiling Database).
3. With in-house or public knowledge bases dedicated to NMR metabo-lomic profiles, for example, MeRy-B (http://www.cbib.u-bordeaux2.fr/MERYB/).
4. By spiking the samples with authentic or commercial compounds ifavailable, by acquiring further spectra, and demonstrating coresonanceof the peaks from the extract sample and the added compound.
4.24.4
4.64.8
5.05.2
5.4ppm
2.53.0
ppm
4.24.4
4.64.8
5.05.2
5.4ppm
6.06.5
7.07.5
8.08.5
9.0ppm
2.53.0
ppm
Trigonelline
Trigonelline
Sucrose
Glucose
Glucose
Malate + unkSucrose
Choline
Glucose
GABA
GABA
Citrate
CitrateMalate
Asparagine Aspartate
Residual Water
Residual Water
Fructose
Trigonelline
Malate
Sucrose + unk
Fructose
1.21.4
ppm
Alanine
Isoleucine
Threonine
Valine
Threonine
Valine
GABA
Choline
�64
1.21.4
ppm
Fumarate
6.06.5
7.07.5
8.08.5
9.0ppm
Trigonelline-like
Uridine-like
Tyrosine
Tyrosine
Trigonelline
Formate
Phenylalanine
+ unk
Glucose
�1
Glutamine +glutamate +pyroglutamate
Glutamine +glutamate +pyroglutamate
�2
Fumarate
Glucose
Glucose
Sucrose
Melon
Broccoli
Trigonelline-like
Uridine-like
Phenylalanine
Tyrosine
Tyrosine
Alanine
Isoleucine
Isoleucine
�8
IsoleucineLeucine
Citrate + malateCitrate
Glutamine + malateGlutamate +pyroglutamate
Asparagine
Aspartate
Uridine-like
unk
�0.5
Glutamine +malateGlutamate +malate + GABA
�64
�2
�2
Figure
16.4
Exam
plesof1D
1HqNMR
spectra
forpolar
extract
from
melonfle
shandfro
mbrocco
liflo
rettissu
eobtain
edafte
rhydroethanolic
extractio
ndescrib
edin
Sectio
n5.2.2.Unk,unknowncompound;GABA,gam
ma-am
inobutyric
acid.
Author's personal copy
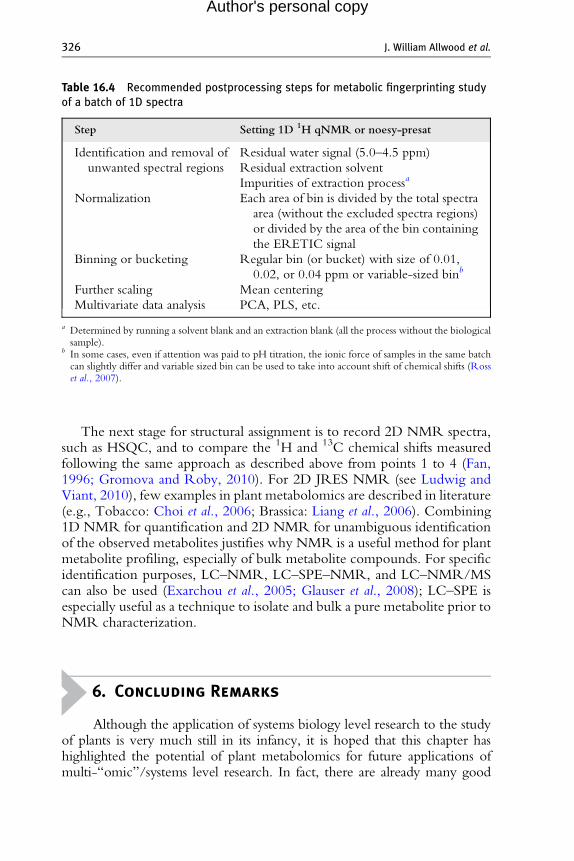
Table 16.4 Recommended postprocessing steps for metabolic fingerprinting studyof a batch of 1D spectra
Step Setting 1D 1H qNMR or noesy-presat
Identification and removal of
unwanted spectral regions
Residual water signal (5.0–4.5 ppm)
Residual extraction solvent
Impurities of extraction processa
Normalization Each area of bin is divided by the total spectra
area (without the excluded spectra regions)
or divided by the area of the bin containing
the ERETIC signal
Binning or bucketing Regular bin (or bucket) with size of 0.01,
0.02, or 0.04 ppm or variable-sized binb
Further scaling Mean centering
Multivariate data analysis PCA, PLS, etc.
a Determined by running a solvent blank and an extraction blank (all the process without the biologicalsample).
b In some cases, even if attention was paid to pH titration, the ionic force of samples in the same batchcan slightly differ and variable sized bin can be used to take into account shift of chemical shifts (Rosset al., 2007).
326 J. William Allwood et al.
Author's personal copy
The next stage for structural assignment is to record 2D NMR spectra,such as HSQC, and to compare the 1H and 13C chemical shifts measuredfollowing the same approach as described above from points 1 to 4 (Fan,1996; Gromova and Roby, 2010). For 2D JRES NMR (see Ludwig andViant, 2010), few examples in plant metabolomics are described in literature(e.g., Tobacco: Choi et al., 2006; Brassica: Liang et al., 2006). Combining1D NMR for quantification and 2D NMR for unambiguous identificationof the observed metabolites justifies why NMR is a useful method for plantmetabolite profiling, especially of bulk metabolite compounds. For specificidentification purposes, LC–NMR, LC–SPE–NMR, and LC–NMR/MScan also be used (Exarchou et al., 2005; Glauser et al., 2008); LC–SPE isespecially useful as a technique to isolate and bulk a pure metabolite prior toNMR characterization.
6. Concluding Remarks
Although the application of systems biology level research to the studyof plants is very much still in its infancy, it is hoped that this chapter hashighlighted the potential of plant metabolomics for future applications ofmulti-“omic”/systems level research. In fact, there are already many good

Plant Metabolomics and Its Potential for Systems Biology Research 327
Author's personal copy
examples where metabolomics and microarray transcriptomics have beencombined to provide maximum information (Hirai et al., 2004; Nikiforovaet al., 2004; Yonekura-Sakakibara et al., 2008). Although this chapter hasfocused purely upon introducing the reader to the field of plant metabolomicsand the production of high-quality and reproducible metabolite profiles, it ishoped that the reader can see the future benefit of the use of such methods forthe production of informative and comparable data between research labora-tories (Allwood et al., 2009; de Vos et al., 2007; Erban et al., 2007; Lisec et al.,2006; Ward et al., 2010b). In conclusion, many aspects of metabolomics arenow firmly embedded in biological and systems biology sciences. Further, wehave entered a phase focused on dealing with the final elimination of bottlenecks/automation and exploration of the limits such as miniaturization ofsamples, enhancement from relative to absolute quantification for systemsbiology/modeling applications, and enhanced coverage using higher dimen-sional hyphenated technologies such as GC � GC-TOF/MS. With furtherongoing technological developments making “omics” data more reproduc-ible, as well as improvements in data modeling, and perhaps, applying multi-omic level analysis to model plant species such as Arabidopsis using bothartificial cell cultures and their respective soil grown plants, we feel that theplant science field will greatly benefit from systems biology and that suchapproaches will eventually benefit many areas of research within plant physi-ology and food nutrition.
ACKNOWLEDGMENTS
J. W. A. and all authors would like to thank the EU for experimental funding as part of theFramework VI initiative within the META-PHOR project (FOOD-CT-2006-036220).J. W. A. would also like to acknowledge CR-UK for current research funding. R. G. wouldlike to thank the UK BBSRC and EPSRC (BBC0082191) for financial support of theMCISB (Manchester Centre for Integrative Systems Biology). R. D. H and R. C. H. D. V.acknowledge the Centre for Biosystems Genomics, which is part of the NetherlandsGenomics Initiative, for additional funding. A. M. and C. D. would like to thank Dr. S.Bernillon for his critical reading of Section 5 and the Metabolome Facility of BordeauxFunctional Genomics Centre for support.
REFERENCES
Adato, A., Mandel, T., Mintz-Oron, S., Venger, I., Levy, D., Yativ, M., Dominguez, E.,Wang, Z., De Vos, C. H. R., Jetter, R., Schreiber, L., Heredia, A., et al. (2009). Fruit-surface flavonoid accumulation in tomato is controlled by a SIMYB12-regulated tran-scriptional network. PLoS Genet. 5(12), e1000777, 10.1371/journal.pgen.1000777.
Ahuja, I., De Vos, C. H. R., Bones, A. M., and Hall, R. D. (2010). Plant molecular stressprogrammes face climate change. Trends Plant Sci. 15, 664–674.
Akoka, S., Barantin, L., and Trierweiler, M. (1999). Concentration measurement by protonNMR using the ERETIC method. Anal. Chem. 71, 2554–2557.

328 J. William Allwood et al.
Author's personal copy
Allwood, J. W., and Goodacre, R. (2010). An introduction to liquid chromatography–massspectrometry instrumentation applied in plant metabolomic analyses. Phytochem. Anal.21, 33–47.
Allwood, J. W., Ellis, D. I., Heald, J. K., Goodacre, R., and Mur, L. A. J. (2006).Metabolomic approaches reveal that phosphatidic and phosphatidyl glycerol phospholi-pids are major discriminatory metabolites in responses by Brachypodium distachyon tochallenge by Magnaporthe grisea. Plant J. 46, 351–368.
Allwood, J. W., Ellis, D. I., and Goodacre, R. (2008). Metabolomic technologies and theirapplication to the study of plants and plant-host interactions. Physiol. Plant. 132, 117–135.
Allwood, J. W., Erban, A., de Koning, S., Dunn, W. B., Luedemann, A., Lommen, A.,Kay, L., Loscher, R., Kopka, J., and Goodacre, R. (2009). Inter-laboratory reproduc-ibility of fast gas chromatography–electron impact–time of flight mass spectrometry(GC-EI-TOF/MS) based plant metabolomics. Metabolomics 5, 479–496.
Allwood, J. W., Clarke, A., Goodacre, R., and Mur, L. A. J. (2010). Dual metabolomics: Anovel approach to understanding plant-pathogen interactions. Phytochemistry 71, 590–597.
Allwood, J. W., Parker, D. P., Beckmann, M., Draper, J., and Goodacre, R. (2011). Fouriertransform ion cyclotron resonance mass spectrometry (FT-ICR-MS) for plant metaboliteprofiling and metabolite identification. In “Plant Metabolomics Methods,”(N. W. Hardy and R. D. Hall, eds.), Humana Press, Otawa, USA (in press).
Anderson, M. J., and Whitcomb, P. J. (2007). DOE Simplified: Practical Tools for EffectiveExperimentation. 2nd edn. Productivity Press, New York.
AP Rees, T., and Hill, S. A. (1994). Metabolic control analysis of plant metabolism. PlantCell Environ. 17, 587–599.
Baginsky, S., and Fernie, A. R. (eds.), (2007). Plant Systems Biology, Birkhauser, Basel,Switzerland.
Balestrini, R., and Bonfante, P. (2008). Laser microdissection (LM): Applications to plantmaterials. Plant Biosyst. 142, 331–336.
Beale, M. H., and Sussman, M. R. (2010). Metabolomics of Arabidopsis thaliana. In “TheBiology of Plant Metabolomics,” (R. D. Hall, ed.). Blackwell-Wiley, London (Chapter6, 157–180).
Beale, M. H., and Ward, J. L. (2011). Sample preparation using Arabidopsis. In “PlantMetabolomics Methods,” (N. W. Hardy and R. D. Hall, eds.), Humana Press, Otawa,USA (in press).
Begley, P., Francis-McIntyre, S., Dunn, W. B., Broadhurst, D. I., Halsall, A., Tseng, A.,Knowles, J., HUSERMET ConsortiumGoodacre, R., and Kell, D. B. (2009). Develop-ment and performance of a gas chromatography-time-of-flight mass spectrometry analy-sis for large-scale nontargeted metabolomic studies of human serum. Anal. Chem. 81,7038–7046.
Biais, B., Allwood, J. W., Deborde, C., Xu, Y., Maucourt, M., Beauvoit, B., Dunn, W. B.,Jacob, D., Goodacre, R., Rolin, D., and Moing, A. (2009). 1H-NMR, GC-EI-TOF/MS, and dataset correlation for fruit metabolomics: Application to spatial metaboliteanalysis in melon. Anal. Chem. 81, 2884–2894.
Biais, B., Beauvoit, B., Allwood, J. W., Deborde, C., Maucourt, M., Goodacre, R.,Rolin, D., and Moing, A. (2010). Metabolic acclimation to hypoxia revealed by metab-olite gradients in melon fruit. J. Plant Physiol. 167, 242–245.
Biais, B., Bernillon, S., Deborde, C., Cabasson, C., Rolin, D., Tadmor, Y., Burger, J.,Schaffer, A. A., and Moing, A. (2011). Precautions for harvest, sampling, storage andtransport of crop plant metabolomics samples. In “Plant Metabolomics Methods,”(N. W. Hardy and R. D. Hall, eds.), Humana Press, Otawa, USA (in press).
Bino, R. J., Hall, R. D., Fiehn, O., Kopka, J., Saito, K., Draper, J., Nikolau, B. J.,Mendes, P., Roessner-Tunali, U., Beale, M. H., Trethewey, R. N., Lange, B. M.,et al. (2004). Potential of metabolomics as a functional genomics tool. Trends Plant Sci. 9,418–425.

Plant Metabolomics and Its Potential for Systems Biology Research 329
Author's personal copy
Bino, R. J., de Vos, C. H. R., Lieberman, M., Hall, R. D., Bovy, A., Jonker, H. H.,Tikunov, Y., Lommen, A., Moco, S., and Levin, I. (2005). The light-hyperresponsivehigh pigment-2(dg) mutation of tomato: Alterations in the fruit metabolome. NewPhytol. 166, 427–438.
Bonhomme,R. (2000). Bases and limits to using ‘degree.day’ units.Eur. J. Agronomy. 13, 1–10.Bovy, A. G., Gomez-Roldan, V., and Hall, R. D. (2010). Strategies to optimize the
flavonoid content of tomato fruit. In “Recent Advances in Polyphenol Research,”(C. Santos-Buelga, M.-T. Escribano-Bailon, and V. Lattanzio, eds.), pp. 138–162.Blackwell-Wiley, London.
Boyes, D. C., Zayed, A. M., Ascenzi, R., McCaskill, A. J., Hoffmann, N. E., Davis, K. R.,and Gorlach, J. (2001). Growth stage-based phenotypic analysis of Arabidopsis. A modelfor high throughput functional genomics in plants. Plant Cell 13, 1499–1510.
Broadhurst, D. I., and Kell, D. B. (2006). Statistical strategies for avoiding false discoveries inmetabolomics and related experiments. Metabolomics 2, 171–196.
Brukhin, V., Hernould, M., Gonzalez, N., Chevalier, C., and Mouras, A. (2003). Flowerdevelopment schedule in tomato Lycopersicon esculentum cv. sweet cherry. Sex. PlantReprod. 15, 311–320.
Capanoglu, E., Beekwilder, J., Boyacioglu, D., de Vos, R., and Hall, R. (2008). Changes inantioxidant and metabolite profiles during production of tomato paste. J. Agric. FoodChem. 56, 964–973.
Choi, Y. H., Kim, H. K., Linthorst, H. J. M., Hollander, J. G., Lefeber, A. W. M.,Erkelens, C., Nuzillard, J. M., and Verpoorte, R. (2006). NMR metabolomics torevisit the tobacco mosaic virus infection in Nicotiana tabacum leaves. J. Nat. Prod. 69,742–748.
Cook, D., Fowler, S., Fiehn, O., and Thomashow, M. F. (2004). A prominent role for theCBF cold response pathway in configuring the low-temperature metabolome of Arabi-dopsis. Proc. Natl. Acad. Sci. USA 101, 15243–15248.
de Rijke, E., Zappey, H., Ariese, F., Gooijer, C., and Brinkmen, U. A. Th. (2003). Liquidchromatography with atmospheric pressure chemical ionization and electrospray ioniza-tion mass spectrometry of flavonoids with triple-quadrupole and ion-trap instruments.J. Chromatogr. A 984, 45–58.
de Vos, C. H. R., Moco, S., Lommen, A., Keurentjes, J. J. B., Bino, R. J., and Hall, R. D.(2007). Untargeted large-scale plant metabolomics using liquid chromatography coupledto mass spectrometry. Nat. Protoc. 2, 778–791.
Defernez, M., and Colquhoun, I. J. (2003). Factors affecting the robustness of metabolitefingerprinting using 1H NMR spectra. Phytochemistry 62, 1009–1017.
Douillard, C., and Guichard, E. (1990). The aroma of strawberry (Fragaria ananassa):Characterisation of some cultivars and influence of freezing. J. Sci. Food Agric. 50,517–531.
Dunn, W. B., Bailey, N. J. C., and Johnson, H. E. (2005a). Measuring the metabolome:Current analytical technologies. Analyst 130, 606–625.
Dunn, W. B., Overy, S., and Quick, W. P. (2005b). Evaluation of automated electrospray-TOF mass spectrometry for metabolic fingerprinting of the plant metabolome. Metabo-lomics 1, 137–148.
Dunn, W. B., Broadhurst, D., Brown, M., Baker, P. N., Redman, C. W. G., Kenny, L. C.,and Kell, D. B. (2008). Metabolite profiling of serum using ultra performance liquidchromatography and the LTQ-Orbitrap mass spectrometry system. J. Chromatogr. B 871,288–298.
Ebert, B., Zoeller, D., Erban, A., Fehrle, I., Hartmann, J., Niehl, A., Kopka, J., and Fisahn, J.(2010). Metabolic profiling of Arabidopsis thaliana epidermal cells. J. Exp. Bot. 61,1321–1335.
330 J. William Allwood et al.
Author's personal copy
Eisenreich, W., and Bacher, A. (2007). Advances of high-resolution NMR techniques in thestructural and metabolic analysis of plant biochemistry. Phytochemistry 68, 2799–2815.
Erban, A., Schauer, N., Fernie, A. R., and Kopka, J. (2007). Nonsupervised constructionand application of mass spectral and retention time index libraries from time-of-flight gas chromatography-mass spectrometry metabolite profiles. In “Methods inMolecular Biology,” (W. Weckwerth, ed.), Vol. 358, (Part I), pp. 19–38. Springer,New York, USA.
Exarchou, V., Krucker, M., van Beek, T. A., Vervoort, J., Gerothanassis, I. P., andAlbert, K. (2005). LC–NMR coupling technology: Recent advancements and applica-tions in natural products analysis. Magn. Reson. Chem. 43, 681–687.
Fait, A., Hanhineva, K., Beleggia, R., Dai, N., Rogachex, I., Nikiforova, V. J.,Fernie, A. R., and Aharoni, A. (2008). Reconfiguration of the achene and receptaclemetabolic networks during strawberry fruit development. Plant Physiol. 148, 730–750.
Fan, T. W. M. (1996). Metabolite profiling by one- and two-dimensional NMR analysis ofcomplex mixtures. Prog. Nucl. Magn. Reson. Spectrosc. 28, 161–219.
Farag, M. A., Huhman, D. V., Dixon, R. A., and Sumner, L. W. (2008). Metabolomicsreveals novel pathways and differential mechanistic and elicitor-specific responses inphenylpropanoid and isoflavonoid biosynthesis in Medicago truncatula cell cultures. PlantPhysiol. 146, 387–402.
Fernie, A. R. (2007). The future of metabolic phytochemistry: Larger numbers of metabo-lites, higher resolution, greater understanding. Phytochemistry 68, 2861–2880.
Fernie, A. R., and Schauer, N. (2009). Metabolomics-assisted breeding: A viable option forcrop improvement? Trends Genet. 25, 39–48.
Fernie, A. R., Trethewey, R. N., Krotzky, A. J., and Willmitzer, L. (2004). Metaboliteprofiling: From diagnostics to systems biology. Nat. Rev. Mol. Cell Biol. 5, 763–769.
Fiehn, O. (2002). Metabolomics—The link between genotypes and phenotypes. Plant Mol.Biol. 48, 155–171.
Fiehn, O., Kopka, J., Dormann, P., Altmann, T., Trethewey, R. N., and Willmitzer, L.(2000a). Metabolite profiling for plant functional genomics. Nat. Biotechnol. 18,1157–1161.
Fiehn, O., Kopka, J., Trethewey, R. N., and Willmitzer, L. (2000b). Identification ofuncommon plant metabolites based on calculation of elemental compositions using gaschromatography and quadrupole mass spectrometry. Anal. Chem. 72, 3573–3580.
Fiehn, O., Sumner, L. W., Rhee, S. Y., Ward, J., Dickerson, J., Lange, B. M., Lane, G.,Roessner, U., Last, R., and Nikolau, B. (2007). Minimum reporting standards for plantbiology context information in metabolomic studies. Metabolomics 3, 195–201.
Fiehn, O., Wohlgemuth, G., Scholz, M., Kind, T., Lee, D. Y., Lu, Y., Moon, S., andNikolau, B. (2008). Quality control for plant metabolomics: Reporting MSI-compliantstudies. Plant J. 53, 691–704.
Fiehn, O., Kind, T., and Kumar Barupal, D. (2011). Data processing, metabolomic databasesand pathway analysis. In “The Biology of Plant Metabolomics,” (R. D. Hall, ed.).Blackwell-Wiley, London (in press).
Fish, W., and Davis, A. (2003). The effects of frozen storage conditions on lycopene stabilityin watermelon tissue. J. Agric. Food Chem. 51, 3582–3585.
Gautier, H., Rocci, A., Buret, M., Grasselly, D., and Causse, M. (2005). Fruit load or fruitposition alters response to temperature and subsequently cherry tomato quality. J. Sci.Food Agric. 85, 1009–1016.
Giavalisco, P., Kohl, K., Hummel, J., Seiwert, B., and Willmitzer, L. (2009). C-13 isotope-labeled metabolomes allowing for improved compound annotation and relative quantifi-cation in liquid chromatography-mass spectrometry-based metabolomic research. Anal.Chem. 81, 6546–6551.

Plant Metabolomics and Its Potential for Systems Biology Research 331
Author's personal copy
Gibon, Y., and Rolin, D. (2011). Precautions for harvest, sampling, storage and transport ofcrop plant metabolomics samples. In “Plant Metabolomics Methods,” (N. W. Hardy andR. D. Hall, eds.), Humana Press, Otawa, USA (in press).
Gibon, Y., Usadel, B., Blaesing, O., Kamlage, B., Hoehne, M., Trethewey, R., and Stitt, M.(2006). Integration of metabolite with transcript and enzyme activity profiling duringdiurnal cycles in Arabidopsis rosettes. Genome Biol. 7, R76.
Glauser, G., Guillarme, D., Grata, E., Boccard, J., Thiocone, A., Carrupt, P.-A.,Veuthey, J.-L., Rudaz, S., and Wolfender, J.-L. (2008). Optimized liquid chromatogra-phy-mass spectrometry approach for the isolation of minor stress biomarkers in plantextracts and their identification by capillary nuclear magnetic resonance. J. Chromatogr. A1180, 90–98.
Goodacre, R., Vaidyanathan, S., Dunn, W. B., Harrigan, G. G., and Kell, D. B. (2004).Metabolomics by numbers—Acquiring and understanding global metabolomics data.Trends Biotechnol. 22, 245–252.
Goodacre, R., Broadhurst, D., Smilde, A. K., Kristal, B. S., Baker, J. D., Beger, R., Bessant, C.,Connor, S., Calmani,G.,Craig,A., Ebbels, T., Kell, D.B., et al. (2007). Proposedminimumreporting standards for data analysis in metabolomics.Metabolomics 3, 231–241.
Gromova, M., and Roby, C. (2010). Toward Arabidopsis thaliana hydrophilic metabolome:Assessment of extractionmethods and quantitative 1HNMR. Physiol. Plant. 140, 111–127.
Hall, R. D. (2006). Plant metabolomics: From holistic hope, to hype, to hot topic. NewPhytol. 169, 453–468.
Hall, R. D. (ed.) (2011). Biology of Plant Metabolomics, Wiley-Blackwell, Oxford.Hall, R. D., De Vos, C. H. R., and Ward, J. (2010). Plant metabolomics applications in the
Brassicaceae: Added value for science and industry. Acta Horticulturae 867, 191–206.Han, S., Mathias, E. V., and Ba, Y. (2007). Proton NMR determination of Mg2+ and Ca2+
concentrations using tetrasodium EDTA complexes. J. Chem. 1, 1–5.Hanhineva, K., Rogachev, I., Kokko, H., Mintz-Oron, S., Venger, I., Karenlampi, S., and
Aharoni, A. (2008). Non-targeted analysis of spatial metabolite composition in straw-berry (Fragaria � ananassa) flowers. Phytochemistry 69, 2463–2481.
Hannemann, J., Poorter, H., Usadel, B., Blasing, O. E., Finck, A., Tardieu, F., Atkin, O. K.,Pons, T., Stitt, M., and Gibon, Y. (2009). Xeml Lab: A tool that supports the design ofexperiments at a graphical interface and generates computer-readable metadata files,which capture information about genotypes, growth conditions, environmental pertur-bations and sampling strategy. Plant Cell Environ. 32, 1185–1200.
Hardy, N. W., and Hall, R. D. (eds.), (2011). Plant Metabolomics Methods, Humana Press,Otawa, USA (in press).
Harrigan, G. G., and Goodacre, R. (eds.), (2003). Metabolic Profiling: Its Rolein Biomarker Discovery and Gene Function Analysis, Kluwer Academic Publishers,Boston/Dordrecht/London.
Hinkelmann, K., and Kempthorne, O. (2008). Design and Analysis of Experiments. Vol. 1.Introduction to Experimental Design. 2nd edn. Wiley, New Jersey.
Hirai, M. Y., Yano, M., Goodenowe, D. B., Kanaya, S., Kimura, T., Awazuhara, M.,Arita, M., Fujiwara, T., and Saito, K. (2004). Integration of transcriptomics and meta-bolomics for understanding of global responses to nutritional stresses in Arabidopsisthaliana. Proc. Natl. Acad. Sci. USA 101, 10205–10210.
Huege, J., Sulpice, R., Gibon, Y., Lisec, J., Koehl, K., and Kopka, J. (2007). GC-EI-TOF-MS analysis of in vivo-carbon-partitioning into soluble metabolite pools of higher plantsby monitoring isotope dilution after (13CO2)-labelling. Phytochemistry 68, 2258–2272.
Huhman, D. V., and Sumner, L. W. (2002). Metabolic profiling of saponins in Medicagosativa and Medicago truncatula using HPLC coupled to an electrospray ion-trap massspectrometer. Phytochemistry 59, 347–360.

332 J. William Allwood et al.
Author's personal copy
Hummel, J., Strehmel,N., Selbig, J.,Walther,D., andKopka, J. (2010).Decision tree supportedsubstructure prediction of metabolites from GC-MS profiles.Metabolomics 6, 322–333.
Iijima, Y., Nakamura, Y., Ogata, Y., Tanaka, K., Sakurai, N., Suzuki, H., Okazaki, K.,Kitayama, M., Kanaya, S., Aoki, K., and Shibata, D. (2008). Metabolite annotationsbased on the integration of mass spectral information. Plant J. 54, 949–962.
Jansen, J. J., Allwood, J. W., Marsden-Edwards, E., van der Putten, W. H., Goodacre, R.,and van Dam, N. M. (2008). Metabolomic analysis of the interaction between plants andherbivores. Metabolomics 5, 150–161.
Julkunen-Titto, R., and Tahvanaiem, J. (1989). The effect of the sample preparation methodof extractable phenolics of Salicaceae species. Planta Med. 55, 55–58.
Kaiser, K. A., Barding, G. A., Jr., and Larive, C. K. (2009). A comparison of metaboliteextraction strategies for 1H-NMR-based metabolic profiling using mature leaf tissuefrom the model plant Arabidopsis thaliana. Magn. Reson. Chem. 47, S147–S156.
Kaplan, F., Kopka, J., Haskell, D. W., Zhao, W., Schiller, K. C., Gatzke, N., Sung, D. Y.,and Guy, C. L. (2004). Exploring the temperature-stress metabolome of Arabidopsis.Plant Physiol. 136, 4159–4168.
Keinanen, K., and Julkunen-Titto, R. (1996). Effect of sample preparation method on birch(Betula pendula Roth) leaf phenolics. J. Agric. Food Chem. 44, 2724–2727.
Keurentjes, J. J. B. (2009). Genetical metabolomics: Closing in on phenotypes. Curr. Opin.Plant Biol. 12, 223–230.
Keurentjes, J. J. B., Fu, J., De Vos, C. H. R., Lommen, A., Hall, R. D., Bino, R. J., Van derPlas, L. H. W., Jansen, R. C., Vreugdenhil, D., and Koornneef, M. (2006). The geneticsof plant metabolism. Nat. Genet. 38, 842–849.
Kim, H. K., and Verpoorte, R. (2010). Sample preparation for plant metabolomics. Phy-tochem. Anal. 21, 4–13.
Kim, H. K., Wilson, E. G., Choi, Y. H., and Verpoorte, R. (2010). Metabolomics: A toolfor anti-cancer lead-finding from natural products. Planta Med. 76, 1094–1102.
Klages, K., Donnison, H., Wunsche, J., and Boldingh, H. (2001). Diurnal changes innon-structural carbohydrates in leaves, phloem exudate and fruit in ‘Braeburn’ apple.Aust. J. Plant Physiol. 28, 131–139.
Kopka, J. (2006). Gas chromatography mass spectrometry. In “Plant Metabolomics,”(K. Saito, R. Dixon, and L. Willmitzer, eds.), pp. 3–20. Springer-Verlag, Berlin.
Kopka, J., Fernie, A. F., Weckwerth, W., Gibon, Y., and Stitt, M. (2004). Metaboliteprofiling in plant biology: Platforms and destinations. Genome Biol. 5, 109–117.
Kopka, J., Schauer, N., Krueger, S., Birkemeyer, C., Usadel, B., Bergmueller, E.,Doermann, P., Weckwerth, W., Gibon, Y., Stitt, M., Willmitzer, L., Fernie, A. R., et al.(2005). [email protected]: The Golm metabolome database. Bioinformatics 21, 1635–1638.
Kopka, J., Walther, D., Allwood, J. W., and Goodacre, R. (2011). Progress in chemometricsand biostatistics for plant applications: Or a good red wine is a bad white wine. In “TheBiology of Plant Metabolomics,” (R. D. Hall, ed.). Blackwell-Wiley, London (Chapter10, 317–342).
Kriat, M., Confort-Gouny, S., Vion-Dury, J., Sciaky, M., Viout, P., and Cozzone, P. J.(1992). Quantitation of metabolites in human blood serum by proton magnetic reso-nance spectroscopy. A comparative study of the use of formate and TSP as concentrationstandards. NMR Biomed. 5, 179–184.
Liang, Y. S., Choi, Y. H., Kim, H. K., Linthorst, H. J. M., and Verpoorte, R. (2006).Metabolomic analysis of methyl jasmonate treated Brassica rapa leaves by 2-dimensionalNMR spectroscopy. Phytochemistry 67, 2503–2511.
Lisec, J., Schauer, N., Kopka, J., Willmitzer, L., and Fernie, A. R. (2006). Gas chromatog-raphy mass spectrometry-based metabolite profiling in plants. Nat. Protoc. 1, 387–396.
Lommen, A. (2009). MetAlign: Interface-driven, versatile metabolomics tool forhyphenated full-scan mass spectrometry data preprocessing. Anal. Chem. 81, 3079–3086.

Plant Metabolomics and Its Potential for Systems Biology Research 333
Author's personal copy
Lommen, A., Gerssen, A., Oosterink, J. E., Kools, H. J., Ruiz-Aracama, A.,Peters, R. J. B., and Mol, H. G. J. (2010). Ultrafast searching assists inevaluating sub-ppm mass accuracy enhancement in U-HPLC/Orbitrap MS data.Metabolomics 7(1), 15–24.
Ludwig, C., and Viant, M. R. (2010). Two-dimensional J-resolved NMR spectroscopy:Review of a key methodology in the metabolomics toolbox. Phytochem. Anal. 21, 22–32.
Luedemann, A., Strassburg, K., Erban, A., and Kopka, J. (2008). TagFinder for the quanti-tative analysis of gas chromatography–mass spectrometry (GC-MS)-based metaboliteprofiling experiments. Bioinformatics 24, 732–737.
Luedemann, A., Erban, A., von Malotky, L., and Kopka, J. (2011). Processing of compre-hensive fingerprint data matrices from nominal mass GCMS data using TagFinder.In “Plant Metabolomics Methods,” (N. W. Hardy and R. D. Hall, eds.), HumanaPress, Otawa, USA (in press).
Ma, F., and Cheng, L. (2003). The sun-exposed peel of apple fruit has higher xanthophyllcycle-dependent thermal dissipation and antioxidants of the ascorbate/glutathione path-way than the shaded peel. Plant Sci. 165, 819–827.
Ma, Y. K., Hu, X. S., Chen, J., Chen, F., Wu, J. H., Zhao, G. H., Liao, X. J., andWang, Z. F. (2007). The effect of freezing modes and frozen storage on aroma, enzymeand micro-organism in Hami melon. Food Sci. Technol. Int. 13, 259–267.
Markert, B. (1995). Sample preparation (cleaning, drying, homogenization) for trace ele-ment analysis in plant matrices. Sci. Total Environ. 176, 45–61.
Moco, S., Bino, R. J., Vorst, O., Verhoeven, H. A., de Groot, J., van Beek, T. A.,Vervoort, J., and de Vos, C. H. R. (2006). A liquid chromatography-mass spectrome-try-based metabolome database for tomato. Plant Physiol. 141, 1205–1218.
Moco, S., Capanoglu, E., Tikunov, Y., Bino, R. J., Boyacioglu, D., Hall, R. D.,Vervoort, J., and de Vos, C. H. R. (2007a). Tissue specialization at the metabolitelevel is perceived during the development of tomato fruit. J. Exp. Bot. 58, 4131–4146.
Moco, S., Vervoort, J., de Vos, C. H. R., and Bino, R. J. (2007b). Metabolomics technol-ogies and metabolite identification. Trends Anal. Chem. 26, 855–866.
Moco, S., Schneider, B., and Vervoort, J. (2009). Plant micrometabolomics: The analysis ofendogenous metabolites present in a plant cell or tissue. J. Proteome Res. 8, 1694–1703.
Moing, A., Maucourt, M., Renaud, C., Gaudillere, M., Brouquisse, R., Lebouteiller, B.,Gousset-Dupont, A., Vidal, J., Granot, D., Denoyes-Rothan, B., Lerceteau-Kohler, E.,and Rolin, D. (2004). Quantitative metabolic profiling by 1-dimensional H-1-NMRanalyses: Application to plant genetics and functional genomics. Funct. Plant Biol. 31,889–902.
Muth, D., Marsden-Edwards, E., Kachlicki, P., and Stobiecki, M. (2008). Differentiation ofisomeric malonylated flavonoid glyconjugates in plant extracts with UPLC-ESI/MS/MS. Phytochem. Anal. 19, 444–452.
Nikiforova, V. J., Gakiere, B., Kempa, S., Adamik, M., Willmitzer, L., Hesse, H., andHoefgen, R. (2004). Towards dissecting nutrient metabolism in plants: A systems biologycase study on sulphur metabolism. J. Exp. Bot. 55, 1861–1870.
Nothmann, J., and Rylski, I. (1983). Effects of floral position and cluster size on fruit-development in eggplant. Scientia Hortic. 19, 19–24.
Pereira, G. E., Gaudillere, J. P., van Leeuwen, C., Hilbert, G., Lavialle, O., Maucourt, M.,Deborde, C., Moing, A., and Rolin, D. (2005). 1H NMR and chemometrics tocharacterize mature grape berries in four wine-growing areas in Bordeaux, France.J. Agric. Food Chem. 53, 6382–6389.
Pereira, G. E., Gaudillere, J. P., Pieri, P., Hilbert, G., Maucourt, M., Deborde, C.,Moing, A., and Rolin, D. (2006). Microclimate influence on mineral and metabolicprofiles of grape berries. J. Agric. Food Chem. 54, 6765–6775.

334 J. William Allwood et al.
Author's personal copy
Phillips, K. M., Wunderlich, K. M., Holden, J. M., Exler, J., Gebhardt, S. E.,Haytowitz, D. B., Beecher, G. R., and Doherty, R. F. (2005). Stability of 5-methylte-trahydrofolate in frozen fresh fruits and vegetables. Food Chem. 92, 587–595.
Redestig, H., Szymanski, J., Hirai, M. Y., Selbig, J., Willmitzer, L., Nikoloski, Z., andSaito, K. (2011). Data integration, metabolic networks and systems biology.In “The Biology of Plant Metabolomics,” (R. D. Hall, eds.), Blackwell-Wiley,London (Chapter 9, 261–316).
Rocke, D. M. (2004). Design and analysis of experiments with high throughput biologicalassay data. Semin. Cell Dev. Biol. 15, 703–713.
Rodrigues, J. E. A., Erny, G. L., Barros, A. S., Esteves, V. I., Brandao, T., Ferreira, A. A.,Cabrita, E., and Gil, A. M. (2010). Quantification of organic acids in beer by nuclearmagnetic resonance (NMR)-based methods. Anal. Chim. Acta 674, 166–175.
Roessner, U., Wagner, C., Kopka, J., Trethewey, R. N., and Willmitzer, L. (2000).Simultaneous analysis of metabolites in potato tuber by gas chromatography-mass spec-trometry. Plant J. 23, 131–142.
Roessner, U., Luedemann, A., Brust, D., Fiehn, O., Linke, T., Willmitzer, L., andFernie, A. R. (2001a). Metabolic profiling allows comprehensive phenotyping of geneti-cally or environmentally modified plant systems. Plant Cell 13, 11–29.
Roessner, U., Willmitzer, L., and Fernie, A. R. (2001b). High-resolution metabolic phe-notyping of genetically and environmentally diverse plant systems—Identification ofphenocopies. Plant Physiol. 127, 749–764.
Roessner, U., Willmitzer, L., and Fernie, A. R. (2002). Metabolic profiling and biochemicalphenotyping of plant systems. Plant Cell Rep. 21, 189–196.
Ross, A., Schlotterbeck, G., Dieterle, F., and Senn, H. (2007). NMR spectroscopy techni-ques for application to metabonomics. In “The Handbook of Metabonomics and Meta-bolomics,” (J. C. Lindon, J. K. Nicholson, and E. Holmes, eds.), pp. 55–112. Elsevier,Oxford, UK.
Ryan, D., and Robards, K. (2006). Analytical chemistry considerations in plant metabolo-mics. Sep. Purif. Rev. 35, 319–356.
Saito, K., and Matsuda, F. (2010). Metabolomics for functional genomics, systems biologyand biotechnology. Annu. Rev. Plant Biol. 61, 463–489.
Saito, K., Dixon, R., and Willmitzer, L. (eds.), (2006). Plant Metabolomics, Springer-Verlag, Berlin.
Salminem, J. P. (2003). Effects of sample drying and storage, and choice of extraction solventand analysis method on the yield of birch leaf hydrolyzable tannins. J. Chem. Ecol. 29,1289–1305.
Sanchez, D. H., Siahpoosh, M. R., Roessner, U., Udvardi, M. K., and Kopka, J. (2008).Plant metabolomics reveals conserved and divergent metabolic responses to salinity.Physiol. Plant. 132, 209–219.
Sanchez, D. H., Szymanski, J., Erban, A., Udvardi, M. K., and Kopka, J. (2010). Mining forrobust transcriptional and metabolic responses to long-term salt stress: A case study on themodel legume Lotus japonicus. Plant Cell Environ. 33, 468–480.
Sauter, H., Lauer, M., and Fritsch, H. (1988). Metabolite profiling of plants—A newdiagnostic technique. Abstr. Pap. Am. Chem. Soc. 195, 129.
Schad, M., Mungur, R., Fiehn, O., and Kehr, J. (2005). Metabolic profiling of lasermicrodissected vascular bundles of Arabidopsis thaliana. Plant Methods 1, 2.
Schauer, N., Zamir, D., and Fernie, A.R. (2005).Metabolic profiling of leaves and fruit of wildspecies tomato: A survey of the Solanum lycopersicum complex. J. Exp. Bot. 56, 297–307.
Schauer, N., Semel, Y., Roessner, U., Gur, A., Balbo, I., Carrari, F., Pleban, T., Perez-Melis, A., Bruedigam, C., Kopka, J., Willmitzer, L., Zamir, D., et al. (2006). Compre-hensive metabolic profiling and phenotyping of interspecific introgression lines fortomato improvement. Nat. Biotechnol. 24, 447–454.

Plant Metabolomics and Its Potential for Systems Biology Research 335
Author's personal copy
Schripsema, J. (2010). Application of NMR in plant metabolomics: Techniques, problemsand prospects. Phytochem. Anal. 21, 14–21.
Stobiecki, M., Skirycz, A., Kerhoas, L., Kachliki, P., Muth, D., Einhorn, J., and Mueller-Roeber, B. (2006). Profiling of phenolic glycosidic conjugates in leaves of Arabidopsisthaliana using LC/MS. Metabolomics 2, 197–219.
Strehmel, N., Hummel, J., Erban, A., Strassburg, K., and Kopka, J. (2008). Estimation ofretention index thresholds for compound matching using routine gas chromatography-mass spectrometry based metabolite profiling experiments. J. Chromatogr. B 871,182–190.
Sulpice, R., Sienkiewicz-Porzucek, A., Osorio, S., Krahnert, I., Stitt, M., Fernie, A. R., andNunes-Nesi, A. (2010). Mild reductions in cytosolic NADP-dependent isocitrate dehy-drogenase activity result in lower amino acid contents and pigmentation without impact-ing growth. Amino Acids 39, 1055–1066.
Sumner, L. W. (2006). Current status and forward-looking thoughts on LC/MS metabo-lomics. In “Plant Metabolomics,” (K. Saito, R. Dixon, and L. Willmitzer, eds.),Springer-Verlag, Berlin.
Sumner, L. W., Yang, D. S., Bench, B. J., Watson, B. S., Li, C., and Jones, A. D. (2011).Spatially—resolved metabolomics—challenges for the future. In “The Biology of PlantMetabolomics,” (R. D. Hall, ed.). Blackwell-Wiley, London. (Chapter 11, 343-366).
Tholl, D., Boland, W., Hansel, A., Loreto, F., Rose, U. S. R., and Schnitzler, J. P. (2006).Practical approaches to plant volatile analysis. Plant J. 45, 540–560.
Tikunov, Y., Lommen, A., de Vos, C. H. R., Verhoeven, H. A., Bino, R. J., Hall, R. D.,and Bovy, A. G. (2005). A novel approach for nontargeted data analysis for metabolo-mics. Large-scale profiling of tomato fruit volatiles. Plant Physiol. 139, 1125–1137.
Tikunov, Y., de Vos, C. H. R., Gonzalez-Paramas, A. M., Hall, R. D., and Bovy, A. G.(2010). A role for differential glycoconjugation in the emission of phenylpropanoidvolatiles from tomato fruit discovered using a metabolic data fusion approach. PlantPhysiol. 152, 55–70.
Timischl, B., Dettmer, K., Kaspar, H., Thieme, M., and Oefner, P. J. (2008). Developmentof a quantitative, validated capillary electrophoresis-time of flight–mass spectrometrymethod with integrated high-confidence analyte identification for metabolomics. Electro-phoresis 29, 2203–2214.
Tolstikov, V. V., and Fiehn, O. (2002). Analysis of highly polar compounds of plant origin:Combination of hydrophilic interaction chromatography and electrospray ion mass trapspectrometry. Anal. Biochem. 301, 298–307.
Trethewey, R. N. (2004). Metabolite profiling as an aid to metabolic engineering in plants.Curr. Opin. Plant Biol. 7, 196–201.
Trethewey, R. N., Krotzky, A. J., andWillmitzer, L. (1999). Metabolic profiling: A Rosettastone for genomics? Curr. Opin. Plant Biol. 2, 83–85.
Trygg, J., Gullberg, J., Johansson, A. I., Jonsson, P., and Moritz, T. (2006). Chemometrics inmetabolomics—An introduction. In “Plant Metabolomics,” (K. Saito, R. Dixon, andL. Willmitzer, eds.), pp. 117–128. Springer-Verlag, Berlin.
Urbanczyk-Wochniak, E., and Fernie, A. R. (2005). Metabolic profiling reveals alterednitrogen nutrient regimes have diverse effects on the metabolism of hydroponically-grown tomato (Solanum lycopersicum) plants. J. Exp. Bot. 56, 309–321.
Urbanczyk-Wochniak, E., Baxter, C., Kolbe, A., Kopka, J., Sweetlove, L. J., andFernie, A. R. (2005). Profiling of diurnal patterns of metabolite and transcript abundancein potato (Solanum tuberosum) leaves. Planta 221, 891–903.
van Dam, N. M., and van der Meijden, E. (2011). A role for metabolomics in plant ecology.In “The Biology of Plant Metabolomics,” (R. D. Hall, ed.). Blackwell-Wiley, London.(Chapter 4, 87–108).

336 J. William Allwood et al.
Author's personal copy
van der Hooft, J. J., Vervoort, J., Bino, R. J., Beekwilder, J., and de Vos, R. C. (2011).Polyphenol identification based on systematic and robust high-resolution accurate massspectrometry fragmentation. Anal. Chem. 83, 409–416.
verhoeven, H. A., de Vos, C. H. R., Bino, R. J., and Hall, R. D. (2006). Plant metabolomicsstrategies based upon quadrupole time of flight mass spectrometry. In “Plant Metabolo-mics,” (K. Saito, R. Dixon, and L. Willmitzer, eds.), pp. 33–48. Springer-Verlag, Berlin.
von Roepenack-Lahaye, E., Degenkolb, T., Zerjeski, M., Franz, M., Roth, U.,Wessjohann, L., Schmidt, J., Scheel, D., and Clemens, S. (2004). Profiling of Arabidopsissecondary metabolites by capillary liquid chromatography coupled to electrospray ioni-zation quadrupole time-of-flight mass spectrometry. Plant Physiol. 134, 548–559.
Vorst, O., de Vos, C. H. R., Lommen, A., Staps, R. V., Visser, R. G. F., Bino, R. J., andHall, R. D. (2005). A non-directed approach to the differential analysis of multipleLC-MS-derived metabolic profiles. Metabolomics 1, 169–180.
Wagner, G. (1995). Basic approaches and methods for quality assurance and quality controlin sample collection and storage for environmental monitoring. Sci. Total Environ. 176,63–71.
Wagner, C., Sefkow, M., and Kopka, J. (2003). Construction and application of a massspectral and retention time index database generated from plant GC/EI-TOFMS metab-olite profiles. Phytochemistry 62, 887–900.
Ward, J. L., and Beale, M. H. (2006). NMR spectroscopy in plant metabolomics. In “PlantMetabolomics,” (K. Saito, R. Dixon, and L. Willmitzer, eds.), pp. 81–92. Springer-Verlag, Berlin.
Ward, J. L., Harris, C., Lewis, J., and Beale, M. H. (2003). Assessment of 1H-NMRspectroscopy and multivariate analysis as a technique for metabolite fingerprinting ofArabidopsis thaliana. Phytochemistry 62, 949–957.
Ward, J. L., Forcat, S., Beckmann, M., Bennett, M., Miller, S. J., Baker, J. M.,Hawkins, N. D., Vermeer, C. P., Lu, C. A., Lin, W. C., Truman, W. M.,Beale, M. H., et al. (2010a). The metabolic transition during disease following infectionof Arabidopsis thaliana by Pseudomonas syringae pv. tomato. Plant J. 63, 443–457.
Ward, J. L., Baker, J. M., Miller, S. J., Deborde, C., Maucourt, M., Biais, B., Rolin, D.,Moing, A., Moco, S., Vervoort, J., Lommen, A., Schafer, H., et al. (2010b). An inter-laboratory comparison demonstrates that [1H]-NMR metabolite fingerprinting is arobust technique for collaborative plant metabolomic data collection. Metabolomics 6,263–273.
Weckwerth, W. (ed.), (2007). Metabolomics: Methods and Protocols. Methods in Molecu-lar Biology, Humana Press, Totowa, USAVol. 358.
Yonekura-Sakakibara, K., Tohge, T., Matsuda, F., Nakabayashi, R., Takayama, H.,Niida, R., Watanabe-Takahashi, A., Inoue, E., and Saito, K. (2008). Comprehensiveflavonol profiling and transcriptome coexpression analysis leading to decodinggene-metabolite correlations in Arabidopsis. Plant Cell 20, 2160–2176.