planning and development:countywide groundwater … county office: ... vanderbilt mansion...
TRANSCRIPT


&-
&-
!(
!(
!(
!(
!(
!(!(!(
!( !(
!(
!(
!(
!(
!(
!(
!(
!(
!<
!<
!<!<
!<!<!<
!<
!< !< !<
!<!(
!(
!(
!(!(
!(!(
!(!(!(
!(
!(
#19: Sawkill CreekRoute 9Red Hook, NY
#5: Sepascot FarmRhinebeck, NY
#20: Landsmankill CreekRhinebeck, NY
#11: Town of Milan Highway GarageMilan, NY
#9: Pulver ResidencePine Plains, NY
#15: Upper Wappinger Creek @Town of Clinton Line
#17: East Branck Wappinger Creek @Hibernia Road Bridge
#13: Institute of Ecosystem StudiesWarner ResidenceMillbrook, NY
#16: Little Wappinger CreekBelow Salt Point DamSalt Point Turnpike
#4: Hahn FarmSalt Point Turnpike
#1: Vanderbilt Mansion
#18: Crum Elbow CreekRoute 41Hyde Park, NY
#14: Wappinger Creek @Route 44, Behind Town HallPleasant Valley, NY
#8: Tanner ResidenceLa Grange, NY
#13: Wappinger Creek @Red Oaks MillUSGS Gauging Station
#10: High Meadows Co-OpDover Plains, NY
#4:Ten Mile RiverTen Mile River DriveDover Plains, NY
#2: Swamp River @Route 6Old Post Road
#1: Ten Mile River @NY/Conn BorderUSGS Gauging StationOld Forge Road
#11: Fishkill Creek @Union Vale/Beekman LineRoute 55
#6: Deefield Ponds DevelopmentPawling, NY
#9: Sprout Creek near La GrangeBridge on Route 376
#10: Fishkill Creek @E. Fishkill/Beekman Line Phillips Road
#8: Sprout Creak near Fishkill Mountainview Road
#6: Webatuk Creek @Leedsville Road
#5: Amenia Brook @Wassaic
#2: DCWWA Pump HouseStaatsburgh, NY
#7: Boss ResidenceEast Fishkill, NY
#7 Fishkill Creek @ BeaconUSGS Gauging Station
#21: East Fishkill LandfillEast Fishkill, NY
Created by:
Date:
Scale:
Project #:
CHAZEN ENGINEERING & LAND SURVEYING CO., P.C.Dutchess County Office:21 Fox StreetPoughkeepsie, New York 12601Phone: (845) 454-3980
Orange County Office:263 Route 17KNewburgh, New York 12550Phone: (845) 567-1133
Capital District Office:20 Gurley AvenueTroy, New York 12182Phone: (518) 235-8050
North Country Office:110 Glen StreetGlens Falls, New York 12801Phone: (518) 812-0513
This map is a product of The Chazen Companies. It should be used for reference purposes only. Reasonable efforts have been made to ensure the accuracyof this map. The Chazen Companies expressly disclaims any responsibilities or liabilities from the use of this map for any purpose other than its intended use.
Engineers/SurveyorsPlannersEnvironmental ScientistsGIS Consultants
STFRUM
July 2006
40130.00
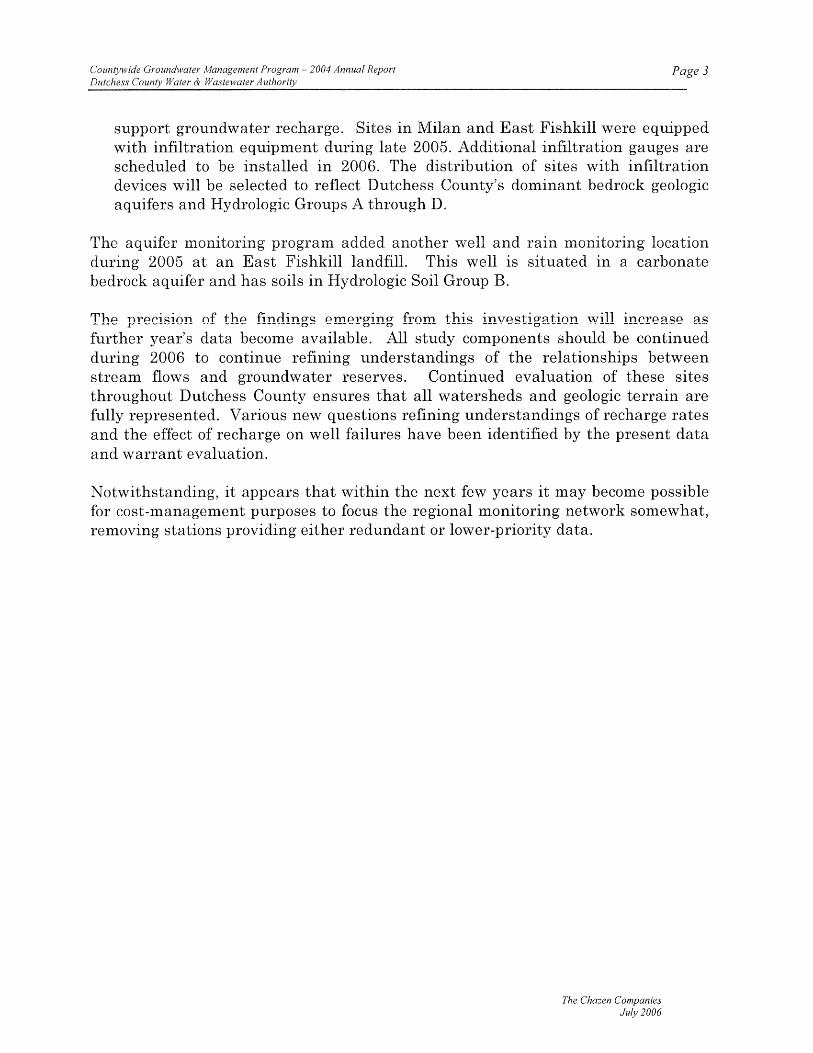
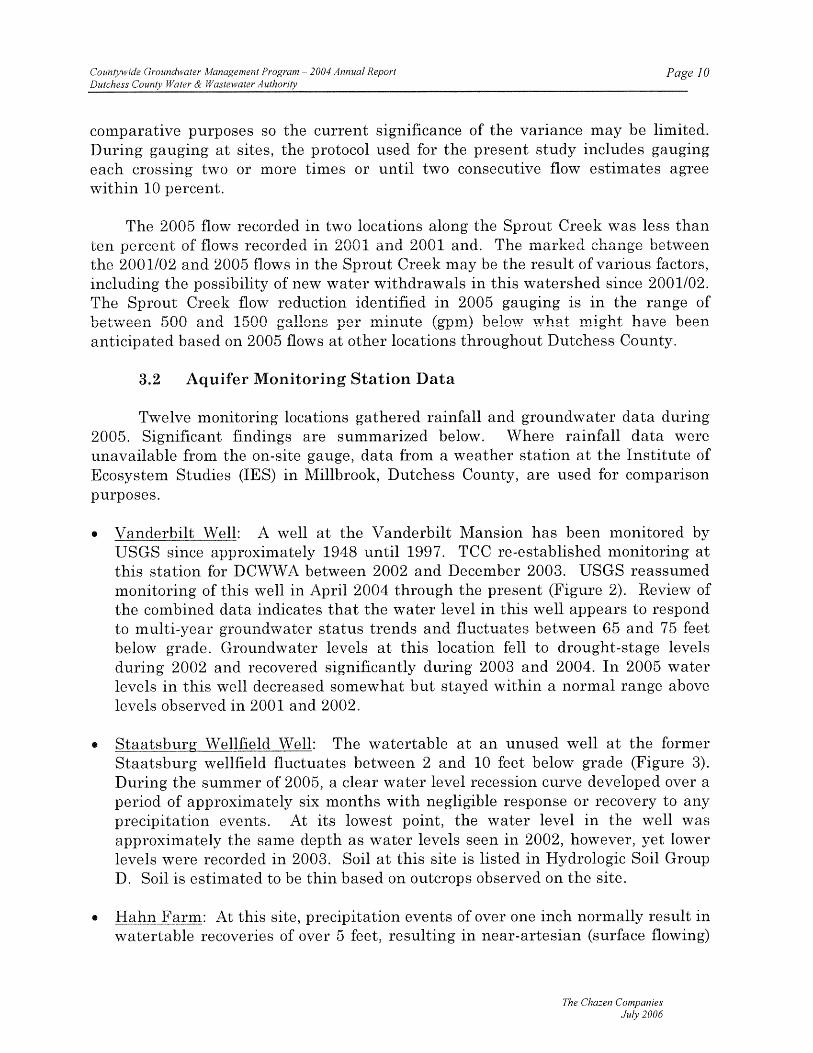
´FIGURE 1 - WATER RESOURCES
MONITORINGPROGRAM LOCATION MAP
Dutchess County Water & Wastewater Authority 1 inch equals 3.5 miles
Notes:
Sub-watersheds that have a purple color scheme fall within the Ten Mile River Watershed.Sub-watersheds that have a green color scheme fall within the Fishkill Creek Watershed.Sub-watersheds that have a red color scheme fall within the Wappingers Creek Watershed.
Blue lines are stream segments, where available
Legend!( Rain Gauge!< Monitoring Well!( Stream Gauge&- Infiltration Gauge
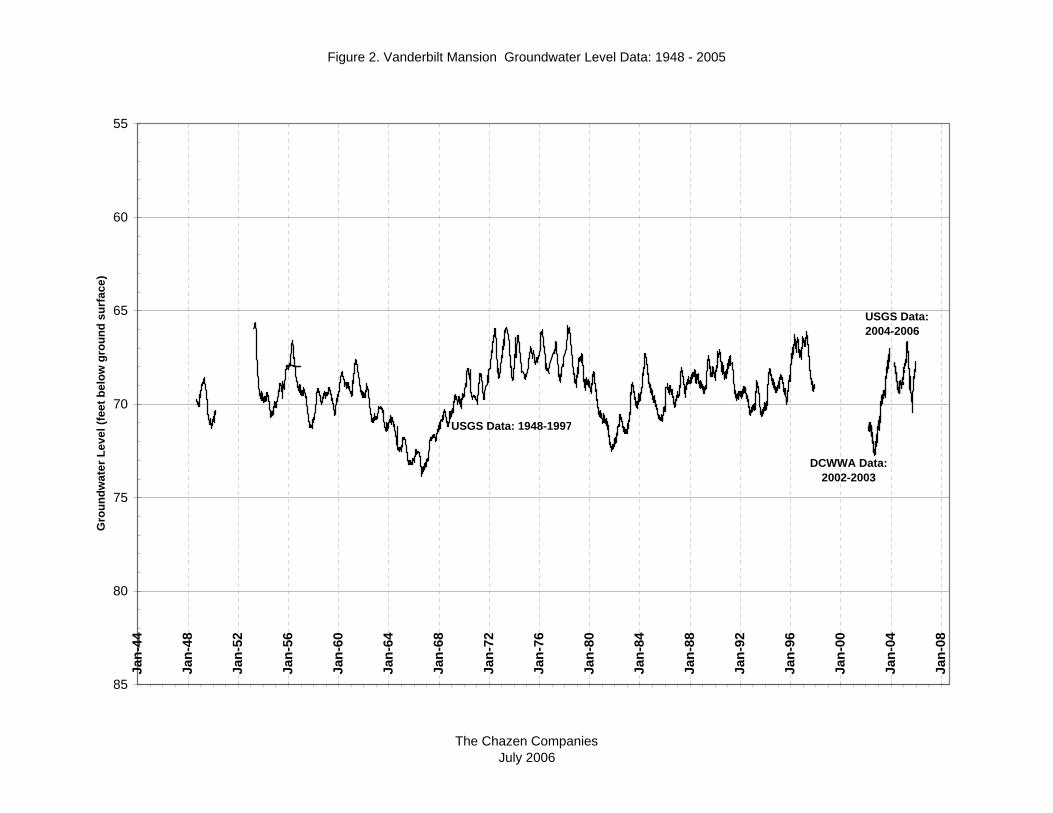
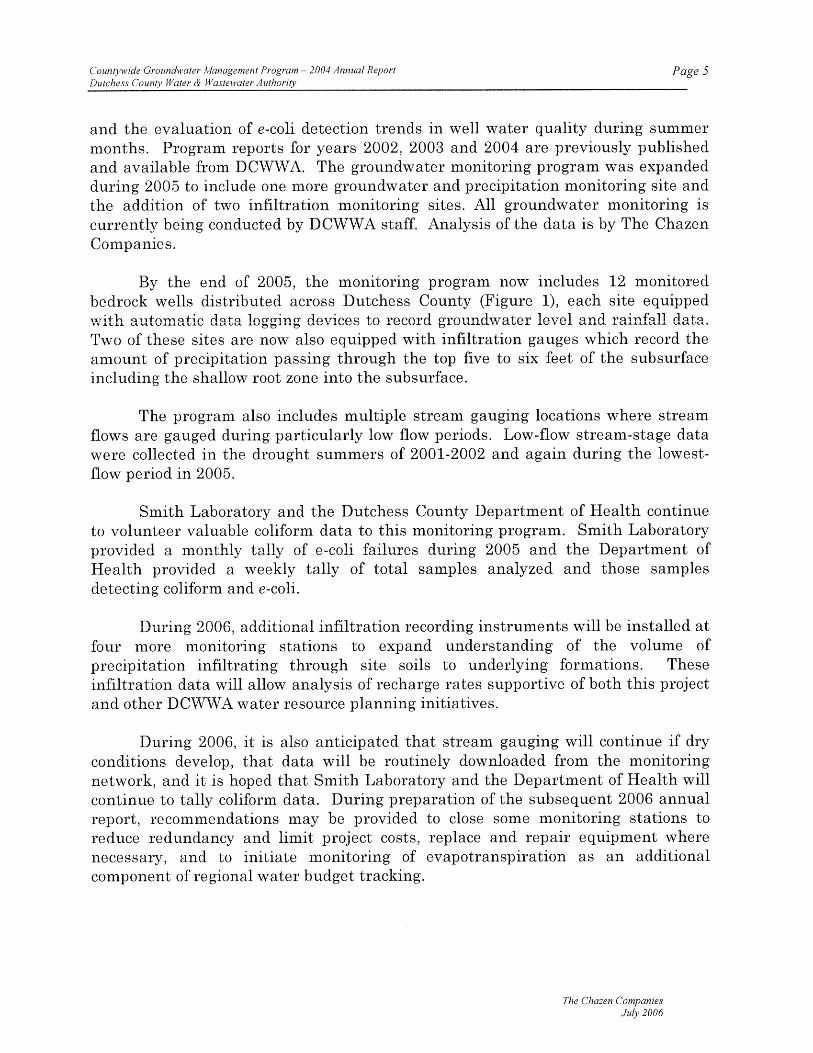
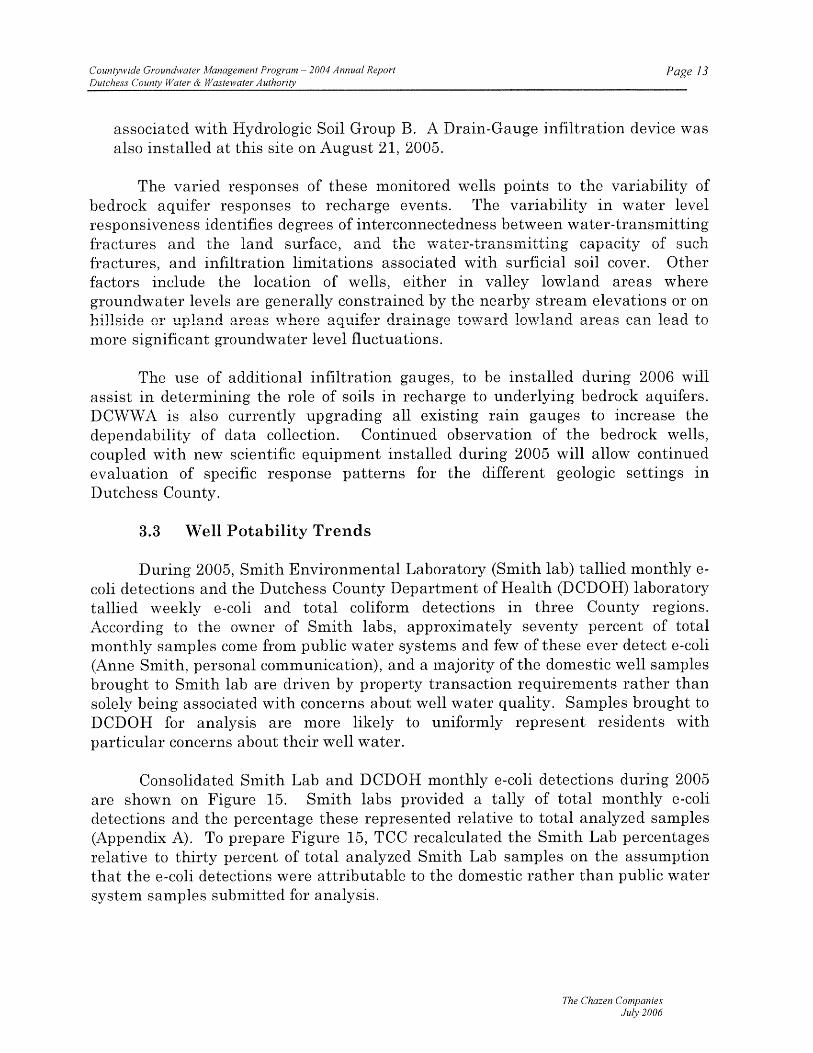
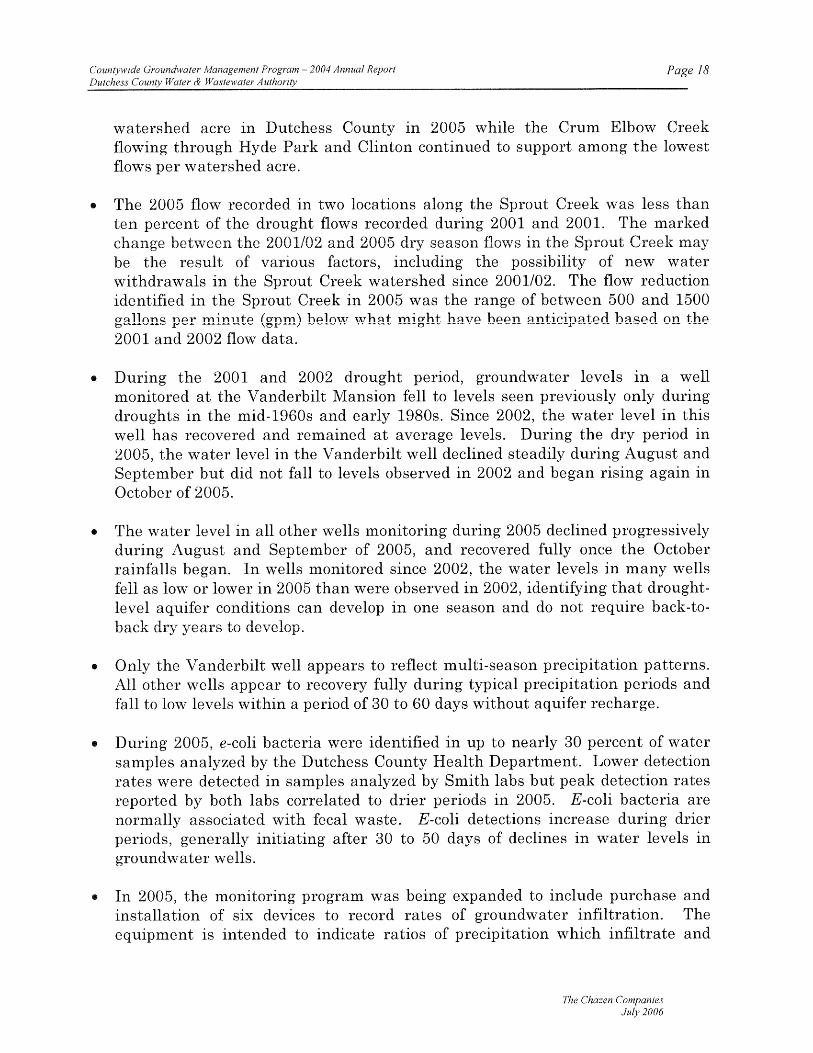
Figure 2. Vanderbilt Mansion Groundwater Level Data: 1948 - 2005
The Chazen CompaniesJuly 2006
55
60
65
70
75
80
85
Jan-4
4
Jan-4
8
Jan-5
2
Jan-5
6
Jan-6
0
Jan-6
4
Jan-6
8
Jan-7
2
Jan-7
6
Jan-8
0
Jan-8
4
Jan-8
8
Jan-9
2
Jan-9
6
Jan-0
0
Jan-0
4
Jan-0
8
Grou
ndwa
ter Le
vel (f
eet b
elow
grou
nd su
rface
)
USGS Data: 1948-1997
DCWWA Data: 2002-2003
USGS Data: 2004-2006
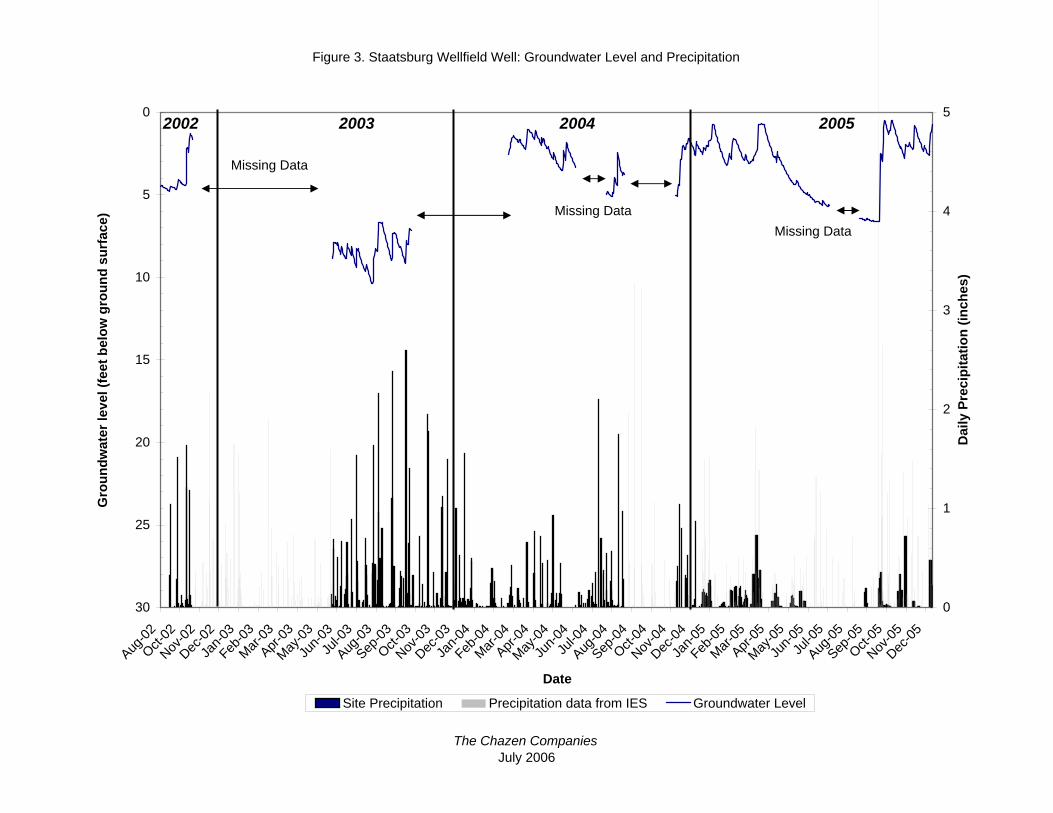
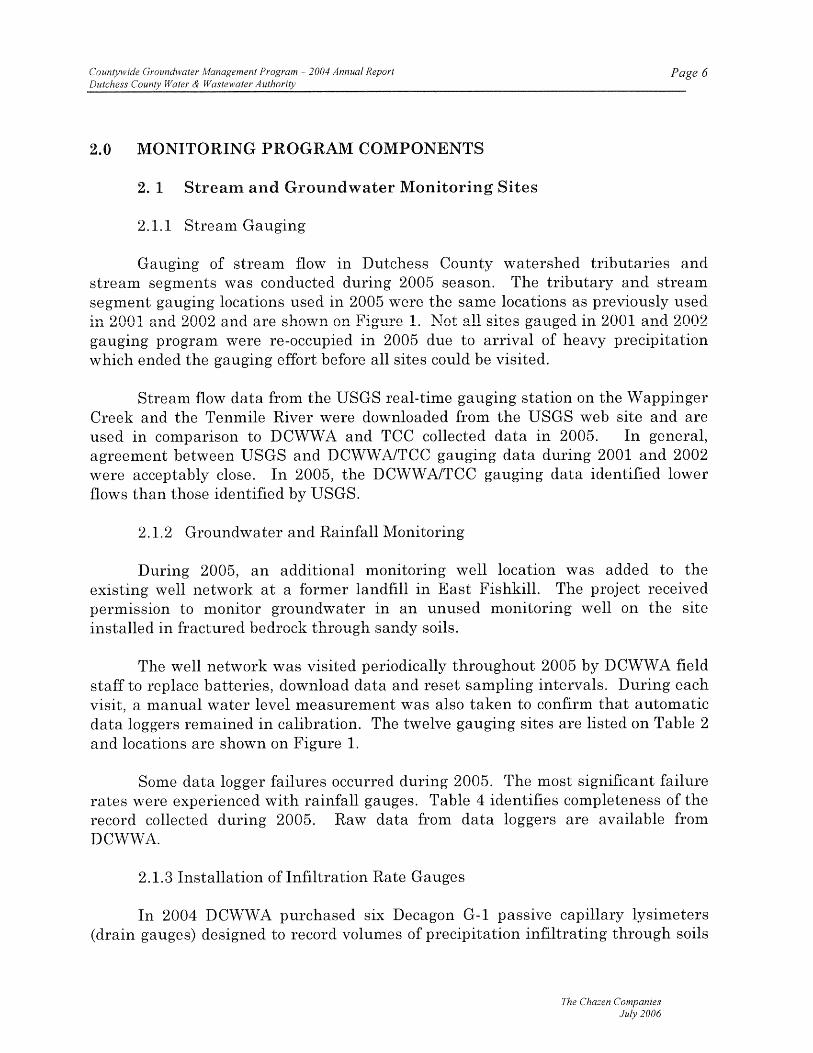
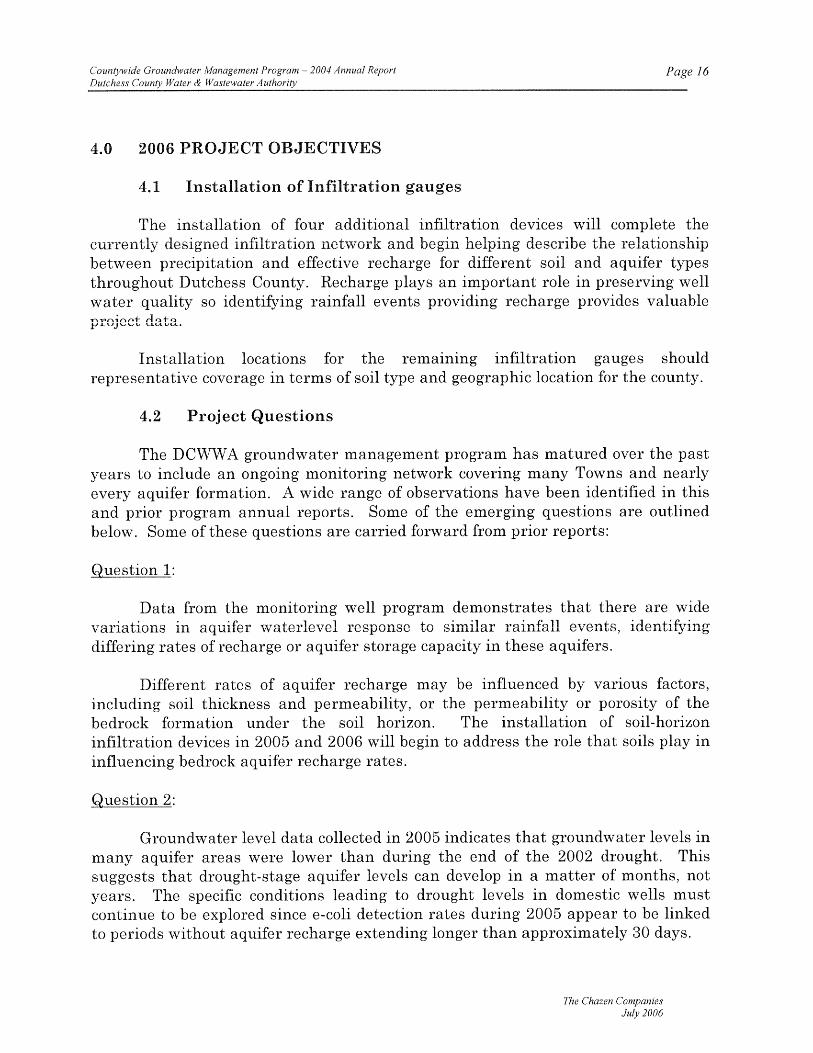
Figure 3. Staatsburg Wellfield Well: Groundwater Level and Precipitation
The Chazen CompaniesJuly 2006
0
5
10
15
20
25
30
Aug-02
Oct-02
Nov-02
Dec-02
Jan-03
Feb-03
Mar-03
Apr-03
May-03
Jun-03Jul-03
Aug-03
Sep-03
Oct-03
Nov-03
Dec-03
Jan-04
Feb-04
Mar-04
Apr-04
May-04
Jun-04Jul-04
Aug-04
Sep-04
Oct-04
Nov-04
Dec-04
Jan-05
Feb-05
Mar-05
Apr-05
May-05
Jun-05Jul-05
Aug-05
Sep-05
Oct-05
Nov-05
Dec-05
Grou
ndwa
ter le
vel (f
eet b
elow
grou
nd su
rface
)
0
1
2
3
4
5
Date
Daily
Prec
ipitat
ion (in
ches
)
Site Precipitation Precipitation data from IES Groundwater Level
Missing Data
Missing Data
2003 20042002
Missing Data
2005
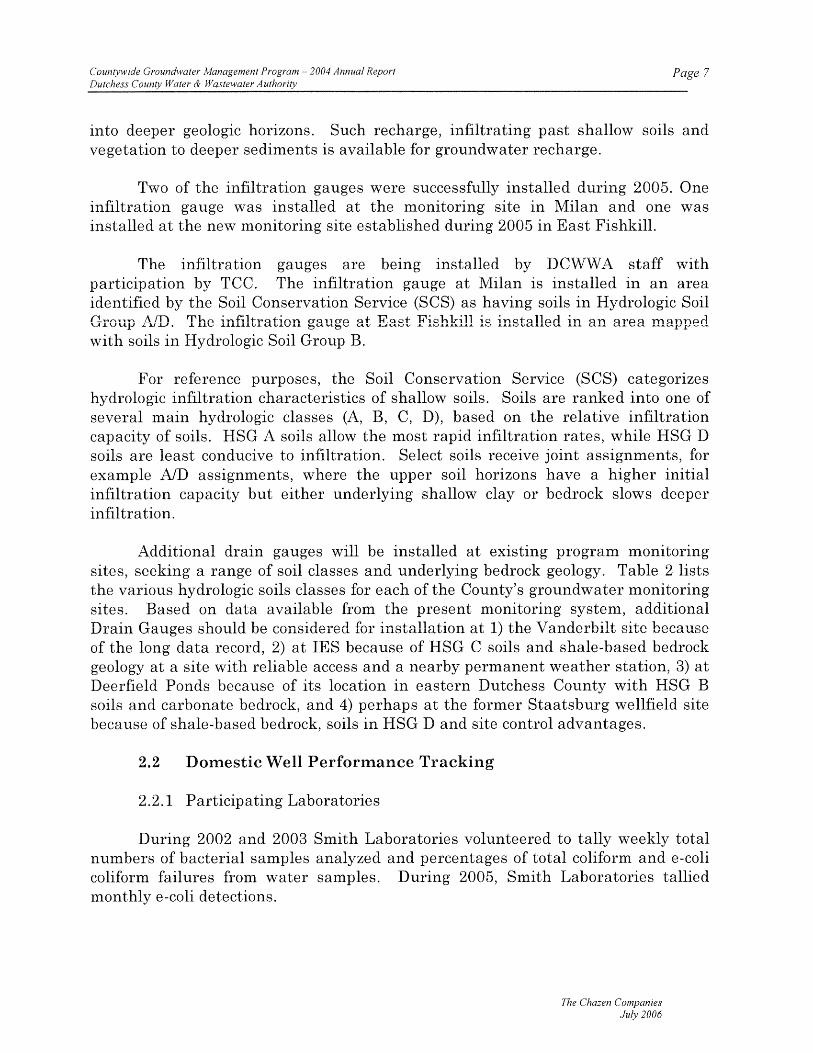
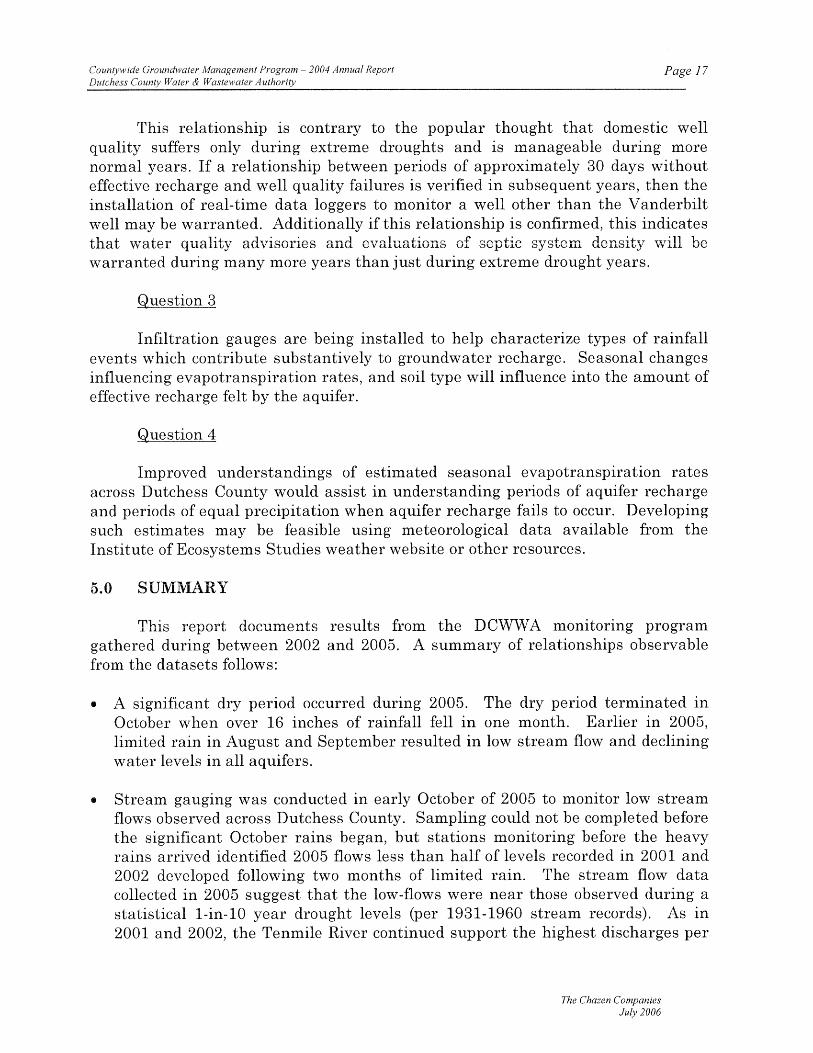
Figure 4. Hahn Farm: Groundwater Level and Precipitation
The Chazen CompaniesJuly 2006
0
5
10
15
20
25
30
Aug-02
Sep-02
Oct-02
Nov-02
Dec-02
Jan-03
Feb-03
Mar-03
Apr-03
May-03
Jun-03Jul-03
Aug-03
Sep-03
Oct-03
Nov-03
Dec-03
Jan-04
Feb-04
Mar-04
Apr-04
May-04
Jun-04Jul-04
Aug-04
Sep-04
Oct-04
Nov-04
Dec-04
Jan-05
Feb-05
Mar-05
Apr-05
May-05
Jun-05Jul-05
Aug-05
Sep-05
Oct-05
Nov-05
Dec-05
Grou
ndwa
ter le
vel (f
eet b
elow
grou
nd su
rface
)
0
1
2
3
4
5
Date
Daily
Prec
ipitat
ion (in
ches
)
Site Precipitation Precipitation data from IES Groundwater Level
Data Missing
2003 20042002 2005

Figure 5. Sepascot Property: Groundwater Level and Precipitation
The Chazen CompaniesJuly 2006
0
5
10
15
20
25
30
Aug-02
Sep-02
Oct-02
Nov-02
Dec-02
Jan-03
Feb-03
Mar-03
Apr-03
May-03
Jun-03Jul-03
Aug-03
Sep-03
Oct-03
Nov-03
Dec-03
Jan-04
Feb-04
Mar-04
Apr-04
May-04
Jun-04Jul-04
Aug-04
Sep-04
Oct-04
Nov-04
Dec-04
Jan-05
Feb-05
Mar-05
Apr-05
May-05
Jun-05Jul-05
Aug-05
Sep-05
Oct-05
Nov-05
Dec-05
Grou
ndwa
ter le
vel (f
eet b
elow
grou
nd su
rface
)
0
1
2
3
4
5
Date
Daily
Prec
ipitat
ion (in
ches
)
Site Precipitation Precipitation data from IES Groundwater Level
Missing Data
2002 2003 2004 2005
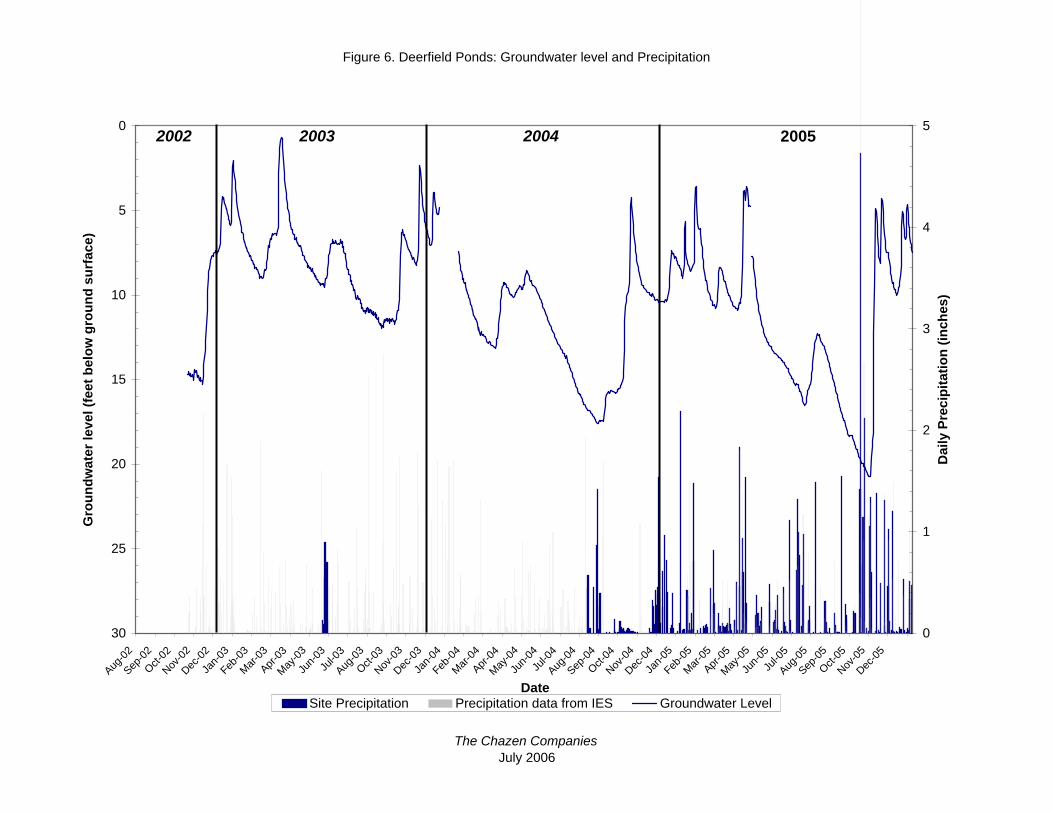
Figure 6. Deerfield Ponds: Groundwater level and Precipitation
The Chazen CompaniesJuly 2006
0
5
10
15
20
25
30
Aug-02
Sep-02
Oct-02
Nov-02
Dec-02
Jan-03
Feb-03
Mar-03
Apr-03
May-03
Jun-03Jul-03
Aug-03
Oct-03
Nov-03
Dec-03
Jan-04
Feb-04
Mar-04
Apr-04
May-04
Jun-04Jul-04
Aug-04
Sep-04
Oct-04
Nov-04
Dec-04
Jan-05
Feb-05
Mar-05
Apr-05
May-05
Jun-05Jul-05
Aug-05
Sep-05
Oct-05
Nov-05
Dec-05
Grou
ndwa
ter le
vel (f
eet b
elow
grou
nd su
rface
)
0
1
2
3
4
5
Date
Daily
Prec
ipitat
ion (in
ches
)
Site Precipitation Precipitation data from IES Groundwater Level
2002 2003 2004 2005

Figure 7. IES Residential Well: Groundwater Level and Precipitation
The Chazen CompaniesJuly 2006
0
5
10
15
20
25
30
Aug-02
Sep-02
Oct-02
Nov-02
Dec-02
Jan-03
Feb-03
Mar-03
Apr-03
May-03
Jun-03Jul-03
Aug-03
Sep-03
Oct-03
Nov-03
Dec-03
Jan-04
Feb-04
Mar-04
Apr-04
May-04
Jun-04Jul-04
Aug-04
Sep-04
Oct-04
Nov-04
Dec-04
Jan-05
Feb-05
Mar-05
Apr-05
May-05
Jun-05Jul-05
Aug-05
Sep-05
Oct-05
Nov-05
Dec-05
Grou
ndwa
ter le
vel (f
eet b
elow
grou
nd su
rface
)
0
1
2
3
4
5
Daily
Prec
ipitat
ion (in
ches
)
Site Precipitation Groundwater Level
Missing Data
2002 2003 2004
Missing Data
2005
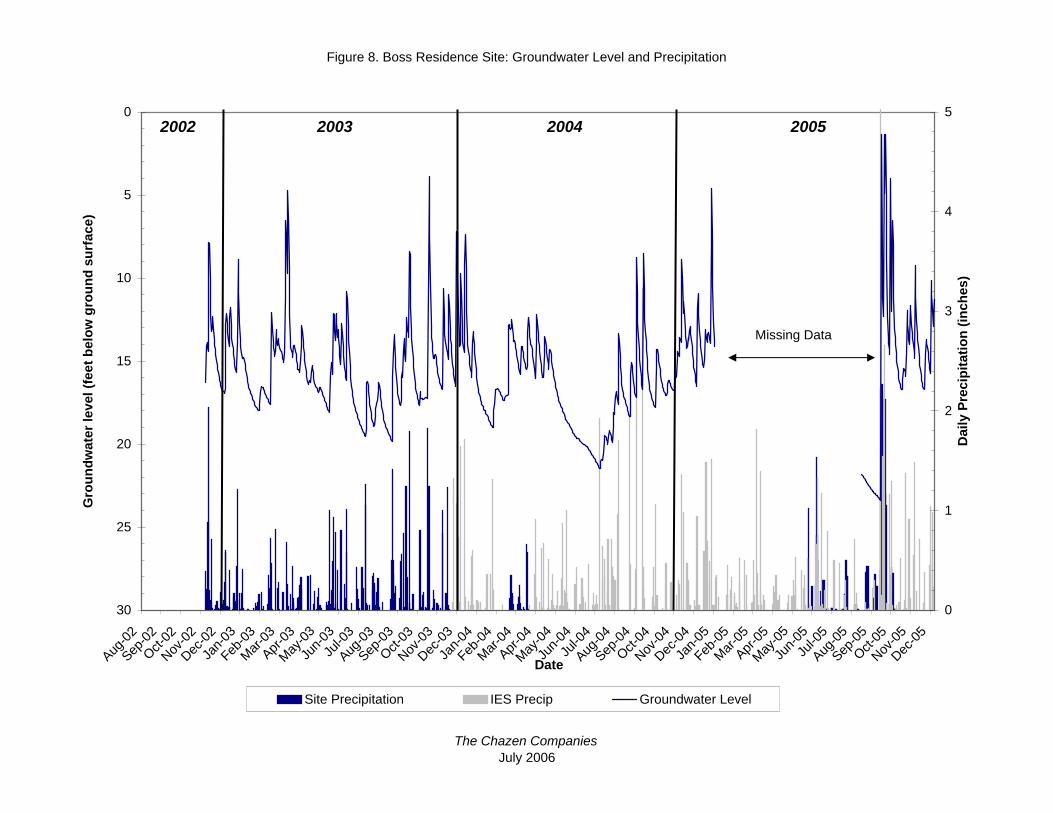
Figure 8. Boss Residence Site: Groundwater Level and Precipitation
The Chazen CompaniesJuly 2006
0
5
10
15
20
25
30
Aug-02
Sep-02
Oct-02
Nov-02
Dec-02
Jan-03
Feb-03
Mar-03
Apr-03
May-03
Jun-03Jul-03
Aug-03
Sep-03
Oct-03
Nov-03
Dec-03
Jan-04
Feb-04
Mar-04
Apr-04
May-04
Jun-04Jul-04
Aug-04
Sep-04
Oct-04
Nov-04
Dec-04
Jan-05
Feb-05
Mar-05
Apr-05
May-05
Jun-05Jul-05
Aug-05
Sep-05
Oct-05
Nov-05
Dec-05
Grou
ndwa
ter le
vel (f
eet b
elow
grou
nd su
rface
)
0
1
2
3
4
5
Date
Daily
Prec
ipitat
ion (in
ches
)
Site Precipitation IES Precip Groundwater Level
2002 2003 2004 2005
Missing Data

Figure 9. Tanner Residence: Groundwater Level and Precipitation
The Chazen CompaniesJuly 2006
0
5
10
15
20
25
30
Aug-02
Sep-02
Oct-02
Nov-02
Dec-02
Jan-03
Feb-03
Mar-03
Apr-03
May-03
Jun-03Jul-03
Aug-03
Sep-03
Oct-03
Nov-03
Dec-03
Jan-04
Feb-04
Mar-04
Apr-04
May-04
Jun-04Jul-04
Aug-04
Sep-04
Oct-04
Nov-04
Dec-04
Jan-05
Feb-05
Mar-05
Apr-05
May-05
Jun-05Jul-05
Aug-05
Sep-05
Oct-05
Nov-05
Dec-05
Grou
ndwa
ter le
vel (f
eet b
elow
grou
nd su
rface
)
0
1
2
3
4
5
Date
Daily
Prec
ipitat
ion (in
ches
)
Site Precipitation Precipitation data from IES Groundwater Level
2002 2003 2004 2005

Figure 10. Pulver Residence: Groundwater Level and Precipitation
The Chazen CompaniesJuly 2006
0
20
40
60
80
Aug-02
Sep-02
Oct-02
Nov-02
Dec-02
Jan-03
Feb-03
Mar-03
Apr-03
May-03
Jun-03Jul-03
Aug-03
Sep-03
Oct-03
Nov-03
Dec-03
Jan-04
Feb-04
Mar-04
Apr-04
May-04
Jun-04Jul-04
Aug-04
Sep-04
Oct-04
Nov-04
Dec-04
Jan-05
Feb-05
Mar-05
May-05
Jun-05Jul-05
Aug-05
Sep-05
Oct-05
Nov-05
Dec-05
Grou
ndwa
ter le
vel (f
eet b
elow
grou
nd su
rface
)
0
1
2
3
4
5
Daily
Prec
ipitat
ion (in
ches
)
Site Precipitation Precipitation data from IES Groundwater Level
2003 20042002 2005
Detection Limit
Detection Limit

Figure 11: Dover High Meadows: Groundwater Level and Precipitation
The Chazen CompaniesJuly 2006
40
45
50
55
60
65
70
Aug-02
Sep-02
Oct-02
Nov-02
Dec-02
Jan-03
Mar-03
Apr-03
May-03
Jun-03Jul-03
Aug-03
Sep-03
Oct-03
Nov-03
Dec-03
Jan-04
Feb-04
Mar-04
Apr-04
May-04
Jun-04Jul-04
Aug-04
Sep-04
Oct-04
Nov-04
Dec-04
Jan-05
Feb-05
Mar-05
Apr-05
May-05
Jun-05Jul-05
Aug-05
Sep-05
Oct-05
Nov-05
Dec-05
Grou
ndwa
ter le
vel (f
eet b
elow
grou
nd su
rface
)
0
1
2
3
4
5
Date
Daily
Prec
ipitat
ion (in
ches
)
Site Precipitation Precipitation data from IES Groundwater Level
Data collectionbegan on 8/3/04
2002 2003 2004 2005

Figure 12. Milan Highway Garage: Groundwater Level and Precipitation
The Chazen CompaniesJuly 2006
0
5
10
15
20
25
30
Aug-02
Sep-02
Oct-02
Nov-02
Dec-02
Jan-03
Feb-03
Mar-03
Apr-03
May-03
Jun-03Jul-03
Aug-03
Sep-03
Oct-03
Nov-03
Dec-03
Jan-04
Feb-04
Mar-04
Apr-04
May-04
Jun-04Jul-04
Aug-04
Sep-04
Oct-04
Nov-04
Dec-04
Jan-05
Feb-05
Mar-05
Apr-05
May-05
Jun-05Jul-05
Aug-05
Sep-05
Oct-05
Nov-05
Dec-05
Grou
ndwa
ter le
vel (f
eet b
elow
grou
nd su
rface
)
0
1
2
3
4
5
Daily
Prec
ipitat
ion (in
ches
)
Site Precipitation IES Precip Groundwater Level
2002 2003 2004
Data collectionbegan on 3/4/04
2005
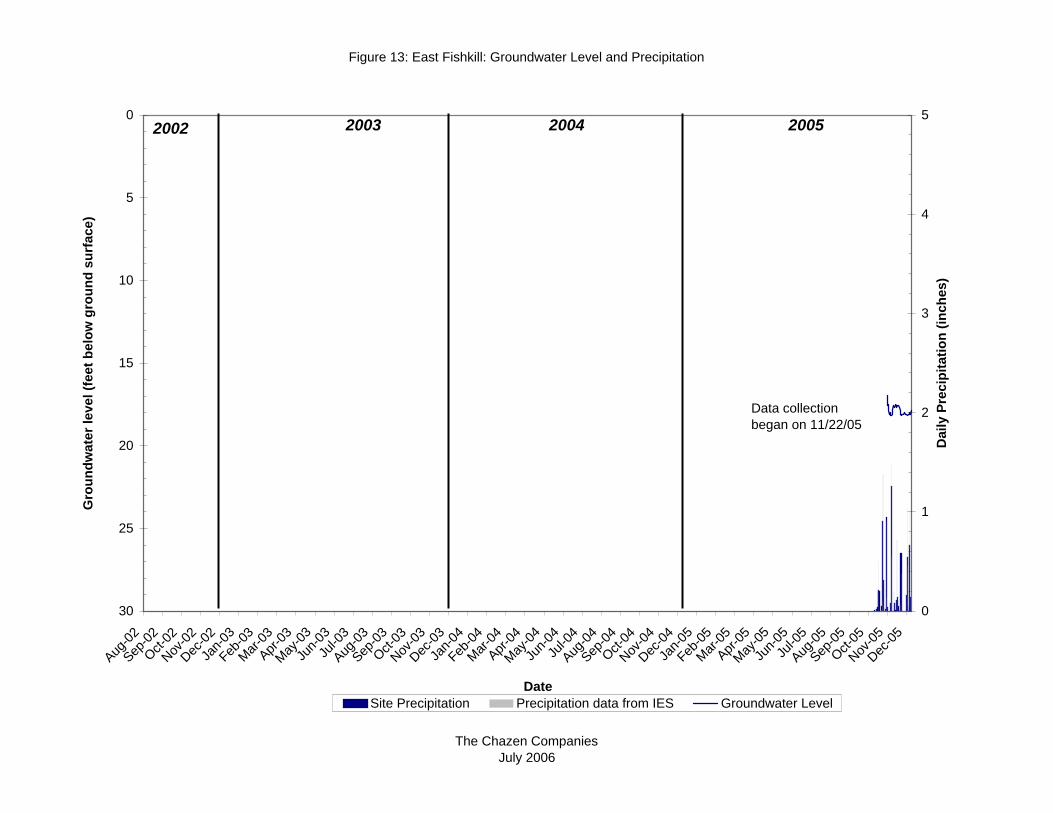
Figure 13: East Fishkill: Groundwater Level and Precipitation
The Chazen CompaniesJuly 2006
0
5
10
15
20
25
30
Aug-02
Sep-02
Oct-02
Nov-02
Dec-02
Jan-03
Feb-03
Mar-03
Apr-03
May-03
Jun-03Jul-03
Aug-03
Sep-03
Oct-03
Nov-03
Dec-03
Jan-04
Feb-04
Mar-04
Apr-04
May-04
Jun-04Jul-04
Aug-04
Sep-04
Oct-04
Nov-04
Dec-04
Jan-05
Feb-05
Mar-05
Apr-05
May-05
Jun-05Jul-05
Aug-05
Sep-05
Oct-05
Nov-05
Dec-05
Grou
ndwa
ter le
vel (f
eet b
elow
grou
nd su
rface
)
0
1
2
3
4
5
Date
Daily
Prec
ipitat
ion (in
ches
)
Site Precipitation Precipitation data from IES Groundwater Level
Data collectionbegan on 11/22/05
2002 2003 2004 2005
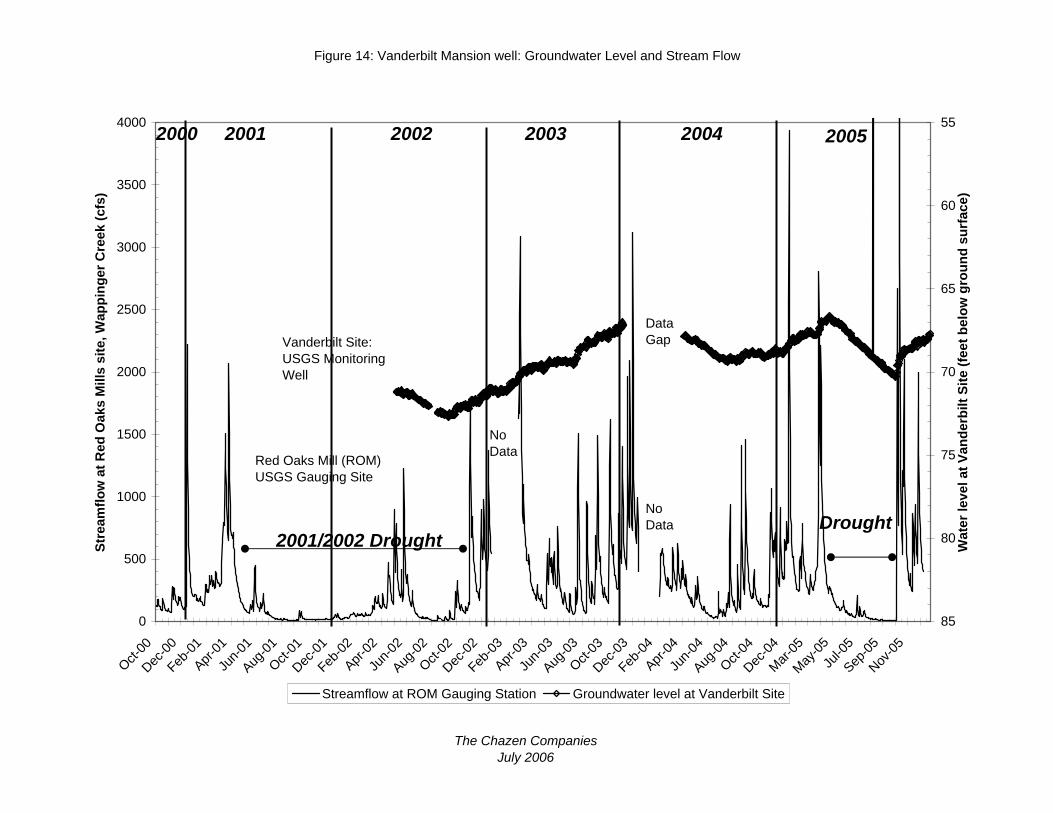
Figure 14: Vanderbilt Mansion well: Groundwater Level and Stream Flow
The Chazen CompaniesJuly 2006
0
500
1000
1500
2000
2500
3000
3500
4000
Oct-00
Dec-00
Feb-01
Apr-01
Jun-01
Aug-01
Oct-01
Dec-01
Feb-02
Apr-02
Jun-02
Aug-02
Oct-02
Dec-02
Feb-03
Apr-03
Jun-03
Aug-03
Oct-03
Dec-03
Feb-04
Apr-04
Jun-04
Aug-04
Oct-04
Dec-04
Mar-05
May-05
Jul-05
Sep-05
Nov-05
Strea
mflow
at R
ed O
aks M
ills si
te, W
appin
ger C
reek (
cfs)
55
60
65
70
75
80
85
Water
leve
l at V
ande
rbilt
Site (
feet b
elow
grou
nd su
rface
)
Streamflow at ROM Gauging Station Groundwater level at Vanderbilt Site
Vanderbilt Site: USGS Monitoring Well
Red Oaks Mill (ROM) USGS Gauging Site
No Data
No Data
Data Gap
2001 2002 2003 20042000
2001/2002 Drought
2005
Drought

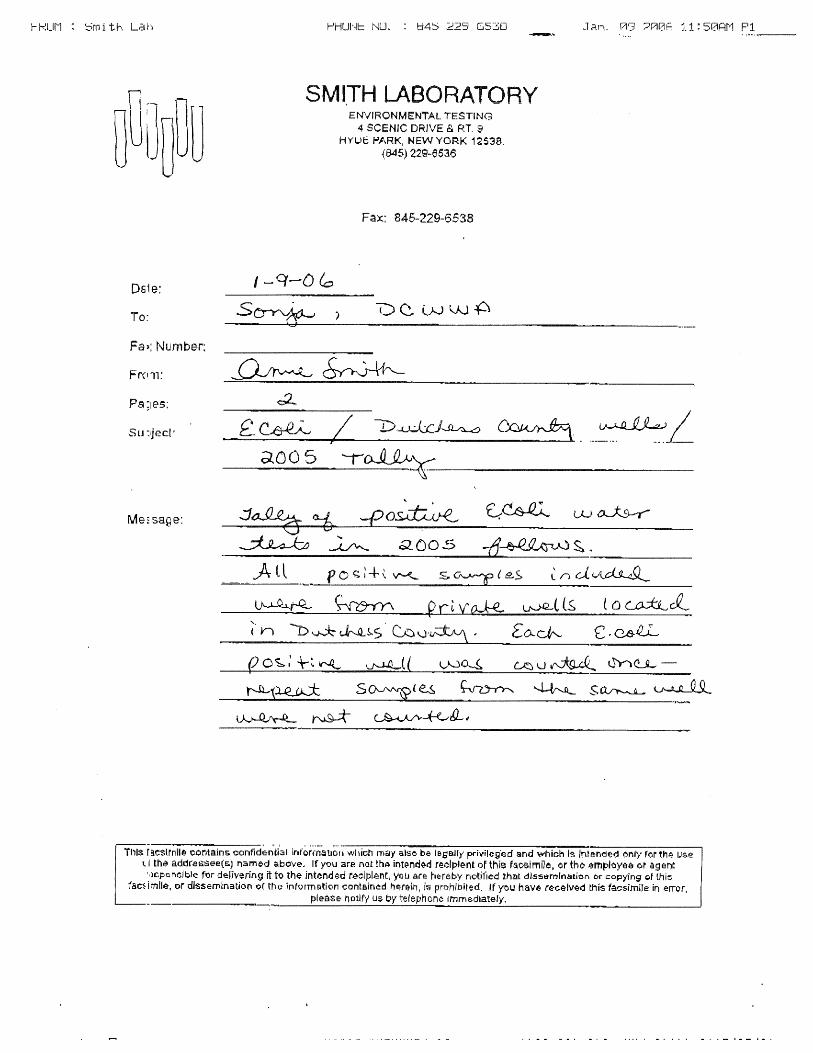
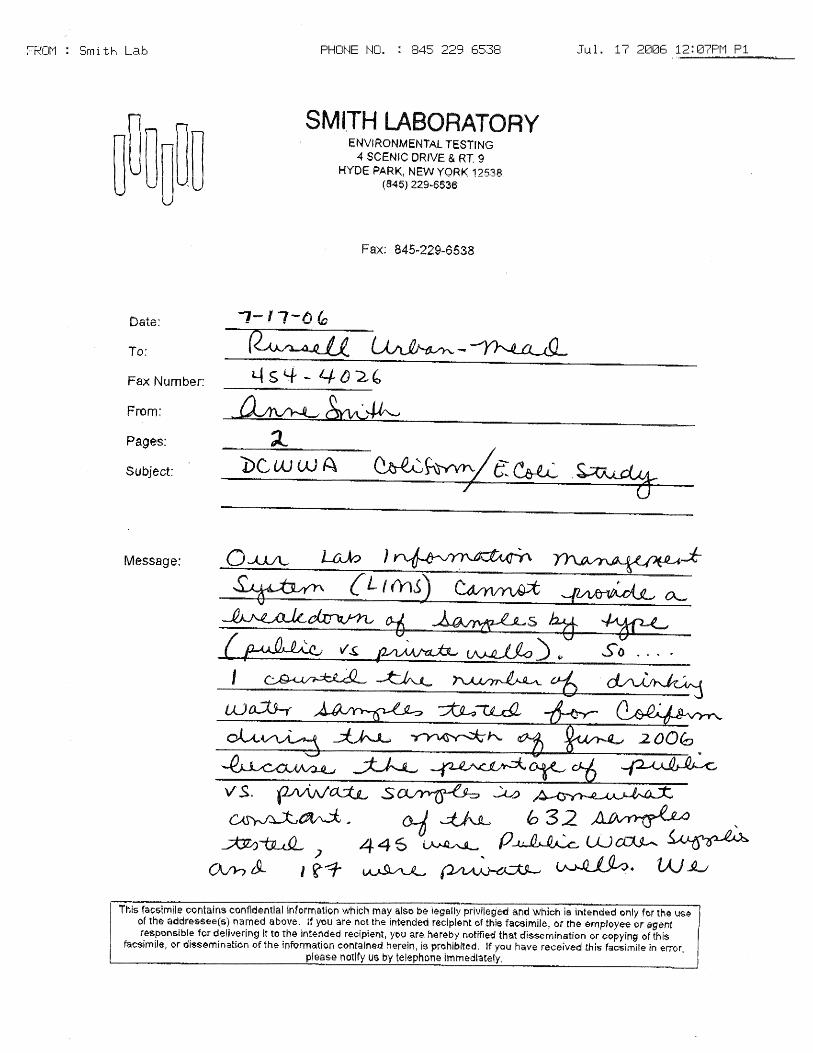
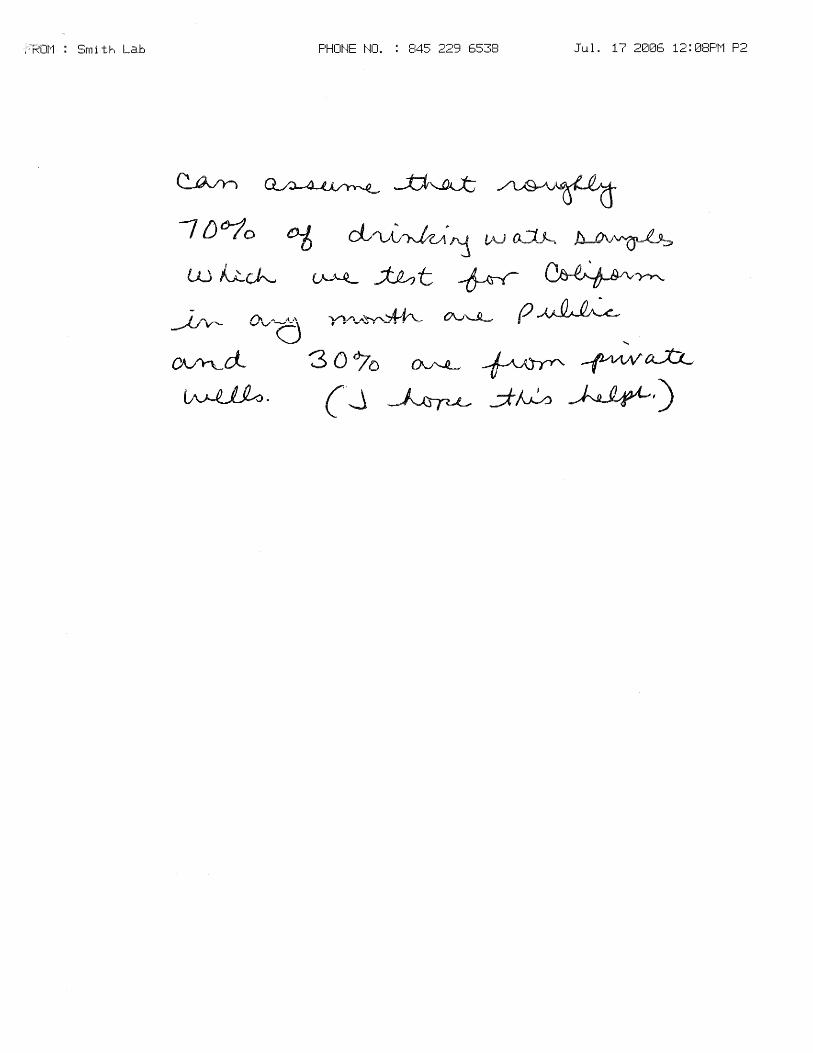
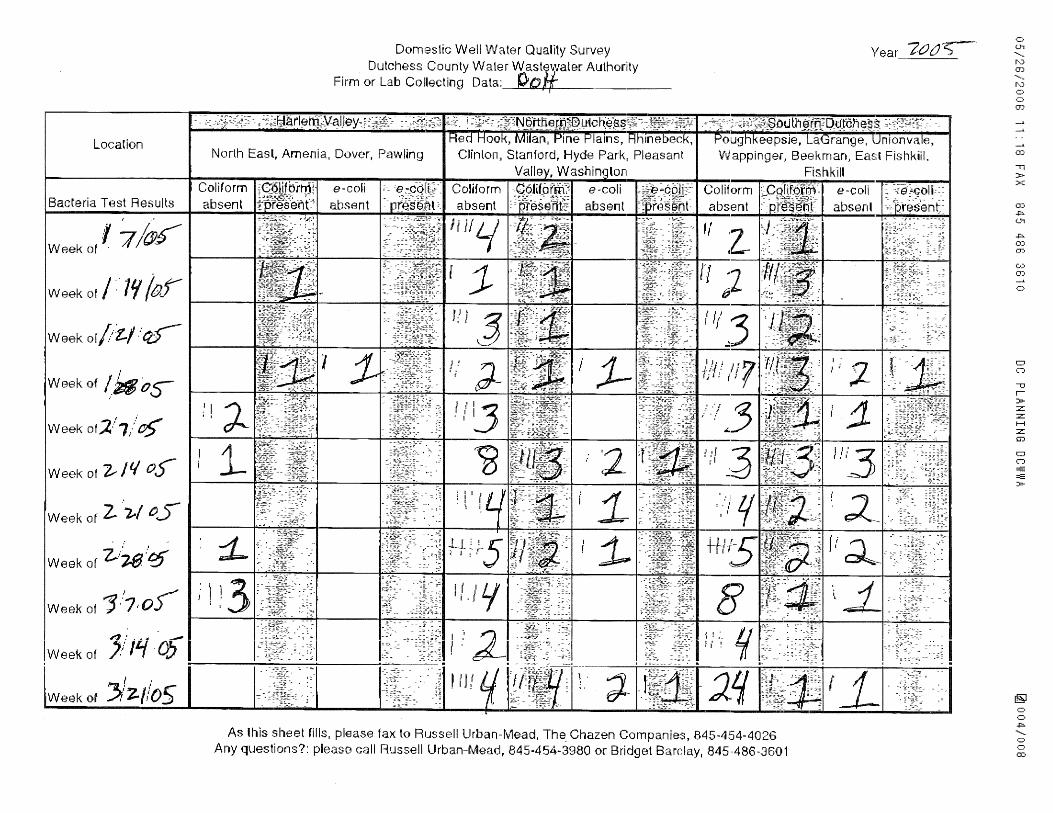
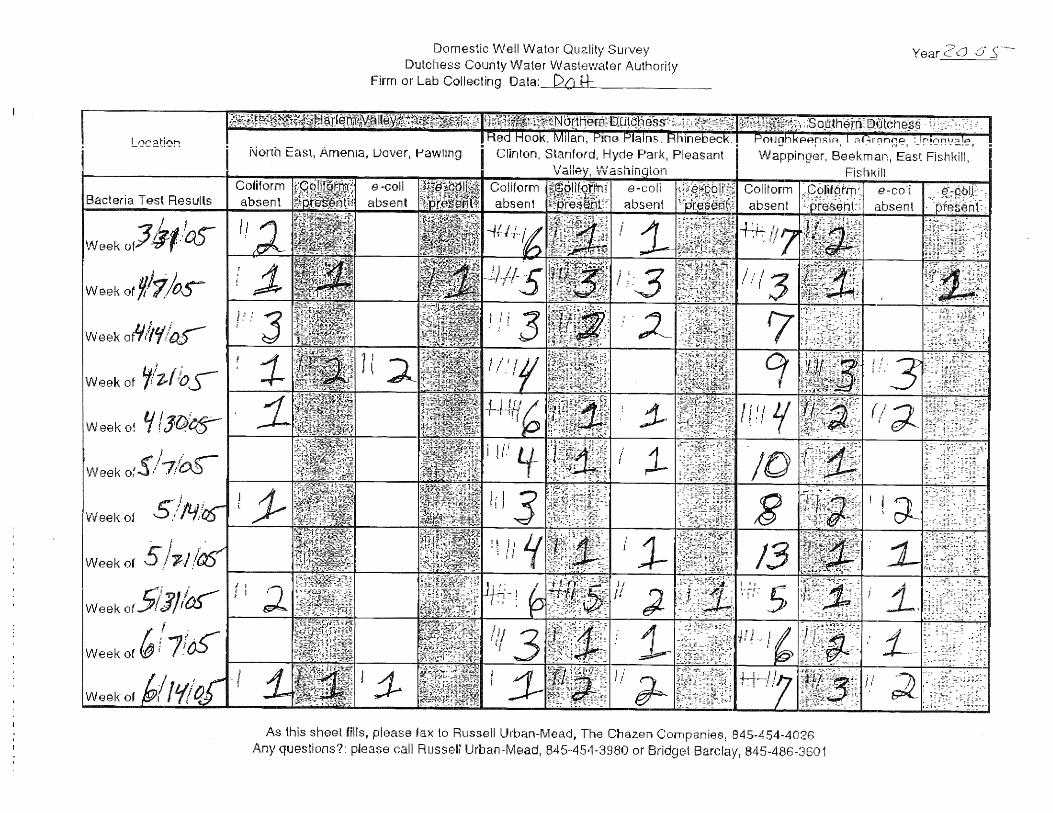
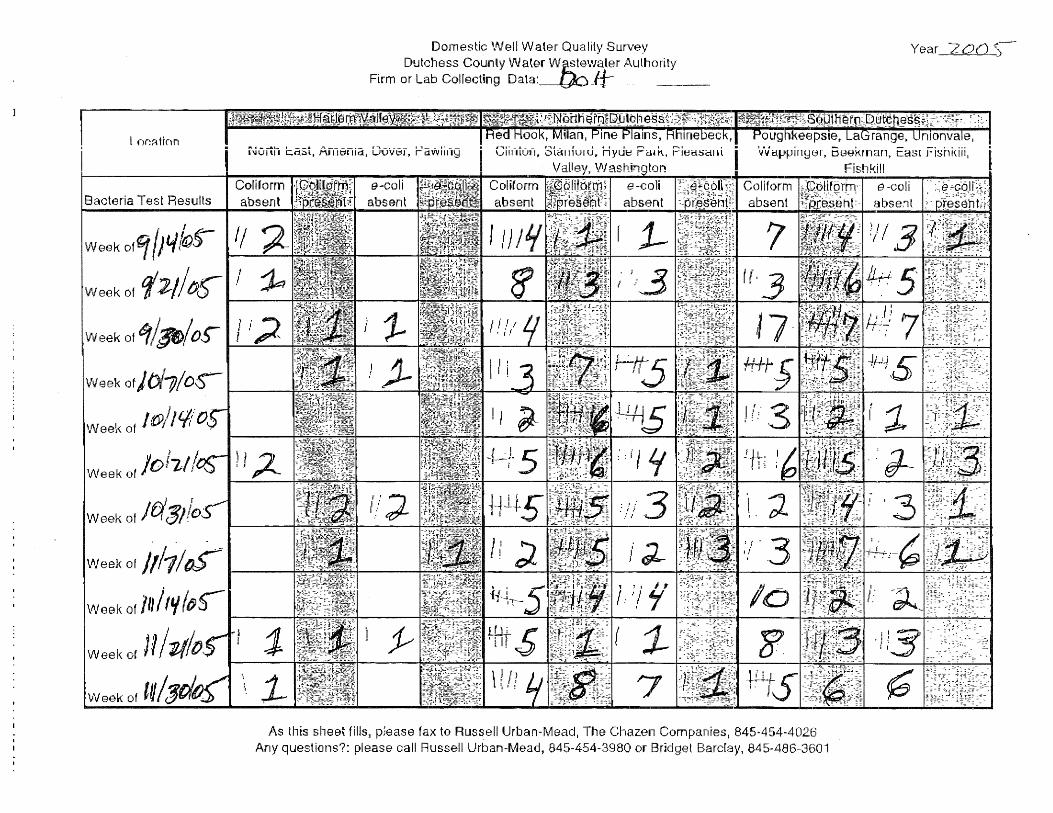
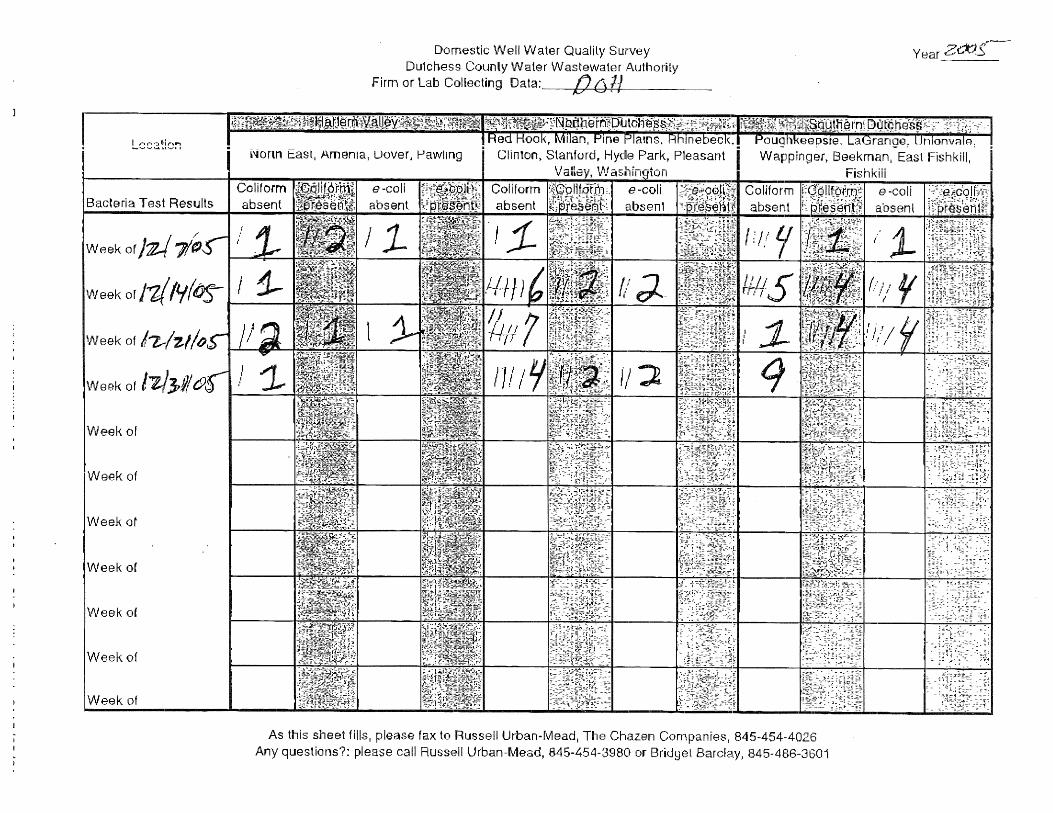
Figure 15 - Monthly e-coli Detections
Sources:Smith Labs extrapolated data.DCDOH reported data.
The Chazen CompaniesJuly 2006
0
2
4
6
8
10
12
14
Jan Feb March April May June July August September October November December2005, Months
Perce
nt e-c
oli sa
mples
Smith Lab DCDOH

Figure 16 - Weekly e-coli Detections
The Chazen CompaniesJuly 2006
0
5
10
15
20
25
30
1/7/20
051/2
1/2005
2/7/20
052/2
1/2005
3/7/20
053/2
1/2005
4/7/20
054/2
1/2005
5/7/20
055/2
1/2005
6/7/20
056/2
1/2005
7/7/20
057/2
1/2005
8/7/20
058/2
1/2005
9/7/20
059/2
1/2005
10/7/2
00510/
21/200
511/
7/2005
11/21/
2005
12/7/2
00512/
21/200
5
Weekly Record
Perce
nt e-c
oli sa
mples
DCDOH
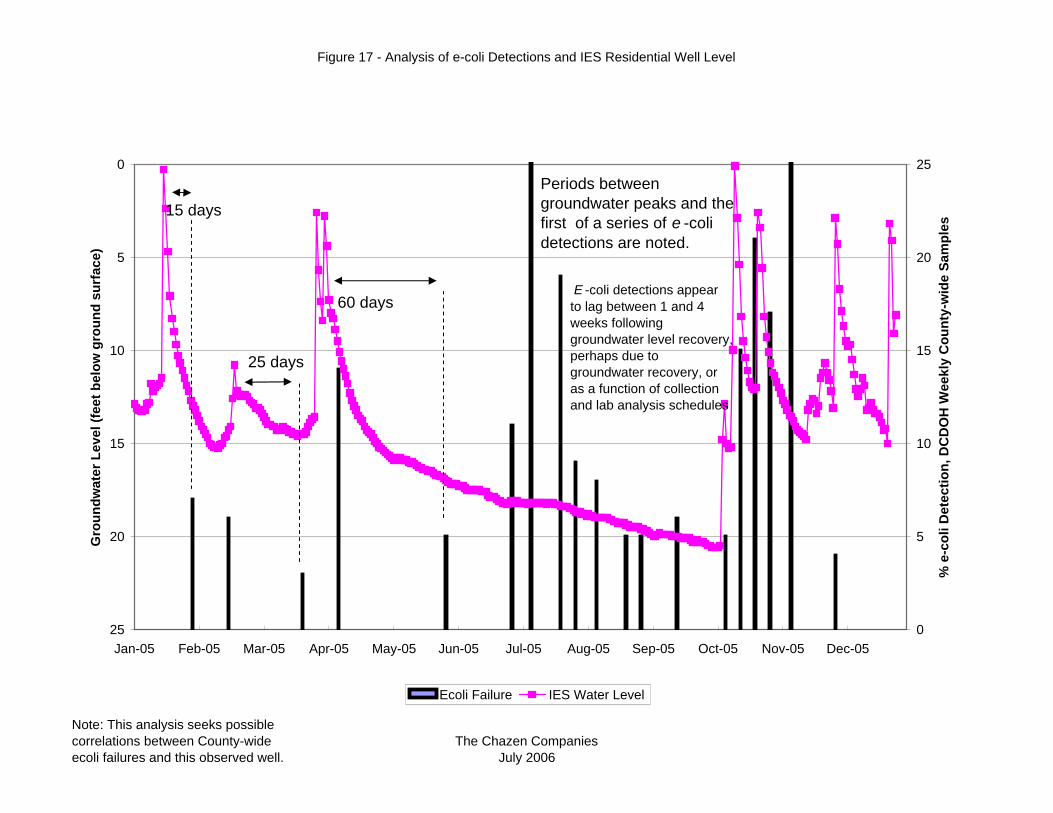
Figure 17 - Analysis of e-coli Detections and IES Residential Well Level
Note: This analysis seeks possiblecorrelations between County-wideecoli failures and this observed well.
The Chazen CompaniesJuly 2006
0
5
10
15
20
25Jan-05 Feb-05 Mar-05 Apr-05 May-05 Jun-05 Jul-05 Aug-05 Sep-05 Oct-05 Nov-05 Dec-05
Grou
ndwa
ter Le
vel (f
eet b
elow
grou
nd su
rface
)
0
5
10
15
20
25
% e-c
oli D
etecti
on, D
CDOH
Wee
kly C
ounty
-wide
Samp
les
Ecoli Failure IES Water Level
15 days
25 days
60 days E -coli detections appear to lag between 1 and 4 weeks following groundwater level recovery,perhaps due to groundwater recovery, or as a function of collection and lab analysis schedules
Periods between groundwater peaks and the first of a series of e -coli detections are noted.

Figure 18 - Analysis of e-coli Detections and Deerfields Pond Well Level
Note: ecoli detections are County-wide, NOT from Deerfield ponds well.The Chazen Companies
July 2006
0
5
10
15
20
25Jan-05 Feb-05 Mar-05 Apr-05 May-05 Jun-05 Jul-05 Aug-05 Sep-05 Oct-05 Nov-05 Dec-05
Grou
nd W
ater L
evel
(feet
below
grou
nd su
rface
)
0
5
10
15
20
25
% e-c
oli D
etecti
on, D
CDOH
Wee
kly C
ounty
-wide
Samp
les
% Ecoli Failure Deerfield water levels
28 days
52 days
E-coli detections appear to lag between 1 and 4 weeks following groundwater level recovery, perhaps due to groundwater recovery or as a function of collection and lab schedules.
24 days
25 days
Periods between groundwater peaks and the first of a series of e-coli detections are noted.

Figure 19: 24 hour Rainfall Event Analysis
The Chazen Companies July 2006
IES Rain 1988- 2005, 6570 days of data
1.00
10.00
100.00
1000.00
0 1 2 3 4 5 6Daily Precipitation (inches)
Numb
er of
Occu
rence
s
0
10
20
30
40
50
60
70
80
90
100
Cumu
lative
% of
Total
Rain
Number of daysCumulative % of Total Rain Volumel

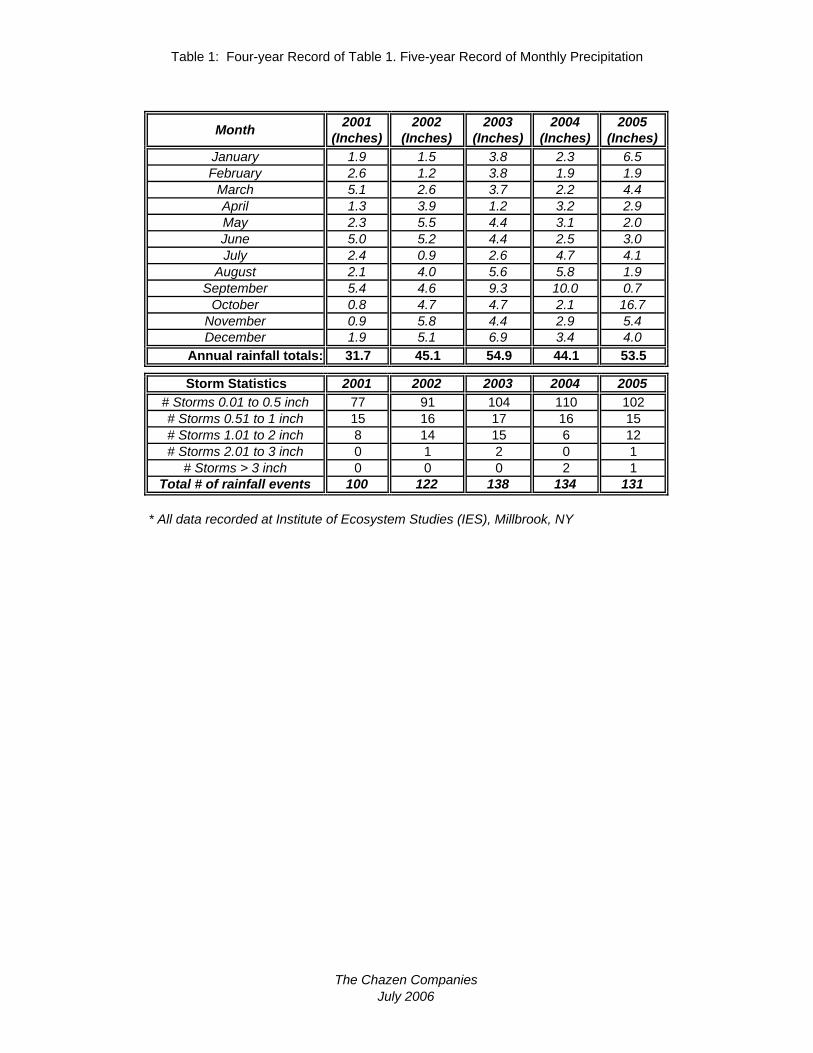
Table 1: Four-year Record of Table 1. Five-year Record of Monthly Precipitation
2001 2002 2003 2004 2005(Inches) (Inches) (Inches) (Inches) (Inches)
January 1.9 1.5 3.8 2.3 6.5February 2.6 1.2 3.8 1.9 1.9
March 5.1 2.6 3.7 2.2 4.4April 1.3 3.9 1.2 3.2 2.9May 2.3 5.5 4.4 3.1 2.0June 5.0 5.2 4.4 2.5 3.0July 2.4 0.9 2.6 4.7 4.1
August 2.1 4.0 5.6 5.8 1.9September 5.4 4.6 9.3 10.0 0.7
October 0.8 4.7 4.7 2.1 16.7November 0.9 5.8 4.4 2.9 5.4December 1.9 5.1 6.9 3.4 4.0
Annual rainfall totals: 31.7 45.1 54.9 44.1 53.5Storm Statistics 2001 2002 2003 2004 2005
# Storms 0.01 to 0.5 inch 77 91 104 110 102# Storms 0.51 to 1 inch 15 16 17 16 15# Storms 1.01 to 2 inch 8 14 15 6 12# Storms 2.01 to 3 inch 0 1 2 0 1
# Storms > 3 inch 0 0 0 2 1Total # of rainfall events 100 122 138 134 131
* All data recorded at Institute of Ecosystem Studies (IES), Millbrook, NY
Month
The Chazen CompaniesJuly 2006

Table 2: Site Characeristics at DCWWA monitoring locations
Monitoring Town Hydrologic Bedrock Monitored Rain InfiltrationSite Name Soil Type Formation Well Gauge Gauge
Boss Residence East Fishkill D bgpc (Crystalline) √ √IES Millbrook C Cn (Meta Sedimentary) √ *
Tanner Residence LaGrange C Cn (Meta Sedimentary) √ √Sepascot Rhinebeck B Oag (Meta Sedimentary) √ √
Staatsburg Staatsburg D Oag (Meta Sedimentary) √ √Vanderbilt Hyde Park A Oag (Meta Sedimentary) √ √
Milan Milan A/D Owl (Meta Sedimentary) √ √ √East Fishkill East Fishkill B Ocw (Carbonate) √ √ √
High Medows Dover C Cn (Meta Sedimentary) √ √Hahn Farm Salt Point C Oag (Meta Sedimentary) √ √
Pulver Residence Pine Plains C/D Cw √ √Deerfield Ponds Pawling B Ocst (Carbonate) √ √
* Rain Gauge not needed on site because rain data monitored and available through IES
The Chazen CompaniesJuly 2006

TABLE 3 - Stream Gaging Data
Q90* 7Q10*acres cfs gpm gal / day gal / day / acre cfs gpm gal / day gal / day / acre cfs gpm gal / day gal / day / acre cfs gpm gal / day gal / day / acre gal/day/acre gal/day/acre
USGS Flow Data: Tenmile at CT Border (Old Forge Rd) 131,562 28.30 12702 18,290,720 139 25.30 11355 16,351,775 124 26.33 11818 17,017,479 129 21.50 9650 13,895,777 106 169 61
1 Tenmile at CT Border (Old Forge Rd)(USGS Gaging Station) 131,562 22.95 10301 14,832,934 113 27.74 12448 17,925,552 136 19.22 8624 12,418,947 94 11.74 5269 7,587,740 58 169 61
4 Tenmile in Dover Plains (Tenmile River Drive) 90,950 16.30 7316 10,534,938 116 17.26 7745 11,152,169 123 13.85 6216 8,951,466 98 5.99 2688 3,871,428 43 na na
6 Webatuk Ck at Leedsville Road 35,574 4.35 1952 2,811,471 79 4.33 1941 2,795,313 79 3.59 1609 2,317,040 65 1.37 615 885,452 25 na na
2 Swamp River: @ Route 6 (Old Post Road) 31,490 5.05 2267 3,263,892 104 3.98 1784 2,569,103 82 2.27 1017 1,463,904 46 1.660 745 1,072,883 34 135 33
5 Amenia Brook at Wassaic (Across from Fire Station) 7,135 1.70 763 1,098,736 154 1.93 866 1,247,388 175 1.43 640 920,999 129 0.810 364 523,515 73 136 59
7 Fishkill Creek at Beacon (Bridge Street, Old USGS Station) 126,125 16.85 7563 10,890,411 86 26.73 11995 17,272,774 137 13.54 6075 8,747,876 69 6.45 2895 4,168,733 33 128 31
8 Sprout Ck near Fishkill (Mountainview Road) 38,855 2.90 1302 1,874,314 48 3.56 1598 2,300,882 59 4.04 1811 2,607,882 67 0.07 31 45,242 1 na na
9 Sprout Ck near La Grange (Bridge on Route 376) 36,320 3.30 1481 2,132,840 59 5.66 2538 3,654,912 101 5.10 2287 3,292,976 91 0.25 112 161,579 4 77 5
10 Fishkill Ck at E. Fishkill/Beekman Line (Phillips Road) 31,769 5.60 2513 3,619,365 114 7.52 3375 4,860,290 153 4.01 1800 2,591,724 82 3.33 1495 2,152,230 68 na na
11 Fishkill Ck at Beekman/Unionvale Line (Route 55) 10,096 2.45 1100 1,583,472 157 4.75 2130 3,066,766 304 3.00 1344 1,935,714 192 1.07 480 691,557 68 na na
USGS Flow Data: Wappinger Ck at Red Oaks Mills 109,232 14.00 6284 9,048,413 83 14.00 6284 9,048,413 83 12.00 5386 7,755,782 71 6.60 2962 4,265,680 39 124 45
13 Wappinger Ck at Red Oaks Mill (USGS Gaging Station) 109,232 15.65 7024 10,114,833 93 17.17 7706 11,097,232 102 12.03 5397 7,771,940 71 5.42 2433 3,503,028 32 124 45
14 Wappinger Ck at Pleasant Valley (Rt 44 behind Town Hall) 99,610 14.65 6575 9,468,518 95 13.37 5999 8,638,003 87 7.27 3263 4,698,712 47 NG NG NG NA na na
15 Upper Wappinger Ck @ Clinton Line (Park at Hibernia Rd) 36,397 5.95 2671 3,845,575 106 3.67 1647 2,371,977 65 3.37 1511 2,175,174 60 NG NG NG NA 133** 48**
17 East Branch Wappinger Ck (Hibernia Road Bridge) 21,618 3.15 1414 2,035,893 94 3.32 1490 2,145,766 99 3.48 1561 2,247,884 104 NG NG NG NA 164 63
16 Little Wappinger Ck (Salt Point Turnpike @ Salt Point Dam) 20,557 0.85 382 549,368 27 0.71 319 458,884 22 0.69 309 444,245 22 NG NG NG NA na na
Crum Elbow 18 Crum Elbow Ck (Hyde Park bridge crossing at Route 41) 12,556 0.70 314 452,421 36 0.66 296 426,568 34 0.54 240 346,037 28 0.19 85 122,800 10 98 8
Sawkill 19 Sawkill Ck at Red Hook (Route 9) 12,515 1.60 718 1,034,104 83 3.24 1452 2,090,830 167 1.89 846 1,218,304 97 1.75 785 1,131,052 90 238 129Landsman
Kill 20 Landsman Kill Ck (Downtown Rhinebeck) 6,826 4.50 2020 2,908,418 426 1.07 480 691,557 101 0.58 261 375,800 55 0.72 323 465,347 68 95 0
** Calculated by subtracting value for East Branch Wappingers from value just downstream of confluence point.na - no statistical data available for this locationData rows with identified Site numbers were gaged by The Chazen Companies with or without DCWWA staff depending on session.
* Q90 is the 90% exceedence value for groundwater yield, based on the period of record from 1931-1960. 7Q10 is the lowest seven day average yield that occurs every 10 years. Q90 and 7Q10 values for stream discharge (Ayer and Pauszek, 1968) were used to calculate the Q90 and 7Q10 for groundwater yield.
StreamflowStreamflow Groundwater Yield per Acre
Wappinger Creek
Water
shed
s November 6-8, 2001
Fishkill Creek
Tenmile River
Site #Groundwater Yield per Acre
1931-1960Groundwater Yield per Acre
October 5-7, 2005
Streamflow Groundwater Yield per AcreWaterway Name and Gaging Location
Contributing Area Upstream of Gaging Site
August 12-14, 2002 September 24-26, 2002
StreamflowGroundwater Yield per Acre
The Chazen CompaniesJuly 2006

Table 4. Monitoring Equipment Reliability Tracker
The Chazen CompaniesJuly 2006
0
2
4
6
8
10
12
Nov-04 Dec-04 Jan-05 Feb-05 Mar-05 Apr-05 May-05 Jun-05 Jul-05 Aug-05 Sep-05 Oct-05 Nov-05 Dec-05Time
Data
High Meadow
Precipitation Data Water Level Data
Milan
DeerfieldBoss
TannerIES
Hahn FarmStaatsburg
PulverSepascot Farm
East Fishkill
Vanderbilt MansionMonitored by USGS