planning & budget advisory committee april 7, 2009 3:30 p
TRANSCRIPT
Planning & Budget Advisory Committee
April 7, 20093:30 p m3:30 p.m.
1

Agenda
� Budget Process & Timeline
� Tuition and Fees Comparisons
� Proposed FY2009 Budget� Educational & General (E&G)Educational & General (E&G)� Auxiliary� Student Financial Assistance� S d P� Sponsored Programs
� Federal Stimulus Overview
2
Federal Stimulus Overview

Budget Process & TimelineBudget Process & Timeline
3
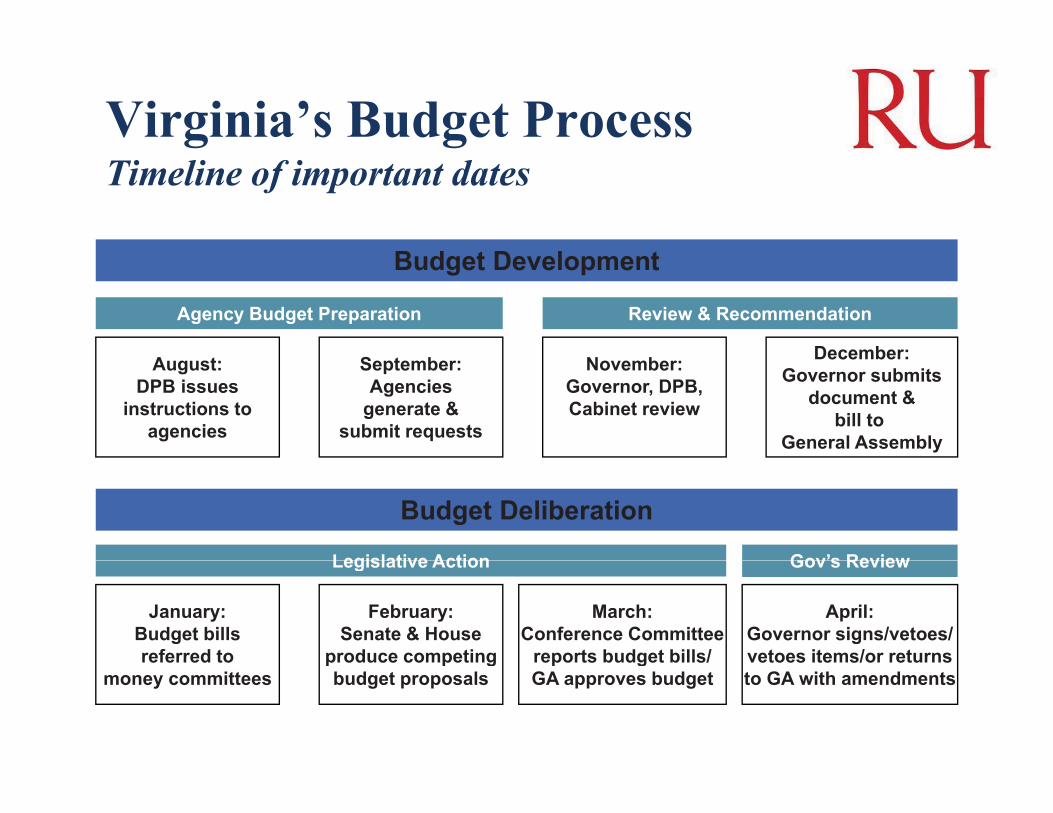
Virginia’s Budget ProcessTimeline of important dates
B d t D l t
December:
Budget Development
Agency Budget Preparation Review & Recommendation
November:Governor, DPB,Cabinet review
September:Agencies
generate &submit requests
August:DPB issues
instructions toagencies
December:Governor submits
document &bill to
General Assembly
Budget Deliberation
Legislative Action Gov’s Review
April:Governor signs/vetoes/vetoes items/or returns
March:Conference Committee
reports budget bills/
February:Senate & House
produce competing
January:Budget billsreferred to
Legislative Action Gov s Review
to GA with amendmentsp g
GA approves budgetp p gbudget proposalsmoney committees
FY2009 Tuition & FeesFY2009 Tuition & Fees
5

FY09 TUITION (In-State Undergraduate) Compared to Other State InstitutionsCompared to Other State Institutions
Rank InstitutionFY2009Dollars
FY2009% Increase
1 U i it f Vi i i $7 498 9 9%1 University of Virginia $7,498 9.9%
2 Virginia Tech $6,895 11.9%
3 College of William & Mary $6,183 9.7%
4 George Mason University $5,526 9.8%4 George Mason University $5,526 9.8%
5 Virginia Military Institute $5,262 4.0%
6 Virginia Commonwealth University $4,992 10.3%
7 University of Mary Washington $4,711 4.0%
8 Longwood University $4,509 3.9%
9 Christopher Newport University $4,206 4.0%
10 Old Dominion University $4,203 4.0%
$11 Radford University $4,187 4.0%
12 University of Virginia @ Wise $3,589 3.0%
13 James Madison University $3,556 4.0%
14 Virginia State University $3,313 4.0%
6
14 Virginia State University $3,313 4.0%
15 Norfolk State University $2,781 3.0%
Average $4,761 6.6%
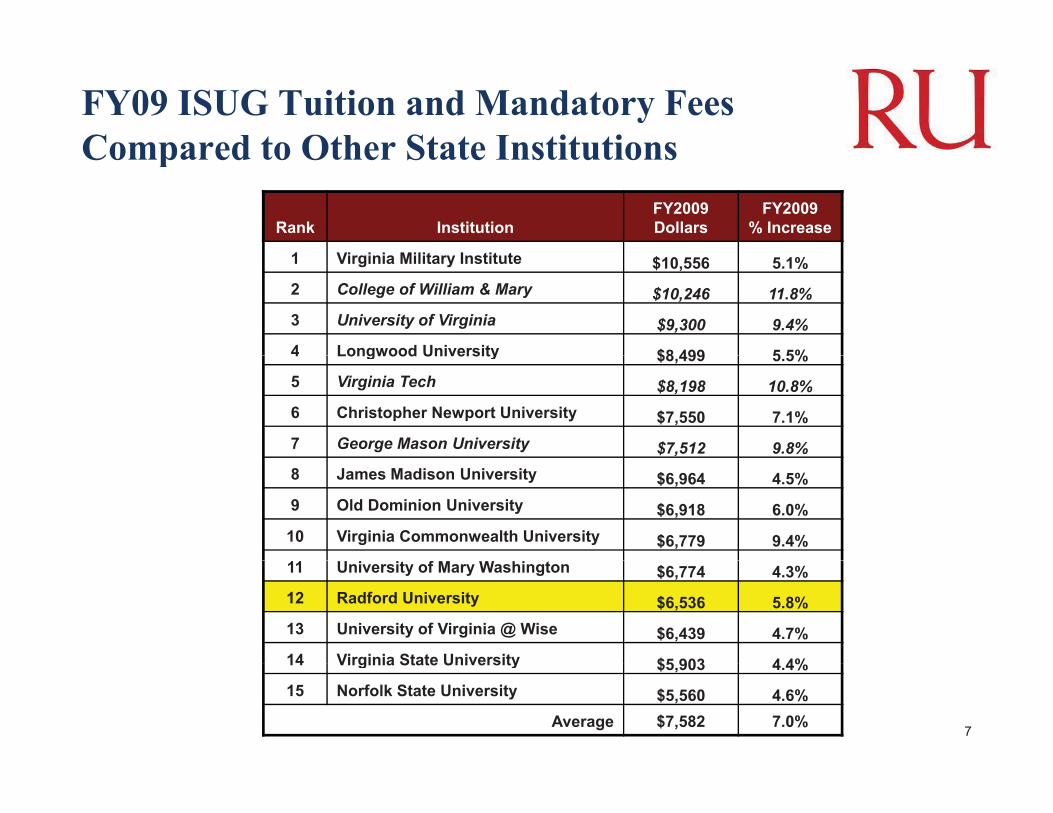
FY09 ISUG Tuition and Mandatory FeesCompared to Other State InstitutionsCompared to Other State Institutions
Rank InstitutionFY2009Dollars
FY2009% Increase
1 Vi i i Milit I tit t1 Virginia Military Institute $10,556 5.1%2 College of William & Mary $10,246 11.8%3 University of Virginia $9,300 9.4%4 Longwood University $8 499 5 5%4 Longwood University $8,499 5.5%5 Virginia Tech $8,198 10.8%6 Christopher Newport University $7,550 7.1%7 George Mason University $7,512 9.8%8 James Madison University $6,964 4.5%9 Old Dominion University $6,918 6.0%
10 Virginia Commonwealth University $6,779 9.4%11 University of Mary Washington $6,774 4.3%12 Radford University $6,536 5.8%13 University of Virginia @ Wise $6,439 4.7%14 Virginia State University $5 903 4 4%
7
14 Virginia State University $5,903 4.4%15 Norfolk State University $5,560 4.6%
Average $7,582 7.0%

FY09 ISUG Tuition, Fees, Room and BoardCompared to Other State InstitutionsCompared to Other State Institutions
Rank InstitutionFY2009Dollars
FY2009% Increase
1 C ll f Willi & M1 College of William & Mary $18,276 8.7%2 University of Virginia $17,120 7.4%3 Virginia Military Institute $17,000 5.2%4 Christopher Newport University $16 450 5 8%4 Christopher Newport University $16,450 5.8%5 Longwood University $15,355 7.1%6 George Mason University $14,872 7.3%7 Virginia Commonwealth University $14,693 6.8%8 James Madison University $14,422 4.7%9 Old Dominion University $14,052 6.3%
10 University of Mary Washington $13,814 5.5%11 Virginia Tech $13,674 9.4%12 Virginia State University $13,613 4.8%13 University of Virginia @ Wise $13,351 3.6%14 Radford University $13 252 4 6%
8
14 Radford University $13,252 4.6%15 Norfolk State University $12,676 2.9%
Average $14,841 6.1%
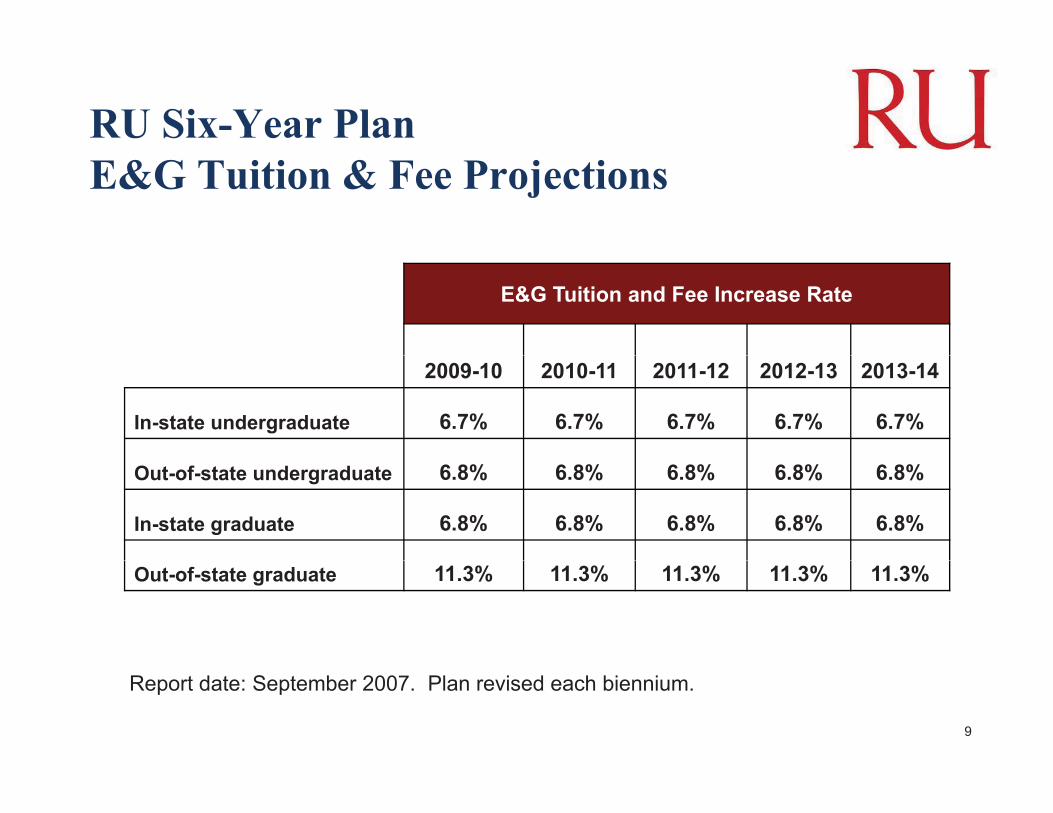
RU Six-Year Plan E&G Tuition & Fee Projections
E&G Tuition and Fee Increase Rate
2009-10 2010-11 2011-12 2012-13 2013-14
In-state undergraduate 6.7% 6.7% 6.7% 6.7% 6.7%
Out-of-state undergraduate 6.8% 6.8% 6.8% 6.8% 6.8%
In-state graduate 6.8% 6.8% 6.8% 6.8% 6.8%
Out-of-state graduate 11.3% 11.3% 11.3% 11.3% 11.3%
9
Report date: September 2007. Plan revised each biennium.
Total Operating BudgetTotal Operating Budget
10
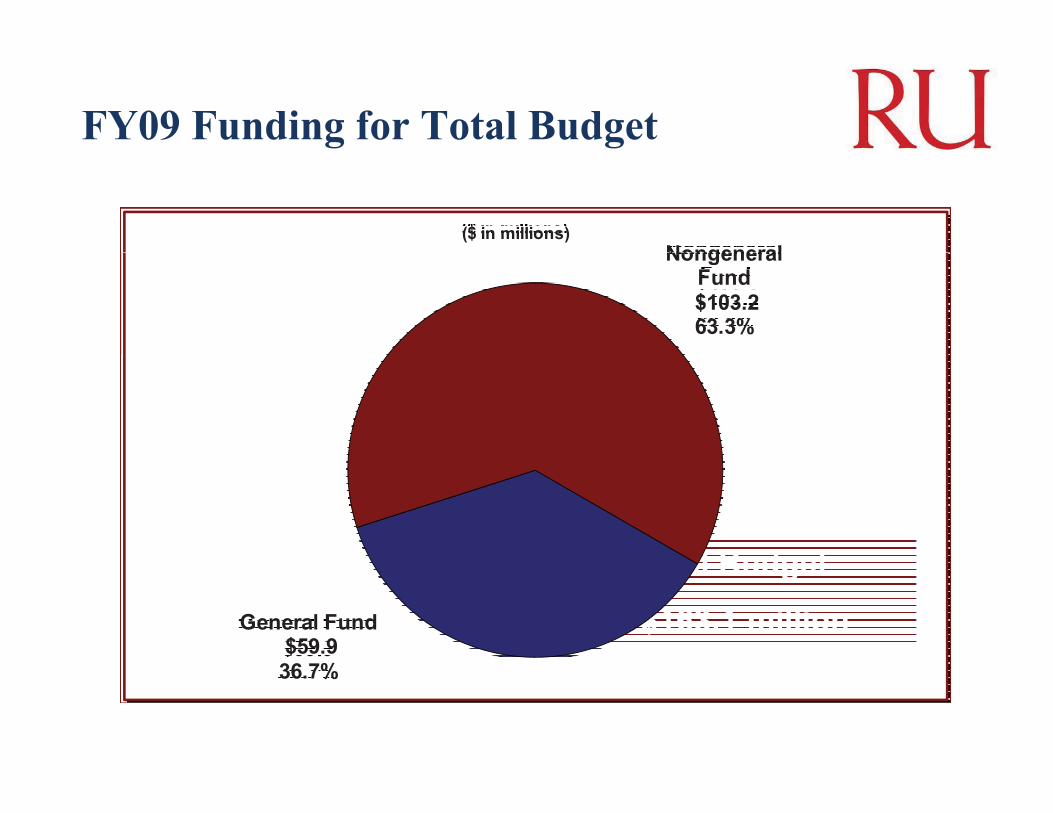
FY09 Funding for Total Budget
Nongeneral($ in millions)
NongeneralFund$103.2 63.3%
11
Total BudgetTotal Budget –
$163.1 millionGeneral Fund$59.9
%36.7%

Higher Education Major Programsg j g
� Educational & General (E&G)� Educational & General (E&G)
S d i i l A i� Student Financial Assistance
� Auxiliary Enterprises
� Sponsored Programs
12

2008-09 Projected RevenuesAll Funds and ProgramsAll Funds and Programs
13
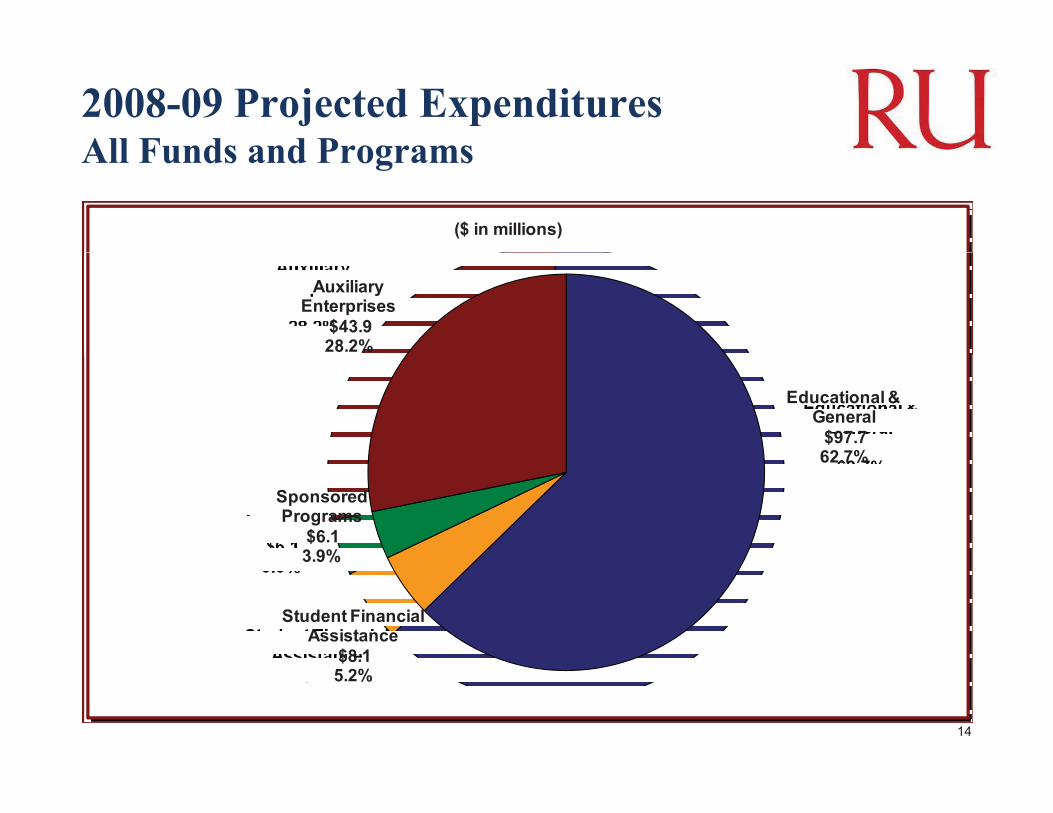
2008-09 Projected ExpendituresAll Funds and ProgramsAll Funds and Programs
($ in millions)
Auxiliary Enterprises
$43.9 28.2%
Educational & General
$97.7 62 7%62.7%
Sponsored Programs
$6.1 3.9%
Student Financial Assistance
$8.1
3.9%
14
$5.2%

Educational & General (E&G)
15
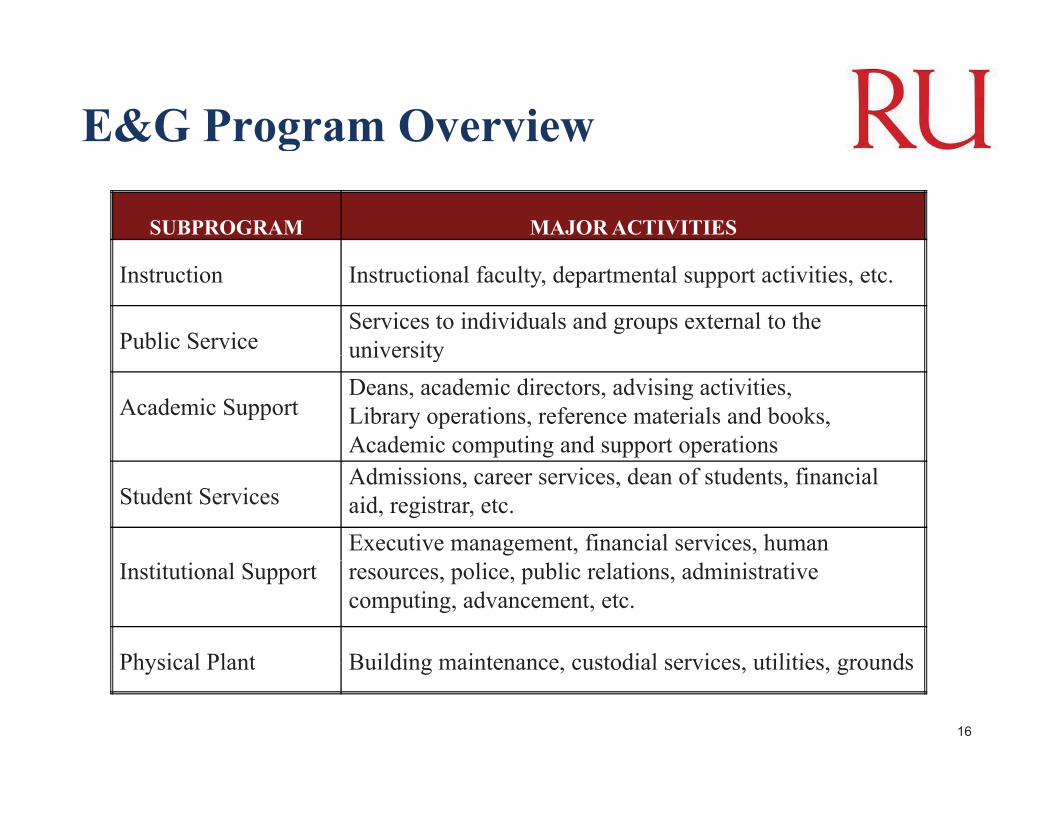
E&G Program Overviewg
SUBPROGRAM MAJOR ACTIVITIES
Instruction Instructional faculty, departmental support activities, etc.
Public ServiceServices to individuals and groups external to the universityuniversity
Academic SupportDeans, academic directors, advising activities, Library operations, reference materials and books, Academic computing and support operations
Student ServicesAdmissions, career services, dean of students, financial aid, registrar, etc.Executive management, financial services, human
Institutional Support resources, police, public relations, administrative computing, advancement, etc.
Physical Plant Building maintenance custodial services utilities grounds
16
Physical Plant Building maintenance, custodial services, utilities, grounds

2008-09 Projected E&G Revenue
($ in millions)
General Fund$53.1
Tuition$42.7 43.7%
54.3%
F d l W kFederal WorkStudy$0.4 0.4%Public Service
$0.6 0 6%
Other $0.9
17
0.6% 0.9%

2008-09 Projected E&G ExpendituresCompared to 2007-08 Actual ExpendituresCompared to 2007-08 Actual Expenditures
$80.0
$60.0�
$70.0�
$80.0�
78.4% 76.6%$40.0�
$50.0�
21 6% 23 4%$
$20.0�
$30.0�
21.6% 23.4%
$�
$10.0�
Salaries,�Wages�&�Benefits Nonpersonal�Services
18
, g pFY2008 FY2009

2008-09 Projected E&G ExpendituresBy SubprogramBy Subprogram
19

RU Compared to Peer Group (2006)Distribution of E&G Budget By ProgramDistribution of E&G Budget By Program
60%
40%
50%
51%
30%
40%
43%51%
20%
10% 13% 10% 1% 2%
20%
9%14%
4% 1%3%
18%
0%
10%
Instruction Academic Institutional Student Research Public Service Other
20
Instruction AcademicSupport
InstitutionalSupport
StudentSupport
Research Public Service Other
Peer Median Radford
Auxiliary EnterprisesAuxiliary Enterprises
21
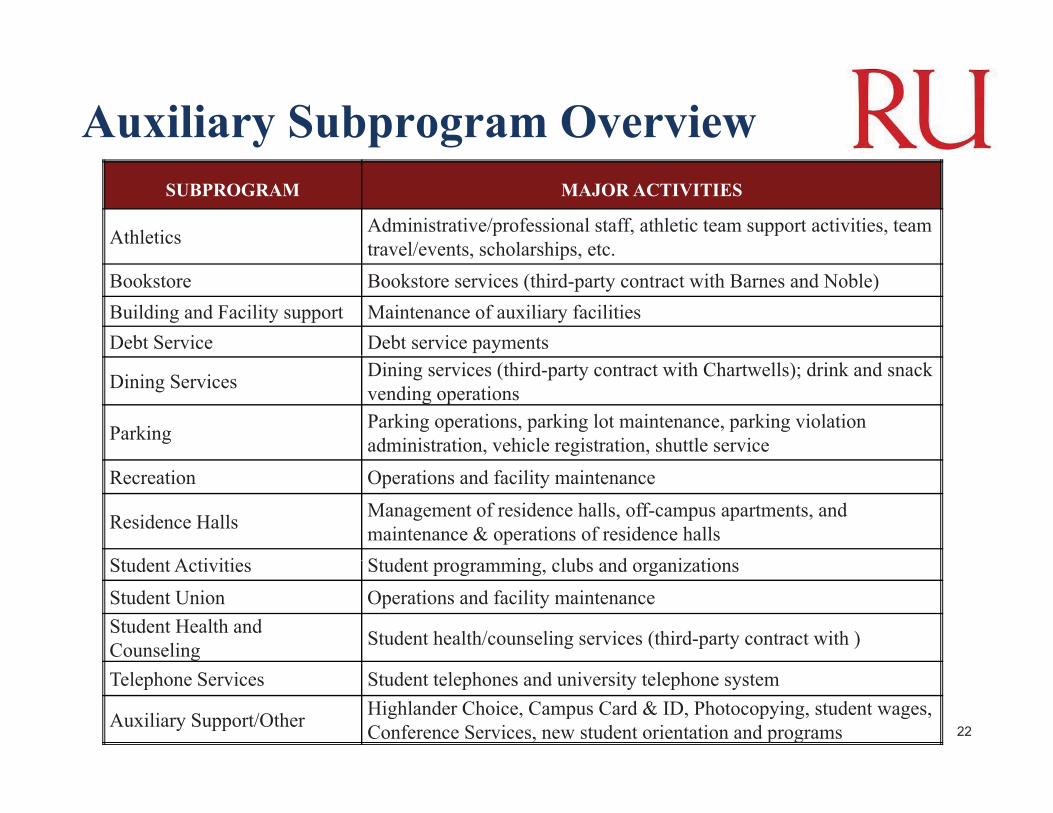
Auxiliary Subprogram OverviewSUBPROGRAM MAJOR ACTIVITIES
Athletics Administrative/professional staff, athletic team support activities, team travel/events scholarships etctravel/events, scholarships, etc.
Bookstore Bookstore services (third-party contract with Barnes and Noble)Building and Facility support Maintenance of auxiliary facilities Debt Service Debt service payments
Dining Services Dining services (third-party contract with Chartwells); drink and snack vending operations
Parking Parking operations, parking lot maintenance, parking violation administration, vehicle registration, shuttle service
Recreation Operations and facility maintenance
Residence Halls Management of residence halls, off-campus apartments, and maintenance & operations of residence halls
St d t A ti iti St d t i l b d i tiStudent Activities Student programming, clubs and organizationsStudent Union Operations and facility maintenanceStudent Health and Counseling Student health/counseling services (third-party contract with )
22
Telephone Services Student telephones and university telephone system
Auxiliary Support/Other Highlander Choice, Campus Card & ID, Photocopying, student wages, Conference Services, new student orientation and programs
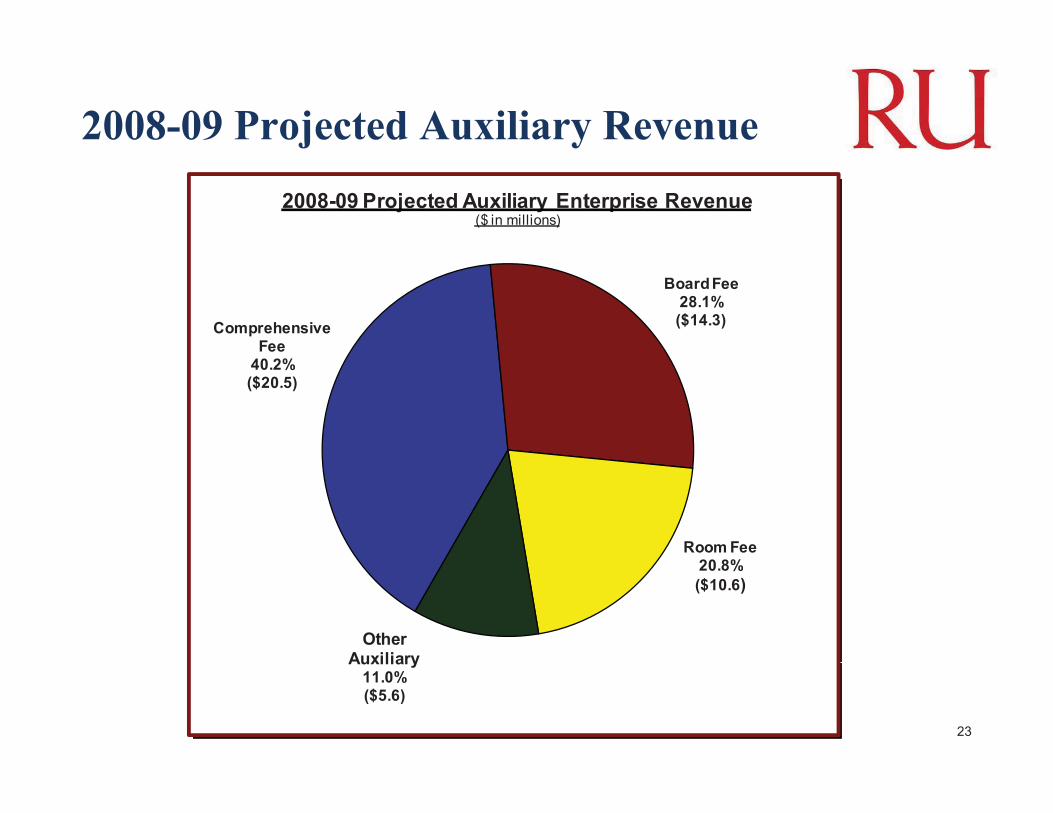
2008-09 Projected Auxiliary Revenue2008-09 Projected Auxiliary Enterprise Revenue
($ in millions)
Comprehensive Fee
Board Fee28.1%($14.3)
40.2%($20.5)
Room Fee20 8%20.8%($10.6)
Other Auxiliary
23
Auxiliary11.0%($5.6)
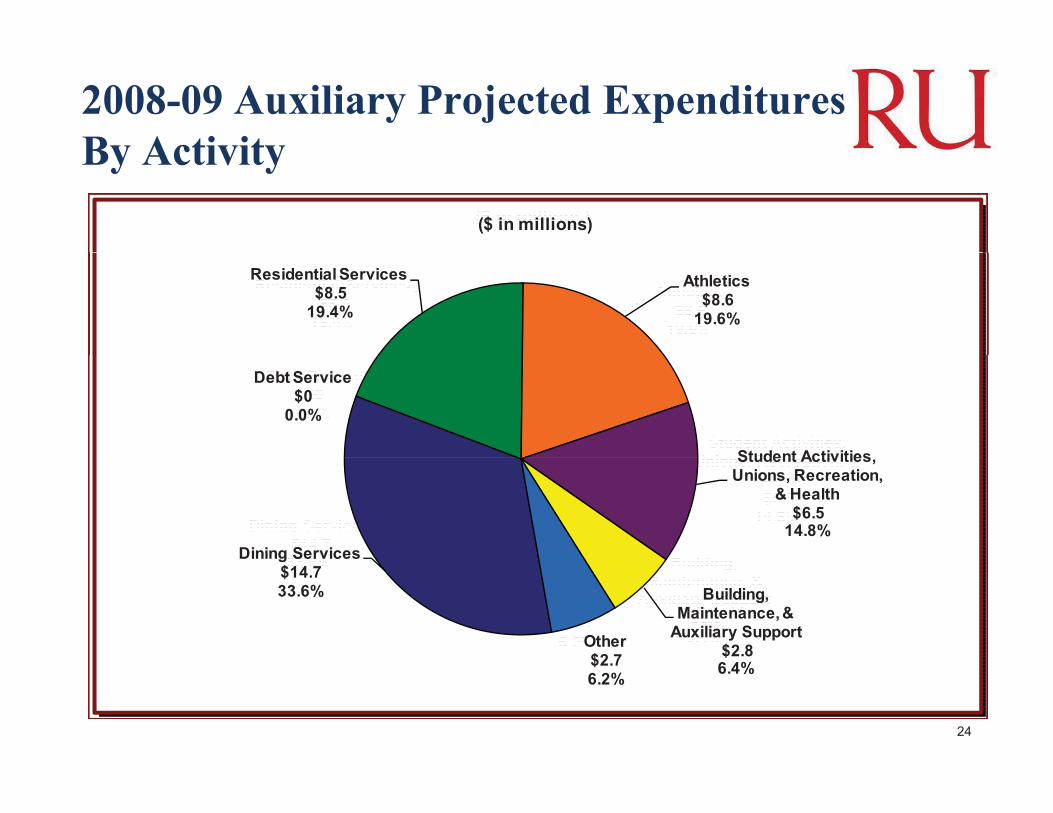
2008-09 Auxiliary Projected ExpendituresBy ActivityBy Activity
($ in millions)
Residential Services$8.5
19.4%
Athletics$8.6
19.6%
Debt Service$0
0.0%
Student Activities
Dining Services
Student Activities,Unions, Recreation,
& Health$6.5
14.8%g$14.7 33.6% Building,
Maintenance, & Auxiliary Support
$2.8 6 4%
Other$2 7
24
6.4%$2.76.2%
Auxiliary Reserve PolicyAuxiliary Reserve Policy
Types of Reserves:Types of Reserves:
� OperatingOperating
� Renewal & Replacement
� Capital
25

Student Financial Assistance
26

Student Financial Aid – Need BasedState and University FundingState and University Funding
27

University Funds For Student AidAbout 60% for Need Based AidAbout 60% for Need-Based Aid
28

Sponsored Programsp gand
Grants ManagementGrants Management
29

2008-09 Sponsored ProgramsProjected Revenue SourcesProjected Revenue Sources
30

2008-09 Sponsored ProgramsProjected Expenditures by CategoryProjected Expenditures by Category
31

B d t R d ti &Budget Reductions &Federal Stimulus Funding
32
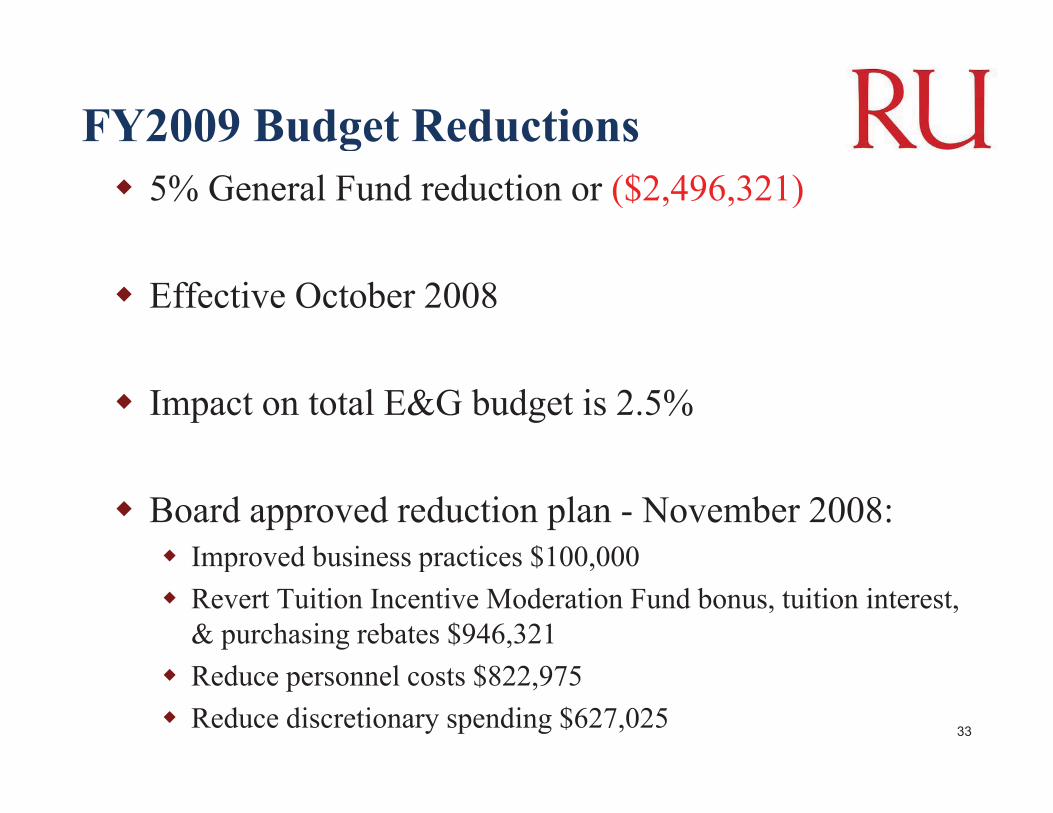
FY2009 Budget Reductionsg� 5% General Fund reduction or ($2,496,321)
� Effective October 2008
� Impact on total E&G budget is 2.5%
� Board approved reduction plan - November 2008: � Improved business practices $100 000� Improved business practices $100,000� Revert Tuition Incentive Moderation Fund bonus, tuition interest,
& purchasing rebates $946,321� Reduce personnel costs $822,975� Reduce discretionary spending $627,025 33

FY2010 Budget Reductionsg
� 15% General Fund reduction or ($7,548,755)
� Impact on total E&G budget is 7.5%
� Effective July 1, 2009
� Divisions developing long-term strategies for id iconsideration
� F d l Sti l f di id d t b id th� Federal Stimulus funding provided to bridge the gap 34
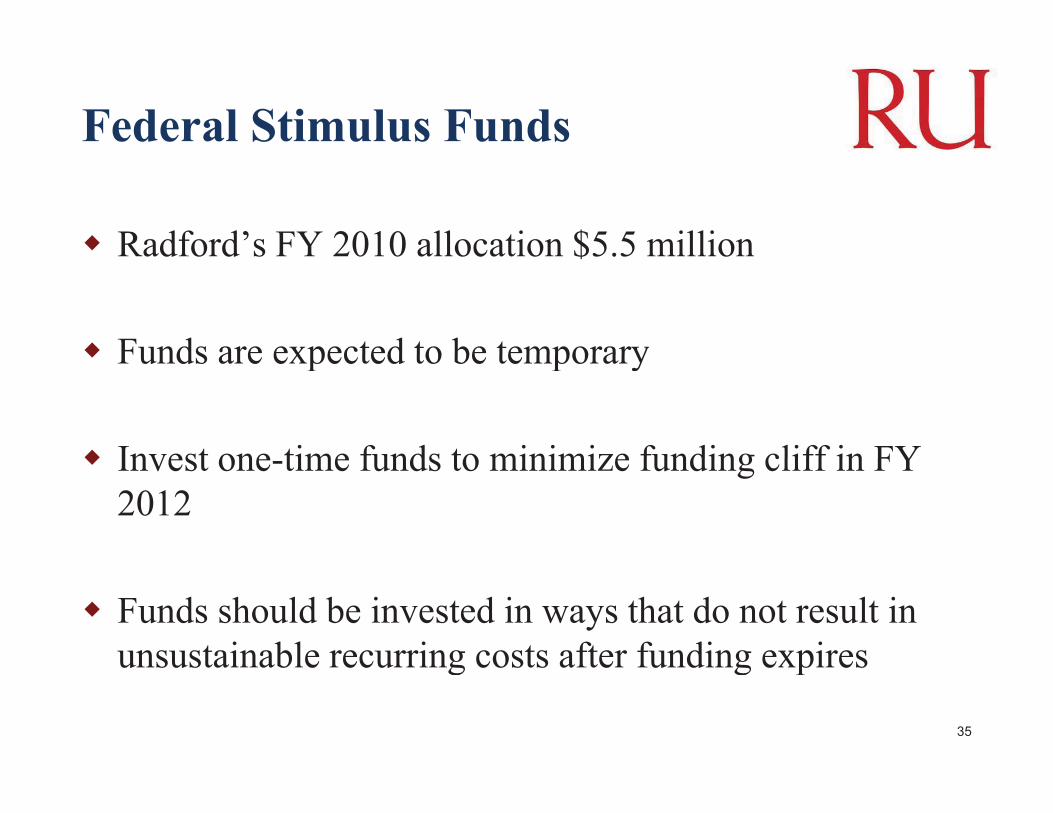
Federal Stimulus Funds
� Radford’s FY 2010 allocation $5.5 millionRadford s FY 2010 allocation $5.5 million
� Funds are expected to be temporary� Funds are expected to be temporary
� Invest one time funds to minimize funding cliff in FY� Invest one-time funds to minimize funding cliff in FY2012
� Funds should be invested in ways that do not result in unsustainable recurring costs after funding expiresunsustainable recurring costs after funding expires
35
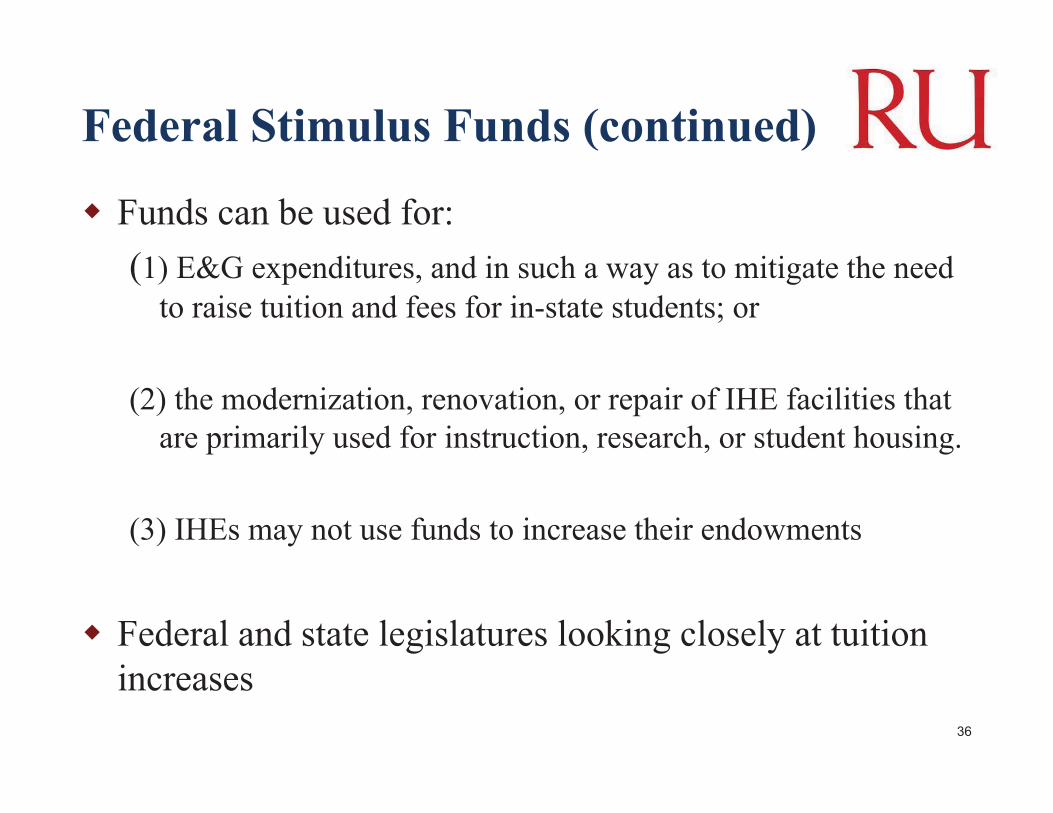
Federal Stimulus Funds (continued)( )
� Funds can be used for:((1) E&G expenditures, and in such a way as to mitigate the need
to raise tuition and fees for in-state students; or
(2) the modernization, renovation, or repair of IHE facilities that are primarily used for instruction, research, or student housing.
(3) IHEs may not use funds to increase their endowments
� Federal and state legislatures looking closely at tuition increases
36

Sources
1) State Council of Higher Education for Virginia (SCHEV) Preliminary 2008-09 Tuition and Fees at Virginia’sy gState-Supported Colleges and Universities Report
2) Virginia Acts of Assembly – Chapter 847 and Chapter 879
3) American Recovery and Reinvestment Act
37