planet - ibiweb.org · 50.0% implementation > 4 x-4-3-2-1 0 1 2 3 termination ... prepost mean...
TRANSCRIPT


Planetengagement
It can seem like rocket science……

But then, rocket science isn’t what it used to be ….
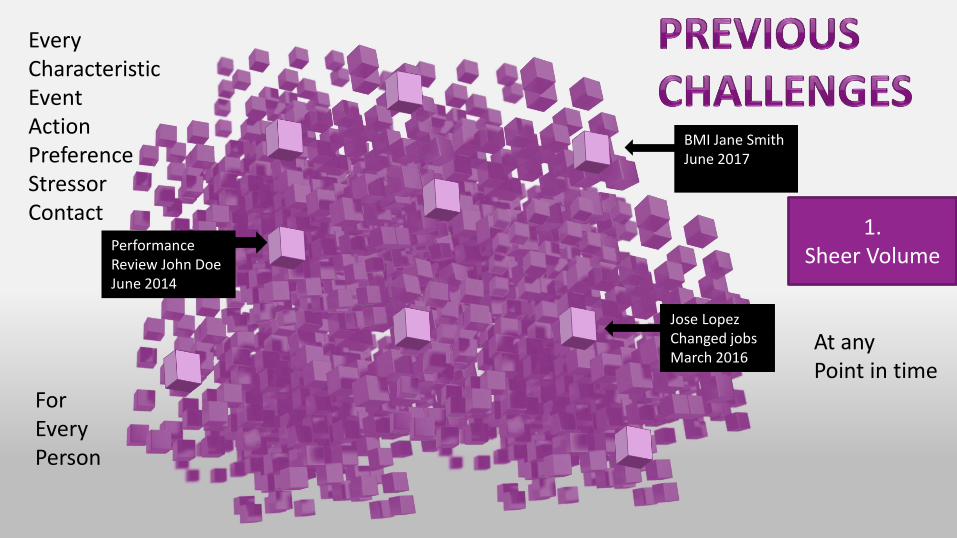
1. Sheer Volume
BMI Jane SmithJune 2017
Jose LopezChanged jobs March 2016
EveryCharacteristicEventActionPreferenceStressorContact
At anyPoint in time
ForEvery Person
PerformanceReview John DoeJune 2014

People
2. Complexity

3.Time

By PresenterMedia.com
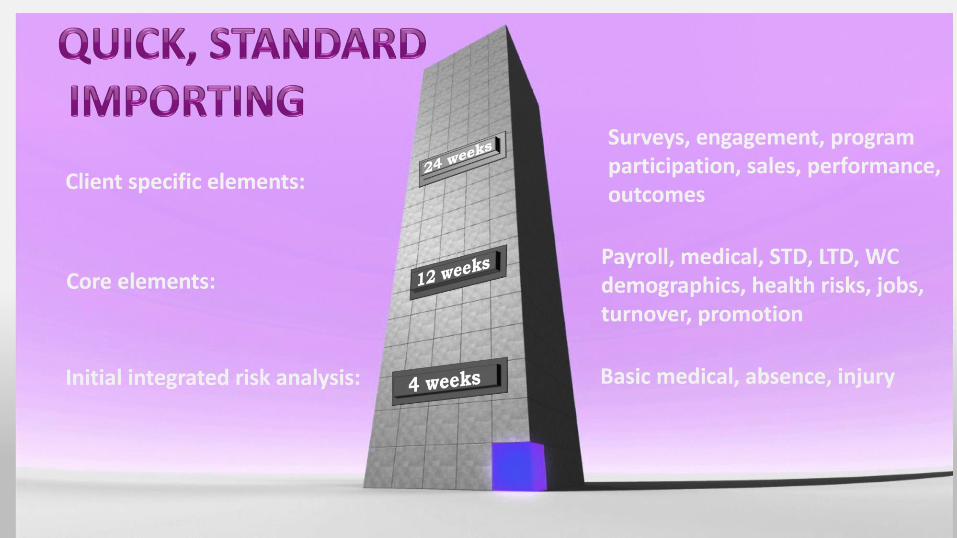
Initial integrated risk analysis:
Core elements:
Client specific elements:
Basic medical, absence, injury
Payroll, medical, STD, LTD, WCdemographics, health risks, jobs,turnover, promotion
Surveys, engagement, programparticipation, sales, performance,outcomes
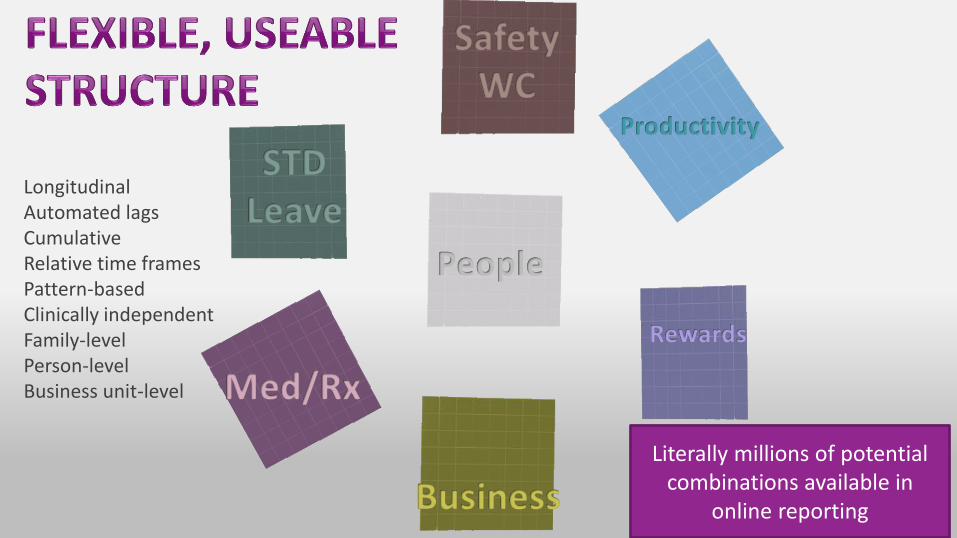
Literally millions of potential combinations available in
online reporting
LongitudinalAutomated lagsCumulativeRelative time framesPattern-basedClinically independentFamily-levelPerson-levelBusiness unit-level
People

Focus on Key Issues Happening Now• What is happening• Where it is happening• Who is at risk• Linked to effective intervention
Real time, not retrospective

Because
• Computing power
• Storage space
• Statistical Methods
• Open source
Allows
• 800-1000 variables
• 100K people
• Automatically Updated (monthly)
• Short lags 1-10 days (Dx/Rx-30)
• Machine learning to optimize prediction
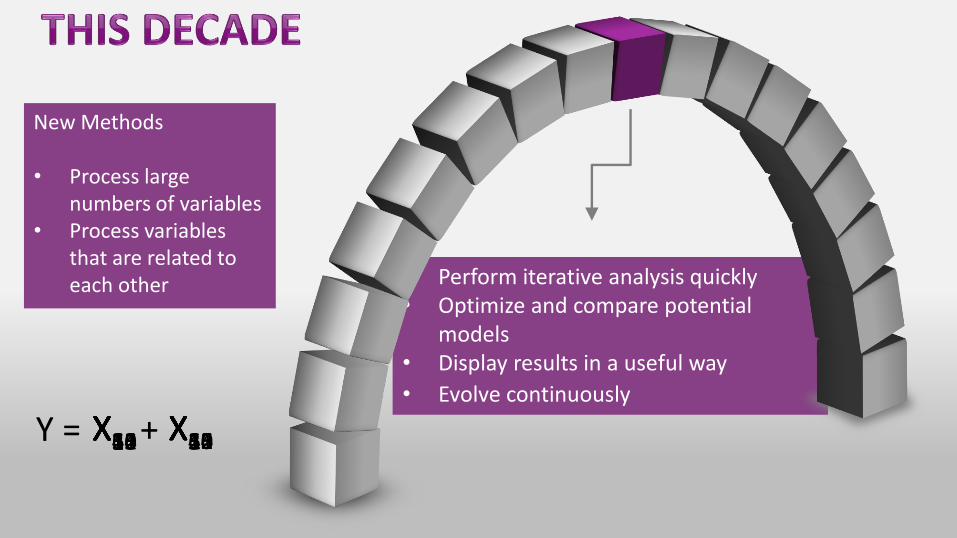
• Perform iterative analysis quickly• Optimize and compare potential
models • Display results in a useful way
• Evolve continuously
New Methods
• Process large numbers of variables
• Process variables that are related to each other
X1X2X3X4X5X6 X10X11X12X13X14X15X16X10X11X12X13X14X15X16 X1X2X3X4X5X6Y = +

Big Data Leverage
1. Identification
2. Coordination
3. Alignment
Integrate delivery
Integrate Data
Integrate policy andstrategy

Depending on circumstances
94%0.00001%
Turnover likelihood ranges from


100%
75%
50%
25%
0%
Percent still out
0 25 50 75 100 125
Days since claim
65%Typical group. Half have returned in 60 days. 12%
still out in 100 days.
Prolonged group. Half have returned in 80 days. 35% still out in 100 days.
10%
25%
Quick-return group. Half have returned in 40 days. 12% still out in 100 days.

Embedded PowerPoint VideoBy PresenterMedia.com
It’s the combination of integrated factors….
That predict:Injury/accidentsTurnoverAbsencePerformance...
Almost anything

Why predict need for services?
5% of group health spend.
But spread across 34% of people…
Who generate 74% of all integrated costs.

Medical claims and Rx
Recent HRA
Historic HRA & Risk Changes
Schedule, job, engagement
Leave
Workers Comp
STD
Identified Accuracy
12
58%
45
67%
138
79%
41080%
ContinuousImprovement
Accuracy >90%
Each month:
35 new cases.30 accurate.
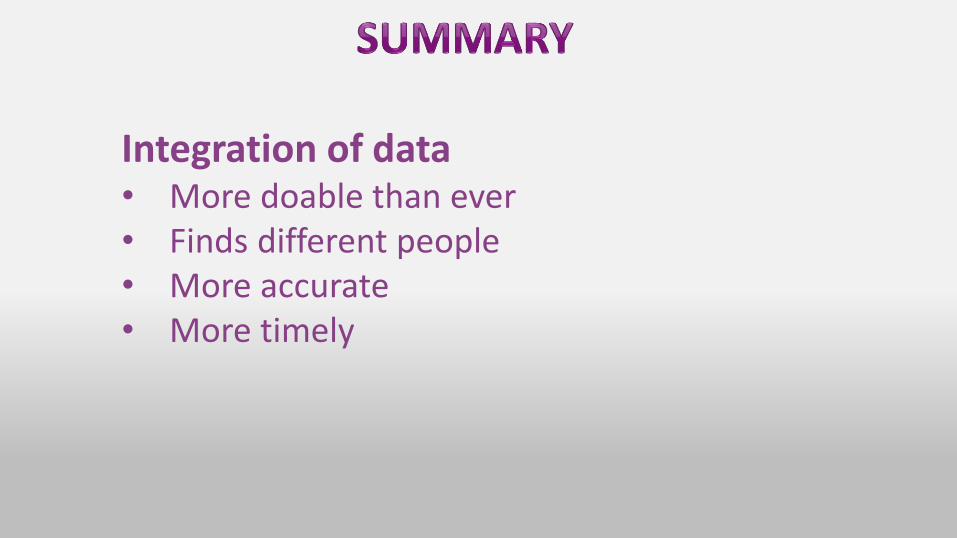
Integration of data• More doable than ever• Finds different people• More accurate• More timely

Planetengagement
The real challenge……?
Making it easy.PART 2: INTEGRATED SERVICES

Push
Engagement has been…
Pull
ScareSurprise

sneak bribe
or…
shame

We needed another way

Who Is WorkPartners?
Data
Integration
HCMS data
solutions
Workers’
Compensation
TPA & Fully Insured
On-site Services
Employee Health &
Acute Care Clinics
LifeSolutions
EAP & Health
Management
Solutions
Absence
Management
Leave & STD Services
High Int. Cost
Management
5% producing
50% of costs

Integration at the program level
1. Is not easy, but it can be done.2. Leverages existing contacts to dramatically
improve engagement.3. Improves health and business outcomes.

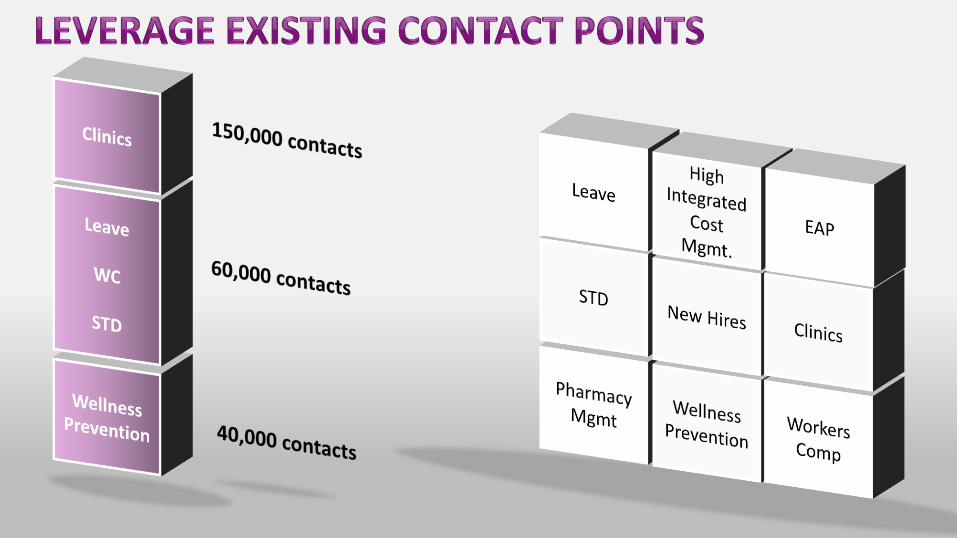
Who “touches” which contact point,
When does it happen?
Which other contact might they benefit from?
Fully Integrated Data
Systemic integration: Flags and participation
Operational integration:Training, support for cross- referrals

Wellness was our main“doorway”
FMLA

When a doctor prescribes a wellness intervention…..
FMLA

91.5%
70.2%
37.0%
17.5%
41.2% 38.7%
3.1% 1.7%
0.0%
10.0%
20.0%
30.0%
40.0%
50.0%
60.0%
70.0%
80.0%
90.0%
100.0%
% Reached % Participated % Enrolled % Graduated
Engagement Rate Comparisons
Prescription for Wellness* Non-Prescription for Wellness (Passive)**
• Imbedded in computerized records (EPIC)
• A Rx creates expectation for follow-up and “filling” the order.The Power of the White Coat
Example #1: Prescription (Rx) for Wellness
Referring at 6.5 X the rate
compared to NOT integrated in the
EPIC system

32
Health Risks Significantly Reduced:
• Poor Diet• High BMI• Tobacco Use• Low Physical Activity• Sick Days• High Blood Pressure• Poor Health
Perception• Seat Belt Usage
57.8%
30.8%
11.4%
62.0%
30.2%
7.7%
0.0%
10.0%
20.0%
30.0%
40.0%
50.0%
60.0%
70.0%
Low Risk Mod Risk High Risk
% of Member by Risk LevelPre and Post Rx for Wellness
Pre Post
19.2%
67.4%
13.4% Improved Risk Level
Maintained Risk Level
Increased Risk Level
Example #1: Prescription (Rx) for Wellness

Fully Integrated Data
When all services, utilization and risks areintegrated, referrals can beneed-driven in real time.

Medical claims and Rx
Recent HRA
Historic HRA & Changes
Schedule, job, engagement
Leave
Workers Comp
STD
Identified Accuracy
58%
45
67%
138
41080%Each month:
35 new cases
Predicted with:

Over 55% will come though another door
EAP
FMLA38%

20%
30%
40%
50%
60%
70%
80%
Q1 2016 Q2 2016 Q3 2016 Q4 2016 Q1 2017 Q2 2017 Q3 2017 Q4 2017
Engagement Rates of Those Reached
Integrated referral We call member Member calls for help

Rate of depression DOUBLES after an employee take a medical leave to care for a loved one…..


After integrated referral… engagement
13.1%
8.2%
5.6% 5.7% 5.5%
13.2%
19.5%
42.2%41.4%
38.3%37.2%
44.0%
40.9%
31.8%
23.9%
17.1%
21.6%
32.6%
38.8%
26.5%
33.9%32.2%
30.0%30.3%30.4%28.4%
19.9%20.8%
26.4%
0.0%
5.0%
10.0%
15.0%
20.0%
25.0%
30.0%
35.0%
40.0%
45.0%
50.0% Implementation >
4 X

-4
-3
-2
-1
0
1
2
3
Termination(transferred)
Termination(engaged)
Very satisfied Feel cared forby employer
2 times lesslikely to quit
1.6 times more likely
Almost 4 timesless likely to quit
1.6 times more likely

$3,544
$3,370 $3,419
$4,993
$2,000
$2,500
$3,000
$3,500
$4,000
$4,500
$5,000
$5,500
Pre Post
Mean Integrated Cost Paid
Engaged (n = 65) Not Engaged (n = 390)
(6 mos)
5.05
5.02
4.25
8.03
3.00
4.00
5.00
6.00
7.00
8.00
9.00
Pre Post
Mean Lost Work Days
Engaged (n = 65) Not Engaged (n = 390)
(6 mos)
Matched comparison: demographics and pre-cost
P=0.06 P<0.05
Diff: 3 days Diff: $1,623
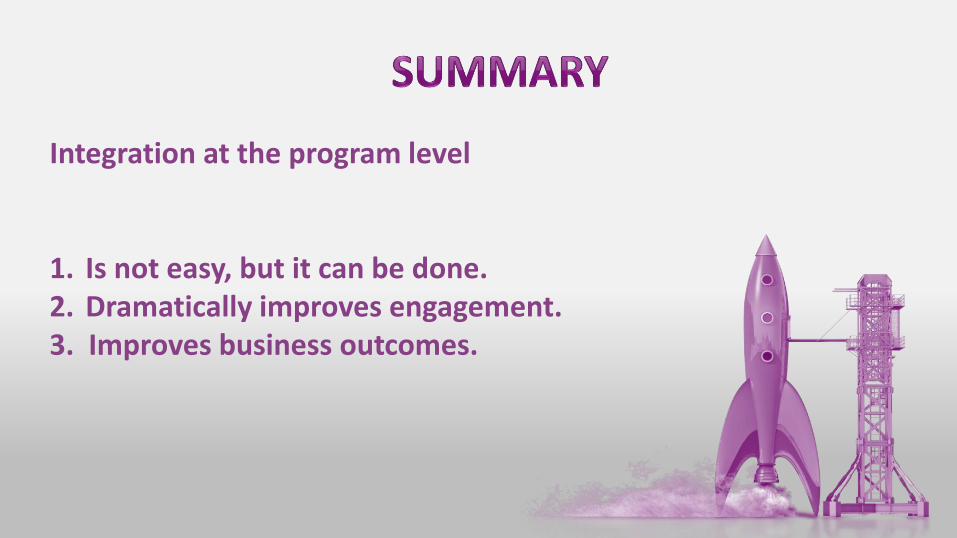
Integration at the program level
1. Is not easy, but it can be done.2. Dramatically improves engagement.3. Improves business outcomes.

Leveraging strategy and policy tomaximize the value of broad integration.

Highly integrated system with
an academic medical center
hub that is closely affiliated
with the University of
Pittsburgh
UPMC Health Services Division
has:
• More than 20 academic,
community, and regional hospitals
with more than 5,000 licensed beds
• More than 500 clinical locations in
western Pennsylvania
• More than 70 inpatient, outpatient
& long-term care facilities for
rehabilitation services
• More than 3.9 million outpatients
visits
UPMC HEALTH
SERVICES DIVISIONUPMC ENTERPRISES UPMC INSURANCE
SERVICES DIVISIONUPMC INTERNATIONAL
UPMC Insurance Services Division
has:
• More than 2.9 million members in
FY16
• $7 billion in top line revenue
• 33% market share across all
covered lives in western
Pennsylvania
• The largest behavioral health
insurance provider in Pennsylvania

UPMC’s mission is to serve our community by
providing outstanding patient care and to shape
tomorrow’s health system through clinical and
technological innovation, research, and education.
Mission

Demonstrating optimal health status as defined by positive health behaviors; minimal modifiable risk factors; and minimal illnesses, diseases, and injuries
Functioning to produce the maximum contribution to achievement of personal goals and the organizational mission
Possessing an ability to respond to changing demands given the increasing pace and unpredictable nature of work
Adjusting to setbacks, increased demands, or unusual challenges by bouncing back to optimal well-being and performance without incurring severe functional decrement
*IOM: Integrating Employee Health: A Report for NASA 2007
HEALTHY
PRODUCTIVE
READY
RESILIENT

Health MeasurePittsburgh Ranking vs. 14 Similar U.S.
Economic Regions
Diabetes 19% 13th
Fatal Heart Attacks 25.3% 12th
Obesity 36.6% 10th
Our Challenge: Growing Healthier and More Productive Employees and Businesses

Healthcare employees:
• 10% higher healthcare costs
• Hospital employees and families have 13% higher healthcare costs
• Hospital employees & families have 8.6% more illness
• Hospital workers & families had fewer physician office visits, yet were 22% more likely to visit the ER
• The average annual cost of healthcare for hospital employees was $4,662, $538 higher than the general employee population.
(Source: CHICAGO | Monday Sept 12, 2011 12:25am EDT (Reuters)

Human CapitalRetentionAbsenceSafety
HealthMental health Musculoskeletal
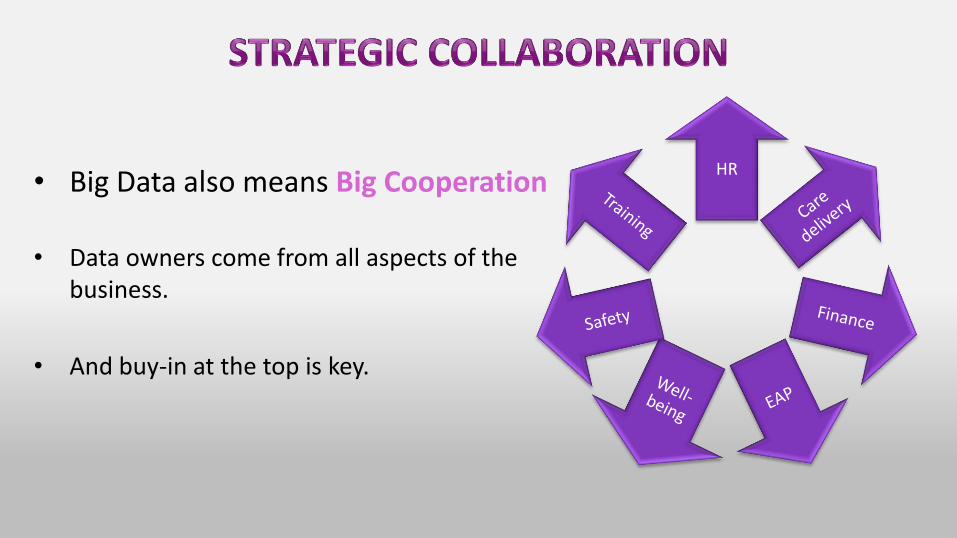
• Big Data also means Big Cooperation
• Data owners come from all aspects of the business.
• And buy-in at the top is key.
HR


We know policy and strategy influenceeach other.
Tighter STD and PTO policy increasesuse of workers compensation and FMLA.
How we pay people affects how they usebenefits and how they perform.

Engagement in EAP andhealth coaching was low.
A significant portion of new hires developed new health risks and stress within 18 monthsand had almost double the rate of disability and workers compensation.
Policies and processes wereimplemented to conduct HRA duringonboarding, enhance safety training.

Dramatic increase in engagement with health coach for review.

Data show important predictors of turnover, including job issues, engagement, pay for high performers,recent leave and disability.
HR fine-tuning bonus and performance evaluation methods.Intervening in low-rated departments.
Program integration indicates whenindividuals may need additional support.

4%
5%10%
55%
75%
0%
10%
20%
30%
40%
50%
60%
70%
80%
2012 2013 2014 2015 2016 2017
Top performers
Marginal performers
Superior performers
Good performers
Poor performers
Embedded PowerPoint VideoBy PresenterMedia.com

You’ll be ready for blast-off…..