place of birth immigration nationality foreign language ... · place of birth immigration...
TRANSCRIPT

5. Diversity
Place of birth
Immigration
Nationality
Foreign language and ability to speak English
Visitors

46
Diversity
Born abroad
The number of Irish residents born outside Ireland continued to increase and stood at 810,406 in 2016, an increase of 43,636 on the 2011 figure. In April 2016, persons born abroad accounted for 17.3 per cent of the population, up from 17 per cent in 2011.
However, this increase is in sharp contrast to the previous inter-censal period which saw the number born outside Ireland rise by 154,141 over the period 2006 to 2011.
See web table EY020
Country 2011 2016 Actual change
Romania 17,995 28,702 10,707
Brazil 9,298 15,796 6,498
Spain 7,003 11,809 4,806
Pakistan 8,329 12,891 4,562
Croatia 980 5,202 4,222
Italy 7,146 10,913 3,767
India 17,856 20,969 3,113
Moldova 3,421 6,472 3,051
France 10,070 11,906 1,836
Portugal 2,246 3,866 1,620
Other 682,426 681,880 -546
Total 766,770 810,406 43,636
Table 5.1 Place of birth of Irish residents from countries withlargest increases, 2011 - 2016
Romanians, Brazilians and Spanish show largest increases
The groups which showed the largest increase were those already well established in Ireland. The fastest growing groups in absolute terms were Romanians (up 10,707), Brazilians (up 6,498) and Spanish (up 4,806).
Other smaller groups showed large increases in percentage terms such as Croatia which increased by 431 per cent to 5,202, Venezuela (increased by 259% to 1,729), Afghanistan (increased by 212 % to 1,729) and Syria (increased by 199% to 920).
Figure 5.1 Fall in persons born abroad from selected countries, 2016
Those born in the UK and Nigeria show largest decreases
Between 2011 and 2016 the number of Irish residents born in the UK fell by 11,421. Other countries also showed falls, as presented in Figure 5.1. The number of those born in Nigeria fell by 3,211 and from Lithuania by 1,503.
In total the number of persons born in 58 different countries fell during this most recent inter-censal period.
It’s a fact!
17.3%
11,421
The percentage of Irish residents born abroad (up 0.3% on 2011)
The decrease in the number of Irish residents born in the UK
-12 -10 -8 -6 -4 -2 0
Estonia
Czech Republic
Mauritius
Latvia
Slovakia
Lithuania
Nigeria
UK
'000s
47
Diversity
Immigration
A question on usual residence one year ago provides information on inward migration in the year leading up to the census. The results show that 82,346 persons moved to Ireland in the year to April 2016. Of this, 28,143 were Irish nationals, up from 19,593 in the year to April 2011.
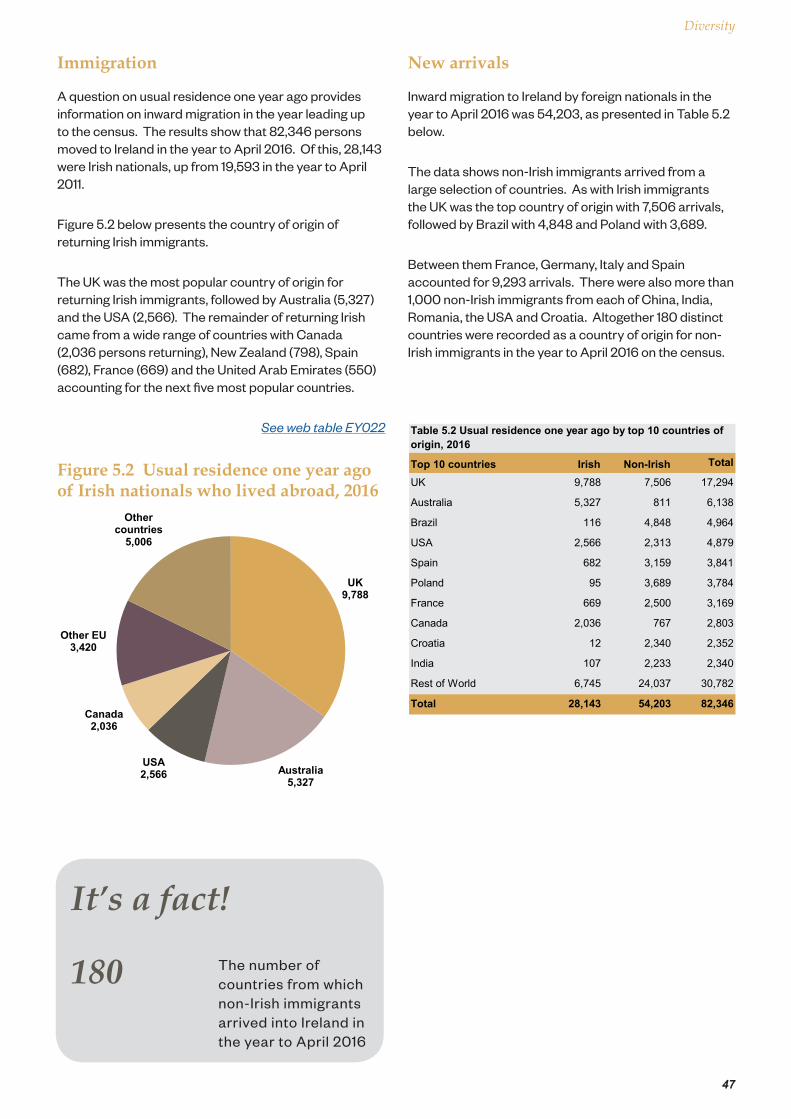
Figure 5.2 below presents the country of origin of returning Irish immigrants.
The UK was the most popular country of origin for returning Irish immigrants, followed by Australia (5,327) and the USA (2,566). The remainder of returning Irish came from a wide range of countries with Canada (2,036 persons returning), New Zealand (798), Spain (682), France (669) and the United Arab Emirates (550) accounting for the next five most popular countries.
See web table EY022
Figure 5.2 Usual residence one year ago of Irish nationals who lived abroad, 2016
New arrivals
Inward migration to Ireland by foreign nationals in the year to April 2016 was 54,203, as presented in Table 5.2 below.
The data shows non-Irish immigrants arrived from a large selection of countries. As with Irish immigrants the UK was the top country of origin with 7,506 arrivals, followed by Brazil with 4,848 and Poland with 3,689.
Between them France, Germany, Italy and Spain accounted for 9,293 arrivals. There were also more than 1,000 non-Irish immigrants from each of China, India, Romania, the USA and Croatia. Altogether 180 distinct countries were recorded as a country of origin for non-Irish immigrants in the year to April 2016 on the census.
Top 10 countries Irish Non-Irish Total
UK 9,788 7,506 17,294
Australia 5,327 811 6,138
Brazil 116 4,848 4,964
USA 2,566 2,313 4,879
Spain 682 3,159 3,841
Poland 95 3,689 3,784
France 669 2,500 3,169
Canada 2,036 767 2,803
Croatia 12 2,340 2,352
India 107 2,233 2,340
Rest of World 6,745 24,037 30,782
Total 28,143 54,203 82,346
Table 5.2 Usual residence one year ago by top 10 countries of origin, 2016
UK9,788
Australia 5,327
USA2,566
Canada 2,036
Other EU 3,420
Other countries
5,006
It’s a fact!
180 The number of countries from which non-Irish immigrants arrived into Ireland in the year to April 2016

48
Diversity
Ever lived abroad
Census 2016 included a question on whether a person had ever lived abroad. Responses provide important information on the year of arrival and country of previous residence.
Table 5.3 presents the data by year of taking up residence in Ireland, broken down by Irish and non-Irish
nationals. For those who answered the question, the results show that 165,612 residents arrived in the years 2012 to 2016, of whom 70,782 were Irish nationals.
The United Kingdom was the most popular country of previous residence with 37,495 persons followed by the EU15 with 27,115 persons.
See web table EY023
Total 1997 - 2001 2002 - 2006 2007 - 2011 2012 - 2016
IrishAll countries 302,935 91,031 79,546 61,576 70,782
United Kingdom 124,629 46,615 31,595 22,881 23,538
EU15 excluding Ireland & UK 25,738 6,648 6,390 5,616 7,084
EU15 to EU28 states 6,411 1,511 2,458 1,473 969
USA 35,299 11,512 10,408 6,301 7,078
Other countries 110,858 24,745 28,695 25,305 32,113
Non-Irish
All countries 251,044 27,217 69,682 59,922 94,223
United Kingdom 53,183 14,381 14,333 10,630 13,839
EU15 excluding Ireland & UK 37,871 4,237 6,002 7,663 19,969
EU15 to EU28 states 94,941 3,701 39,227 28,057 23,956
USA 7,737 821 1,305 1,549 4,062
Other countries 57,312 4,077 8,815 12,023 32,397
No nationality (incl. not stated)
All countries 1,978 397 510 464 607
United Kingdom 589 191 163 117 118
EU15 excluding Ireland & UK 149 26 28 33 62
EU15 to EU28 states 430 43 149 121 117
USA 116 39 27 16 34
Other countries 694 98 143 177 276
Total 555,957 118,645 149,738 121,962 165,612
Table 5.3 Irish residents by year of arrival, broad nationality and country of previous residence, 1997-2016

49
Diversity
Figure 5.3 shows the country of origin of all those who ever lived abroad by their year of arrival.
The graph illustrates the sharp peak in arrivals from the UK in the late 1990’s with just over 61,000 arrivals, the majority of whom had been born in Ireland. Arrivals from the accession states (EU15 to EU28) increased
dramatically from 5,255 in the 1997 to 2001 period to 41,834 between 2002 and 2006. Arrivals from the rest of the world have been increasing steadily since 2002 and are now the largest group, accounting for 39.1 per cent of all arrivals in the period from 2012 to 2016. Irish born persons accounted for nearly 50 per cent of this group.
Figure 5.3 Persons who lived abroad by country of origin and period of taking up residence, 2016
0
20
40
60
80
1962 to1966
1967 to1971
1972 to1977
1977 to1981
1982 to1986
1987 to1991
1992 to1996
1997 to2001
2002 to2006
2007 to2011
2012 to2016
UK EU15 excluding Ireland & UK
EU15 to EU28 states US
Other countries
'000s

50
Diversity
Irish, non-Irish
Nationality 2011 2016 % change
Irish 3,927,143 4,082,513 4.0
of which Irish only 3,871,238 3,977,729 2.8
dual Irish nationality 55,905 104,784 87.4
Non-Irish 544,357 535,475 -1.6
No nationality (incl. not stated) 53,781 71,933 33.8
Total 4,525,281 4,689,921 3.6
Table 5.4 Usually resident population by nationality, 2016
Between 2011 and 2016 the number of non-Irish nationals fell for the first time since the question was introduced on the census in 2002 and stood at 535,475 down from 544,357 five years earlier.
The proportion of the population who were non-Irish nationals has also fallen from 12.2 per cent in 2011 to 11.6 per cent in 2016.
This fall in non-Irish nationals can in part be explained by the rise in the number of those with dual Irish nationality.
Dual nationalities have always been captured and coded on the census and 55,905 persons were recorded as having dual-nationality in 2011. Since then there has been an increase in the number of people acquiring Irish citizenship, estimated at some 94,000 since the last census in 2011.
This would appear to have had an impact on the large increase in the number of persons recorded as having dual Irish nationality, up by 48,879 since April 2011 to 104,784 in April 2016.
See web table EY024
Figure 5.4 Distribution of population by nationality, 2016
Fall in UK nationals
While the number of Polish nationals (122,515) has remained virtually unchanged since 2011, the number of UK nationals fell by 9,146 to 103,113. Romanian nationals showed the largest absolute increase rising by 11,882 to 29,186. While Spanish nationals had the largest precentage increase of 78.3 per cent, large increases were also seen in Brazilian and Italian nationals. The number of Indian nationals fell by 33 per cent to 11,465.
Nationality 2011 2016 % change
Irish 3,927,143 4,082,513 4.0
Polish 122,585 122,515 -0.1
UK 112,259 103,113 -8.1
Lithuanian 36,683 36,552 -0.4
Romanian 17,304 29,186 68.7
Latvian 20,593 19,933 -3.2
Brazilian 8,704 13,640 56.7
Spanish 6,794 12,112 78.3
Italian 7,656 11,732 53.2
French 9,749 11,661 19.6
German 11,305 11,531 2.0
Indian 16,986 11,465 -32.5
American (US) 11,015 10,519 -4.5
Slovakian 10,801 9,717 -10.0
Chinese 10,896 9,575 -12.1
Table 5.5 Persons usually resident by nationality for selected countries, 2011-2016
Irish88.4%
2.7%2.2%0.8%0.6%
0.4%0.3%4.6%
Non-Irish11.6%
Polish UK Lithuanian RomanianLatvian Brazilian Other
51
Diversity
Dual Irish nationalities
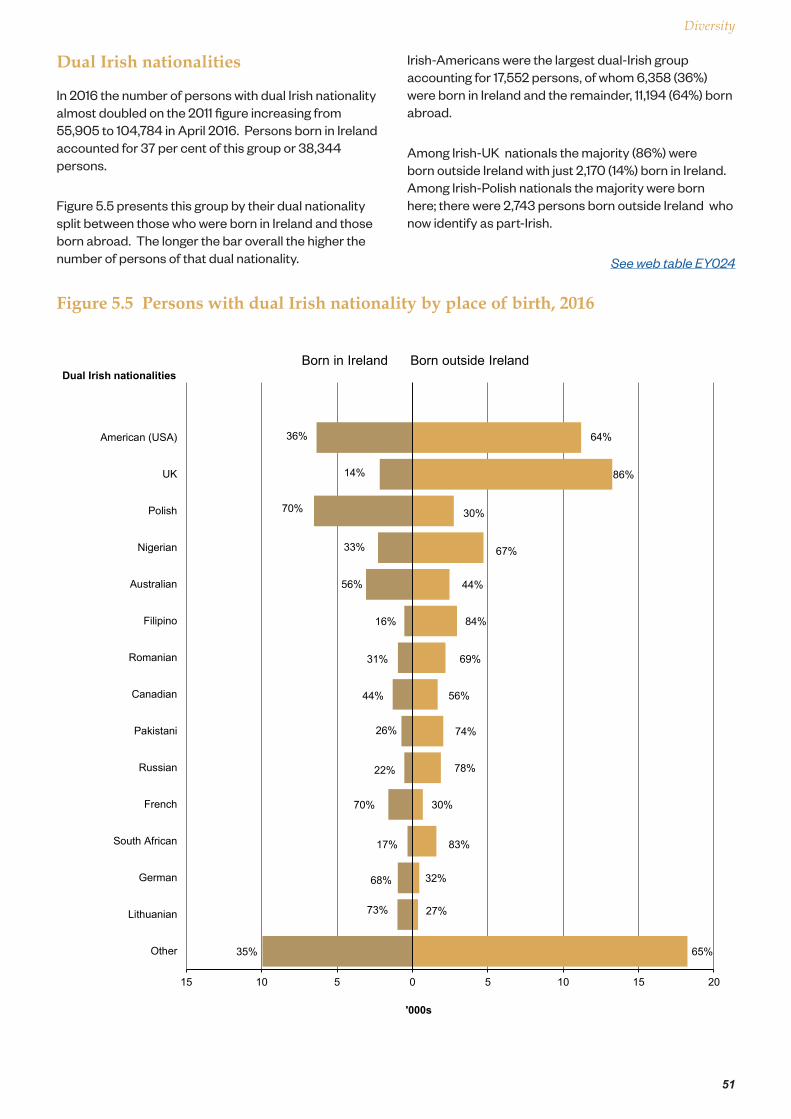
In 2016 the number of persons with dual Irish nationality almost doubled on the 2011 figure increasing from 55,905 to 104,784 in April 2016. Persons born in Ireland accounted for 37 per cent of this group or 38,344 persons.
Figure 5.5 presents this group by their dual nationality split between those who were born in Ireland and those born abroad. The longer the bar overall the higher the number of persons of that dual nationality.
Irish-Americans were the largest dual-Irish group accounting for 17,552 persons, of whom 6,358 (36%) were born in Ireland and the remainder, 11,194 (64%) born abroad.
Among Irish-UK nationals the majority (86%) were born outside Ireland with just 2,170 (14%) born in Ireland. Among Irish-Polish nationals the majority were born here; there were 2,743 persons born outside Ireland who now identify as part-Irish.
See web table EY024
Figure 5.5 Persons with dual Irish nationality by place of birth, 2016
36%
14%
70%
33%
56%
16%
31%
44%
26%
22%
70%
17%
68%
73%
35%
64%
86%
30%
67%
44%
84%
69%
56%
74%
78%
30%
83%
32%
27%
65%
15 10 5 0 5 10 15 20
American (USA)
UK
Polish
Nigerian
Australian
Filipino
Romanian
Canadian
Pakistani
Russian
French
South African
German
Lithuanian
Other
'000s
Dual Irish nationalitiesBorn in Ireland Born outside Ireland

52
Diversity
Figure 5.6 Population of top 10 non-Irish nationalities usually resident in the State by size and census year
UK117,095
UK126,068
Polish 122,585
Polish 122,515
USA 17,519
Polish 73,402
UK 112,259
UK 103,113
German10,196
Lithuanian 25,796
Lithuanian36,683
Lithuanian36,552
Nigerian 9,229
USA 19,308
Latvian 20,593
Romanian 29,186
French 8,772
Nigerian16,425
Nigerian17,642
Latvian 19,933
Chinese 6,392
Latvian 14,186
Romanian17,304
Brazilian 13,640
Spanish 6,122
German 13,028
Indian 16,986
Spanish12,112
Australian5,361
French 11,950
Filipino12,791
Italian 11,732
Romanian 5,247
Chinese 11,515
German 11,305
French 11,661
Italian 5,180
Filipino 9,873
USA 11,015
German 11,531
2002 2006 2011 2016

53
Diversity
Getting older
As the total number of non-Irish overall has stabilised over the past five years it can be expected that those who are here will be gradually ageing, and this is illustrated in Figure 5.7. Numbers have increased for all groups aged 35 and over and decreased for all age groups aged 34 and under.
Persons aged 65 and over increased by 34.5 per cent from 19,145 to 25,754 over the five years while the number of children aged 14 and under has fallen to 65,641, down from 78,569 in 2011.
The average age for all persons in Ireland increased by 1.3 years between 2011 and 2016. The average age of non-Irish nationals increased by almost twice that (2.5 years) over the five years rising from 32.9 to 35.4, while amongst Polish nationals the average age increased by 3.5 years rising from 27.9 to 31.4.
See web table EY024
From every corner of the world
In April 2016, there were 535,475 non-Irish nationals of over 200 different nationalities living in Ireland. However, a very small number of these accounted for the majority of persons in this group with the top 10 nationalities accounting for 69 per cent of the total.
The top 11 to 20 nationalities accounted for a further 14 per cent of all non-Irish.
All other nationalities therefore represented the remaining 17 per cent. This is reflected in the tailing off of the line on Figure 5.8.
Figure 5.7 Non-Irish population pyramid, 2011 and 2016
Figure 5.8 Non-Irish population by top nationality groupings, 2016
0 20 40 60
0-14
15 - 19
20 - 24
25 - 29
30 - 34
35 - 39
40 - 44
45 - 49
50 - 54
55 - 59
60 - 64
65+
2016 2011
'000s
0204060
0 - 14
15 - 19
20 - 24
25 - 29
30 - 34
35 - 39
40 - 44
45 - 49
50 - 54
55 - 59
60 - 64
65+
Males Females
0
10
20
30
40
50
60
70
%
Ranked number of countries

54
Diversity
A multi-lingual country
A question on foreign languages was asked for the first time in Census 2011 and covered foreign languages spoken at home and how well those who did speak another language at home could speak English.
The 2016 results show that 612,018 Irish residents spoke a foreign language at home (up 19 per cent from 514,068 in 2011). Polish was by far the most common language, followed by French, Romanian and Lithuanian.
French and Russian
The results for French and Russian are noteworthy. Of those who spoke French at home 75.1 per cent were Irish nationals, only 16.2 per cent were French nationals while 3.7 per cent were of African nationality.
Of the 21,707 persons who spoke Russian at home only 8.9 per cent were Russian nationals, while 29 .5 per cent were of Irish or dual Irish nationality, 23 per cent were Latvian nationals, 9.1 per cent were Lithuanian, 4.0 per cent Estonian and 2.5 per cent Ukranian.
See web table EY025
Language Total Born in Ireland Born elsewhere
Polish 135,895 27,197 108,698
French 54,948 36,810 18,138
Romanian 36,683 7,396 29,287
Lithuanian 35,362 6,481 28,881
Spanish 32,405 14,680 17,725
German 28,331 16,077 12,254
Russian 21,707 5,494 16,213
Portuguese 20,833 2,829 18,004
Chinese 17,584 4,691 12,893
Arabic 16,072 4,071 12,001
Other 212,198 58,197 154,001
Total 612,018 183,923 428,095
Table 5.6 Foreign languages spoken at home, 2016
Irish born and multi-lingual
Over a quarter (30%) of those who spoke a foreign language at home were born in Ireland and the languages spoken are presented in Figure 5.9. Of these, 19,743 were pre-school children (aged 3-4 years), 54,693 were primary school children and 31,078 were secondary school children. Together, these accounted for 57.4 per cent of all Irish-born speakers of foreign languages.
French was by far the most popular language spoken by those born in Ireland, with the majority of those speaking it aged 13 and over (86.5%). Polish and German were the next most popular languages.
Figure 5.9 Irish born speaking a foreign language, 2016
0 10 20 30 40
French
Polish
German
Spanish
Romanian
Lithuanian
Russian
Chinese
Italian
Arabic
'000s

55
Diversity
Ability to speak English
A question on ability to speak English was asked of those who spoke a language other than English or Irish at home. Ability was broken down into four categories - ‘very well’, ‘well’, ‘not well’ and ‘not at all’.
Of the 612,018 people who spoke another language at home 508,016 (83%) indicated they could speak English ‘well’ or ‘very well’, while 86,608 people (14.2%) indicated ‘not well’ or ‘not at all’.
Figure 5.10 presents the data by nationality. While persons from Poland had the highest absolute number of persons who spoke English ‘not well’ or ‘not at all’ (21,316 or 18.8%) those from Afghanistan had the highest percentage (466 or 44.4%), followed by persons from China (2,234 or 28.5%).
See web table EY027
Figure 5.10 Ability to speak English by selected nationality, 2016
0% 50% 100%
Swedish
German
Dutch
Filipino
French
Nigerian
Indian
Polish
Brazilian
Romanian
Latvian
Lithuanian
Chinese
Afghan
Very well Well Not well Not at all Not stated
Highest ability
Lowest ability

56
Diversity
Ability to speak English by age group
Table 5.7 presents the data by age group separating out the various stages of education and working life.
Of the 22,221 pre-school children (aged 3-4 years) who spoke a foreign language at home 1,710 (8%) could not speak English at all while a further 5,989 could not speak English well.
Ability improves rapidly once children start school with only 386 children unable to speak English in primary school going years.
Children of secondary school age were the cohort with the best English speaking ability as can be seen in Table 5.7.
There were 2,469 persons aged 65 years and over who could not speak English well or at all. This equates to 20 per cent of persons in that age group.
See web table EY028
Age group Total Very well Well Not well Not at all
Pre-school 3-4 years 22,221 7,254 7,268 5,989 1,710
Primary 5-12 years 76,301 55,694 15,991 4,230 386
Secondary 13 - 18 years 56,296 44,578 8,605 2,916 197
Young adult 19 - 24 years 45,839 28,153 12,904 4,413 369
Working age 25-64 years 365,887 182,806 129,150 48,829 5,102
Older people 65 years and over 12,303 7,729 2,105 1,564 905
Total 578,847 326,214 176,023 67,941 8,669
Table 5.7 Ability to speak English by age group, 2016

57
Diversity
Visitors on Census Night
The Irish census is conducted on a De Facto basis which means that everyone who is in the country on Census Night is enumerated on a census form.
There were 71,944 visitors in Ireland on Census Night, an increase of 8,973 on the 2011 figure of 62,971.
Figure 5.11 presents the distribution of visitors by country of usual residence.
The largest group were UK residents with 21,861 persons, representing 30 per cent of all visitors, followed by those from the USA with 11,461 visitors (16% of total).
There were significant numbers of visitors from France (5,535), Germany (4,572) and Spain (3,323). There were 4,032 visitors from Asia and 2,535 from Australia.
Figure 5.11 Where visitors usually live, 2016
UK30%
Germany6%
Spain5%
France8%Italy
4%
USA16%
Other America
5%
Asia6%
Australia3%
Rest of the World17%
Table 5.8 Visitors from abroad, 2016
CountryPrivate
HouseholdsHotels & Guest
houses Other Total
UK 12,440 9,133 288 21,861
France 3,002 2,045 488 5,535
Germany 1,997 2,419 156 4,572
Spain 2,472 561 290 3,323
Italy 1,205 1,344 37 2,586
Poland 1,575 185 45 1,805
Other Eurpoe 933 766 118 1,817
USA 4,069 7,212 180 11,461
Other America 2,309 1,037 189 3,535
Australia 1,668 810 57 2,535
Asian Countries 3,133 724 175 4,032
Rest of World 5,293 3,266 323 8,882
Total 40,096 29,502 2,346 71,944
Hotels and guest houses
Of the total 71,944 visitors in Ireland on Census Night , 29,502 were staying in hotels and guest houses with a further 2,346 staying in other tourist accommodation.
Persons from the UK, numbering 9,133, made up the largest group in hotels and guest houses, followed by persons from the USA at 7,212 with Germany the third largest group at 2,419.
People from France favoured guest houses over hotels whereas nearly all other groups had more persons staying in hotels over other tourist accommodation.
Over half (55.7%) of all visitors in Ireland were staying in private households, presumably visiting family and friends.
See web table EY010
It’s a fact!
71,944 The total number of visitors in Ireland on Census Night