place matters: challenges and opportunities in four rural
TRANSCRIPT

Place MattersChallenges and Opportunities
in Four Rural Americas
L AwRenCe C. HAMiLtOn LesLie R . HAMiLtOn
CyntHiA M. DunCAn CHRis R . C OLO C Ousis
RePORt s On RuR AL AMeRiCA

Building Knowledge for Families and Communities
RePORt s On RuR AL AMeRiCAVolume 1, number 4
support provided by the w.K. Kellogg, Ford, and Mary K. Reynolds Babcock Foundations and the neil and Louise tillotson Fund of the new Hampshire Charitable Foundation.
© Copyright 2008
Carsey institute university of new Hampshire Huddleston Hall73 Main streetDurham, new Hampshire 03824-3563
(603) 862-2821
www.carseyinstitute.unh.edu
Director: Cynthia M. DuncanDeputy Director: Curt Grimmsenior Fellow and Director of evaluation Program: sally wardCommunications Director: Amy sterndale
executive Committee members:Ross Gittell, Ph.D. James R. Carter Professor and Professor of Management whittemore school of Business & economicsLawrence Hamilton, Ph.D. Professor sociologyDavid Pillemer, ed.D. Dr. samuel e. Paul Professor of Developmental Psychology PsychologyJan A. nisbet, Ph.D. Director, institute on DisabilityRobert J. woodward, Ph.D. Forrest D. McKerley Chair Health economics

Place MattersChallenges and Opportunities
in Four Rural Americas
Lawrence C. Hamilton
Leslie R. Hamilton
Cynthia M. Duncan
Chris R. Colocousis
A Carsey Institute Report on Rural America

2
table of Contents
Executive Summary 3
Introduction 6
Four Rural Americas in the 21st Century
The CeRA surveys
Jobs, Homes, and Education 10
Population, Migration, and Marriage 14
Ties and Beliefs 17
Environment and Resources 20
Outlook on the Future 23
Overview: Portrait of Four Rural Americas 26
Amenity-rich rural America
Declining resource-dependent rural America
Chronically poor rural America
Amenity/decline rural America
Discussion and Policy Considerations 28
Amenity-rich
Declining resource-dependent
Chronic poverty
Amenity/decline
Conclusion 30
Endnotes 31
References 31

3
executive summary
A New Survey of Rural America
in the fall of 2007, researchers at the Carsey institute at the university of new Hampshire completed the first stages of the Community and environment in Rural America
(CeRA) survey. nearly 8,000 residents in 19 carefully selected rural counties were interviewed in the comprehensive survey to determine their opinions, experiences, and attitudes about the changes occurring in their lives, the lives of their families, and in their communities. we examined rural life using so-cioeconomic, cultural, and demographic indicators as guides, rather than outdated notions of what “rural” is.
Rural America is much more than a simple set of geographic locations or goods-producing regions. The complexity of rural places necessitates a nuanced approach that takes into account the diversity of its residents as well as economic, political, and environmental changes. Through previous research, we identi-fied four broad types of rural places: amenity-rich, declining resource-dependent, and chronically poor regions, as well as a fourth transitional type characterized by both amenity-driven growth and resource-based decline. This “four rurals” para-digm captures the often contradictory sets of forces that are re-shaping rural places, and is particularly useful when analyzing rural trends and conditions, and guiding policy discussion.
The CeRA survey analysis focused on five main sets of is-sues that have emerged as particularly salient for understand-ing the state of rural places in America today.
Economic changes, challenges, and realities. Globalization is changing the rural economy; agriculture and low-skilled man-ufacturing are no longer key drivers. in their place is a growing service sector, including some jobs which require greater skills, education, and training than in the past. survey questions asked people about their jobs, income, education, and experi-ences in local labor markets.
Migration and demographic changes. Populations in declin-ing, chronically poor, and amenity/decline counties are aging as young adults leave, older residents remain, and reproduc-tion rates fall. Amenity-rich areas, meanwhile, are attracting a cohort of newcomers—baby boomers seeking to retire, and young professional families looking for jobs and safe environ-ments in which to raise families. while the general population in many areas remains predominantly non-Hispanic white, certain areas are seeing an influx of immigrant groups; since 2000, one third of total population growth in rural America has
been comprised of Hispanics (Johnson, 2006). survey ques-tions asked how long respondents had lived in their commu-nities and where they moved from, as well as questions about their relationships and family structure.
Religion, trust, and civil institutions. Rural places are often depicted as tight-knit and homogeneous communities, but not all communities share the same civic culture. Persistently poor places are often marked by deep economic and social divisions. it cannot be taken for granted that community members are equally tied to local institutions that foster resiliency, either within or across rural places. Further, religion and politics play vastly different roles in daily life from one region to another. The survey addressed these issues with questions about trust, politics, religion, and ties to the community.
Environment, natural resources, and energy. traditional and extractive industries have left a scarred landscape and deplet-ed resources in many places, especially persistently poor and declining areas. Larger populations moving into amenity-rich regions exert pressure on the natural environment, plac-ing new demands on the water supply, waste management systems, traffic patterns, and housing supply. urban sprawl threatens communities’ abilities to maintain their rural and traditional character. Climate shifts and more frequent se-vere weather create new problems for rural life. Rising energy costs are especially devastating in rural areas where people must often travel long distances for work, services, or daily life. some survey questions asked about environmental con-servation, urban sprawl, global warming, and recreational use of the land.
Infrastructure and changing populations. Federal investment in community infrastructure has been declining for years. Fis-cal problems are widespread as rural communities transition to new economies, while still relying on outdated systems set up to support (and be supported by) failing industries. As young people leave and the population shrinks, public funding is no longer adequate to shore up key community institutions and facilities such as housing, schools, healthcare, transportation, and telecommunication systems. Respondents were asked how they felt about the quality of their schools, their health and so-cial services, and the state of their communities going in the future. Other questions focused on when and why the respon-dents moved to their rural communities, why they stay, or why they might move away.

4
Survey Findings
n Respondents in all four types of places are worried about jobs. Only 40 percent of CeRA respondents work full-time—well below the national average. The survey data show pronounced differences in the size of the middle class across our study regions, with smaller middle classes in persistently poor places. Regional differences in education-al attainment underpin divergent economic conditions in our study areas. Home values also vary greatly from region to region, with most respondents in the Heartland report-ing very low home values. A majority in all places except the Heartland said affordable housing was a problem as well. several of our study regions are marked by indicators of housing stress, though such conditions are driven by dif-ferent dynamics across these places.
n The survey data illustrate the demographic trends outlined earlier, with fewer young people and a greater number of older people in declining areas. while racial and ethnic di-versity exists in rural America, only two of our study re-gions (Alabama’s “Black Belt”1 and the Mississippi Delta) have substantial minority populations, in this case, Afri-can-Americans. The populations of our other areas tend to be dominated by non-Hispanic whites. in declining or per-sistently poor places, only one in five residents moved there in the last ten years, while half of residents in our amenity-rich regions are relative newcomers. Regional differences in family structure also emerge, with the highest marriage rates in the Heartland, and more one-parent families in persistently poor places.
n strong traditions of self-reliance and individualism prevail in rural places, and they are coupled with very high levels of trust and civic engagement, particularly in the Heart-land. Most feel that people can work together effectively to solve problems, though many respondents across all study regions did not believe their local governments were capa-ble of dealing with important community problems. in the chronically poor counties, unlike the other three types of places, residents reported less confidence that their neigh-bors could be counted on to help each other out.
The role of religion in daily life also varies greatly across our study regions, as do political affiliations. More Republicans live in the Heartland communities, while residents of persis-tently poor places lean more toward the Democratic Party. Those in transitioning and amenity rich areas tend to be independent. All regions have been greatly affected by the wars in iraq and Afghanistan; a substantial majority in every area knows someone serving in these wars.
n Rural areas differ in terms of how their physical characteris-tics affect demographic conditions. Over half of newcomers in our high-amenity regions said that natural beauty was very important in their decision to move there, in contrast to our other regions where over half of newcomers said it was not an important consideration. Respondents in high-amenity places are quite concerned about sprawl and devel-opment, while most in declining or persistently poor places said their communities were unaffected by such patterns of growth. Our data show that people’s attitudes toward global warming and resource conservation differ greatly accord-ing to where they live.
n Almost everyone is concerned about a lack of job opportu-nities in rural places. However, concerns about other com-munity problems vary greatly from place to place. Chief issues in persistently poor places were drugs, crime, and a lack of recreational opportunities; population decline wor-ried people in the Heartland; and respondents in amenity-rich places were concerned about too-fast growth. Opti-mism about the future is lowest in the Heartland, though more respondents there than any other region think things will be about the same in ten years. natural beauty, quality of life, and family generally keep people tied to rural places, though this varies to some extent by place. However, a sub-stantial majority of respondents in all regions would advise a teenager to leave for opportunities elsewhere.
Policy Considerations
A one-size-fits-all approach to policymaking will not work. Policy must become more “place-based,” not simply in terms of geographic location, but also with awareness of social, cultural, economic, environmental, and political characteristics. each of the CeRA study regions is struggling with its own place-specific issues and problems, which call for different policies and solutions. However, some needs appear common across all regions, such as advanced telecommunications technology, access to good education at all levels, affordable and accessible healthcare, and forward-looking transportation systems.
n Amenity-rich regions need to manage growth and develop inclusive policies that enable long time residents and work-ers to find affordable housing and living wage jobs in their communities. Communities must work to avoid an “Aspen effect” that forces the middle- and lower-middle-income service sector residents out due to high costs of living. Open space acquisition and land protection strategies are essential to protect the environment. Broadband internet access should be a priority.

5
n Declining resource dependent regions must work to reverse the out-migration patterns of the last fifty years. Policies like the new Homestead Act, which offers financial incentives to those who commit to live and work in rural regions that are losing population, would build on a history of strong human and social capital, as newcomers take advantage of incentives to get an education, buy a home, or start a busi-ness. High-tech communications systems are crucial here as well, for the success of businesses and for the educational and health care systems needed to serve existing and new populations.
n Chronic poverty regions need strategies to develop sustain-able communities and strengthen the middle class. improved education should be the first priority. Community economic development organizations need support to develop alter-natives to resource extraction that emphasize stewardship and natural resource restoration. networks of community colleges and technical schools could partner with regional businesses to provide on-the-job training and internships. Public funding for infrastructure and high-speed internet is essential. Health care and early childhood education are important too, as are substance abuse programs and mental health counseling.
n Amenity/decline regions are on a socio-economic divide, struggling to staunch the continued out-migration of young adults while managing the in-migration of older residents and turning communities toward prosperity. Again, high-speed telecommunications systems are required to attract entrepreneurs and other business interests. Federal and state funding for decaying and outdated infrastructure should be a priority. Partnerships between community colleges/tech-nical schools and regional businesses to provide on-the-job training and internships would help retain young workers who might otherwise move away. Healthcare, substance abuse programs, and early childhood health and education programs are vital.
effective development and change requires research, analy-sis, and creative thinking. The more divided a community or region is along lines of income, race, or ideology, the more difficult it will be to get things done. Careful and measured planning, plus consultation with community representatives from all walks of life, will result in a greater likelihood of suc-cessful programs.

6
introduction
Four Rural Americas in the Twenty-first Century
Most Americans, when asked to describe rural America, con-jure up images of farm life, fresh air, wide open spaces, and small, somewhat isolated towns populated with hard-working, independent people (w.K. Kellogg Foundation, 2001). when we think “rural,” we imagine a time in our country’s history when life seemed more simple and straightforward. Folks raised their animals and crops, cared for their families and land, and met their neighbors at church every sunday.
in the twenty-first century, while parts of this image still hold true, close to 94 percent of the rural labor force is engaged in work other than farming (Johnson, 2006). new pressures from globalization, demographic shifts, migration, landscape transformation, and resource limits are reshaping rural life. Fifty million people live in small towns and rural communi-ties—17 percent of the nation’s population, living on 80 percent of the land. During the last four decades, jobs in rural areas have moved from agriculture, mining, and forestry to low-skill manufacturing, and more recently, to the service sector.
it no longer makes sense to think of rural communities simply as farmland or sparsely populated, idyllic retreats. we at the Carsey institute find it most useful to think in terms of four broad kinds of places, each with its own problems, issues, and relationship to the natural environment that originally defined it.
Amenity-rich rural America.Often appearing on postcards or artists’ canvases, the rug-ged mountains, deep forests, cool lakes, rocky coastlines, and other wild, less crowded landscapes make amenity-rich places attractive. Drawn by images of quiet, small town community life, three out of five baby boomers would like to move here, many to retire. Meanwhile, more people buy second homes in rural communities. Affluent professionals settle in conve-niently located small towns amid natural splendor, yet close to large cities where they commute for work or entertainment and cultural amenities. Less affluent young, upwardly mobile professionals move in to raise their children in safe, small town environments. Property values rise and the mix of businesses changes when newcomers want new services and can afford higher prices. But what happens to the “old-timers” or those working residents who are priced out of their own neighbor-hoods?
Declining resource-dependent rural America.These are places that once depended almost solely on agricul-ture, timber, mining, or related manufacturing industries to support a solid, blue-collar middle class. Many of these com-munities have a long history of booms and busts, and now that resources are depleted and low-skill manufacturing jobs are threatened by globalization, they are in economic decline. Populations are declining, although some of these areas have seen new immigrants arrive, willing to work at low-skill, low paying jobs. The once-vibrant middle class, so important to strong community institutions, is threatened. what happens as property values plummet, schools are challenged as young adults leave, new populations move in, and long-time residents cannot afford to move out?
Chronically poor rural America.The chronically poor regions are rich in history, but it is a history of devastating hardship. Here, both residents and the land have experienced decades of resource depletion and un-derinvestment, leaving behind broken communities with dys-functional services, inadequate infrastructure, and ineffective or corrupt leadership. Generations of families have been held back by inadequate education and weak civic institutions. As the population suffers, so does the environment, and the downward spiral continues. with little or nothing to attract newcomers, and only the occasional flood or mining disaster to bring national attention, these communities are largely ig-nored and forgotten. what strategies and new directions will work in these areas and where will funding and human capital to reinvigorate these communities come from?
Amenity/decline rural America.The amenity/decline places represents a transitional type, with similarities to both amenity-rich and declining resource depen-dent communities. The traditional resource-based economies of these places have weakened but not vanished, and their ag-ing populations reflect out-migration. At the same time, these areas show signs and potential for amenity-based growth.
Region /type
Population Change 1990–2005
Change in Population Age 25–34 1990–2005
Age 16–64 working 2000
in Poverty 2004
Rocky Mountains /Amenity Boom 71% 41% 72% 10%
Pacific Northwest /Amenity Decline 12% -1% 68% 14%
Northeast /Amenity Decline 3% -24% 73% 12%
Midwest /Decline -19% -50% 78% 11%
Appalachia /Chronic P0verty -12% -28% 43% 27%
Delta /Chronic P0verty -3% 2% 56% 29%
Black Belt /Chronic P0verty -4% -21% 54% 22%

7
The CERA Surveys
in 2007, researchers at the Carsey institute began a study of Community and environment in Rural America (CeRA) to learn how people living in different rural areas viewed the changes in their communities and in their own lives. we con-tacted 7,842 randomly selected rural residents in 19 counties in nine states. These areas represent a wide variety of circum-stances within different types of rural places, from booming growth to steady decline. survey questions ranged from re-spondents’ personal backgrounds and experiences (such as family, jobs, education, and life situation) to their migration histories, future plans, and views about their local governments and communities.
Profiles of the CERA study regionsThis report examines the patterns emerging from interviews in amenity-rich, declining resource-dependent, chronically poor, and amenity/decline areas. statistics help paint a picture of the traits these communities share, where they overlap, and where they are different. Preliminary Carsey institute bulletins online described a few of the early results. This report provides a more complete account with updates that include the newest results.
table 1 provides an overview of some demographic differ-ences among the CeRA survey regions.
n From the amenity-rich Rocky Mountains, we interviewed people from Chaffee and Park counties in Colorado. Be-tween 1990 and 2005, the population in these counties grew by 71 percent. newcomers were somewhat more likely to be middle-aged or older; but the number of young adults (aged 25 to 34) increased by 41 percent. seventy-two percent of the working-aged (16 to 64 years) population was employed, either part- or full-time in 2000; in 2004, only 10 percent of the population in these counties lived in poverty.
n In the declining resource-dependent regions of the Mid-west, we interviewed residents from Jewell, Osborne, Re-public, and smith counties in Kansas. The total population in these counties declined by 19 percent from 1990 to 2005, and the decline was precipitous among young adults. The 25-to-34-year-old population shrank by half. employment is high, with 78 percent of people aged 16 to 64 employed. eleven percent reported incomes below poverty in 2004.
Region /type
Population Change 1990–2005
Change in Population Age 25–34 1990–2005
Age 16–64 working 2000
in Poverty 2004
Rocky Mountains /Amenity Boom 71% 41% 72% 10%
Pacific Northwest /Amenity Decline 12% -1% 68% 14%
Northeast /Amenity Decline 3% -24% 73% 12%
Midwest /Decline -19% -50% 78% 11%
Appalachia /Chronic P0verty -12% -28% 43% 27%
Delta /Chronic P0verty -3% 2% 56% 29%
Black Belt /Chronic P0verty -4% -21% 54% 22%
table 1: Demographics of CeRA Regions
Source: U.S. Census.

8
n Our chronically poor respondents hailed from three different regions of the Southeast:
in the heart of Appalachia, Harlan and Letcher counties in Kentucky saw a 12 percent population decline, and a 28 percent decline in young adults, between 1990 and 2005. Only 43 percent of working-aged residents in these coun-ties were employed in 2000, and 27 percent were living in poverty in 2004.
Coahoma, tunica, and Quitman Counties in the Missis-sippi Delta, viewed together, experienced little population change between 1990 and 2005. Little more than one half (56 percent) of working-aged people had jobs in 2000, and in 2004, 29 percent of residents were living in poverty.
For Choctaw, Clarke, Marengo, and wilcox counties, in the “Black Belt” of Alabama, the population declined by 4 percent between 1990 and 2005, while the young adult population declined by 21 percent. in 2000, only 54 percent of working-aged residents were employed, and in 2004, 22 percent of all residents were poor.
n Our amenity/decline areas represent the Northwest and Northeast.
From the Pacific northwest, we interviewed adults in Clatsop County in Oregon and Pacific County in washing-ton, both situated along the Pacific coast. These counties saw modest overall population growth (12 percent) be-tween 1990 and 2005, but with no net change among young adults. sixty-eight percent of working-aged people were employed in 2000, and in 2004, 14 percent of the popula-tion was living in poverty.
in the northeast, we interviewed residents in Coos County, new Hampshire, and Oxford County, Maine. These coun-ties are in the heart of the northern Forest region, histori-cally dependent on the pulp and paper industry and blessed with ample natural amenities (Colocousis, 2008). Although the area saw a very slight (3 percent) increase in total popu-lation between 1990 and 2005, the young adult population declined notably—down 24 percent. seventy-three percent of the working-aged population was employed in 2000, and in 2004, 12 percent of the population reported incomes be-low the poverty level.
The interviewsThe university of new Hampshire survey Center conducted telephone interviews with randomly chosen adults in these regions from April through October 2007. each interview consisted of approximately 100 questions. Opinion questions generally had a practical focus and referred to the respondent’s own family or community. within each of the seven regions, researchers conducted 1,000 or more interviews. in an era of declining cooperation with surveys, the telephone methods achieved acceptable response rates—from 18 to 26 percent.2
in addition, the samples’ demographic profiles were similar to those from u.s. census population profiles, and survey re-sponses agreed with voting results and other external criteria.3
The surveys asked how people viewed the present realities and future challenges of their rural communities, and how their own lives and families fit into that community picture. Questions touched on five key issues pertinent to change in all rural communities:
n Changing economy. Large numbers of rural residents have felt the effects of globalization and resource depletion, as companies that once defined and supported their commu-nities downsize or shut down completely. Agriculture is no longer a principal source of income in most rural areas; in fact, only 6.5 percent of the rural labor force is engaged in farming (Johnson, 2006). survey questions asked people about their jobs, income, education, and experiences in lo-cal labor markets.
n Demographic changes. Patterns of rural migration vary across the country. some rural areas are seeing a steady out-migration of young people. A new immigrant population (largely Hispanic) is finding work in certain parts of rural America, while domestic migration changes the economy and lifestyle in other areas. Both older baby boomers and young professionals are on the move, and many have de-cided to make rural regions their home. survey questions asked about their relationships and family structure, how long respondents had lived in their communities, and where they moved from.
n Community institutions and civic leadership. small communities depend on their local leaders and social in-stitutions, and local participation is important. too often, though, local officials face inadequate resources or, accus-tomed to economic and governance structures that worked in the past, lack the ability or flexibility to find viable solu-tions to important problems. The survey addressed these issues with questions about trust, politics, religion, and ties to the community.

9
n Environmental concerns. Rural areas were settled origi-nally for their natural resources. now, whether through decades of unchecked resource extraction, introduced spe-cies, population growth, shifts in the economy and land use patterns, or even climate change, the landscape and environment have been altered. Resource-based economies are particularly sensitive to environmental change. some survey questions asked about environmental conservation, urban sprawl, global warming, and recreational use of the land.
n Investment and the future. Part of what sets a rural area apart, and what attracts many new residents, is its distance from cities. But this same remoteness creates challenges. Basic services such as schools, banks, and hospitals might be 50 to 100 miles away. transportation and telecommuni-cations are often less available or reliable. Respondents were asked how they felt about the quality of their schools, and their health and social services. Other questions focused on why they moved to their rural communities, or why they might move away.
The CeRA surveys found many shared characteristics across these different kinds of places in rural America. There were also strong contrasts as well as areas where lines blurred. even within one county, a town or small city might be strug-gling with problems more typically associated with urban or inner-city neighborhoods, while other parts of the same coun-ty enjoy more idyllic country living (see Colocousis, 2008). The whole spectrum from poor to rich can be found within each of the study areas: some families live in poverty even within the most well-off, amenity-rich counties, while others with house-hold incomes among the top 5 percent nationwide reside in the poorest counties.
early analyses suggest that many respondents’ perspec-tives, opinions, and actions reflect the regions in which they live. Future policies must be carefully tailored to the differences among and between rural places to better address their widen-ing range of concerns and problems.

10
Jobs, Homes, and education
The middle class is strong in some counties but weak in others.Household incomes of CeRA respondents were grouped into six categories, using quintiles of the u.s. income distribution based on 2005 figures published by the u.s. Census Bureau. That is, each income category corresponds to approximately one-fifth of households nationwide. A sixth category distin-guishes households with incomes in the top 5 percent.
Amenity
Lower
Lower middle
Middle
Upper middle
Upper
Top 5%
11
23
25
14
6
21
Amenity/decline
Lower
Lower middle
Middle
Upper middle
Upper
Top 5%
14
22
23
12
4
25
Decline
Lower
Lower middle
Middle
Upper middle
Upper
Top 5%
0 10 20 30
14
22
21
12
5
26
Chronic poverty
Lower
Lower middle
Middle
Upper middle
Upper
Top 5%
0 10 20 30
27
18
15
12
4
25
Percent
Figure 1: “what was your total household income for 2006?” (income quintiles and top 5%)
table 2: u.s. income Distribution
Income$0–$20,000
$20,000–$40,000
$40,000–$60,000
$60,000–$90,000
$90,000–$160,000
above $160,000
Income Categorylower income
lower-middle income
middle income
upper-middle income
upper income
top 5%
Figure 1 compares the distributions of household incomes among CeRA respondents in the four place types. “Lower in-come” refers to respondents with household incomes among the bottom 20 percent nationwide. “Lower middle” refers to the next 20 percent, and so forth. The top 20 percent is subdivided to distinguish between “upper income” (households in the 80th through 95th percentiles) and the top 5 percent.
As might be expected, the strongest contrast in Figure 1 is between the amenity-rich Rocky Mountain counties, where up-per-middle income is the largest single group, and the chron-ic-poverty counties in the south, where lower income is most common. The amenity/decline and declining-resource places fall between these extremes, with more people in the lower-middle than upper-middle class. interestingly, the proportion of economic elites (top two categories) is fairly similar in all four types of places, ranging from 16 to 20 percent. The critical differences lie in the middle class. when the three middle-class income categories are grouped together, all regions but chronic poverty areas have a solid middle class; approximately 70 per-cent of the area’s population falls into the middle class. in the chronic poverty counties, on the other hand, only 58 percent fall into the combined middle class categories.4
Amenity
<$70
$70–100
$100–200
$200–300
$300–500
>$500
4
22
36
24
11
3
Amenity/decline
<$70
$70–100
$100–200
$200–300
$300–500
>$500
7
35
29
10
8
12
Decline
<$70
$70–100
$100–200
$200–300
$300–500
>$500
0 20 40 60
53
15
5
3
1
23
Chronic poverty
<$70
$70–100
$100–200
$200–300
$300–500
>$500
0 20 40 60
37
27
10
4
2
20
Percent
Figure 2: “what is the approximate value of your home?” (in thousands)
Source: U.S. Census

11
Home values and ownership vary by place.Although the resource-dependent and amenity/decline areas have similar household incomes, they vary considerably in home values. As Figure 2 shows, more than half (53 percent) of the respondents in the resource-dependent Midwestern coun-ties, and 37 percent of those in chronic-poverty areas, report that their homes are now valued at less than $70,000. These results are striking when compared with the amenity-rich re-gion where only 4 percent report home values below $70,000, or with the amenity/decline regions where 7 percent do so. As the next section reveals, a flow of newcomers drives housing values up in places with amenity attractions. seventy-one per-cent of amenity-area respondents and 47 percent from ameni-ty/decline areas reported house values above $200,000. Only 9 percent of those in resource-dependent areas and 16 percent in chronic-poverty areas said their homes were worth more than $200,000.
Most respondents in all four types of places own their homes (Figure 3). According to the 2000 Census, however, 30 percent of all housing units in the amenity-rich counties were second homes, for “seasonal, recreational, or other occasional use.” in the resource-dependent Midwestern areas, where home values are relatively low, 90 percent of respondents own their homes, and only 8 percent (the lowest among the four regions) rent. Among the other three types, the proportions of owners and renters were similar. when asked whether there was a lack of affordable housing in their region, only 21 percent of respon-dents in declining areas agreed. This reflects the population of primarily long-time residents. in contrast, 75 percent of those in amenity-rich areas, where property values are high, say that affordable housing is an important problem (Figure 4).
Fewer rural people hold jobs, and in some places, unemployment is particularly high.in 2006, the General social survey (Gss; see Davis, smith, and Marsden, 2007), a representative survey of the u.s. population, found that approximately 53 percent of adults nationwide said they worked full-time. in contrast, across all four of the rural regions, only about 40 percent of respondents report full-time jobs (Figure 5), and in rural areas, many are low-skill positions (Glasmeier and salant, 2006).
About 20 percent of surveyed rural residents said they are retired (slightly fewer in the chronically poor areas), compared with 13 percent nationally. This likely reflects the high propor-tion of older rural adults due to the departure of rural youth and an influx of more affluent retirees.
The numbers of self-employed are highest in the declining Midwest (19 percent) perhaps reflecting independent farm sec-tor producers. self-employment also is high (17 percent) in the amenity-rich areas, where we suspect that independent trades-
Rent
Own
Other
Amenity
Rent
Own
Other
Rent
Own
Other
82
2
17
Amenity/decline
Decline
0 20 40 60 80 100
Chronic poverty
0 20 40 60 80 100Percent
79
3
18
77
4
18
2
90
8Rent
Own
Other
Figure 3: “Do you own or rent the place where you live?”
Figure 4: “Do you consider lack of affordable housing to be a problem in your community?”
Figure 5: “which of the following best describes your employment status for the past year?”
No
Yes
No
Yes
0 20 40 60 80
No
Yes
0 20 40 60 80
Amenity
No
Yes
25
75
44
56
79
21 50
50
Amenity/decline
Decline Chronic poverty
Percent
Full-time
Part/season
Self-emp
Retired
Unemp looking
Unemp not
Homemaker
Disabled
Student
0 10 20 30 40
37
7
18
6
3
6
10
4
8
Decline
Full-time
Part/season
Self-emp
Retired
Unemp looking
Unemp not
Homemaker
Disabled
Student
0 10 20 30 40
39
19
22
2
1
4
2
4
9
Chronic poverty
Full-time
Part/season
Self-emp
Retired
Unemp looking
Unemp not
Homemaker
Disabled
Student
40
12
21
2
1
4
5
3
11
Amenity
Full-time
Part/season
Self-emp
Retired
Unemp looking
Unemp not
Homemaker
Disabled
Student
41
17
20
2
1
5
2
3
9
Amenity/decline
Percent

12
people and technology make jobs more portable. On the other hand, only 7 percent of residents in chronic poverty areas are self-employed.
The 2006 Gss found that 3 percent of respondents nation-wide reported being unemployed, and three of the four types of CeRA areas report identical percentages. not surprisingly, un-employment is much greater in the chronic poverty areas, how-ever. nine percent report being currently unemployed in those areas. in addition, the share of disabled residents (10 percent) is highest in the chronically poor areas where health facilities are most lacking, and where disability payments like ssi enable workers to return home and live. in the amenity/decline areas, 5 percent report being disabled.
Both the chronic poverty and amenity/decline areas are feel-ing the effects of globalization and resource depletion, as plants downsize or close altogether. Figure 6 shows that 16 percent of respondents in both chronic poverty counties and amenity/decline areas report having lost a job in the last seven years because of economic changes.
One-third of residents in the resource-dependent Mid-western counties reported having another job or doing other work in addition to their primary employment to earn money (Figure 7). These numbers are comparable to those in the amenity-rich counties (31 percent), but likely reflect different secondary employment opportunities in the two places. second jobs in Kansas are more often related to agriculture; whereas second jobs in Colorado include more high-end service work such as consulting, which is compatible with telecommuting. in areas of chronic poverty, where jobs are generally scarce, only 20 percent report working a second job.
Many in chronically poor and amenity/decline areas depend on public assistance, but residents in declining resource dependent counties do not.Figure 8 shows the stark differences in food stamp use among the four rural regions. Thirty percent of chronically poor area residents and 21 percent in amenity/decline areas need food stamps to feed their families. yet in Midwestern counties where home values, incomes, and job opportunities are in serious decline, only 5 percent (the lowest of all the regions) receive food stamps. Perhaps a staunch Heartland independence de-ters them from seeking government assistance, either in food stamps or cash assistance (temporary Assistance for needy Families or tAnF). Although 7 percent of those in amenity/decline and 5 percent in chronically poor areas said they have received tAnF in the last two years, and 4 percent in amenity-rich counties received tAnF, only 2 percent of Kansas residents report receiving tAnF (graph not shown).
No
Yes
No
Yes
0 20 40 60 80
No
Yes
0 20 40 60 80
Amenity
No
Yes
69
31
74
26
67
33 20
80
Amenity/decline
Decline Chronic poverty
Percent
Amenity Amenity/decline
Decline
0 20 40 60 80 100
Chronic poverty
0 20 40 60 80 100Percent
No
Yes
No
Yes
89
11
84
16
No
Yes
No
Yes
90
10
84
16
Figure 6. “During the last 7 calendar years, that is since 2000, did you lose a job or leave one because your plant or company closed or moved, your position or shift was abolished, insufficient work, or some other similar reason?”
Figure 7: “Do you have another job or other work to earn money?”

13Figure 8. “Have you received food stamps within the last two years?
Figure 10: “what was your father’s education, or the highest grade of school he completed?”
Figure 9: “what is the highest grade in school (or level of education) that you’ve completed and received credit for?”
Amenity Amenity/decline
Decline
0 20 40 60 80 100
Chronic poverty
0 20 40 60 80 100Percent
No
Yes
No
Yes
92
8
79
21
No
Yes
No
Yes
95
5
70
30
Amenity Amenity/decline
Decline
0 20 40 60
Chronic poverty
0 20 40 60Percent
Less than HS
HS grad
College grad
Less than HS
HS grad
College grad
49
48
3
59
34
7
Less than HS
HS grad
College grad
Less than HS
HS grad
College grad
63
33
4
57
26
16
Less than HS
HS grad
College grad
Amenity
Less than HS
HS grad
College grad
Less than HS
HS grad
College grad
Less than HS
HS grad
College grad
47
34
19
51
15
34
Amenity/decline
Decline
0 10 20 30 40 50
Chronic poverty
0 10 20 30 40 50Percent
51
22
27
37
15
48
Education differences underlie economic patterns.As Figure 9 shows, almost one-half (48 percent) of the respon-dents in amenity-rich areas graduated from college, compared with 26 percent in chronic poverty areas. Conversely, and consistent with 2000 Census data, only 3 percent of those in amenity-rich areas and 4 percent in amenity/decline counties have more than a high school education, compared with 16 percent in the chronic-poverty areas. (High school graduates include those who passed the general equivalency degree or GeD.) Proportions of high school graduates (without college) were fairly consistent across three of the four types of places: 63 percent in declining counties, 59 percent in amenity/decline counties, and 57 percent in areas with chronic poverty. in the high-amenity Colorado counties, more people attended and finished college.
Regional household income differences (Figure 1) roughly follow these educational patterns. Areas with better-educated populations tend to have higher income levels as well.
A different but also clearly contrasting pattern appears when we compare reports about respondents’ fathers’ educa-tion (Figure 10). College-graduate fathers are most common among amenity-rich (34 percent) and amenity/decline (22 percent) area respondents. Only 15 percent of respondents in chronic-poverty or resource-dependent areas report that their fathers were college graduates. nearly half (48 percent) of those in chronic-poverty areas and 34 percent of those in declining areas said their fathers did not complete high school.

14
Population, Migration, and Marriage
The population is aging in declining rural areas, as people in their 30s leave.Figure 11 suggests how the age structures of different places have been shaped by migration patterns. The bars are percent-ages of men and women in each age group, across the different types of areas. The declining-area respondents tend to be older. One-quarter of the men and nearly one third of the women are age 65 or older, compared with just 17 percent and 20 percent, respectively in the next-oldest areas, our amenity/decline coun-ties. At the other end of the age spectrum, resource-dependent declining areas have the smallest shares of young adults under 30—just 13 percent of the women and 14 percent of the men, compared with 17 to 25 percent elsewhere.
For all these rural places, those 30 to 39 years old make up a relatively small fraction of the overall population. They are par-ticularly scarce in the declining areas, where those 65 and older greatly outnumber the 30- to 39-year-olds: among women, by nearly four to one.
Ethnic diversity often is limited, but changing.The majority of rural residents in the united states (82 percent) are non-Hispanic white—a significantly higher fraction than in metropolitan areas (66 percent) (Johnson, 2006). Among the CeRA areas, the chronic-poverty areas have the greatest diversity (Figure 12). in other places, 90 to 99 percent describe themselves as white, non-Hispanics. These results follow other
Figure 11: “what is your current age?”
18–29
30–39
40–49
50–65
65+
0 10 20 30 0 10 20 30
2528
2222
810
1314 18–29
30–39
40–49
50–65
65+ 1714
2425
2120
1515
2225
Amenity
18–29
30–39
40–49
50–65
65+ 15
Amenity/decline
Decline Chronic poverty
% of Males % of Females
15
2625
2321
1516
1722 18–29
30–39
40–49
50–65
65+ 2017
2627
2122
1414
1919
3125
Age
Gro
up
15
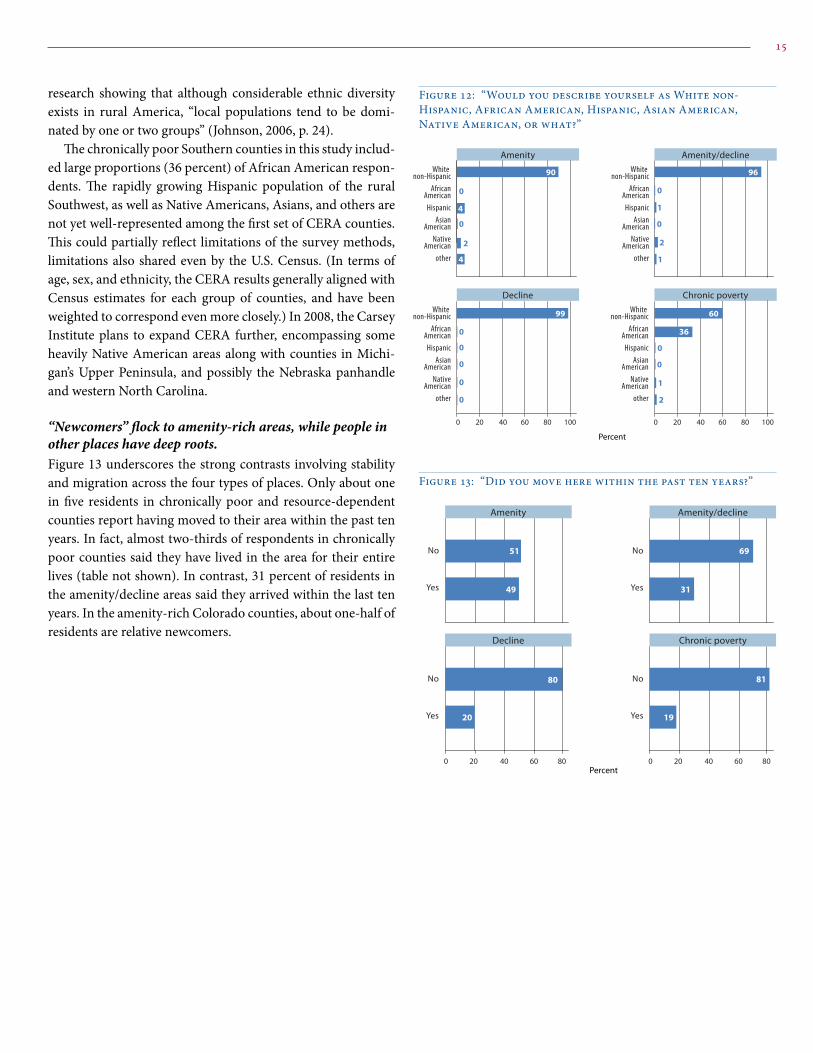
research showing that although considerable ethnic diversity exists in rural America, “local populations tend to be domi-nated by one or two groups” (Johnson, 2006, p. 24).
The chronically poor southern counties in this study includ-ed large proportions (36 percent) of African American respon-dents. The rapidly growing Hispanic population of the rural southwest, as well as native Americans, Asians, and others are not yet well-represented among the first set of CeRA counties. This could partially reflect limitations of the survey methods, limitations also shared even by the u.s. Census. (in terms of age, sex, and ethnicity, the CeRA results generally aligned with Census estimates for each group of counties, and have been weighted to correspond even more closely.) in 2008, the Carsey institute plans to expand CeRA further, encompassing some heavily native American areas along with counties in Michi-gan’s upper Peninsula, and possibly the nebraska panhandle and western north Carolina.
“Newcomers” flock to amenity-rich areas, while people in other places have deep roots.Figure 13 underscores the strong contrasts involving stability and migration across the four types of places. Only about one in five residents in chronically poor and resource-dependent counties report having moved to their area within the past ten years. in fact, almost two-thirds of respondents in chronically poor counties said they have lived in the area for their entire lives (table not shown). in contrast, 31 percent of residents in the amenity/decline areas said they arrived within the last ten years. in the amenity-rich Colorado counties, about one-half of residents are relative newcomers.
Figure 12: “would you describe yourself as white non-Hispanic, African American, Hispanic, Asian American, native American, or what?”
Figure 13: “Did you move here within the past ten years?”
White non-Hispanic
AfricanAmerican
HispanicAsian
AmericanNative
Americanother
White non-Hispanic
AfricanAmerican
HispanicAsian
AmericanNative
Americanother
White non-Hispanic
AfricanAmerican
HispanicAsian
AmericanNative
Americanother
White non-Hispanic
AfricanAmerican
HispanicAsian
AmericanNative
Americanother
Amenity Amenity/decline
Decline
0 20 40 60 80 100
Chronic poverty
0 20 40 60 80 100
Percent
90
0
0
4
2
4
96
1
0
2
1
0
60
0
0
1
2
36
99
0
0
0
0
0
No
Yes
No
Yes
0 20 40 60 80
No
Yes
0 20 40 60 80
Amenity
No
Yes
51
49
69
31
80
20 19
81
Amenity/decline
Decline Chronic poverty
Percent

16
The “newcomer” patterns became even more pronounced when we asked respondents whether at least one of their par-ents grew up in the area (Figure 14). Few residents in the ame-nity-rich counties said they had parents who grew up in the area (22 percent), whereas most of the respondents in declin-ing or chronic poverty areas had deep roots in their communi-ties (73 percent and 76 percent yes, respectively).
Most respondents from all areas are married, but as Figure 15 shows, the rate is highest in the declining areas of the Mid-west (75 percent) and lowest in chronic poverty areas (54 per-cent). (The category “married” includes common-law marriage and those with a spouse away in the military.) if we view the categories of widowed, divorced, separated, or never married together as those “without a partner,” Midwestern residents again appear to have the most stable relationships (24 percent without partners), and chronic-poverty area residents the least (45 percent without partners).
No
Yes
No
Yes
0 20 40 60 80
No
Yes
0 20 40 60 80
Amenity
No
Yes
78
22
51
49
27
73 76
24
Amenity/decline
Decline Chronic poverty
Percent
Figure 14: Percent of respondents reporting that at least one of their parents grew up in this area
Figure 15: “Are you currently married, widowed, divorced, separated, or have you never been married?”
0 20 40 60 800 20 40 60 80
Amenity Amenity/decline
Decline Chronic poverty
Percent
Married
Widowed
Divorced
Separated
Never married
Living together
63
11
1
18
1
5
Married
Widowed
Divorced
Separated
Never married
Living together
69
1
15
9
2
4
Married
Widowed
Divorced
Separated
Never married
Living together
54
9
3
25
1
8
Married
Widowed
Divorced
Separated
Never married
Living together
75
6
1
10
1
7

17
ties and Beliefs
Community trust and cohesiveness is high, but faith in local government is not.Figure 16 illustrates the percentage of respondents who agreed with the following statements about their respective communities:
• People around here are willing to help their neighbors.• People in this community generally trust one another and
get along.• If this community were faced with a local issue such as the
pollution of a river or the possible closure of a school, people here could be counted on to work together to address it.
• Local government has the ability to deal effectively with important problems.
in keeping with long-standing traditions of self-reliance, personal strength, and “sticking together when the going gets tough,” respondents in all the rural places felt strongly about helping their neighbors, getting along, and working together to solve problems. The percentages were somewhat lower, overall, in the chronic poverty areas, but still very much in the majority. A less rosy picture emerged, however, when they were asked about trust and confidence in local government to solve prob-lems. Respondents in the chronic poverty areas were slightly more optimistic than the other regions, but overall, respon-dents have less trust in the ability of their local government than they have in each other.
Rural Americans are joiners, especially in the Midwest.The survey asked respondents whether they participated in any of the following local organizations:
• Business group such as Chambers of Commerce• Civic, service or fraternal organizations such as Elks,
Kiwanis, Rotary, women’s clubs, 4H, or Scouts• Local government, including zoning, school, or
conservation boards• Other local organizations that have regular meetings
Figure 17 reveals that local involvement was high in all four types of areas, but was highest in the economically declining Midwest. sixty-eight percent of Kansas respondents were in-volved in some sort of local organization, followed by the ame-nity/decline and amenity-rich areas with 58 and 57 percent, respectively. Only in the chronically poor regions were there more nonjoiners than joiners, but even there, a full 45 percent were involved in some community organization. in such areas, where more than one-half of the adults are lower- or lower-
0 25 50 75 1000 25 50 75 100
Amenity Amenity/decline
Decline Chronic poverty
Percent
Helpneighbors
Get along
Worktogether
Trust localgovernment
Helpneighbors
Get along
Worktogether
Trust localgovernment
Helpneighbors
Get along
Worktogether
Trust localgovernment
Helpneighbors
Get along
Worktogether
Trust localgovernment
Figure 16: Feelings about your community
Figure 17: “Do you belong to or serve in any local organizations?”
No
Yes
No
Yes
0 20 40 60 80
No
Yes
0 20 40 60 80
Amenity
No
Yes
43
57
42
58
32
68 45
55
Amenity/decline
Decline Chronic poverty
Percent

18
middle class (Figure 1), this finding could reflect feelings of be-ing disconnected from the inner workings of the community and not having a voice or a say in what happens there.
Religion is important, but differs between regions.Religion plays an important role in the lives of many rural Americans, but with some stark regional differences. Figure 18 shows 56 percent of the Midwestern respondents and 55 percent of those in chronic-poverty areas reported weekly or twice-weekly attendance at religious services. On the other hand, 57 percent of the amenity-area respondents, and 61 per-cent of those in amenity/decline areas, said that they attend re-ligious services just a few times a year or not at all.
Midwesterners are the most homogeneous with respect to church attendance. Forty-three percent said they attend once a week, compared with just 20 to 28 percent elsewhere. Chroni-cally poor areas have the highest rates (27 percent) reporting they attend more than once a week.
Another indication of the importance religion plays in many respondents’ lives is the high percentage who described them-selves as born again Christians (Figure 19). eighty percent of those surveyed in chronically poor counties said they have had a “born again” experience. in the amenity-rich Rocky Moun-tains and declining Midwestern areas, 58 and 56 percent, re-spectively, reported being born again. Born-again respondents composed a minority only in the amenity/decline regions of the Pacific northwest and northeast.
Political affiliation varies strongly, but military service is shared.until recently, the south tended to vote Democratic. The chron-ic-poverty southern counties still reflect this historical pattern. As Figure 20 shows, 34 percent describe themselves as strong Democrats, and 47 percent said they generally vote for Demo-cratic Party candidates. in contrast, residents in the Midwest have typically voted for Republican candidates, and this too shows up in the survey results: Fifty percent responded that they are Republicans. in the amenity/decline areas on either coast, a stronger independent streak emerged (45 percent). Re-sponses in the amenity-rich counties closely resembled those in the amenity/decline regions, although they leaned somewhat more Republican.
Figure 21 graphs the political party identification of CeRA respondents by county against voting results from the 2004 presidential election. CeRA’s Midwest respondents were pre-dominantly Republican, and large majorities in those counties voted for George Bush in 2004. The more independent voters of the Colorado Rockies, northeast (new Hampshire and Maine) and northwest (Oregon and washington) split their votes be-
Figure 18: “How often do you attend religious services apart from occasional weddings, baptisms, or funerals?”
Figure 19: “would you say you have been ‘born again’ or have had a ‘born again’ experience—that is, a turning point in your life when you committed yourself to Christ?”
0 10 20 30 400 10 20 30 40
Amenity Amenity/decline
Decline Chronic poverty
Percent
Never
Few times/yr
1 or 2/month
1/week
>1/week
36
21
10
11
21
Never
Few times/yr
1 or 2/month
1/week
>1/week
10
43
13
15
19
Never
Few times/yr
1 or 2/month
1/week
>1/week
9
28
27
19
17
Never
Few times/yr
1 or 2/month
1/week
>1/week
32
20
8
12
29
No
Yes
No
Yes
0 20 40 60 80
No
Yes
0 20 40 60 80
Amenity
No
Yes
42
58
60
40
44
56 80
20
Amenity/decline
Decline Chronic poverty
Percent
Strong Dem
Not strong Dem
Ind closer Dem
Ind closer neither
Ind closer Rep
Not strong Rep
Strong Rep
Other
0 10 20 30 40
34
7
13
6
10
14
3
13
Decline
Strong Dem
Not strong Dem
Ind closer Dem
Ind closer neither
Ind closer Rep
Not strong Rep
Strong Rep
Other
0 10 20 30 40
10
5
13
10
22
28
3
9
Chronic poverty
Strong Dem
Not strong Dem
Ind closer Dem
Ind closer neither
Ind closer Rep
Not strong Rep
Strong Rep
Other
17
14
23
8
11
13
3
11
Amenity
Strong Dem
Not strong Dem
Ind closer Dem
Ind closer neither
Ind closer Rep
Not strong Rep
Strong Rep
Other
16
14
17
8
11
20
4
9
Amenity/decline
Percent
Figure 20: “Generally speaking, do you usually think of your- self as a republican, a democrat, an independent or what?”

19
tween candidates. The CeRA counties in Kentucky, Alabama, and Mississippi leaned toward the Democratic candidate.
Although residents in the four rural regions hold contrasting political opinions, many are strongly affected by the wars in iraq and Afghanistan. This topic is particularly important to rural Americans because soldiers and casualties have come dispro-portionately from rural parts of the country (O’Hare & Bishop, 2007). More than two-thirds of all CeRA respondents said they knew someone from their region who was currently serving or has served in Afghanistan or iraq. The proportion was highest (81 percent) among Midwesterners (Figure 22), but both the amenity/decline and chronic poverty areas have high propor-tions as well, 75 and 73 percent respectively. sixty-five percent of amenity-rich respondents said they knew someone serving in the military, but this lower figure may reflect the relative youth of the population, and the prevalence of newcomers who have yet to develop such a wide network of relatives and friends.
30 40 50 60 70 80 Percent county votes for G.W. Bush, 2004
De
moc
rat
Inde
pend
ent
Repu
blica
n
Mea
n pa
rty
iden
ti�ca
tion
of C
ERA
resp
onde
nts
Tunica, MS
Cha�ee, CO
Park, CO
Oxford, ME Coos, NH
Clatsop, OR
Jewell, KS
Osborne, KS
Republic, KS
Smith, KS
Choctaw, AL
Clarke, AL
Marengo, ALWilcox, AL
Harlan, KYLetcher, KYCoahoma, MS
Paci�c, WA
Quitman, MS
Figure 21: Average political party identification by survey respondents and countywide voting in the 2004 election for the 19 CeRA counties.
Figure 22: “Do you know anyone from this area who is serving or has served in the military in iraq or Afghanistan?”
No/DK
Yes
No/DK
Yes
0 20 40 60 80
No/DK
Yes
0 20 40 60 80
Amenity
No/DK
Yes
35
65
25
75
19
73
27
Amenity/decline
Decline Chronic poverty
Percent
81

20
environment and Resources
to learn how respondents felt about environmental is-sues, we began by asking whether the natural beauty of their surroundings was important in deciding where
to live. unsurprisingly, as Figure 23 shows, a solid majority (66 percent) of residents in the amenity-rich Rocky Mountain area moved there for the natural beauty of the region. About one-half the respondents in the coastal counties of the Pacific northwest or the forested areas of the northeast—regions rich in natural amenities but also struggling with some economic decline-said that natural beauty was a very important motiva-tion to live there. in contrast, 65 percent of the respondents in the Midwest, and 52 percent of those in chronically poor ar-eas of central Appalachia, the Mississippi Delta, and Alabama’s Black Belt, reported that natural beauty was not an important reason for moving to their current location.
Place affects people’s outdoor activities and their opinions about the environment.Residents in areas with natural amenities are more active in the outdoors than those in the declining and high-poverty areas, as Figure 24 shows. Many of the activities are place-based. swim-ming is less appealing, for example, in the cold rivers and lakes of the Rockies, but that is offset by much better skiing. in ev-ery area, however, most respondents indicated that their fami-lies used the outdoors for entertainment. Hiking and camping were mentioned by well over 80 percent of respondents in the amenity/decline areas, and over 90 percent in the amenity-rich Rockies. Hunting is popular everywhere; close to 70 percent report participating across all four types of places.
we also asked what effect urban sprawl or rapid develop-ment of the countryside has had on their family or community in the last five years. As Figure 25 illustrates, opinions differed by region. seventy-eight percent of those in the resource-dependent areas of the Midwest, and 60 percent of those in chronic-poverty areas, reported that sprawl and rapid develop-ment have had no effect on their family or community in the past five years. These are the same areas with population loss, which helps explain their views.
At the other end of the spectrum, respondents in the ame-nity-rich communities in the Rocky Mountains, Pacific north-west, and northeast were very concerned with urban sprawl and development. slightly more than three-fourths (77 percent) in Colorado said growth has had either minor or major effects on their families, while 62 percent felt this way in the amenity/decline areas.
Figure 23: “How important was the natural beauty of your area in your decision to move here?”
Figure 24 “what outdoor recreational activities do you or your family participate in?”
0 20 40 60 800 20 40 60 80
Amenity Amenity/decline
Decline Chronic poverty
Percent
Notimportant/
NA
Somewhatimportant
Veryimportant
17
66
17
Notimportant/
NA
Somewhatimportant
Veryimportant
17
17
65
Notimportant/
NA
Somewhatimportant
Veryimportant
26
49
25
Notimportant/
NA
Somewhatimportant
Veryimportant
19
29
52
0 20 40 60 80 100 0 20 40 60 80 100
OHV
Bicycle
Boat
Ski
Hunt
Swim
Hike
Camp
OHV
Bicycle
Boat
Ski
Hunt
Swim
Hike
Camp
Decline
OHV
Bicycle
Boat
Ski
Hunt
Swim
Hike
Camp
Chronic poverty
Amenity
OHV
Bicycle
Boat
Ski
Hunt
Swim
Hike
Camp
Amenity/decline
Percent

21
Snow country is more aware of climate change.Respondents in the amenity or amenity/decline areas more of-ten perceived the effects of global warming of climate change—perhaps because these areas include places in ski country, and with historically colder winters. snowy winters have particular cultural and economic importance in the Rocky Mountains and northeast. even a slight warming, or shortening of the period with snow-covered ground and frozen lakes, is very notice-able to northern residents. Climate records reveal that winter warming has recently occurred (Hamilton et al., 2003). nearly one-half (47 percent) of respondents from Colorado, and 29 percent of those from the combined amenity/decline areas in the northwest and northeast (for the northeast alone, it would be higher), reported major effects from climate change. Con-versely, 78 percent of the Kansas respondents, and 60 percent in the southern chronic-poverty areas, reported no effects.
Midwestern winters too have been warming, according to cli-mate data, and severe weather including droughts, hurricanes, and tornadoes are a frequent concern in both the Midwest and south. Public perceptions about climate change reflect political beliefs as well as meteorological observations, however. As was evident in Figure 20, many rural Kansas residents hold strongly conservative views, which tend to be associated with doubts about climate change (nisbet & Myers, 2007).
Resources are viewed differently, depending on circumstances.The question of whether areas should use natural resources to create jobs or to conserve the resources for future genera-tions again elicited situational responses. Although histori-cally, people in all of these rural areas have depended mainly on resource-based livelihoods such as farming, forestry, or mining, that dependence has shifted today. Due to combina-tions of resource depletion, mechanization, economic shifts, or an influx of new migrants seeking low-wage jobs, all the areas face changes as traditional resource occupations support fewer people.
Figure 27 shows that 60 percent of Rocky Mountain respon-dents say they would prefer to conserve resources for future generations, and only 14 percent would use resources to create jobs. Conservation is the top choice among respondents in the amenity/decline areas as well (45 percent “conserve,” 25 per-cent “use”) and by a narrower margin in the Midwestern areas (41 to 28 percent). Residents of chronic poverty areas, however, are evenly split.
Conservation itself can bring jobs and economic benefits, as is well understood in the amenity-rich, tourist-attracting areas. But this might be a new idea in places which have until re-cently depended on resource-extraction industries. Moreover,
Figure 25: “Do you think urban sprawl and too-rapid development is having an effect on your community?”
0 20 40 60 800 20 40 60 80
Amenity Amenity/decline
Decline Chronic poverty
Percent
No e�ect
Minor e�ects
Major e�ects
30
47
23
No e�ect
Minor e�ects
Major e�ects
15
7
78
No e�ect
Minor e�ects
Major e�ects
33
29
38
No e�ect
Minor e�ects
Major e�ects
26
15
60
Figure 26: “Do you think global warming or climate change is having an effect on your community?”
Figure 27: “For the future of your community, do you think it is more important to use natural resources to create jobs, or to conserve natural resources for future generations?”
No e�ect
Minor e�ects
Major e�ects
Amenity
No e�ect
Minor e�ects
Major e�ects
No e�ect
Minor e�ects
Major e�ects
No e�ect
Minor e�ects
Major e�ects
36
24
40
31
23
46
32
16
52
Amenity/decline
Decline
0 10 20 30 40 50
Chronic poverty
0 10 20 30 40 50Percent
35
37
28
Amenity Amenity/decline
Decline
0 20 40 60
Chronic poverty
0 20 40 60Percent
Use resources
Both equal
Conserve
Use resources
Both equal
Conserve
26
60
14
30
45
25
Use resources
Both equal
Conserve
Use resources
Both equal
Conserve
31
41
28
25
37
38

22
enthusiasm for conservation of natural resources tends to be high in areas where human resources, in the form of wealth or education, are high too. Conversely, conservation holds less importance in places where human resources such as educa-tion are less developed, and people see fewer choices for jobs.
Another contentious issue is the effect of conservation or environmental rules that restrict development. Although rela-tively few respondents believed that conservation rules have been bad for their communities (Figure 28), support for envi-ronmental rules appears related to history and economics. sup-port for environmental rules was strongest among respondents in the Rocky Mountains (56 percent) and the amenity/decline areas (46 percent). in contrast, majorities of respondents in the areas of decline and chronic poverty reported that environ-mental rules have had no effect on their communities. it would appear that respondents in amenity-rich counties, with rapidly growing populations who value the natural beauty of the area, are more likely to view restrictive environmental rules as good or even necessary in the face of strong development pressures. On the other hand, in areas of decline and poverty, where ex-traction industries have already consumed resources or the agricultural economy is waning, development-restricting rules may seem beside the point.
Figure 28: “Have conservation or environmental rules that restrict development generally been a good thing for your community, a bad thing, or have they had no effect?”
Amenity Amenity/decline
Decline
0 20 40 60
Chronic poverty
0 20 40 60
Bad here
No e�ect
Good here
Bad here
No e�ect
Good here
31
56
13
36
46
17
Bad here
No e�ect
Good here
Bad here
No e�ect
Good here
63
28
9
59
30
12
Percent

23
Outlook on the Future
Although demographic, economic, social, or environ-mental changes create new opportunities for some regions and people, they raise serious problems for
others. The balance can be complex, creating winners and de-pressing losers even within one community. workable solu-tions might seem elusive. Many rural residents were frustrated with their local or federal governments, and in some locations, problems seem so long-standing and ingrained that residents have resigned themselves—things may not be perfect, they say, but little will change because “that’s just the way things are.”
we asked respondents whether any of the following were important issues in their own communities:• Violentorpropertycrime• Manufacturingorsalesofillegaldrugs• Lackofaffordablehousing• Too-rapiddevelopment,growthorsprawl• Underperformingschools• Lackofjobopportunities• Lackofrecreationalopportunities• Povertyorhomelessness• Populationdecliningaspeoplemoveaway• Lackofhealthandsocialservices
Crime and drugs are big problems in some areas.Across all four kinds of places, lack of job opportunities was the most important perceived problem. However, in chronically poor areas, concern about drug manufacturing and sales is nearly as high (Figure 29). The remoteness of rural areas, combined with high poverty rates, poor health care, and lack of funding for law enforcement and drug counseling makes them prime locations for illegal drug activity. substance abuse and unemployment of-ten go hand-in-hand (Van Gundy, 2006), and both problems are acutely felt in counties experiencing chronic poverty.
Violent or property crime is seen as most problematic in Appalachia, the Delta, and the Black Belt, contributing to the troubling profile of chronically poor areas plagued with unem-ployment, substance abuse, and inadequate social services.
Growth and decline create problems.Views regarding population decline versus too-rapid develop-ment, growth, and sprawl, in particular, underscored a wide divide between the worries of residents in amenity-rich areas and those facing decline (Figure 29). nearly 90 percent of Mid-west respondents said that population decline was an important concern, while barely 2 percent thought too-rapid development
Figure 29 “what do you consider to be important problems facing your community today?”
0 20 40 60 80 1000 20 40 60 80 100
Recreation
Crime
Development
Decline
Health
Poverty
Schools
Housing
Drug mfg & sales
Jobs
Decline
Recreation
Crime
Development
Decline
Health
Poverty
Schools
Housing
Drug mfg & sales
Jobs
Chronic poverty
Recreation
Crime
Development
Decline
Health
Poverty
Schools
Housing
Drug mfg & sales
Jobs
Amenity
Recreation
Crime
Development
Decline
Health
Poverty
Schools
Housing
Drug mfg & sales
Jobs
Amenity/decline
Percent

24
was important. Conversely, only 10 percent of those in the fast-growing Rocky Mountain counties considered population de-cline to be important, but 52 percent worried about overdevel-opment and sprawl.
These concerns about development and sprawl go hand-in-hand with concerns about affordable housing. Three-fourths of respondents in the Rockies believed that lack of afford-able housing was a serious problem. Boom towns like Aspen, Colorado—a once small and affordable ski town—offer hard lessons on the costs of explosive development and a massive influx of capital, as investors from all over the world moved to the area, bought land, and built expensive homes. Victims of the “Aspen effect”—those who work living-wage jobs in the $38,000 to $40,000 range or less, running the stores, waiting tables, cleaning rooms, and running ski lifts—must now com-mute sometimes three hours a day from their homes in more affordable communities.
People feel differently about the future, and moving away.when asked how they felt about the future of their communities, many saw a positive future, with one interesting exception. Only 15 percent of Midwestern respondents thought their commu-nity would be a better place to live in ten years, compared with more than 30 percent in all other regions (Figure 30). yet rural Midwesterners are not necessarily more pessimistic than oth-ers. Only 23 percent thought their community would become a worse place to live—a proportion similar to the other three areas. instead, 62 percent of respondents in the Midwest, far more than in other regions, thought their communities would be about the same in ten years. This sense of stability echoes the stability in their personal lives where, as noted earlier, large majorities are long-term residents with families in the area, and are themselves married and church-going.
The future of rural places depends critically on migration, including stemming the potential long-term loss of young adults. Reasons why people might stay are suggested by Figure 31. we asked respondents to rate the following factors as not important, somewhat important, or very important in their de-cision to stay in their area or move away in the future:• Livingnearfamily• Joboremploymentopportunities• Educationalopportunities• Housingopportunities• Outdoorsorotherrecreationalopportunities• Naturalbeautyofthearea• Generalqualityoflife
By and large, most respondents felt that quality of life, natural beauty, and family—three traditional strengths of ru-ral life—were the most important reasons to stay. Conversely,
Figure 30 “Based on what you see of the situation today, do you think that ten years from now, your community will be a better place to live, a worse place, or about the same?”
Amenity Amenity/decline
Decline
0 20 40 60
Chronic poverty
0 20 40 60Percent
Worse place
About same
Better place
Worse place
About same
Better place
44
35
21 21
47
32
Worse place
About same
Better place
Worse place
About same
Better place
62
15
23
47
31
22

25
opportunities for education, jobs, and housing—generally the strong points of cities —were reasons for leaving in all counties but chronically poor areas. There, slightly more than one-half of the respondents said that education, housing, and employ-ment were reasons to stay. Paradoxically, many residents in chronically poor areas also reported that these factors were im-portant problems in their areas (Figure 29).
in the amenity-rich Rockies, fewer respondents saw employ-ment opportunities as a reason to stay (Figure 31). That could reflect the greater affluence of Colorado residents and the ability of skilled professionals to relocate and take their jobs with them or even the ability to find attractive second jobs (Figure 7).
Relatively few Colorado respondents reported family as an important reason to stay. As noted above, nearly half (49 per-cent) the people from these counties had moved to their cur-rent homes within the last ten years and only 22 percent had a parent who grew up in the area. Recreation, on the other hand, was a major attraction of this area. in keeping with the value they place on natural beauty, respondents in the amenity-rich and the amenity/decline counties all ranked nature above fam-ily, while respondents in other regions did the reverse.
Figure 31 reflects the tradeoffs when deciding whether to stay in or leave a rural community. important reasons for stay-ing included a high quality of life, natural beauty, family, and, for those in amenity-rich (and amenity/decline) areas, rec-reation. But for many, young adults in particular, education, housing, and jobs tended to be more critical needs, and better sought elsewhere. Retirees and others who do not depend on the local economy for their income, or who already have an education and are able to afford decent housing, tend to find the rural beauty and quality of life in amenity-rich communi-ties more compelling. At the same time, new immigrants who are looking for affordable housing and are willing to work at low-skilled, low-paying jobs may settle in rural areas that may be losing younger locally born residents to the cities.
when asked whether they would advise a teenage child or child of a close friend to “stay in town” or move away for op-portunities elsewhere, large majorities in each region said they would advise the teenager to leave (Figure 32). One-third of respondents in the declining Midwestern counties, more than in any other area, said the opposite —that they would advise a teenager to stay. Their views likely reflect an understanding that these contracting communities must retain young people to survive. These attitudes also reflect the good qualities that Midwesterners see in their towns: family connections, quality of life, and trustworthy and helpful neighbors who get along and can be counted on to work together to solve local problems (Figure 16). These solid aspects of human and social capital, de-spite an aging population and economic decline, remain valu-able assets for Heartland communities.
Figure 31: “Do the following things seem not important, somewhat important, or very important to you, when you think about whether you will stay here or move away in the future?”
Figure 32: “if your own teenage child, or the child of a close friend, asked you for advice, would you recommend that they should plan to stay in this town as an adult, or move away for opportunities somewhere else?”
Education
Housing
Employment
Recreation
Family
Nature
Quality of life
Decline
Education
Housing
Employment
Recreation
Family
Nature
Quality of life
Not Somewhat Very
Chronic poverty
Education
Housing
Employment
Recreation
Family
Nature
Quality of life
Amenity
Education
Housing
Employment
Recreation
Family
Nature
Quality of life
Amenity/decline
MeansNot Somewhat Very
Stay here
Move away
Stay here
Move away
0 20 40 60 80
Stay here
Move away
0 20 40 60 80
Amenity
Stay here
Move away
29
71
24
76
36
74
26
Amenity/decline
Decline Chronic poverty
Percent
64

26
Overview: Portrait of Four Rural Americas
Dividing rural American places into these four differ-ent types is, of course, a convenient simplification of a complicated reality. each of the CeRA counties
spans many square miles, with residents representing a full range of lifestyles, ideologies, and backgrounds. within every region, we interviewed people struggling with day-to-day life, and others enjoying vacation time in their second homes. Mi-gration patterns are varied, bi-directional, and in flux. some people move away, others move in, and they can move more than once, either way. There are certainly those who move to and settle happily in declining resource-dependent areas, just as there are those who decide that retirement in an amenity-rich region is not what they expected, and return to the cities or suburbs.
Although a simplification, this categorization proved useful for understanding the CeRA survey results. The results include some patterns and trends worth considering for their policy implications. They highlight the problem of picturing rural communities as mainly agricultural or basing policies just on geographic location. Although all respondents shared some ba-sic concerns, differences were evident, suggesting that policies addressing problems in one type of rural place might not work as well in another.
Amenity-rich rural AmericaAmenity-rich areas have new, growing populations. Demo-graphically, the amenity areas are older, predominantly white non-Hispanics, but with a growing Hispanic population. How-ever, as Kulcsár and Bolender (2006) point out, an influx of older people to these regions does not necessarily result in an aging population. These “amenity migrants” (Johnson, 2007) bring with them a need for age-specific goods and services, creating a vacuum that is filled by an employment-driven in-migration of younger workers. in the case of the two Colorado counties surveyed, a large segment of this second migrant wave is made up of fairly young Hispanics, many with families.
employment is relatively high in amenity-rich areas, and poverty is low. Many households are upper-middle to upper-class. Almost one-half the respondents had college degrees, and one-third had college-educated fathers—much more than other areas. Household incomes and home values are higher than other areas, too, and many properties are second homes. For low-wage workers in particular, affordable housing is a problem. This issue concerned most of our respondents, re-gardless of income level.
survey respondents note the natural environment as a very important reason for moving to their community. Residents in these counties include more bicyclists, hikers, and camp-ers than elsewhere; they worried about climate change, and favored rules to restrict development and conserve natural resources. Respondents from these counties were also con-cerned about the effects of urban sprawl and too-rapid devel-opment. Finally, much like those of other rural regions, the amenity-area respondents noted that finding good jobs was a problem.
Declining resource-dependent rural AmericaRespondents in declining counties were overwhelmingly white non-Hispanic. Most are long-term residents whose par-ents also grew up in this area. Out-migration, particularly by young adults, drives population decline in these counties. The older generations stay behind, the population ages, and fam-ily size shrinks. Funding for infrastructure and personnel will be needed in the coming years to provide health care, public transportation, elderly services and goods, and nursing care. today, however, poverty is low, and employment is very high, with many reporting a second job. A notable discrepancy exists between residents’ moderate incomes and education, and their sharply lower home values.
These declining resource-dependent areas stand out from the other CeRA regions on a number of social dimensions, creating a profile that lives up to the image most people have of life in traditional rural America. Respondents in these counties were most likely to be married, to participate in local organizations, to believe their neighbors will help out when needed, to most consistently attend weekly religious services, and to vote Republican. They were also most likely to know someone who has served or is serving in iraq or Afghanistan.
unlike those in amenity-rich counties, few declining-area respondents moved to the area for its natural beauty, and their participation in outdoor recreation (other than hunting) was low. They understandably did not see sprawl as a problem, and were less worried about climate change or resource con-servation. Declining population, jobs, and drug manufactur-ing or sales were the most prominent local problems. Looking to the future, most declining-area respondents in the CeRA survey (unlike those from elsewhere) expected that life in their communities would remain the same, neither improv-ing nor getting worse.

27
Chronically poor rural AmericaHigh birth rates in the counties challenged by chronic poverty somewhat offset out-migration, and population decline has been gradual. The areas comprised substantial African-Ameri-can populations, with more young adults and fewer elders than in other areas. The great majority were long-term residents whose parents grew up in the area. employment was relatively low, and poverty much higher than in the other areas. Almost one-third of respondents used food stamps and many had lost their jobs in the last seven years. More respondents described themselves as unemployed or disabled and more households were lower income. These areas also had the highest share of residents with less than a high school education, and the pro-portion whose fathers had less than a high school degree was also much higher than in the other regions.
in some social respects, the chronic-poverty areas stand at the opposite end of the spectrum from the resource-dependent declining areas. Respondents in the chronic-poverty areas were least likely to be married, participated the least in local orga-nizations, and were more heavily Democratic. However, both areas reported frequent religious activity, whereas the amenity-based areas did not. Chronic-poverty respondents were the most likely to attend church twice a week and were most likely to be “born again.”
Chronic poverty and resource-dependent declining areas were similar in their responses about the environment. Hunt-ing was the most popular form of outdoor recreation, urban sprawl and climate change were not seen as problems, and en-vironmental rules have had few perceived effects. Few chron-ic-poverty respondents moved to their region for its natural beauty, and a relatively large minority favored using natural re-sources to create jobs rather than conserving those resources. Residents in chronically poor areas were also concerned about crime and, like respondents in the declining counties, were concerned about drugs and unemployment.
Amenity/decline rural AmericaAmenity/decline areas form an in-between category. unlike the other three types of rural places, amenity/decline coun-ties were not extreme on any major dimension. instead, their mixture of seemingly contrary trends becomes their most dis-tinguishing feature. For instance, although out-migration was not as prominent as in declining areas, younger working-aged adults were still leaving to seek better job opportunities. At the same time, “amenity migrants,” aged 50 to 59, were arriving (Johnson, 2007). Migration flows are roughly in balance, caus-ing only mild fluctuations in growth and decline.
employment was high and poverty relatively low—slightly higher than in amenity-rich areas, and equal to declining ar-eas. However, as in high poverty areas, job loss was greater in amenity-decline areas than in either amenity-rich or resource-dependent declining counties. Rates of food stamp use fell midway between the high rates of chronic poverty regions and the much lower rates of both amenity-rich and declining re-source-dependent areas. Population growth from newcomers creates enough demand to elevate home values above those in resource-dependent areas.
similarly, the share of newcomers and longer-term residents is more balanced than in either amenity-rich or resource-de-pendent areas. Respondents were predominantly white non-Hispanic and their political views were less partisan, with more independents than elsewhere. As in the declining and chroni-cally poor counties, residents viewed the shortage of jobs and drug manufacturing or sales as important problems in their communities.

28
Discussion and Policy Considerations“Rural America has a tendency to look backward at what it has lost, rather than
looking forward at what it might gain.” (Drabenstott & sheaff, 2002)
Many problems and solutions are shared by all.Oftentimes, the problems struggling rural economies face are caused by exactly those attributes which make them rural: low population density and remote locations (Drabenstott, 2002; Quigley, 2002; and others). striking an economically viable balance between human capital and natural capital, while re-taining the valued characteristics of rural life, is a challenge. The CeRA findings suggest that taking into account the “type” of place—even with a simplified classification—should be help-ful in planning. A one-size-fits-all approach to policymaking won’t work.
in June 2008 Congress passed a $300 billion farm bill. On the plus side, parts of the five-year bill reflect a shift in policy to encourage healthier eating habits for the American public, with recognition that access to healthy food is a persistent and critical problem for many. Funding for studies on these issues is included in the bill, as well as funding for conservation, nutri-tion, and food stamp programs. Farmers who grow “specialty crops” (fruits and vegetables) will receive significant subsidies and grants for the first time, and new attention is being paid to farmers’ markets as a way to make healthy foods more acces-sible for consumers to buy and for small farmers to sell.
But the fact remains that the main purpose of the Farm Bill is to provide subsidies to corporate farming interests. under the new bill, a farming couple making up to $1.5 million will be eligible for subsidies, and the bill even includes tax breaks for race horse breeders (stout, 2008). national policy should better reflect the true economic nature of rural America, and redirect funding from agribusiness subsidies to forward-look-ing rural development programs. state legislators need to be aware that some rural counties now face urban- and suburban-type problems as well. And the longstanding underinvestment in America’s chronically poor rural communities, especially in education, exacts a high toll on those living there, leaving them with few options in the new economy of the future.
in some respects, the differences between our types of ru-ral places are matters of degree rather than kind. For instance, three of the four struggle with the issue of retention of local youth, but not for all the same reasons. in some places there are too few attractive jobs, while others lack affordable hous-ing. Amenity-rich area respondents have well-founded con-cerns about controlling rapid development, urban sprawl, and
environmental protection, while other places have suffered the effects of extraction industries that transformed landscapes in ways that limit their economic future. Rising fuel costs in the era beyond Peak Oil will create serious challenges for all rural regions. For many residents, travel within and between local communities is problematic already, hampering access to health care, educational opportunities, jobs, housing, and shops. Areas dependent on recreation or tourism will see pe-riodic drops in visitors, as vacationers opt to save money and stay home.
For all the CeRA counties, regional partnering among rural businesses, communities, and governments, along with care-ful planning, is essential to the creation of workable solutions. Research indicates that the small size of many rural businesses makes them more vulnerable to the effects of population fluc-tuations or fuel prices, and that small firms become more ec-onomically viable when they operate in networks or clusters (Drabenstott, 2002; Henderson, 2004). But the idea of part-nering and depending on others sometimes goes against the traditional rural ideals of independence. in the CeRA chronic poverty counties, for example, residents’ faith in neighbors and government was lower than in other areas. As Henderson (2004) observes, small towns will have to overcome the “Fri-day night football rivalries” and start working together for the common good. Linking related businesses in a regional ap-proach will maximize economic potential, and blending com-munities’ resources will maximize human capital, as retirees, immigrants, educators, health care workers, craftspeople, and others share and combine skills.
Certain policy ideas seem applicable to all rural places:
n a need for advanced telecommunications technology
n access to affordable health care
n effective educational facilities and staff for children and adults
n more accessible and efficient public transportation
n affordable housing
n jobs that offer living wages.
Others address the challenges of particular regions.

29
Amenity-richsome of the challenges in amenity-rich areas resemble those of urban and suburban locales where markets are strong. Resi-dents worry about urban sprawl, overcrowding, noise and air pollution, and to a lesser extent, crime. Housing costs rise with this rural version of gentrification, pushing those with lower incomes further out: “drive until you qualify” for a mortgage, some say. Policy lessons from strong market areas in urban America can be applied to growing rural communities to ad-dress affordable workforce housing and the need for living wages.
Rapid population growth in rural regions strains local fis-cal capacity. state and local tax dollars cannot keep up with the demand for new construction, infrastructure, and services, and the responsibility falls to towns and individual tax payers to somehow make up the difference. People worry that as their once serene rural environs become citified, their reasons for living there fade away. Open space acquisition and land protec-tion strategies (including land donation and purchasing con-servation easements) can protect the environment and control sprawl. Clustered housing developments addressing the needs of the working class as well as affluent retirees have value from an environmental perspective, and serve the social purpose of forming inclusive, mixed neighborhoods.
Declining resource-dependent Declining counties hope to stem or even reverse the out-mi-gration of the last fifty years. Policies like the new Homestead Act, which offers financial incentives to those who commit to live and work in rural regions that are losing population, build on the local history of human and social capital. These incen-tive programs stimulate existing businesses and encourage en-trepreneurship, with the goal of an agglomeration economy—as economic activities cluster together, productivity increases (Quigley, 2002).
Forming clusters of economic activity is difficult in rural re-gions due to distance and low population density. telecommu-nication improvements and virtual networking can help address these problems. Place- and people-based public policies that fo-cus on human capital in the form of education and training, as well as transportation infrastructure, are very important here. There is also a “knowledge spillover” effect (Andersson, 2002; Quigley, 2002) where clustered economic activity spurs entre-preneurial growth and intellectual services such as research and development companies, education, consulting, and research, all of which share intangible goods and information. Clustered businesses attract high-skilled populations who naturally com-mand higher wages. in turn, more businesses are attracted to areas with pools of highly-skilled and educated workers.
Chronic povertytransportation and remoteness present particular problems for those living in poverty. The usDA economic Research service (2005) reports that nationwide, over 90 percent of individuals on public assistance do not own a car, and residents in poor regions of Appalachia and the south are particularly hard hit. state and federal funding could support well-coordinated pub-lic transportation systems, such as shuttle routes that carry rid-ers both within and between communities. Regional programs such as Opportunity Cars for work in Oregon and Bonnie CLAC in new england help qualifying individuals obtain low-interest loans, attend financial education classes, and purchase cars to get to work or look for a job, could provide useful mod-els (Armstrong, A, 2008; K. Pringle, personal communication, May 16, 2008; Carsey evaluation of Bonnie CLAC 2008).
Funding is needed for proven policies like early childhood education that includes family home visits and attention to language development (Duncan, 2008). A regional network of health clinics, with shuttle service for those needing transpor-tation, is critical to deal with problems ranging from well-child care to diabetes and asthma, or to substance abuse and mental health counseling.
improving educational opportunities within these commu-nities is the most urgent need, as economies continue to change. networks of community colleges, partnering with local and re-gional governments, businesses, and individuals could provide certificate programs that target needs of specific communi-ties and residents (RCCi, 2003). Distance learning programs, which have been successful in some rural locations, have great potential, although they require funding for telecommunica-tions systems and support staff (Gillespie, 1999). in sparsely populated or very remote areas, libraries can serve as computer and technology centers, with classes to teach computer compe-tence at all ages (Mazie & Ghelfil, 1995).
infrastructure improvements, in Appalachia in particular, face the problem of a large population of unskilled workers. new construction projects find it hard to fill the demand for contractors, engineers, and other skilled workers (Cromartie, 2006). technical and trade schools could help this problem, forming partnerships with existing economic development groups that are currently trying to improve the environment and promote tourism (Duncan, 2008).

30
Amenity/decline These areas are in the midst of economic transformation, and often the fiscal and governance structures of the “old economy” seem to prevent the development of new strategies for future development. These communities need to maintain their rela-tively high human and social capital, stem the outmigration of young adults, and capitalize on the opportunities to bring in new people and businesses. Cromartie and nelson (2006) sug-gest the idea of the “sweet spot,” that retirees seek out remote rural areas that are just close enough to nearby cities for recre-ation, culture, shopping, and visiting friends, while far enough from city life to avoid pollution, noise, and traffic congestion. Almost 50 percent of respondents in amenity/decline counties said that they moved to these areas for their natural beauty. to continue to attract in-migrants including retirees, who bring their own, accumulated wealth as well as entrepreneurial en-ergy and skills, infrastructure that facilitates access to and from the city and within the rural region is critical.
Conclusion
the tapestry of rural America is complex. From an eco-nomic standpoint, two main obstacles to success—re-moteness and low density—are exactly what make rural
areas unique and special. Policies must center on solutions that will enhance, protect, and preserve the beauty of the natural environment, using place-specific resources and human capital to attract and grow new economic opportunities. educational outreach programs, new technology and high-speed internet, affordable and accessible health care facilities, and improved transportation systems adapted to the changing fuel economy, should be high-priority issues.
Finally, it is important to educate the predominantly urban/suburban American public about the new realities of rural life. Many voters imagine that “rural” means either farmland or vacation destinations. The issues, concerns, and problems that many rural residents are facing will be more difficult to address without better general-public awareness.
On the other hand, new arrivals are sometimes difficult to integrate into the existing community. They often bring with them different social, cultural, and political views, and expect different goods and services. Given the cultural, generational, and income diversity that characterize changing communities, it is important that all segments of the population feel that they are included in and can benefit from community decisions (Kirschner, Berry, & Glasgow, 2006). Community efforts to build inclusive arts, culture and heritage programs have proved effective in some areas.
in keeping with the continued need for research and rigor-ous methodological analysis, the Carsey institute plans future CeRA surveys to ascertain the perspectives, attitudes, and con-ditions among residents in other selected rural regions, some unlike those considered here. we also plan to return to many of these communities for a follow up survey two years later. Rural America is changing, and tracking that change is impor-tant for good policy development.

31
[1] The term “Black Belt” historically describes both the rich black farming soil, and the large African American population of a region crossing the state of Alabama to the south of the Appalachian foothills and north of the coastal plains.
[2] Calculated according to American Association for Public Opinion Research’s RR4 standard (AAPOR, 2006).
[3] telephone numbers within each selected county were selected at random. Once interviewers reached a household, they asked to speak with the adult who had the most recent birthday and made appoint-ments if that person were not present—thus randomizing selection of individuals within households. Probability weights were later cal-culated to adjust for the number of people living in each house, and to make other minor adjustments toward Census age/sex/race dis-tributions within each county (using methods described in Lee and Forthofer, 2006). All of the results in this report apply these weights.
AAPOR. (2006). Standard Definitions: Final Disposition of Case Codes and Outcome Rates for Surveys, 4th ed. Lenexa, Ks: American Asso-ciation for Public Opinion Research.
Andersson, R, Quigley, J., and wilhelmisson, M. (2002). “university Decentralization as Regional Policy: The swedish experiment.” Paper presented at the western Regional science Association Annual Meet-ing, Monterey, California, February 19, 2002.
Armstrong, A. L. (2008). Evaluation Progress Report: Opportunity Cars for Work. seattle: Business Government Community Connections.
Brown, D. M. (1999). Highway Investment and Rural Economic Devel-opment: An Annotated Bibliography. washington, DC: u.s. Govern-ment Printing Office.
Colnes, A., Grimm, C., Hattan, A.s., stracuzzi, n., and wyckoff-Baird, B. (2007). “Rural America in the 21st Century: Perspectives from the Field.” Report to the Rural Assembly. Durham: university of new Hampshire, Carsey institute.
Colocousis, C. R. (2008). The State of Coos County: Local Perspectives on Community and Change. issue brief no. 7. Durham: university of new Hampshire, Carsey institute.
Cromartie, J. (2001) “Migrants in the Rural south Choose urban and natural Amenities.” Rural America, 15(4): 7-18.
Cromartie, J., and nelson, P. (2006). “shifting Demographics and Ru-ral entrepreneurship in Rural America.” Paper presented at the Ru-PRi-eRs Conference, exploring Rural entrepreneurship imperatives and Opportunities for Research, washington, DC, October 26-27.
Davis, J.A., smith, t. w., and Marsden, P. V. (2007). GeneralSocialSurveys, 1972-2006 [Computer file]. iCPsR04697-v2. Chicago: na-tional Opinion Research Center, 2007.
Drabenstott, M., and sheaff, K. (2002). “new Power of Regions: A Policy Focus for Rural America.” Economic Review, 87(2): 55-69.
Duncan, M. (2008). “Place Matters: Poverty and Development Chal-lenges in Amenity Rich, Declining Resource Dependent and Chroni-cally Poor Regions.” Audio recording of lecture sponsored by Havens Center, institute for Research on Poverty, and the Global studies pro-gram at the university of wisconsin. Madison: Havens Center, uni-versity of wisconsin. Available at www.havenscenter.org/audio/by/artist/cynthia_mil_duncan (July 2008).
economic Research service. (2005). RuralTransportationataGlance. Agriculture information Bulletin no. 795. washington, DC: u.s. De-partment of Agriculture. Available at www.ers.usda.gov/publications/AiB795/AiB795_lowres.pdf
Fingleton, e. (2000). “The Forgotten Merits of Manufacturing.” Challenge, 42(2): 67-85.
[4] to keep the discussion straightforward, we do not report separate confidence intervals or significance tests. Given the large sample sizes, however, most of the striking contrasts will be statistically significant as well. For example, within the amenity-rich and resource-depen-dent declining area sub samples, which have 1,000 respondents each, the margin of error for percentages should be about +/-3 percent. within the chronic poverty and amenity/decline sub samples, which have nearly 3,000 respondents each, margins of error are about +/-2 percent. Bar lengths in the graphs reflect decimal-point precision, so they may be slightly longer or shorter than the rounded-off numbers written beside them suggest.
References
endnotes

32
Gibbs, R., Kusmin, L., and Cromartie, J. (2004). “Low-skill Jobs: A shrinking share of the Rural economy.” Amber Waves (november).
Gillespie, K. (1999). SouthCarolinaIncreasesNursingCareerOpportu-nitiesinRuralAreas:GrantResults. Princeton, nJ: Robert wood John-son Foundation. Available at www.rwjf.org/reports/grr/021763.htm.
Glasmeier, A., and salant, P. (2006). Low-SkillWorkersinRuralAmer-icaFacePermanentJobLoss. Policy brief no. 2. Durham: university of new Hampshire, Carsey institute.
Hamilton, L. C. (2007). Snapshotsof SocialChange:Views from theHeartland. Durham: university of new Hampshire, Carsey institute. Available at www.carseyinstitute.unh.edu/snapshot_kansas.html_____ . (2007) Snapshots of Social Change:ANew Survey ofViewsfrom Rural America. Durham: university of new Hampshire, Carsey institute. Available at www.carseyinstitute.unh.edu/snapshot_views-fromruralamerica.html
Hamilton, L. C., Rohall, D. e., Brown, B. C., Hayward, G., and Keim, B. (2003). “warming winters and new Hampshire’s Lost ski Areas: An integrated Case study.” InternationalJournalofSociologyandSo-cial Policy, 23(10): 52-73.
Henderson, J. R.(2004). “Globalization Forces Rural America to Blaze a new trail.” AgDecisionMakerNewsletter(March). Available at www.extension.iastate.edu/agdm/articles/others/HenMar04.htm
Jensen, L. (2006). “new immigrant settlements in Rural America: Problems, Prospects, and Policies.” Reports on Rural America, 1(3). Durham: university of new Hampshire, Carsey institute.
Johnson, K. M. (2006.) “Demographic trends in Rural and small town America.” Reports on Rural America, 1(1). Durham: university of new Hampshire, Carsey institute.
Kirschner, A, Berry, e. H., and Glasgow, n. (2006). “The Changing Demographic Profile of Rural America.” [electronic version]. Occa-sional policy brief series on population change and rural society. Dor-drecht, The netherlands: springer. Available at www.ncrcrd.iastate.edu/resources/Kirschner_Berry_GlasgowV3.pdf
Lee, e.s., and R.n. Forthofer. (2006). Analyzing Complex Survey Data, 2d ed. Thousand Oaks, CA: sage.
Mazie, s. M., and Ghelfil, L. M. (1995). “Challenges of the Rural envi-ronment in a Global economy.” LibraryTrends, 44(1): 7-20.
McGranahan, D. A. (2001). “new economy Manufacturing Meets Old economy education Policies in the Rural south.” Rural America, 15(4): 19-27.
Meckstroth, A., Burwick, A., Ponza, M., Marsh, s., novak, t., Phil-lips, s., et al. (2006). Paths to Work in Rural Places: Key Findings and LessonsfromtheImpactEvaluationoftheFutureStepsRuralWelfare-to-WorkProgram.FinalReport (MPR Reference no. 8762-192,202). Princeton, nJ: Mathematica Policy Research, inc.
NationalRuralAssembly:FinalReport. (2007). Durham: university of new Hampshire, Carsey institute.
nisbet, M.C., and Myers, t. (2007). “twenty years of Public Opinion about Global warming.” Public Opinion Quarterly, 71(3): 444-470.
Pringle, K. (2008). Personal communication, May 16.
Purdue Center for Regional Development (2007). Unlocking RuralCompetitiveness: The Role of Regional Clusters. west LaFayette, in: Purdue university. Available at www.ibrc.indiana.edu/innovation/reports.html
O’Hare, w., and Bishop, B. (2006). U.S.RuralSoldiersAccountforaDisproportionatelyHighShareofCasualtiesinIraqandAfghanistan. Fact sheet no. 3. Durham: university of new Hampshire, Carsey in-stitute.
Quigley, J. M. (2002). “Rural Policy and the new Regional econom-ics: implications for Rural America.” in TheNewPowerofRegions:APolicy Focus for Rural America. Conference proceedings compiled by Federal Reserve Bank of Kansas City. Available at http://www.kansas-cityfed.org/PuBLiCAt/PowerofRegions/Powerof%20Regionsmain.htm._____ . (2008). “urbanization, Agglomeration, and economic De-velopment.” working paper no. w08-002. Berkeley: university of California, institute of Business and economic Research, Program on Housing and urban Policy.
Rural Community College initiative. (2003). Revitalizing Rural Com-munities: Lessons from the Rural Community College Initiative. Chapel Hill, nC: MCD, inc._____ . (2002). Strategies for Funders: Community Colleges and Rural Development. Chapel Hill, nC: MCD, inc.
stout, D. (2008). “House Backs Farm Bill with numbers to Beat Veto.” NewYorkTimes, May 15, p. A1.
Van Gundy, Karen. (2006). “substance Abuse in Rural and small town America.” Reports on Rural America, 1(2). Durham: university of new Hampshire, Carsey institute.
w.K. Kellogg Foundation. (2002). Perceptions of Rural America: Con-gressional Perspectives. Battle Creek, Mi: w.K. Kellogg Foundation. Available at www.wkkf.org/pubs/FoodRur/pub2973.pdf_____ . (2001). Perceptions of Rural America. Battle Creek, Mi: w.K. Kellogg Foundation. Available at http://www.wkkf.org/pubs/Food-Rur/pub2973.pdf_____ . (2002). PerceptionsofRuralAmerica:NationalStateLegisla-tor Survey. Battle Creek, Mi: w.K. Kellogg Foundation. Available at http://wkkf.org/pubs/FoodRur/Pub3782.pdf

About the Carsey instituteThe Carsey institute at the university of new Hampshire conducts research and analysis into the challenges facing families and communities in new Hampshire, new eng-land, and the nation.
The Carsey institute sponsors independent, interdisciplin-ary research that documents trends and conditions in America, providing valuable information and analysis to policymakers, practitioners, the media, and the general public.
Through this work, the Carsey institute contributes to public dialogue on policies that encourage social mobility and sustain healthy, equitable communities and strengthens nonprofits working to improve family and community well-being.
The Carsey institute was established in May 2002 from a generous gift from alumna and noted television producer Marcy Carsey.
This report is printed on 30% recycled paper (inside) and 50% recycled paper (cover) and printed with soy-based inks.
About the authorsCynthia “Mil” Duncan, is the director of the Carsey institute and the author of Rural Poverty in America.
Lawrence Hamilton is senior Fellow of the Carsey institute and professor of sociology at the university of new Hampshire. His current research involves studies of human-environment interactions in the rural united states and the Arctic.
Leslie Hamilton is a freelance writer and researcher, specializing in the social sciences.
Chris Colocousis is a Ph.D. candidate in sociology at the university of new Hampshire.

Building Knowledge for Families and Communities
Carsey institute university of new Hampshire Huddleston Hall73 Main streetDurham, new Hampshire 03824-3563
(603) 862-2821
www.carseyinstitute.unh.edu