place euge`ne bataillon, 34095 montpellier cedex 5, france … · viale del risorgimento 4, 40136...
TRANSCRIPT
i n t e rn a t i o n a l j o u r n a l o f h y d r o g e n en e r g y 3 6 ( 2 0 1 1 ) 5 9 7 2e5 9 8 2
Avai lab le at www.sc iencedi rect .com
journa l homepage : www.e lsev ie r . com/ loca te /he
PteSn/g-Al2O3 and PteSneNa/g-Al2O3 catalysts for hydrogenproduction by dehydrogenation of Jet A-1 fuel:Characterisation and preliminary activity tests
Carlo Resini a,*, Carlo Lucarelli b, Melanie Taillades-Jacquin a, Kan-Ern Liew a,c,Ilenia Gabellini d, Stefania Albonetti b, David Wails d, Jacques Roziere a,Angelo Vaccari b, Deborah Jones a
a Institut Charles Gerhardt UMR 5253, Agregats, Interfaces et Materiaux pour l’Energie, Universite Montpellier 2,
Place Eugene Bataillon, 34095 Montpellier Cedex 5, FrancebDipartimento di Chimica Industriale e dei Materiali, Alma Mater Studiorum, Universita degli Studi di Bologna,
Viale del Risorgimento 4, 40136 Bologna, ItalycPower Generation, EADS Innovation Works, Dept. IW-EP, Energy & Propulsion, 81663 Munich, Germanyd Johnson Matthey Technology Centre, Blount’s Court, Sonning Common, Reading RG4 9NH, United Kingdom
a r t i c l e i n f o
Article history:
Received 8 December 2010
Received in revised form
4 February 2011
Accepted 6 February 2011
Available online 21 March 2011
Keywords:
Hydrogen
Partial dehydrogenation
PteSn catalysts
Fuel cell
Jet-A-1 fuel
* Corresponding author. Tel.: þ33 467143256.E-mail address: Carlo.Resini@univ-montp
0360-3199/$ e see front matter Copyright ªdoi:10.1016/j.ijhydene.2011.02.036
a b s t r a c t
Thepartial dehydrogenation of fuels like diesel or kerosene cuts to produceH2 is an emerging
idea of increasing interest. In the presentwork the study of the partial dehydrogenation of Jet
A-1 fuel on PteSn/g-Al2O3 based catalysts to produce H2 to feed an on-board (aircraft) proton
exchange membrane fuel cell is presented. Extensive physico-chemical characterization of
5% wt.Pt-1% wt.Sn/g-Al2O3 and 5%wt.Pt-1%wt.Sn-1%wt.Na/g-Al2O3 pelleted materials has
been performed. A gradient of the active metals from the edge to the centre of the pellet has
been observed. A higher concentration of Pt0 has been detected on the outer part of the pellet
than in the inner part, whereas Sn has been detected only on the external part of the pellet.
The investigated materials are active as catalysts for the partial dehydrogenation of normal
and desulfurised Jet A-1 kerosene fuel. The presence of sulfur compounds and coke
deposition strongly affects theH2 productivitywhich decreases rapidlywith time on stream.
The presence of a Na cation addition contributes to give the highest and most sustained H2
production. The condensed outlet liquid stream retains the fuel properties in the range of the
Jet A-1 kerosene fuel. These are encouraging preliminary results, inviting further research;
coking and sulfur poisoning as well as identification of appropriate reaction conditions are
the main challenges to be overcome in the immediate future.
Copyright ª 2011, Hydrogen Energy Publications, LLC. Published by Elsevier Ltd. All rights
reserved.
1. Introduction emissions reductions. In addition to the durability and cost
The use of fuel cells in transport applications either for pro-
pulsion or as an auxiliary power unit will contribute to
2.fr (C. Resini).2011, Hydrogen Energy P
issues, incumbent on fuel cells, efficient on-board H2 storage
and production technologies require further development
[1e6]. Various methods of H2 storage are being considered,
ublications, LLC. Published by Elsevier Ltd. All rights reserved.
i n t e r n a t i o n a l j o u r n a l o f h y d r o g e n en e r g y 3 6 ( 2 0 1 1 ) 5 9 7 2e5 9 8 2 5973
amongst which liquid and highly-pressurised hydrogen are
already at engineering prototype stage whereas solid-state
storage as hydrides and porous solid adsorption of molecular
H2 are still at early stage of development [3,7,8]. A promising
method for storing and transporting H2 is the dehydrogena-
tion of cyclic hydrocarbons with high H2 content, known also
as “chemical hydrides” or “organic hydrides” that can be
dehydrogenated and hydrogenated reversibly [6,9e12]. In
particular, cyclohexane and decalin are considered suitable H2
storage media, their H2 content (7.3% wt., 64.8 kg H2/m3 for
decalin and 7.2 % wt., w55 kg H2/m3 for cyclohexane) [6]
meeting the US Department of Energy hydrogen storage
target for transportation for 2010 (6.0 wt%, 45.0 kg H2/m3) [4];
but not that for 2015 (9.0 wt%, 81.0 kg H2/m3) [1].
The use of fuels like diesel or kerosene cuts as H2 source is
an emerging idea of increasing interest [13,14]. The aim is to
further upgrade an already valuable energy carrier, fossil fuel,
by extracting another energy carrier, H2. The lack of oxygen in
diesel and kerosene molecular composition makes them
suitable for partial dehydrogenation to produce dehydro-
genated hydrocarbons in the liquid phase and hydrogen in the
gas phase. Since the gas stream is free of carbon oxides, it can
be directly fed without any further purification to an on-board
proton exchange membrane fuel cell to supply electrical
energy to auxiliary systems in maritime and aeronautic
applications. It is note worthy that the liquid mixture
comprising partially dehydrogenated hydrocarbons still
maintains its original fuel properties, so making hydrocarbon
mixtures an appealing H2 storage medium. In principle the
same catalysts currently employed for dehydrogenation or
reforming of hydrocarbons, which are alumina-supported
Pt-basedmono- or bimetallic catalysts [15] are also suitable for
H2 production by hydrocarbon partial dehydrogenation.
Studies have been performed on several different sup-
portedmetal catalysts for cycloalkane dehydrogenation [6]. Ni
and Pt are among the most used active phases [10,14,16e23].
Ni is much cheaper than Pt but its selectivity to dehydroge-
nation reactions is lower and cracking reactions are more
favoured at high temperature. Also the support plays a key
role, and the influence of supports such as alumina
[10,14,17,21], alumina-sulfated zirconia [14], silica [24], acti-
vated carbon [12,19,20,22], carbon nanofibers [9,25,26] or
carbon nanotubes [23] has been investigated.
The choice of the catalyst for hydrocarbon dehydrogena-
tion capable of producing H2 without compromising the
original fuel properties is crucial. The right catalyst has to
favour dehydrogenation or reforming (isomerisation, cyclisa-
tion, aromatisation) reactions, while avoiding polymerisation
or cracking reactions responsible for coke deposition and
catalyst deactivation.
Bimetallic PteSn/g-Al2O3 based catalysts have been widely
studied. According to the literature, the presence of Sn inhibits
sintering of Pt clusters, improves catalyst stability towards
deactivation by coking, and restrains hydrocracking, hydro-
genolysis, hydrogenation, and isomerisation, while improving
dehydroisomerisation and dehydrocyclisation reactions
[14,27e30]. Furthermore, studies on the effect of the addition
of alkali metals as promoters have concluded that in addition
to neutralising surface acidity, alkali metal ions might
promote H2 spillover, inhibit coke deposition and increase the
fraction of exposed metallic Pt surface after coke deposition
[15,31e37].
The open literature is rather meagre on studies concerning
H2 production by fuel dehydrogenation, although the activity of
PteSn/g-Al2O3 based catalysts in cyclohexanedehydrogenation
and Pt/g-Al2O3 based materials in Jet A-1 fuel dehydrogenation
have been examined [14]. On the other hand, the activity of
PteSn/g-Al2O3 based materials as catalysts for Jet A-1 fuel
dehydrogenation seemsnot to have been investigated. The aim
of the present work was the study of the partial dehydrogena-
tionof JetA-1 fuelonPteSnbasedcatalysts toproduceH2 to feed
an on-board (aircraft) proton exchangemembrane fuel cell.
2. Experimental
2.1. Catalyst preparation
Catalysts 5% wt.Pt-1% wt.Sn/g-Al2O3 and 5% wt.Pt-1% wt.Sn-
1% wt.Na/g-Al2O3 (hereinafter denoted JM004 and JM007
respectively), were prepared by successive impregnations of
Pt and Sn active phases. The g-Al2O3 support (Degussa) was
impregnated with a solution of hexachloroplatinic acid
(Johnson Matthey), and the resulting product dried under
reduced pressure in a rotary evaporator, then further dried at
110 �C for 2 h and finally calcined in air at 500 �C (10 �C/min) for
8 h. For part of the sample, a second impregnation was made
with a solution of SnCl2$H2O (Alfa Aesar), and the same drying
and calcination procedure was performed. For the other part
of the sample, the second impregnation was made with
a solution of SnCl2$H2O (Alfa Aesar) and NaNO3 (BDH), before
drying and calcining as above.
2.2. Catalyst characterization
X-ray powder diffraction (XRPD) patterns were recorded using
a Philips PW 1050/81 goniometer, equipped with a PW 1710
unit, using Cu-Ka radiation (l ¼ 0.15418 nm, 40 kW, 25 mA).
N2 adsorption/desorption isotherms were obtained using
a Micromeritics ASAP 2020 M P volumetric adsorption system
operating at 77 K. The samples were pre-treated by outgas-
sing at 150 �C for 12 h under secondary vacuum. Specific
surface area and mean pore diameter were calculated from
the adsorption and desorption branches of the isotherms,
respectively. Measurements of surface acidity were per-
formed by thermoprogrammed desorption of ammonia (NH3-
TPD) in an Autochem 2910 by Micromeritics equipped with
a TCD detector. The samples were submitted to a flow of pure
NH3 at 100 �C for 1 h, and then flushed with He at 100 �C for
1 h. NH3 was desorbed from the sample surface by heating to
900 �C under 30 ml/min He flow.
Transmission Electron Microscopy (TEM) investigations
were performed using a JEOL 1200 EXmicroscope. The samples
in powder formwere reduced in H2 at 350 �C for 4 h. They were
then dispersed in ethanol and spread on a mica sheet. The
dispersed powder was covered with a film of carbon and
immersed in HF solution. The result was a carbon replica of the
originalstructurecontainingonlythemetal (PtandSn)particles.
SEM/EDS analyses were performed using an EVO 50 Series
Instrument (LEO ZEISS) equippedwith an INCAEnergy 350 EDS
i n t e rn a t i o n a l j o u r n a l o f h y d r o g e n en e r g y 3 6 ( 2 0 1 1 ) 5 9 7 2e5 9 8 25974
micro-analysis system and INCASmart-Map for imaging the
spatial variation of elements in a sample (Oxford Instruments
Analytical). The accelerating voltage was 25 kV, the beam
current 1.5 nA, and the spectra collection time 100 s. Analyses
were conducted on cut pellet lapped with 3 mm diamond
spray. Samples were not pre-treated and analyses were per-
formed at 90 Pa.
Thermal-programmed measurements were performed
using a Thermoquest TPDRO1100 instrument. Calcined
samples were loaded in a quartz reactor and pre-treated in
nitrogen at 150 �C for 30 min to eliminate weakly adsorbed
species. After cooling to room temperature, N2was replaced by
the analysing gas [5%(v/v) H2 in argon for reduction tests, 5%(v/
v) O2 in He for oxidation], and the temperature was increased
up to 500 �C (10 �C/min). The sampleswerefinally held at 500 �Cfor 20 min. Cyclic TPR/TPO/TPR tests were also carried out,
whereby the samples were first reduced, then re-oxidized and
then reduced a second time following the above protocol.
2.3. Catalytic activity tests
Preliminary catalytic activity tests were performed using
4.5 cm3 of catalyst in a pressurised fixed bed flow reactor in
line with a GC system (Agilent Technologies 6890N) equipped
with TCD and FID detectors and two HP-PLOT Molesieve 5A
and HP-PLOT/Q columns.
After purging, the system was pressurised with argon
to 0.5 MPa and the reactor was heated from room temperature
to the operating temperature; as soon as the operational
temperature was reached, the fuel pump introduced the fresh
fuel through the system at the desired flow rate (0.5 ml/min).
Temperature and pressure were continuously monitored
up- and down-stream of the reactor. The exit stream of the
reactor consisted of a two-phase mixture of H2 rich gas (with
some light hydrocarbons) and partially dehydrogenated liquid
fuel,whichwascooled toca. 28 �Cbyawatercooler.Thestream
then entered a phase separator where liquid phase and gas
phase were separated gravimetrically; the liquid phase was
collected at the end of each experiment in a fuel collection
tank. The gas phase stream was continuously sent out of the
system through a back-pressure regulator (EL-PRESS� P-702C)
from Bronkhorst, to the GC system, where a gas sample was
taken every 10 min to perform H2 and hydrocarbon analyses.
The reactor was shut off under Ar flow to maintain the
pressure, purge the gases and collect the liquid streams. If the
experimentwere tobe continued the followingday, the system
was kept under Ar overnight at 0.5 MPa. The catalytic activity
tests were conducted at 350 �C at 0.5 MPa under two different
types of feed: Jet A-1 fuel and desulfurised (3 ppmS) Jet A-1 fuel
(Sulfur Free Kerosene: SFK). Tests with SFK Jet A-1 fuel were
conducted over 2 days shutting-off and starting-up again the
reactor without changing the catalytic bed for each catalyst.
3. Results and discussion
3.1. Structural and surface characterisation
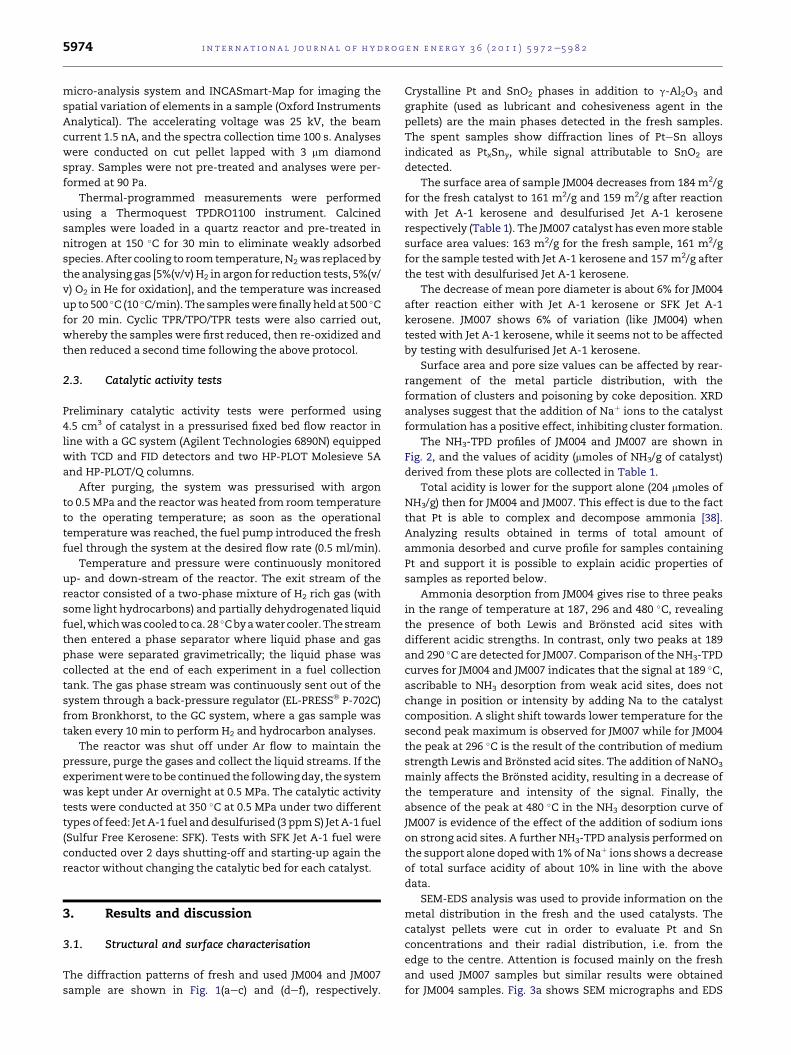
The diffraction patterns of fresh and used JM004 and JM007
sample are shown in Fig. 1(aec) and (def), respectively.
Crystalline Pt and SnO2 phases in addition to g-Al2O3 and
graphite (used as lubricant and cohesiveness agent in the
pellets) are the main phases detected in the fresh samples.
The spent samples show diffraction lines of PteSn alloys
indicated as PtxSny, while signal attributable to SnO2 are
detected.
The surface area of sample JM004 decreases from 184 m2/g
for the fresh catalyst to 161 m2/g and 159 m2/g after reaction
with Jet A-1 kerosene and desulfurised Jet A-1 kerosene
respectively (Table 1). The JM007 catalyst has evenmore stable
surface area values: 163 m2/g for the fresh sample, 161 m2/g
for the sample tested with Jet A-1 kerosene and 157 m2/g after
the test with desulfurised Jet A-1 kerosene.
The decrease of mean pore diameter is about 6% for JM004
after reaction either with Jet A-1 kerosene or SFK Jet A-1
kerosene. JM007 shows 6% of variation (like JM004) when
tested with Jet A-1 kerosene, while it seems not to be affected
by testing with desulfurised Jet A-1 kerosene.
Surface area and pore size values can be affected by rear-
rangement of the metal particle distribution, with the
formation of clusters and poisoning by coke deposition. XRD
analyses suggest that the addition of Naþ ions to the catalyst
formulation has a positive effect, inhibiting cluster formation.
The NH3-TPD profiles of JM004 and JM007 are shown in
Fig. 2, and the values of acidity (mmoles of NH3/g of catalyst)
derived from these plots are collected in Table 1.
Total acidity is lower for the support alone (204 mmoles of
NH3/g) then for JM004 and JM007. This effect is due to the fact
that Pt is able to complex and decompose ammonia [38].
Analyzing results obtained in terms of total amount of
ammonia desorbed and curve profile for samples containing
Pt and support it is possible to explain acidic properties of
samples as reported below.
Ammonia desorption from JM004 gives rise to three peaks
in the range of temperature at 187, 296 and 480 �C, revealingthe presence of both Lewis and Bronsted acid sites with
different acidic strengths. In contrast, only two peaks at 189
and 290 �C are detected for JM007. Comparison of the NH3-TPD
curves for JM004 and JM007 indicates that the signal at 189 �C,ascribable to NH3 desorption from weak acid sites, does not
change in position or intensity by adding Na to the catalyst
composition. A slight shift towards lower temperature for the
second peak maximum is observed for JM007 while for JM004
the peak at 296 �C is the result of the contribution of medium
strength Lewis and Bronsted acid sites. The addition of NaNO3
mainly affects the Bronsted acidity, resulting in a decrease of
the temperature and intensity of the signal. Finally, the
absence of the peak at 480 �C in the NH3 desorption curve of
JM007 is evidence of the effect of the addition of sodium ions
on strong acid sites. A further NH3-TPD analysis performed on
the support alone dopedwith 1% of Naþ ions shows a decrease
of total surface acidity of about 10% in line with the above
data.
SEM-EDS analysis was used to provide information on the
metal distribution in the fresh and the used catalysts. The
catalyst pellets were cut in order to evaluate Pt and Sn
concentrations and their radial distribution, i.e. from the
edge to the centre. Attention is focused mainly on the fresh
and used JM007 samples but similar results were obtained
for JM004 samples. Fig. 3a shows SEM micrographs and EDS
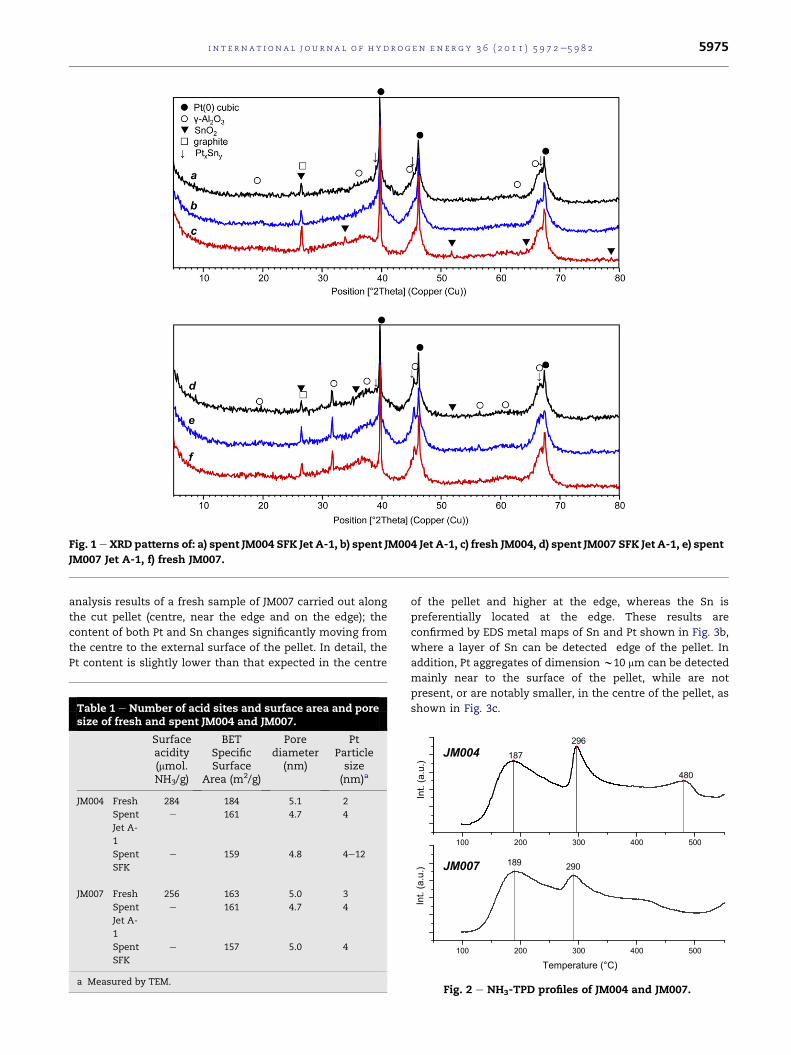
Fig. 1 e XRD patterns of: a) spent JM004 SFK Jet A-1, b) spent JM004 Jet A-1, c) fresh JM004, d) spent JM007 SFK Jet A-1, e) spent
JM007 Jet A-1, f) fresh JM007.
i n t e r n a t i o n a l j o u r n a l o f h y d r o g e n en e r g y 3 6 ( 2 0 1 1 ) 5 9 7 2e5 9 8 2 5975
analysis results of a fresh sample of JM007 carried out along
the cut pellet (centre, near the edge and on the edge); the
content of both Pt and Sn changes significantly moving from
the centre to the external surface of the pellet. In detail, the
Pt content is slightly lower than that expected in the centre
Table 1 e Number of acid sites and surface area and poresize of fresh and spent JM004 and JM007.
Surfaceacidity(mmol.NH3/g)
BETSpecificSurface
Area (m2/g)
Porediameter
(nm)
PtParticlesize(nm)a
JM004 Fresh 284 184 5.1 2
Spent
Jet A-
1
e 161 4.7 4
Spent
SFK
e 159 4.8 4e12
JM007 Fresh 256 163 5.0 3
Spent
Jet A-
1
e 161 4.7 4
Spent
SFK
e 157 5.0 4
a Measured by TEM.
of the pellet and higher at the edge, whereas the Sn is
preferentially located at the edge. These results are
confirmed by EDS metal maps of Sn and Pt shown in Fig. 3b,
where a layer of Sn can be detected edge of the pellet. In
addition, Pt aggregates of dimension w10 mm can be detected
mainly near to the surface of the pellet, while are not
present, or are notably smaller, in the centre of the pellet, as
shown in Fig. 3c.
187296
.)
JM004
100 200 300 400 500
480
Int.
(a.u
189 290
Int.
(a.u
.) JM007
100 200 300 400 500
Temperature (°C)
Fig. 2 e NH3-TPD profiles of JM004 and JM007.
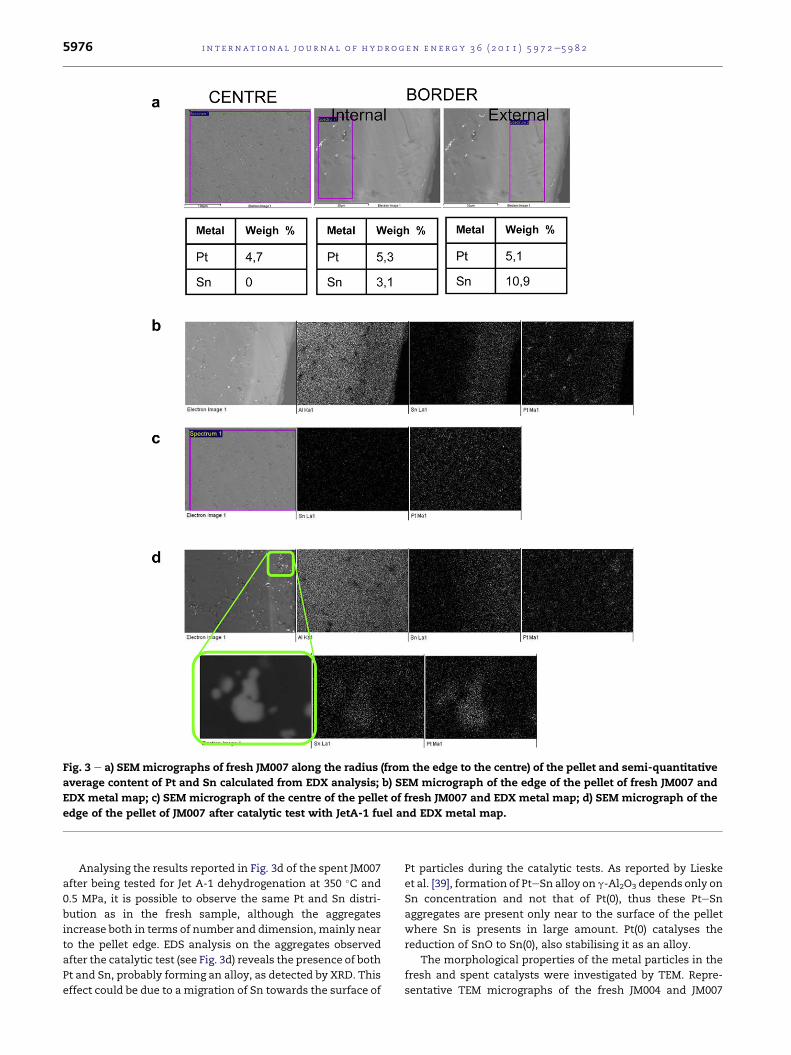
Fig. 3 e a) SEM micrographs of fresh JM007 along the radius (from the edge to the centre) of the pellet and semi-quantitative
average content of Pt and Sn calculated from EDX analysis; b) SEM micrograph of the edge of the pellet of fresh JM007 and
EDX metal map; c) SEM micrograph of the centre of the pellet of fresh JM007 and EDX metal map; d) SEM micrograph of the
edge of the pellet of JM007 after catalytic test with JetA-1 fuel and EDX metal map.
i n t e rn a t i o n a l j o u r n a l o f h y d r o g e n en e r g y 3 6 ( 2 0 1 1 ) 5 9 7 2e5 9 8 25976
Analysing the results reported in Fig. 3d of the spent JM007
after being tested for Jet A-1 dehydrogenation at 350 �C and
0.5 MPa, it is possible to observe the same Pt and Sn distri-
bution as in the fresh sample, although the aggregates
increase both in terms of number and dimension, mainly near
to the pellet edge. EDS analysis on the aggregates observed
after the catalytic test (see Fig. 3d) reveals the presence of both
Pt and Sn, probably forming an alloy, as detected by XRD. This
effect could be due to a migration of Sn towards the surface of
Pt particles during the catalytic tests. As reported by Lieske
et al. [39], formation of PteSn alloy on g-Al2O3 depends only on
Sn concentration and not that of Pt(0), thus these PteSn
aggregates are present only near to the surface of the pellet
where Sn is presents in large amount. Pt(0) catalyses the
reduction of SnO to Sn(0), also stabilising it as an alloy.
The morphological properties of the metal particles in the
fresh and spent catalysts were investigated by TEM. Repre-
sentative TEM micrographs of the fresh JM004 and JM007

Fig. 4 e TEM micrographs of: a) JM004 fresh, b) JM004 spent (tested under Jet A-1), c) JM004 spent (tested under SFK Jet A-1),
d) JM007 fresh, e) JM007 spent (tested under Jet A-1), f) JM007 spent (tested under SFK Jet A-1).
i n t e r n a t i o n a l j o u r n a l o f h y d r o g e n en e r g y 3 6 ( 2 0 1 1 ) 5 9 7 2e5 9 8 2 5977
samples, as well as the corresponding spent samples after
testing at 350 �C at 0.5 MPa feeding Jet A-1 or desulfurised
kerosene Jet A-1 fuels, are shown in Fig. 4. For the fresh JM004
sample (Fig. 4a), the metal particles are homogeneously
dispersed,with adiameter of ca. 2 nm.TheTEM imageof JM004
after the testwith Jet A-1 fuel (Fig. 4b), shows that the particles,
isothermalA
Int.
(a.u
.)
a
T (°C)
b
c
100 200 300 400 500 500 500
Fig. 5 e TPR and TPO profiles A: H2-TPR of a) fresh JM004, b) fresh
of a) fresh JM004, b) fresh JM007, c) 1%Pt//g-Al2O3.
while still homogeneously dispersed, have ripened to a diam-
eter of ca. 4 nm. After the tests with SFK Jet A-1, even more
significant growth of the metal particles was observed, with
formation of bigger clusters of size between 4 and 12 nm
(Fig. 4c). In contrast, the calculated mean particle size of the
JM007 fresh (Fig. 4d) and spent (Fig. 4e, f) catalysts is little
isothermalB
Int.
(a.u
.)
a
100 200 300 400 500 500 500
T (°C)
c
b
JM007, c) 1%Pt/g-Al2O3; B: H2-TPR after previous O2-TPO run
isothermalA isothermalaBa
b
t. (a
.u.) 0
100 200 300 400 500 500 500100 200 300 400 500 500 500
t. (a
.u.)
a
b0
Int
T (°C)
Int
T (°C)
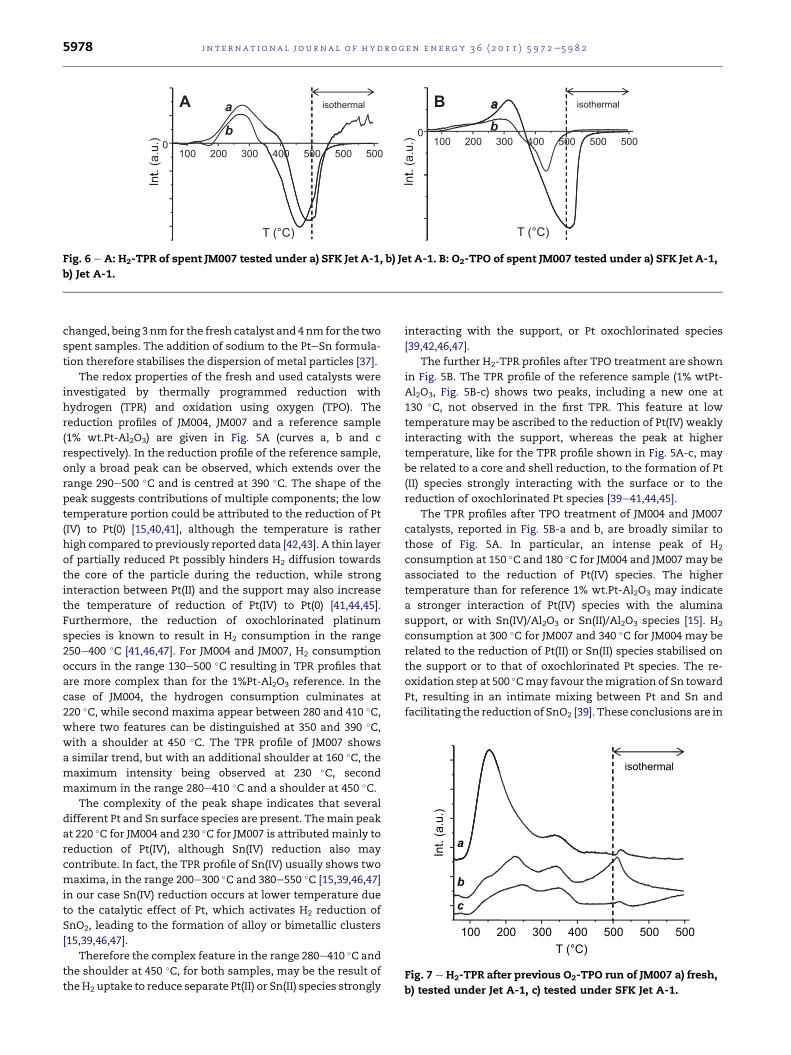
Fig. 6 e A: H2-TPR of spent JM007 tested under a) SFK Jet A-1, b) Jet A-1. B: O2-TPO of spent JM007 tested under a) SFK Jet A-1,
b) Jet A-1.
i h lsot erma
Int.
(a.u
.)
a
b
c
100 200 300 400 500 500 500T (°C)
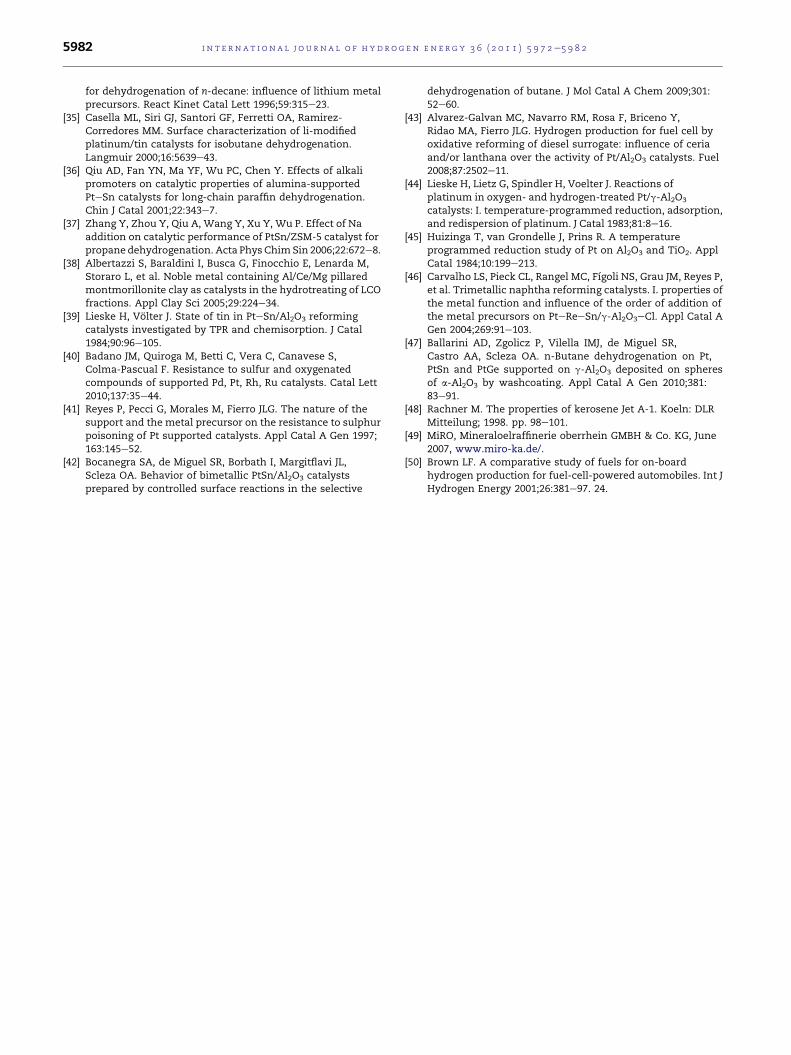
Fig. 7 e H2-TPR after previous O2-TPO run of JM007 a) fresh,
b) tested under Jet A-1, c) tested under SFK Jet A-1.
i n t e rn a t i o n a l j o u r n a l o f h y d r o g e n en e r g y 3 6 ( 2 0 1 1 ) 5 9 7 2e5 9 8 25978
changed, being 3 nm for the fresh catalyst and 4 nm for the two
spent samples. The addition of sodium to the PteSn formula-
tion therefore stabilises the dispersion of metal particles [37].
The redox properties of the fresh and used catalysts were
investigated by thermally programmed reduction with
hydrogen (TPR) and oxidation using oxygen (TPO). The
reduction profiles of JM004, JM007 and a reference sample
(1% wt.Pt-Al2O3) are given in Fig. 5A (curves a, b and c
respectively). In the reduction profile of the reference sample,
only a broad peak can be observed, which extends over the
range 290e500 �C and is centred at 390 �C. The shape of the
peak suggests contributions of multiple components; the low
temperature portion could be attributed to the reduction of Pt
(IV) to Pt(0) [15,40,41], although the temperature is rather
high compared to previously reported data [42,43]. A thin layer
of partially reduced Pt possibly hinders H2 diffusion towards
the core of the particle during the reduction, while strong
interaction between Pt(II) and the support may also increase
the temperature of reduction of Pt(IV) to Pt(0) [41,44,45].
Furthermore, the reduction of oxochlorinated platinum
species is known to result in H2 consumption in the range
250e400 �C [41,46,47]. For JM004 and JM007, H2 consumption
occurs in the range 130e500 �C resulting in TPR profiles that
are more complex than for the 1%Pt-Al2O3 reference. In the
case of JM004, the hydrogen consumption culminates at
220 �C, while second maxima appear between 280 and 410 �C,where two features can be distinguished at 350 and 390 �C,with a shoulder at 450 �C. The TPR profile of JM007 shows
a similar trend, but with an additional shoulder at 160 �C, themaximum intensity being observed at 230 �C, second
maximum in the range 280e410 �C and a shoulder at 450 �C.The complexity of the peak shape indicates that several
different Pt and Sn surface species are present. Themain peak
at 220 �C for JM004 and 230 �C for JM007 is attributedmainly to
reduction of Pt(IV), although Sn(IV) reduction also may
contribute. In fact, the TPR profile of Sn(IV) usually shows two
maxima, in the range 200e300 �C and 380e550 �C [15,39,46,47]
in our case Sn(IV) reduction occurs at lower temperature due
to the catalytic effect of Pt, which activates H2 reduction of
SnO2, leading to the formation of alloy or bimetallic clusters
[15,39,46,47].
Therefore the complex feature in the range 280e410 �C and
the shoulder at 450 �C, for both samples, may be the result of
theH2 uptake to reduce separate Pt(II) or Sn(II) species strongly
interacting with the support, or Pt oxochlorinated species
[39,42,46,47].
The further H2-TPR profiles after TPO treatment are shown
in Fig. 5B. The TPR profile of the reference sample (1% wtPt-
Al2O3, Fig. 5B-c) shows two peaks, including a new one at
130 �C, not observed in the first TPR. This feature at low
temperature may be ascribed to the reduction of Pt(IV) weakly
interacting with the support, whereas the peak at higher
temperature, like for the TPR profile shown in Fig. 5A-c, may
be related to a core and shell reduction, to the formation of Pt
(II) species strongly interacting with the surface or to the
reduction of oxochlorinated Pt species [39e41,44,45].
The TPR profiles after TPO treatment of JM004 and JM007
catalysts, reported in Fig. 5B-a and b, are broadly similar to
those of Fig. 5A. In particular, an intense peak of H2
consumption at 150 �C and 180 �C for JM004 and JM007may be
associated to the reduction of Pt(IV) species. The higher
temperature than for reference 1% wt.Pt-Al2O3 may indicate
a stronger interaction of Pt(IV) species with the alumina
support, or with Sn(IV)/Al2O3 or Sn(II)/Al2O3 species [15]. H2
consumption at 300 �C for JM007 and 340 �C for JM004 may be
related to the reduction of Pt(II) or Sn(II) species stabilised on
the support or to that of oxochlorinated Pt species. The re-
oxidation step at 500 �Cmay favour themigration of Sn toward
Pt, resulting in an intimate mixing between Pt and Sn and
facilitating the reduction of SnO2 [39]. These conclusions are in

Table
2e
Catalyticactivityresu
ltsofJM
004andJM
007forpartialdehydro
genationofJetA-1
andSFK
JetA-1
at350
� C,5bar.
H2pro
ductionrate
(NLH
2kg�1hr�
1)
Conv.to
H2(%
)Conv.to
Hc g
as(%
)CH4(%
of
HCgas)
C2(%
of
HCgas)
C3(%
of
HCgas)
C4(%
of
HCgas)
C5(%
of
HCgas)
C6(%
of
HCgas)
H2
purity
(%)
JM004
JetA-1
70.03
n.a
n.a
n.a
n.a
n.a
n.a
n.a
n.a
SFK
JetA-1
Day1
45
0.4
0.2
87.7
2.6
2.0
2.2
1.8
3.7
95.7
Day2
38
0.3
0.3
87.5
2.6
1.9
2.2
2.2
3.6
93.4
JM007
JetA-1
6.8
0.12
n.a
n.a
n.a
n.a
n.a
n.a
n.a
n.a
SFK
JetA-1
Day1
132
1.3
1.4
97.1
0.6
0.4
0.5
0.5
0.9
92.1
Day2
38
0.4
0.4
91.1
0.4
0.3
0.6
3.3
4.2
91.4
i n t e r n a t i o n a l j o u r n a l o f h y d r o g e n en e r g y 3 6 ( 2 0 1 1 ) 5 9 7 2e5 9 8 2 5979
agreement with the shift to lower temperature (300e340 �C) ofthe peaks noted at 350e450 �C in Fig. 5A, and are compatible
with the observations by SEM-EDS. It may be concluded from
the TPR results that the surface of fresh JM004 and JM007
samples comprises Pt(IV) andSn(IV) speciesweakly interacting
with the alumina support, Pt0 (confirmed by XRD), PteSn alloy
particles or bimetallic clusters, Pt(II) and Sn(II) species strongly
stabilised at the support surface, and oxochlorinated Pt
species, according to the literature [15,39,41,46,47].
The used catalysts were imbibed by the jet fuel from the
catalytic tests, since no cleaning step was used before TPR
analysis. A negative peak is observed at around 460 �C for
JM007 both after the test with Jet A-1 fuel (Fig. 6A-b) and with
SFK Jet A-1 fuel (Fig. 6A-a), due to H2 production by dehydro-
genation of adsorbed fuel on the catalyst. In the oxidation step
(Fig. 6B), a negative peak is observed due to CO and CO2
production by combustion of both adsorbed jet-fuel and coke.
Fig. 7 shows the H2-TPR profiles after oxidation of the spent
JM007 samples tested with Jet A-1 (Fig. 7b) and SFK Jet A-1 fuel
(Fig. 7c) compared to the fresh JM007 sample (Fig. 7a). In all
cases, the intensity of the peak at 150 �C related to Pt reduction
strongly decreases, probably due either to a not sufficient
concentration of O2 to burn adsorbed jet fuel and re-oxidize all
the Pt, or to an increase of Pt particle size as observed by SEM,
such that the surface metal area decreases and the core of the
particle becomes more difficult to reduce. Finally, the peak of
reduction of Sn is absent, probably due to the sintering of the
particles or formation of Pt/Sn alloy or cluster, as observed by
SEM-EDS and XRD.
3.2. Catalytic activity tests
The results of the preliminary catalytic activity tests con-
ducted with JM004 and JM007 at 0.5 MPa at 350 �C on Jet A-1
and SFK Jet A-1 kerosene for 48 h (shutting down and starting
up the reactor overnight) are summarised in Table 2; an
average molecular formula C12H26 for Jet A-1 was used in
calculations [48e50]. On this basis the kerosene conversion to
H2 was calculated using Eq. (1):
Fig. 8 e H2 production rate versus time of stream. JM004
(full symbol), JM007 (open symbol). Reaction condition:
350 �C, 5 bar SFK.

Table 3 e Fuel properties of fresh and partially dehydrogenated SFK Jet A-1 kerosene.
Property Units ASTM Method Fresh KeroseneJet A-1
TOTAL (France)
Dehydro-KeroseneJet A-1 BayernOil (Germany)
ASTM D1655-07
Acidity mg KOH/g D3242 0.001 0.002 0.10 (max)
Aromatics Vol % D1319 15.6 20.1 25 (max)
Final Boiling Point �C D86 252.5 248.7 340 (max)
Flash point �C D56/D3828 41.5 51.5 38 (min)
Density (@15 �C) Kg/m3 D1298/D4052 788.1 805.7 775 to 840 (max)
Freezing point �C D5972/D7153/
D7154/D2386
�58.6 �59 �47 (max)
Viscosity (@ �20 �C) mm2/s D445 2.873 3.821 8.0 (max)
Net Heat of Combustion MJ/kg D4529/D3338/
D4809
43.356 43.15 42.8 (min)
Naphtalenes Vol % D1840 0.3 0.5 3.0 (max)
Filter Pressure Drop mmHg D3241 0 0 25 (max)
Visual method D3241 No peacock or
abnormal
color deposits
No peacock
or abnormal
color deposits
No peacock
or abnormal
color deposits
i n t e rn a t i o n a l j o u r n a l o f h y d r o g e n en e r g y 3 6 ( 2 0 1 1 ) 5 9 7 2e5 9 8 25980
Conversion to H2 ð%Þ ¼ n H2outn H2in
� 100 (1)
The type of kerosene fed to the catalyst strongly affects
the amount of H2 produced during the first 8 h. With Jet A-1
kerosene the H2 production rate does not exceed
7 NL kgcat�1 h�1, which corresponds to 0.1e0.3% of conver-
sion of the reactant mixture to H2. The H2 production rate
with SFK Jet A-1 kerosene is 45 NL kgcat�1 h�1 over JM004
catalyst and 132 NL kgcat�1 h�1 over the JM007 catalyst, cor-
responding to 0.4% and 1.3% of conversion of SFK Jet A-1
kerosene to H2 for JM004 and JM007 respectively. Fig. 8 shows
the trends of the production rate versus time on stream for
JM004 and JM007; the S-content in Jet A-1 kerosene affects the
H2 production rate. In particular, it is reasonable to conclude
that fast deactivation of the surface active sites of both JM004
and JM007 catalysts is due to the poisoning by the S present
in the Jet A-1 kerosene stream. The presence of sodium in
JM007 has a positive effect on the catalyst performance in
terms of H2 production during the first day of test, both due
to its influence on the catalyst acidity or by avoiding metal
particle sintering. Despite this, the activity is lower on the
second day, with H2 production of 38 NL kgcat�1 h�1 for both
JM007 and JM004.
The formation of light hydrocarbons (from C1 to C6) is
evidence of the occurrence of undesired side reactions, like
cracking. C1eC6 compounds remain rather low when feeding
SFK Jet A-1 kerosene: about 1.4% with JM007 and 0.2% with
JM004 during the first day, falling to 0.3% and 0.4% respectively
on the second day. According to Table 2, CH4 is the most
abundant light hydrocarbon in the outlet stream, 87e88% of
the total volume using JM004 (97%with JM007 on day one) and
91% on the second day of test. The production of C2eC4
hydrocarbons is four times higher using JM004 than JM007
catalyst, without any particular change with time on stream.
These results indicate that H2 production follows a similar
trend to the conversion to gaseous hydrocarbons (while the
production of C5, C6 hydrocarbons tends to decrease),
indicating that also cracking reactions contribute to H2
production. The extent of cracking reactions on JM004 seems
to be lower than on JM007 during the first day of test. The
occurrence of cracking reactions results in a decrease of H2
purity which is 92% when the H2 production rate reaches its
maximum of 132 NL kgcat�1 h�1.
These preliminary results do not allow any discrimination
between cracking and dehydrogenation reactions. Multiple
factors may contribute to the loss of activity of JM007,
including catalyst deactivation by coke deposition or decrease
in metal dispersion on the surface. The formation of larger
metal clusters results in a drop in active area giving a lower
catalytic activity as a consequence. One target of this work
was to recover a dehydrogenated fuel still having the same
fuel properties of the reactant blend fuel; thus a character-
isation of the blend condensed at the outlet (Table 3) is
reported, showing that its composition still lies within the
limits of the ASTM D1655-07 specifications.
4. Conclusions
The PteSn catalysts 5% wt.Pt-1% wt.Sn/g-Al2O3 and 5% wt.Pt-
1% wt.Sn-1%Na/g-Al2O3 prepared by successive impregna-
tions of themetal salts on g-alumina pellets have a gradient of
active metals from the edge to centre due to different diffu-
sion properties. Pt0 is present in highest concentration in the
external part of the pellet, while SnO2 is present only at
external part of the pellet. Thesematerials are active catalysts
for the partial dehydrogenation of Jet A-1 (300 ppm S) and
desulfurised (3 ppm S) Jet A-1 fuel, although the catalysts are
not thio-tolerant and H2 production decreases rapidly with
time on stream. A catalyst co-impregnated with sodium
nitrate gave the highest andmost sustainedH2 generation, the
presence of sodium inhibiting the metal particle aggregation
and/or decreasing the acidity of the catalyst surface.
Furthermore, the condensed liquid at the exit stream retains
the useful characteristics of Jet A-1. Coking and sulfur

i n t e r n a t i o n a l j o u r n a l o f h y d r o g e n en e r g y 3 6 ( 2 0 1 1 ) 5 9 7 2e5 9 8 2 5981
poisoning appear themaindrawbacks to overcome for a future
improvement of catalyst activity and stability in the on-board
H2 production by partial dehydrogenation of jet-fuels.
Acknowledgement
This work was performed as part of the GreenAir project, EC
contract number 233862. The authors thank Erich Erdle for
enlightening discussions and his contributions to this work.
r e f e r e n c e s
[1] Satyapal S, Petrovic J, Read C, Thomas G, Ordaz G. The U.S.department of energy’s national hydrogen storage project:progress towards meeting hydrogen-powered vehiclerequirements. Catal Today 2007;120:246e56.
[2] Ross DK. Hydrogen storage: the major technological barrierto the development of hydrogen fuel cell cars. Vacuum 2006;80:084e1089.
[3] Aardahl CL, Rassat SD. Overview of systems considerationsfor on-board chemical hydrogen storage. Int J HydrogenEnergy 2009;34:6676e83.
[4] Hellman HL, Van den Hoed R. Characterising fuel celltechnology: challenges of the commercialisation process. IntJ Hydrogen Energy 2007;32:305e15.
[5] Chalk SG, Miller JF. Key challenges and recent progress inbatteries, fuel cells, and hydrogen storage for clean energysystems. J Power Sources 2006;159:73e80.
[6] Biniwale RB, Rayalu S, Devotta S, Ichikawa M. Chemicalhydrides: a solution to high capacity hydrogen storage andsupply. Int J Hydrogen Energy 2008;33:360e5.
[7] Elena D. An overview of advanced materials for hydrogenstorage. J Mat Process Technol 2005;162-163:169e77.
[8] Sakintuna B, Lamari-Darkrim F, Hirscher M. Metal hydridematerials for solid hydrogen storage: a review. Int J HydrogenEnergy 2007;32:1121e40.
[9] Lazaro MP, Garcia-Bordeje E, Sebastian D, Lazaro MJ,Moliner R. In situ hydrogen generation from cycloalkanesusing a Pt/CNF catalyst. Catal Today 2008;138:203e9.
[10] Okada Y, Sasaki E, Watanabe E, Hyodo S, Nishijima H.Development of dehydrogenation catalyst for hydrogengeneration in organic chemical hydride method. Int JHydrogen Energy 2006;31:1348e56.
[11] Saito Y, Aramaki K, Hodoshima S, SaitoM, ShonoA, Kuwano J,et al. Efficient hydrogen generation from organic chemicalhydrides byusing catalytic reactor on the basis of superheatedliquid-film concept. Chem Eng Sci 2008;63:4935e41.
[12] Hodoshima S, Takaiwa S, Shono A, Satoh K, Saito Y.Hydrogen storage by decalin/naphthalene pair and hydrogensupply to fuel cells by use of superheated liquid-film-typecatalysis. Appl Catal A Gen 2005;283:235e42.
[13] Rahimpour MR. Enhancement of hydrogen production ina novel fluidized-bed membrane reactor for naphthareforming. Int J Hydrogen Energy 2009;34:2235e51.
[14] Wang B, Froment GF, Wayne Goodman D. CO-free hydrogenproduction via dehydrogenation of a Jet A hydrocarbonmixture. J Catal 2008;253:239e43.
[15] He S, Sun C, Bai Z, Dai X, Wang B. Dehydrogenation of longchain paraffins over supported PteSneK/Al2O3 catalysts:a study of the alumina support effect. Appl Catal A Gen 2009;356:88e98.
[16] Hodoshima S, Hiroshi A, Yasukazu S. Liquid-film-typecatalytic decalin dehydrogeno-aromatization for long-term
storage and long-distance transportation of hydrogen. Int JHydrogen Energy 2003;28:197e204.
[17] Kariya N, Fukuoka A, Ichikawa M. Efficient evolution ofhydrogen from liquid cycloalkanes over Pt-containingcatalysts supported on active carbons under “wetedrymultiphase conditions”. Appl Catal A Gen 2002;233:91e102.
[18] HodoshimaS,NagataH,Yasukazu S. Efficient hydrogen supplyfrom tetralin with superheated liquid-film-type catalysis foroperating fuel cells. Appl Catal A Gen 2005;292:90e6.
[19] Biniwale RB, Kariya N, Ichikawa M. Dehydrogenation ofcyclohexane over Ni based catalysts supported on activatedcarbon using spray-pulsed reactor and enhancement inactivity by addition of a small amount of Pt. Catal Lett 2005;105:83e7.
[20] Kariya N, Fukuoka A, Utagawa T, Sakuramoto M, Goto Y,Ichikawa M. Efficient hydrogen production usingcyclohexane and decalin by pulse-spray mode reactor withPt catalysts. Appl Catal A Gen 2003;247:247e59.
[21] Yolcular S, Olgun O. Ni/Al2O3 catalysts and their activity indehydrogenation of methylcyclohexane for hydrogenproduction. Catal Today 2008;138:198e202.
[22] Sebastian D, Bordeje EG, Calvillo L, Lazaro MJ, Moliner R.Hydrogen storage by decalin dehydrogenation/naphthalene hydrogenation pair over platinum catalystssupported on activated carbon. Int J Hydrogen Energy2008;33:1329e34.
[23] Wang Y, Shah N, Huggins FE, Huffman GP. Hydrogenproduction by catalytic dehydrogenation of tetralin anddecalin over stacked cone carbon nanotube-supported Ptcatalysts. Energy Fuels 2006;20:2612e5.
[24] Akamatsu K, Ohta Y, Sugawara T, Hattori T, Nakao S.Production of hydrogen by dehydrogenation of cyclohexanein high-pressure (1�8 atm) membrane reactors usingamorphous silica membranes with controlled pore sizes. IndEng Chem Res 2008;47:9842e7.
[25] Dung Tien P, Satoh T, Miura M, Nomura M. Continuoushydrogen evolution from cyclohexanes over platinumcatalysts supported on activated carbon fibers. Fuel ProcessTechnol 2008;89:415e8.
[26] Li P, Huang Y, Chen D, Zhu J, Zhao T, Zhou X. CNFs-supported Pt catalyst for hydrogen evolution from decalin.Catal Comm 2009;10:815e8.
[27] Park YK, Ribeiro FH, Somorjai GA. The effect of potassiumandtin on the hydrogenation of ethylene and dehydrogenation ofcyclohexane over Pt(111). J Catal 1998;178:66e75.
[28] Gonzalez-Marcos MP, Inarra B, Guil JM, Gutierrez-Ortiz MA.Development of an industrial characterisation method fornaphtha reforming bimetallic Pt-Sn/Al2O3 catalysts throughn-heptane reforming test reactions. Catal Today 2005;107e108:685e92.
[29] Gonzalez-Marcos MP, Inarra B, Guil JM, Gutierrez-Ortiz MA.Use of test reactions for the characterisation of bimetallicPteSn/Al2O3 catalysts. Appl Catal A 2004;273:259e68.
[30] Passos FB, Aranda DAG, Schmal M. Characterization andcatalytic activity of bimetallic PteIn/Al2O3and PteSn/Al2O3Catalysts. J Catal 1998;178:478e88.
[31] Praserthdam P, Choungchaisukasam P, Assabumrungrat S,Mongkhonsi T. Role of Sn and K on hydrogen spillover on Pt/g-Al2O3 catalyst. J Chin Inst Chem Eng 2001;32:143e9.
[32] Wang L, Lin L, Zang T, Cai H. Enhancement of Pt�Sn/Al2O3
catalyst stability for butane dehydrogenation bymodification with Sn and Li. React Kinet Catal Lett 1994;52:107e11.
[33] Cortright RD, Dumesic JA. Effects of potassium on silica-supported Pt and Pt/Sn catalysts for isobutanedehydrogenation. J Catal 1995;157:576e83.
[34] Gokak DT, Basrur AG, Rajeswar D, Rao GS,Krishnamurthy KR. Lithium promoted Pt�Sn/Al2O3 catalysts
i n t e rn a t i o n a l j o u r n a l o f h y d r o g e n en e r g y 3 6 ( 2 0 1 1 ) 5 9 7 2e5 9 8 25982
for dehydrogenation of n-decane: influence of lithium metalprecursors. React Kinet Catal Lett 1996;59:315e23.
[35] Casella ML, Siri GJ, Santori GF, Ferretti OA, Ramirez-Corredores MM. Surface characterization of li-modifiedplatinum/tin catalysts for isobutane dehydrogenation.Langmuir 2000;16:5639e43.
[36] Qiu AD, Fan YN, Ma YF, Wu PC, Chen Y. Effects of alkalipromoters on catalytic properties of alumina-supportedPteSn catalysts for long-chain paraffin dehydrogenation.Chin J Catal 2001;22:343e7.
[37] Zhang Y, Zhou Y, Qiu A, Wang Y, Xu Y, Wu P. Effect of Naaddition on catalytic performance of PtSn/ZSM-5 catalyst forpropane dehydrogenation. Acta Phys ChimSin 2006;22:672e8.
[38] Albertazzi S, Baraldini I, Busca G, Finocchio E, Lenarda M,Storaro L, et al. Noble metal containing Al/Ce/Mg pillaredmontmorillonite clay as catalysts in the hydrotreating of LCOfractions. Appl Clay Sci 2005;29:224e34.
[39] Lieske H, Volter J. State of tin in PteSn/Al2O3 reformingcatalysts investigated by TPR and chemisorption. J Catal1984;90:96e105.
[40] Badano JM, Quiroga M, Betti C, Vera C, Canavese S,Colma-Pascual F. Resistance to sulfur and oxygenatedcompounds of supported Pd, Pt, Rh, Ru catalysts. Catal Lett2010;137:35e44.
[41] Reyes P, Pecci G, Morales M, Fierro JLG. The nature of thesupport and the metal precursor on the resistance to sulphurpoisoning of Pt supported catalysts. Appl Catal A Gen 1997;163:145e52.
[42] Bocanegra SA, de Miguel SR, Borbath I, Margitflavi JL,Scleza OA. Behavior of bimetallic PtSn/Al2O3 catalystsprepared by controlled surface reactions in the selective
dehydrogenation of butane. J Mol Catal A Chem 2009;301:52e60.
[43] Alvarez-Galvan MC, Navarro RM, Rosa F, Briceno Y,Ridao MA, Fierro JLG. Hydrogen production for fuel cell byoxidative reforming of diesel surrogate: influence of ceriaand/or lanthana over the activity of Pt/Al2O3 catalysts. Fuel2008;87:2502e11.
[44] Lieske H, Lietz G, Spindler H, Voelter J. Reactions ofplatinum in oxygen- and hydrogen-treated Pt/g-Al2O3
catalysts: I. temperature-programmed reduction, adsorption,and redispersion of platinum. J Catal 1983;81:8e16.
[45] Huizinga T, van Grondelle J, Prins R. A temperatureprogrammed reduction study of Pt on Al2O3 and TiO2. ApplCatal 1984;10:199e213.
[46] Carvalho LS, Pieck CL, Rangel MC, Fıgoli NS, Grau JM, Reyes P,et al. Trimetallic naphtha reforming catalysts. I. properties ofthe metal function and influence of the order of addition ofthe metal precursors on PteReeSn/g-Al2O3eCl. Appl Catal AGen 2004;269:91e103.
[47] Ballarini AD, Zgolicz P, Vilella IMJ, de Miguel SR,Castro AA, Scleza OA. n-Butane dehydrogenation on Pt,PtSn and PtGe supported on g-Al2O3 deposited on spheresof a-Al2O3 by washcoating. Appl Catal A Gen 2010;381:83e91.
[48] Rachner M. The properties of kerosene Jet A-1. Koeln: DLRMitteilung; 1998. pp. 98e101.
[49] MiRO, Mineraloelraffinerie oberrhein GMBH & Co. KG, June2007, www.miro-ka.de/.
[50] Brown LF. A comparative study of fuels for on-boardhydrogen production for fuel-cell-powered automobiles. Int JHydrogen Energy 2001;26:381e97. 24.