pkp cargo group 2016raportroczny2016.pkpcargo.com/sites/pkpcargo16ar/files/attachments/... ·...
TRANSCRIPT

© Copyright PKP CARGO S.A.
PKP CARGO GROUP 2016
1
© Copyright PKP CARGO S.A.
AGENDA
‖ Recap of the annual results
‖ Key achievements in 2016
‖ Commercial results
‖ Financial results
‖ Outlook for 2017

© Copyright PKP CARGO S.A.
PLN 4,437 millionPLN 4,411 million
MARKET SHARE CAPEXEBITDA
NET PROFITREVENUES OPEX
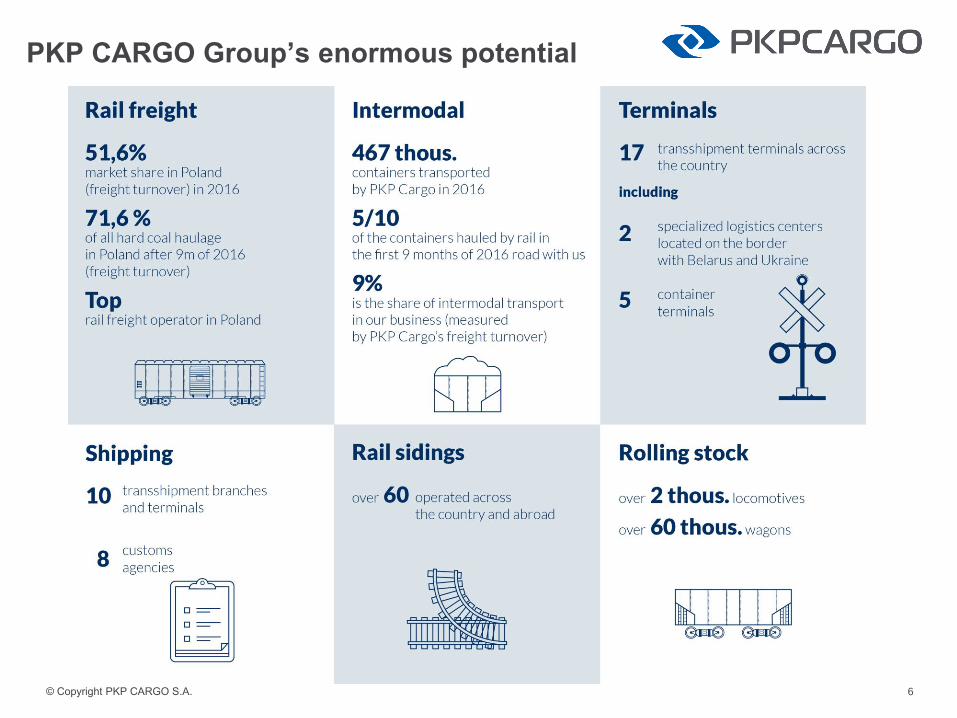
51.6% PLN 533 million
✓✓ ✓
Q4
Q4
12M
12M
52.0% PLN 101 million
PLN 1,197 million PLN 1,133 millionPLN 75
million
PLN 216 millionprofitability of 18.0%
PLN - 41
million
PLN 562 millionprofitability of 12.7%
PKP CARGO Group’s 2016 results*
3
* Adjusted in accordance with item 5.2.1 of the Management Board’s Report on the Activity of the PKP CARGO Group for the financial year 2016 and chapter 5.1.1 of Other Information to the Consolidated Quarterly
Report for Q3 2016, calculated as the difference between adjusted figures for 2016 and adjusted figures for the first 3 quarters of 2016.
measured by freight turnover (-3.6 p.p.
yoy)
measured by freight turnover (-4.2 p.p.
yoy)

© Copyright PKP CARGO S.A.
AGENDA
‖ Recap of the annual results
‖ Key achievements in 2016
‖ Commercial results
‖ Financial results
‖ Outlook for 2017

© Copyright PKP CARGO S.A.
Major achievements of 2016
5
© Copyright PKP CARGO S.A.
PKP CARGO Group’s enormous potential
6

© Copyright PKP CARGO S.A.
Cooperation
with Chinese
partners
Main streams for
container transport in
the CEE
Location of
conventional
terminals
Location of
intermodal terminals
Pol-Rail
JV with Trenitalia
Cooperation
with Swedish
partners
Leveraging the potential
for modernizing the key
transport corridors
The AWT Group offers
rail transport in the
Czech Republic, Slovakia
and Hungary
New Silk Road Partner
Transport offer on the
Apennine peninsula
Logistics services using
ferries
Rail transport provided
by the PKP CARGO
Group in 9 EU member
states
PKP CARGO
CONNECT GmbH
AWT rail
carriers
7
PKP CARGO Group’s international potential
in international transport services
in the transport corridor network
Operational and border
cooperation with
eastern railways
Shipper dedicated
to international
cooperation
PKP CARGO CONNECT
Network of intermodal
and conventional
terminals

© Copyright PKP CARGO S.A.8
Steady development of collaboration with China
Fruitful development of collaboration
with ChinaMix of launched connectionsfreight turnover data for 2016
19%
22%
9% 13%
1%
33%
3%
Suzhou – Warszawa Praga
Chengdu – Łódź Olechów
Zhengzhou – Hamburg Billwerder
Zhengzhou/Erlian – Hamburg Waltershof
Zhengzhou – Pardubice
Zhengzhou/Chongqing/Tuanjiecun –Rheinhausen
Tuanjiecun –Wanne Eickel (Herne)
+34% trains
+132% UTI
2016 data change yoy
© Copyright PKP CARGO S.A.
AGENDA
‖ Recap of the annual results
‖ Key achievements in 2016
‖ Commercial results
‖ Financial results
‖ Outlook for 2017

© Copyright PKP CARGO S.A.
PKP CARGO Group’s position
PKP CARGO Group’s freight transportfreight turnover data for 2016, billion tkm
including AWT:
1.6
29,8 28,5
2015 2016
-4%
10
including AWT*:
1.1
* Data concerning AWT’s freight turnover starting from the acquisition date (commencement of consolidation)
PKP CARGO Group’s share of the Polish marketmonthly freight turnover data for 2016
PKP CARGO Group’s share of the Polish marketfreight turnover data for 2016
51,6%
10,2%
6,6%
5,9%
25,7%
PKP CARGO Group
Lotos Kolej
PKP LHS
CTL Group
Other operators
52,1% 50,2% 51,9% 52,0%
Q1 2016 Q2 2016 Q3 2016 Q4 2016
PKP CARGO Group’s share of the Polish marketmonthly freight volume data for 2016
+1.8 p.p.
44,3% 43,2% 44,1% 45,0%
Q1 2016 Q2 2016 Q3 2016 Q4 2016
+1.8 p.p.
© Copyright PKP CARGO S.A. 11
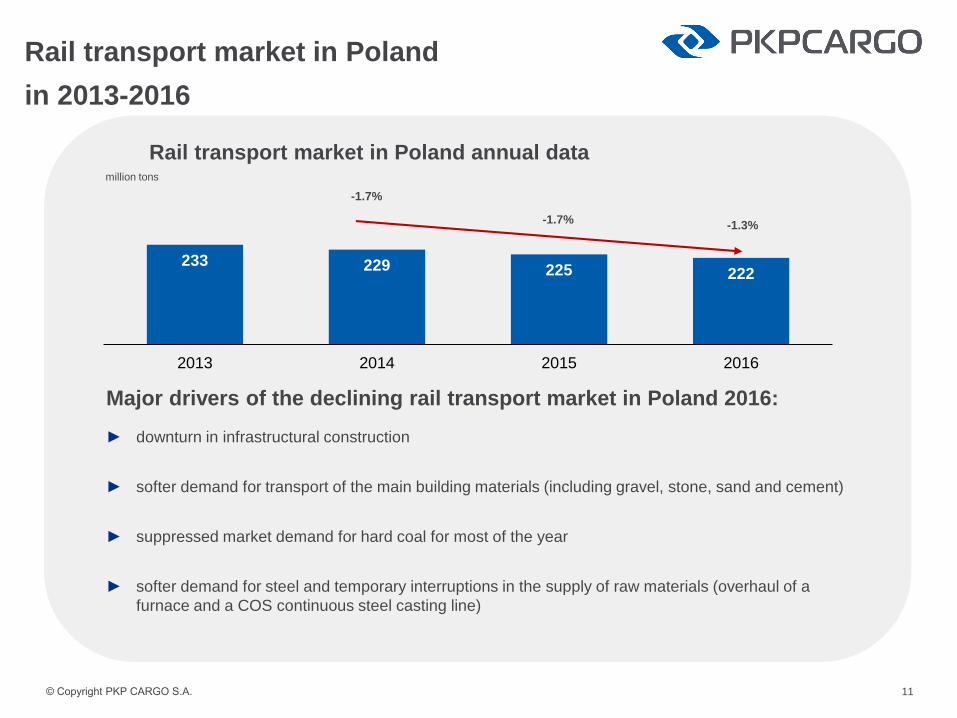
Rail transport market in Poland
in 2013-2016
► downturn in infrastructural construction
► softer demand for transport of the main building materials (including gravel, stone, sand and cement)
► suppressed market demand for hard coal for most of the year
► softer demand for steel and temporary interruptions in the supply of raw materials (overhaul of a
furnace and a COS continuous steel casting line)
million tons
-1.7%
-1.7%-1.3%
233 229 225 222
2013 2014 2015 2016
Rail transport market in Poland annual data
Major drivers of the declining rail transport market in Poland 2016:
© Copyright PKP CARGO S.A.
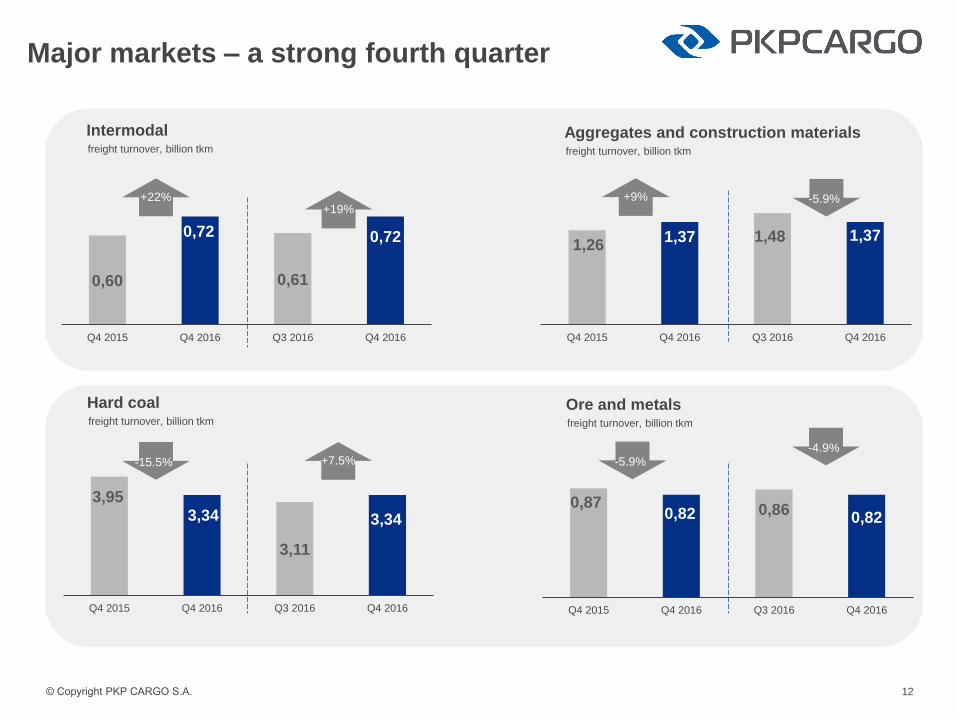
Major markets – a strong fourth quarter
12
freight turnover, billion tkm
Aggregates and construction materials
freight turnover, billion tkm
Ore and metals
0,870,82 0,86
0,82
Q4 2015 Q4 2016 Q3 2016 Q4 2016
freight turnover, billion tkm
Intermodal
0,60
0,72
0,61
0,72
Q4 2015 Q4 2016 Q3 2016 Q4 2016
1,261,37 1,48 1,37
Q4 2015 Q4 2016 Q3 2016 Q4 2016
+9%
-5.9%
+22%
freight turnover, billion tkm
Hard coal
3,953,34
3,11
3,34
Q4 2015 Q4 2016 Q3 2016 Q4 2016
-15.5%
+19%-5.9%
+7.5%-4.9%

© Copyright PKP CARGO S.A.
Hard coal
Key events in 2016
► Hard coal production in 2016 shrank by 2.6% yoy
► Restructuring in the mining sector
► Instability of coal prices on global markets over the year. Coal price
growth not observed until Q4 2016
► In H1 2016, coal exports to EU members states fell by 3.2% yoy
► Diminished hard coal imports
► Unfavorable weather conditions – light winter in 2015 / 2016
PKP CARGO Group’s freight turnover mix in Polandby types of transportation (freight turnover) in 2016
68%18%
13%
1%
Domestic freight
Exports
Imports
Transit
freight turnover, billion tkm
Hard coal
12,3911,07
2015 2016
-11%
including AWT:
0.37
13
Main directions of transportHard coal in 2016
including AWT*:
0.37
* Data concerning AWT’s freight turnover starting from the acquisition date (commencement of consolidation)
© Copyright PKP CARGO S.A.
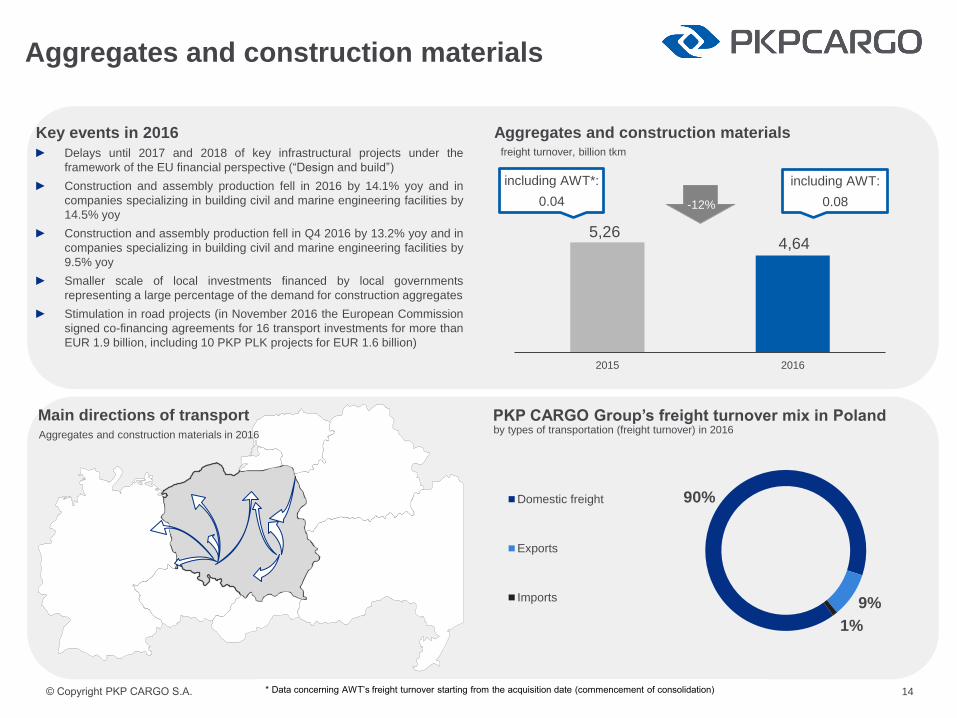
Aggregates and construction materials
Key events in 2016
► Delays until 2017 and 2018 of key infrastructural projects under the
framework of the EU financial perspective (“Design and build”)
► Construction and assembly production fell in 2016 by 14.1% yoy and in
companies specializing in building civil and marine engineering facilities by
14.5% yoy
► Construction and assembly production fell in Q4 2016 by 13.2% yoy and in
companies specializing in building civil and marine engineering facilities by
9.5% yoy
► Smaller scale of local investments financed by local governments
representing a large percentage of the demand for construction aggregates
► Stimulation in road projects (in November 2016 the European Commission
signed co-financing agreements for 16 transport investments for more than
EUR 1.9 billion, including 10 PKP PLK projects for EUR 1.6 billion)
90%
9%
1%
Domestic freight
Exports
Imports
freight turnover, billion tkm
Aggregates and construction materials
5,264,64
2015 2016
including AWT:
0.08-12%
14
Main directions of transportAggregates and construction materials in 2016
including AWT*:
0.04
* Data concerning AWT’s freight turnover starting from the acquisition date (commencement of consolidation)
PKP CARGO Group’s freight turnover mix in Polandby types of transportation (freight turnover) in 2016

© Copyright PKP CARGO S.A.
Ore and metals
Key events in 2016
► Steel production fell (in 2016, steel production was 8.9 million
tons, that is 2.8% yoy less)
► Import duties on steel products imported by the EU from China
and Russia
► Iron ore prices spiked up by 101% yoy in 2016 and 41% in Q4
2016
► In 2016 the metal industry’s sold production trended up (0.5%
yoy) as it did for the metal goods industry (8.8% yoy)
► Modernization of ArcelorMittal’s furnace
► Overhaul of COS in CMC Zawiercie
23%
14%
40%
23%
Domestic freight
Exports
Imports
Transit
Ore and metalsfreight turnover, billion tkm
3,71 3,40
2015 2016
-8%
15
Main directions of transportOres and metals in 2016
including AWT:
0.07
including AWT*:
0.05
* Data concerning AWT’s freight turnover starting from the acquisition date (commencement of consolidation)
PKP CARGO Group’s freight turnover mix in Polandby types of transportation (freight turnover) in 2016

© Copyright PKP CARGO S.A.
Intermodal
Key events in 2016
► Rapid development of the New Silk Road. Transport by land to and from
China surged up in 2016 by 102% yoy measured by freight volume
► Higher container freight volume transshipped in Polish ports in 2016 by
9.3% yoy
► The volume of containers transported by PKP CARGO to and from Polish
ports in 2016 is up 7.7% yoy
► Rising transport outside Poland – in 2016 completed freight turnover rose
by 110% yoy
► Rising transport outside Poland – in 2016 completed freight volume of
containers rose by 76% yoy
► More connections from marine ports to terminals in Poznań, Warsaw,
Radomsko and Łódź
by types of transportation (freight turnover) in 2016
11%
32%
38%
19%
Domestic freight
Exports
Imports
Transit
2,032,47
2015 2016
+22%
Intermodalfreight turnover, billion tkm
16
Main directions of transportIntermodal in 2016
including AWT:
0.16
including AWT*:
0.10
* Data concerning AWT’s freight turnover starting from the acquisition date (commencement of consolidation)
PKP CARGO Group’s freight turnover mix in Poland
© Copyright PKP CARGO S.A.
AGENDAAGENDA
‖ Recap of the annual results
‖ Key achievements in 2016
‖ Commercial results
‖ Financial results
‖ Outlook for 2017

© Copyright PKP CARGO S.A.
Adjusted financial results*– costs under control
4 416 4 411
1 274 1 197
2015 2016 Q4 2015 Q4 2016
PLN million
Operating revenues
PLN million
Operating expenses
4,249 4,437
1,312 1,133
2015 2016 Q4 2015 Q4 2016
PLN million
EBITDA
637562
94216
2015 2016 Q4 2015 Q4 2016
PLN million
Net profit
94
-41 -52
75
2015 2016 Q4 2015 Q4 2016
18
-6%
-0.1%
-14%
+4%
-12%
+129%
* Adjusted in accordance with item 5.2.1 of the Management Board’s Report on the Activity of the PKP CARGO Group for the financial year 2016 and chapter 5.1.1 of Other Information to the Consolidated Quarterly
Report for Q3 2016, calculated as the difference between adjusted figures for 2016 and adjusted figures for the first 3 quarters of 2016.
© Copyright PKP CARGO S.A. 19
PKP CARGO
Group
2015*
PKP CARGO
Group
2016
PKP CARGO
Group
Change yoy
PKP CARGO
Group
Change in %
yoy
PLN millionAWT Group
2016**
AWT’s share
in the PKP
CARGO
Group
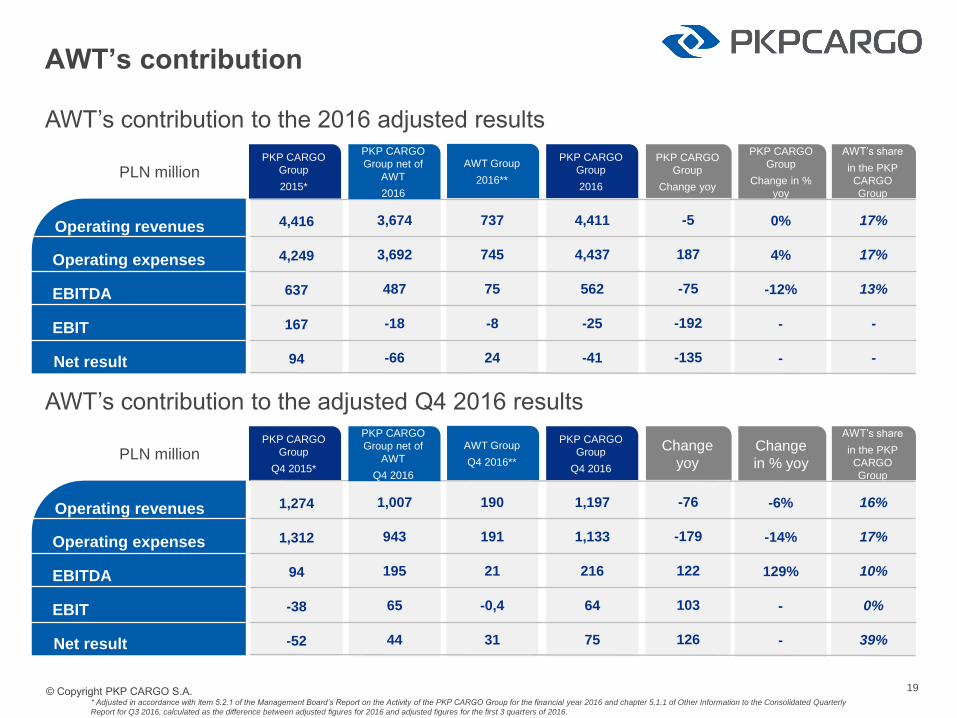
0%
4%
-12%
-
-
3,674
3,692
487
-18
-66
17%
17%
13%
-
-
737
745
75
-8
24
4,416
4,249
637
167
94
4,411
4,437
562
-25
-41
-5
187
-75
-192
-135
Operating revenues
EBITDA
Net result
EBIT
Operating expenses
PKP CARGO
Group net of
AWT
2016
AWT’s contribution to the 2016 adjusted results
* Adjusted in accordance with item 5.2.1 of the Management Board’s Report on the Activity of the PKP CARGO Group for the financial year 2016 and chapter 5.1.1 of Other Information to the Consolidated Quarterly
Report for Q3 2016, calculated as the difference between adjusted figures for 2016 and adjusted figures for the first 3 quarters of 2016.
AWT’s contribution
PKP CARGO
Group
Q4 2015*
PKP CARGO
Group
Q4 2016
Change
yoy
Change
in % yoyPLN million
AWT Group
Q4 2016**
AWT’s share
in the PKP
CARGO
Group
-6%
-14%
129%
-
-
1,007
943
195
65
44
16%
17%
10%
0%
39%
190
191
21
-0,4
31
1,274
1,312
94
-38
-52
1,197
1,133
216
64
75
-76
-179
122
103
126
Operating revenues
EBITDA
Net result
EBIT
Operating expenses
PKP CARGO
Group net of
AWT
Q4 2016
AWT’s contribution to the adjusted Q4 2016 results
© Copyright PKP CARGO S.A.
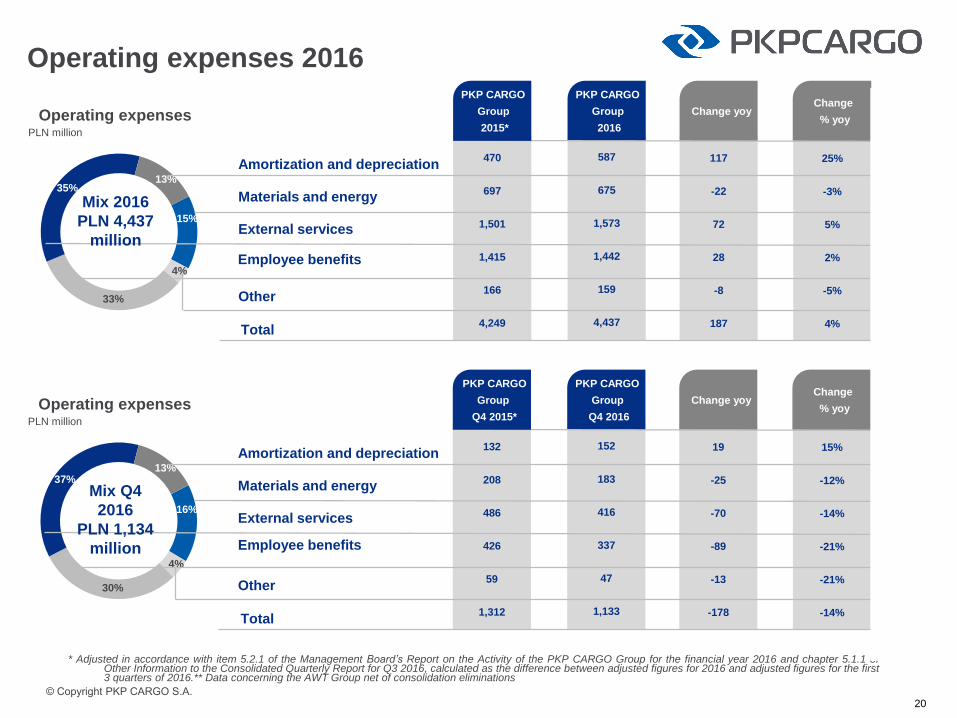
15%
4%
33%
35%13%
470
697
1,501
1,415
166
4,249
Operating expenses 2016
20
Operating expensesPLN million
587
675
1,573
1,442
159
4,437
PKP CARGO
Group
2016
25%
-3%
5%
2%
-5%
4%
Change
% yoy
117
-22
72
28
-8
187
Change yoy
Mix 2016
PLN 4,437
millionExternal services
Amortization and depreciation
Other
Employee benefits
Materials and energy
Total
PKP CARGO
Group
2015*
* Adjusted in accordance with item 5.2.1 of the Management Board’s Report on the Activity of the PKP CARGO Group for the financial year 2016 and chapter 5.1.1 ofOther Information to the Consolidated Quarterly Report for Q3 2016, calculated as the difference between adjusted figures for 2016 and adjusted figures for the first3 quarters of 2016.** Data concerning the AWT Group net of consolidation eliminations
16%
4%
30%
37%13%
132
208
486
426
59
1,312
Operating expensesPLN million
152
183
416
337
47
1,133
PKP CARGO
Group
Q4 2016
15%
-12%
-14%
-21%
-21%
-14%
Change
% yoy
19
-25
-70
-89
-13
-178
Change yoy
Mix Q4
2016
PLN 1,134
million
External services
Amortization and depreciation
Other
Employee benefits
Materials and energy
Total
PKP CARGO
Group
Q4 2015*

© Copyright PKP CARGO S.A.
4%
46%
4%
43%
3%
28
308
92
35
22
485
Capital expenditures 2016
21
Capital expendituresPLN million
19
231
244
20
19
533
PKP CARGO
Group
2016
-32%
-25%
165%
-42%
-15%
17%
Change
% yoy
-9
-77
152
-15
-3
48
Change yoy
Mix 2016
PLN 533
million
Purchase & modernization
of locomotives and wagons
Investment construction
Other
ICT development
Components in overhaul
Total
PKP CARGO
Group
2015*
10%
24%
11%45%
10%
16
55
14
13
11
109
Capital expendituresPLN million
11
46
25
10
10
102
PKP CARGO
Group
Q4 2016
-32%
-17%
76%
-28%
-7%
-7%
Change
% yoy
-5
-9
11
-4
-1
-8
Change yoy
Mix Q4
2016
PLN 102
million
Purchase & modernization
of locomotives and wagons
Investment construction
Other
ICT development
Components in overhaul
Total
PKP CARGO
Group
Q4 2015*

© Copyright PKP CARGO S.A.
Funding mix
Cash flows
PLN million
Indebtedness
22
Total indebtedness 1,130 1,792
Debt structure
Long-term
Short-term
1,415809
376321
PLN million
31.12.2015 31.12.2016
79%
21%
Long-term Short-term
PLN 1,792
million
Cash flows
388
-515
-29
380
-569
664
2015 2016
Operational
On investing activity
On financing activity
change
-8
-54
693
© Copyright PKP CARGO S.A.
AGENDA
‖ Recap of the annual results
‖ Key achievements in 2016
‖ Commercial results
‖ Financial results
‖ Outlook for 2017

© Copyright PKP CARGO S.A. 24/32
Outlook: key commercial areas
– challenges for PKP CARGO in 2017
Key
commercial
areas Execution of infrastructural investments
Expansion of the aggregates market by 5-10% per
annum until 2020
PLN 107 billion for infrastructural investments in
2014-2020
+1,770 km – road & motorway construction plan until
2020
Return to energy security based on hard coal
Closure of the Paskov and Łazy mines
Coal exports to the Czech Republic
In January 2017, 5.6 million tons of coal were mined
and 5.7 million tons of coal were sold
Development of Polish ports
Terminal network expansion
Oil price growth - competitiveness of road transport
EU regulations concerning charges for road transport
Robust market conditions in industry
17.8% steel production growth in January 2017
Repercussions of the customs duties implemented by the EU on imports of
steel and steel goods from China and Russia
Aggregates
and construction
materials
Coal
Intermodal
Ores
and metals

© Copyright PKP CARGO S.A. 25/32
Outlook: key growth areas 2017
New
Silk
RoadPreparing rolling
stock to intensify
freight transport
Specialized
transport
Transport
– Black Sea
– Adriatic Sea
– Baltic Sea
Extending the
logistics chain
Development
2017
Social
dialogue
© Copyright PKP CARGO S.A.
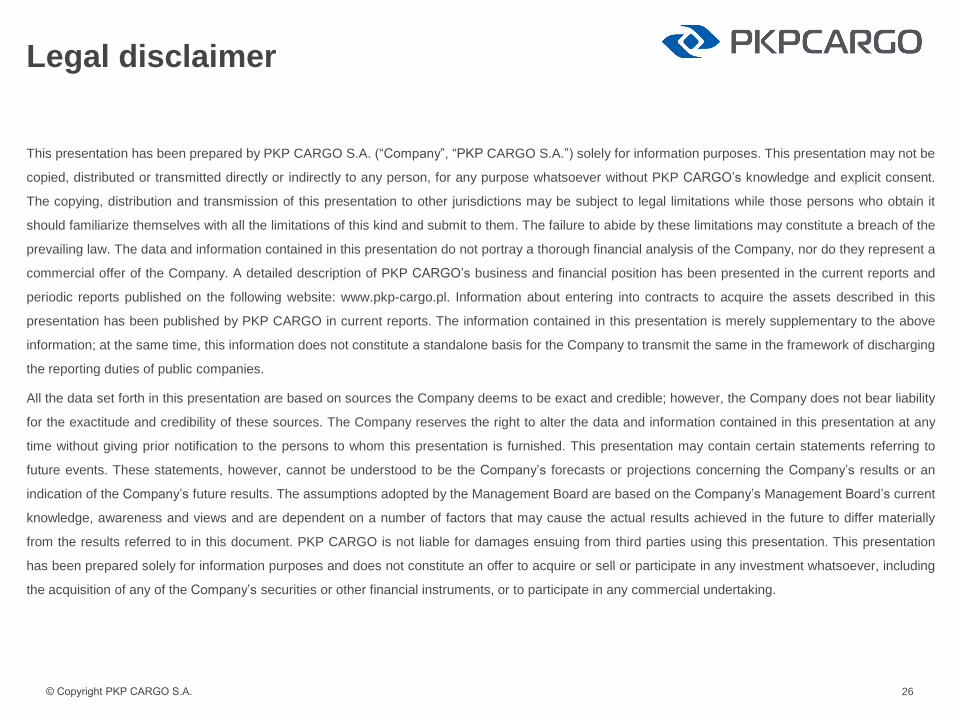
Legal disclaimer
This presentation has been prepared by PKP CARGO S.A. (“Company”, “PKP CARGO S.A.”) solely for information purposes. This presentation may not be
copied, distributed or transmitted directly or indirectly to any person, for any purpose whatsoever without PKP CARGO’s knowledge and explicit consent.
The copying, distribution and transmission of this presentation to other jurisdictions may be subject to legal limitations while those persons who obtain it
should familiarize themselves with all the limitations of this kind and submit to them. The failure to abide by these limitations may constitute a breach of the
prevailing law. The data and information contained in this presentation do not portray a thorough financial analysis of the Company, nor do they represent a
commercial offer of the Company. A detailed description of PKP CARGO’s business and financial position has been presented in the current reports and
periodic reports published on the following website: www.pkp-cargo.pl. Information about entering into contracts to acquire the assets described in this
presentation has been published by PKP CARGO in current reports. The information contained in this presentation is merely supplementary to the above
information; at the same time, this information does not constitute a standalone basis for the Company to transmit the same in the framework of discharging
the reporting duties of public companies.
All the data set forth in this presentation are based on sources the Company deems to be exact and credible; however, the Company does not bear liability
for the exactitude and credibility of these sources. The Company reserves the right to alter the data and information contained in this presentation at any
time without giving prior notification to the persons to whom this presentation is furnished. This presentation may contain certain statements referring to
future events. These statements, however, cannot be understood to be the Company’s forecasts or projections concerning the Company’s results or an
indication of the Company’s future results. The assumptions adopted by the Management Board are based on the Company’s Management Board’s current
knowledge, awareness and views and are dependent on a number of factors that may cause the actual results achieved in the future to differ materially
from the results referred to in this document. PKP CARGO is not liable for damages ensuing from third parties using this presentation. This presentation
has been prepared solely for information purposes and does not constitute an offer to acquire or sell or participate in any investment whatsoever, including
the acquisition of any of the Company’s securities or other financial instruments, or to participate in any commercial undertaking.
26
© Copyright PKP CARGO S.A.
To obtain additional information about PKP CARGO
please contact the Investor Relations Section:
PKP CARGO S.A.Investor Relations Sectionul. Grójecka 1702-021 Warsaw
Telephone: +48 22 391-47-09
Fax: +48 22 474-29-53
e-mail: [email protected]
27