pki capabilities become business possibilities. are you ready?
TRANSCRIPT

Find out how organizations are using PKI and if they’re prepared for what’s possible.
PKI capabilities become business possibilities.Are you ready?
2021 GLOBAL PKI AND IoT TRENDS STUDY

2021 Global PKI and IoT Trends Study Independently conducted by Ponemon Institute LLC and sponsored by Entrust
PART 1. INTRODUCTION . . . . . . . . . . . . . . . . . . . . . . . . . . . . . . . .3
PART 2. KEY FINDINGS . . . . . . . . . . . . . . . . . . . . . . . . . . . . . . . . .6
The pain of managing IoT keys . . . . . . . . . . . . . . . . . . . . . . . . . . . . . . .7
Trends in PKI maturity . . . . . . . . . . . . . . . . . . . . . . . . . . . . . . . . . . . . . . 10
Trends in PKI challenges . . . . . . . . . . . . . . . . . . . . . . . . . . . . . . . . . . . . 14
Global analysis . . . . . . . . . . . . . . . . . . . . . . . . . . . . . . . . . . . . . . . . . . . . 19
PART 3. METHODS . . . . . . . . . . . . . . . . . . . . . . . . . . . . . . . . . . . . 26
PART 4. LIMITATIONS . . . . . . . . . . . . . . . . . . . . . . . . . . . . . . . . . . 30
TABLE OF CONTENTS

01Introduction

42021 Global PKI and IoT Trends Study
According to the findings, digital certificate use
is growing rapidly for cloud applications and user
authentication . Additionally, the rapid growth
in the use of IoT devices1 is having an impact
on the use of PKI technologies, and there is the
realization that PKI provides important core
authentication technologies for the IoT .
The PKI research is part of a larger study
published in April 2021 involving 6,610
respondents in 17 countries .2
In this report, Ponemon Institute presents the
findings based on a survey of 2,513 IT and IT
security professionals who are involved in their
organizations’ enterprise PKI in the following 17
countries and regions: Australia, Brazil, France,
Germany, Hong Kong, Japan, Korea, Mexico,
Middle East, Netherlands, Russian Federation,
Southeast Asia, Spain, Sweden, Taiwan, the
United Kingdom, and the United States .
1 IDC predicts by 2025 there will be 41 .6 billion IoT devices connected to businesses and these “things” will generate 79 .4 zettabytes of data .
2 See: 2021 Global Encryption Trends & Key Management Study (sponsored by Entrust), Ponemon Institute, April 2021 .
Ponemon Institute is pleased to present the findings of the 2021 Global PKI and IoT Trends Study, sponsored by Entrust.

5 2021 Global PKI and IoT Trends Study
Figure 1 shows the primary practices organizations
take to secure PKI and certificate authorities (CAs) .
Most companies represented in this study are
using multi-factor authentication for administrators
(57 percent of respondents) . Similarly, dependency
on passwords has declined from 29 percent of
respondents in 2017 to 22 percent of respondents
in this year’s study . Usage of hardware security
modules, most prevalent with offline root CAs
and issuing CAs, stayed virtually the same from
39 percent of respondents in 2020 to 40 percent
of respondents in 2021 and they remain the most
prevalent method of PKI private key protection .
The report tabulates the responses to the survey
and draws some limited conclusions as to how
best practices are reflected in observed practices,
as well as the influence of cloud computing,
the Internet of Things, and other important
industry trends . All participants in this research
are either involved in the management of their
organizations’ enterprise PKI or in developing
and/or managing applications that depend upon
credentials controlled by their organizations’ PKI .
Figure 1. Practices used to secure PKI and Certificate Authorities
Multi-factor authenticationfor administrators
Physical secure location
Formal security practices(documented)
O�ine root CAs
Passwords alone withouta second factor
59%62%
60%57%57%
47%
40%40%42%42%
28%30%28%28%
27%
29%30%
24%23%22%
41%
48%46%49%
45%
FY17
FY18
FY19
FY20
FY21

02 Key Findings

7 2021 Global PKI and IoT Trends Study
New applications, such as IoT devices, continue to drive the most change and uncertainty. According to Figure 2, 41 percent of respondents
say new applications such as the IoT will drive
change . However, this is a significant decrease
from 52 percent of respondents in 2020 .
The influence of changing PKI technologies
and enterprise applications increased from
21 percent of respondents in 2020 to 27
percent of respondents in 2021 .
In this section of the report, we provide an analysis of the global PKI results over a five-year period from 2017 to 2021.
The pain of managing IoT keys
Figure 2. Areas expected to experience the most change and uncertaintyConsolidated view – two responses permitted
New applications (e.g., Internet of Things)
External mandates and standards
Budget and resources
Management expectations
PKI technologies
Internal security policies
Enterprise applications
Vendors (products and services)
FY17
FY18
FY19
FY20
FY21
36%42%
40%52%
41%
47%42%
39%49%
37%
26%26%
28%21%
27%
21%20%
21%21%22%
20%18%18%
12%20%
17%19%19%
21%19%
19%18%19%
11%17%
14%15%
16%10%
16%

82021 Global PKI and IoT Trends Study
Internal security policies increased significantly
from 12 percent of respondents in 2020 to 20
percent of respondents in 2021 .
IoT continues to be a major driver for the use of PKI. There is growing recognition that
PKI provides important core authentication
technology in the IoT . As shown in Figure 3,
respondents who say IoT is the most important
trend driving the deployment of applications
using PKI has increased from 40 percent of
respondents in 2017 to 47 percent in 2021 . In
contrast, cloud-based services decreased from
54 percent of respondents in 2017 to 44 percent
of respondents in 2021 . This should define the
challenges facing PKI vendors and administrators
alike as they adapt the technology to these
new realities .
Figure 3. The most important trends driving the deployment of applications using of PKI Consolidated view – two responses permitted
FY17
FY18
FY19
FY20
FY21
Internet of Things (IoT)
Cloud-based services
Consumer mobile
Regulatory environment
Consumer-orientedmobile applications
BYOD and internal mobiledevice management
E-commerce
Cost savings
Risk management
40%44%
41%47%47%
54%45%
49%44%44%
41%45%
44%40%40%
23%21%21%
24%24%
19%21%
20%20%
20%
8%9%10%
11%11%
5%7%7%
6%6%
6%5%5%
4%4%
2%2%2%3%3%

9 2021 Global PKI and IoT Trends Study
In the next two years, an average of 45 percent
of IoT devices in use will rely primarily on digital
certificates for identification and authentication .
As shown in Figure 4, 42 percent of respondents
believe that as the IoT continues to grow,
supporting PKI deployments for IoT device
credentialing will be a combination of cloud-
based and enterprise-based .
Figure 4. What supporting PKI deployments for IoT device credentialing will be as the IoT continues to grow?
Combination of cloud-basedand enterprise-based
Primarily enterprise-based
Primarily cloud-based
FY17
FY18
FY19
FY20
FY21
43%43%
44%45%
32%31%
30%29%
30%
25%27%
26%26%
28%
42%

102021 Global PKI and IoT Trends Study
Trends in PKI MaturityAccording to Figure 5, the certificate revocation
technique most often deployed continues to
be online certificate status protocol (OCSP),
according to 57 percent of respondents . The next
most popular technique is the use of automated
certificate revocation list (CRL), according to
42 percent of respondents, a decrease from
47 percent of respondents in 2020 .
Similar to last year, 32 percent of respondents
say they do not deploy a certificate revocation
technique . There are many possible explanations
for this high percentage – use of alternate means
to remove users/devices, use of short lifespan
certificates, closed systems, etc .
Figure 5. The certificate revocation techniques used in enterprisesConsolidated view – more than one response permitted
Online Certificate StatusProtocol (OCSP)
Automated CRL
Manual certificaterevocation list (CRL)
Validation authority
None
FY17
FY18
FY19
FY20
FY21
54%57%
58%53%
57%
46%47%
44%47%
42%
20%20%19%20%20%
19%18%19%20%
18%
33%30%30%
32%32%
Similar to last year, 32 percent of respondents say they do not deploy a certificate revocation technique . There are many possible explanations for this high percentage
– use of alternate means to remove users/devices, use of short lifespan certificates,
closed systems, etc .
11 2021 Global PKI and IoT Trends Study
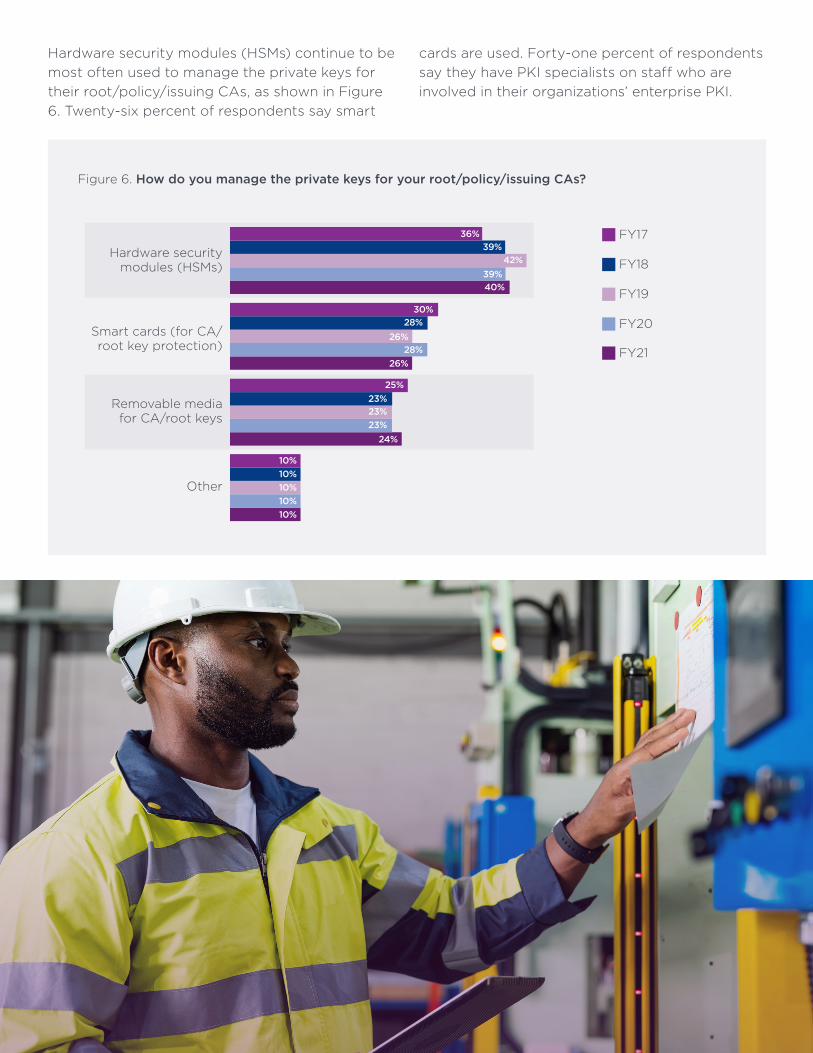
Hardware security modules (HSMs) continue to be
most often used to manage the private keys for
their root/policy/issuing CAs, as shown in Figure
6 . Twenty-six percent of respondents say smart
cards are used . Forty-one percent of respondents
say they have PKI specialists on staff who are
involved in their organizations’ enterprise PKI .
Figure 6. How do you manage the private keys for your root/policy/issuing CAs?
Hardware securitymodules (HSMs)
Smart cards (for CA/root key protection)
Removable mediafor CA/root keys
Other
FY17
FY18
FY19
FY20
FY21
36%39%
42%39%40%
30%28%
26%28%
26%
25%23%23%23%
24%
10%10%10%10%10%

122021 Global PKI and IoT Trends Study
Of the 40 percent of organizations in this study
that use HSMs to secure PKI, they are used across
the entire architecture of the PKI as shown in
Figure 7 . As an example of best practices, NIST
calls to “Ensure that Cryptographic modules
for CAs, Key Recovery Servers, and OCSP
responders are hardware modules validated as
meeting FIPS 140-2 Level 3 or higher” (NIST
Special Publication 800-57 Part 3) . Yet only 11
percent of our respondents indicate the presence
of HSMs in their OCSP installations . This is a
significant gap between best practices and
observed practices .
Figure 7. Where HSMs are deployed to secure PKIConsolidated view – more than one response permitted
O�ine root
Issuing CA
Validation authority
Online root
Policy CA
Registration authority
OCSP responder
FY17
FY18
FY19
FY20
FY21
50%50%
48%47%
49%
43%40%
41%42%
39%
34%
38%35%
34%36%
30%30%
29%30%
28%
22%23%
22%22%
20%
12%
12%12%
11%
11%
9%8%8%8%8%

13 2021 Global PKI and IoT Trends Study
No clear ownership and insufficient resources and skills are the top three challenges to enabling applications to use PKI. As shown in Figure 8, the
challenge of not having clear ownership increased
significantly from 63 percent of respondents
in 2020 to 71 of respondents in 2021 . Other
challenges are insufficient resources (51 percent)
and insufficient skills (46 percent of respondents) .
Figure 8. The challenges in deploying and managing PKIConsolidated view – four responses permitted
No clear ownership
Insu�cient resources
Insu�cient skills
Too much change or uncertainty
Necessary performance andreliability is hard to achieve
Lack of clear understandingof the requirements
Requirements are toofragmented or inconsistent
Lack of visibility of the applicationsthat will depend on PKI
Commercial solutions are toocomplicated or too expensive
No suitable products ortechnologies available
Too hard to transition from currentapproach to a new system
Lack of advisory services and support
FY17
FY18
FY19
FY20
FY21
69%
42%47%
49%51%51%
47%48%47%
52%46%
34%35%36%36%37%
41%39%38%
45%34%
35%32%31%
28%34%
39%35%
37%36%
32%
26%27%27%
32%28%
31%29%
28%24%
27%
18%20%20%
15%21%
11%12%11%
14%12%
7%6%6%
3%7%
70%68%
63%71%

142021 Global PKI and IoT Trends Study
Too much change or uncertainty has decreased
from 45 percent of respondents in last year’s
research to 34 percent of respondents in 2021 .
However, lack of visibility of the applications
that will depend upon PKI increased from 28
percent of respondents in 2020 to 34 percent of
respondents in this year’s research .
Trends in PKI challengesOrganizations with internal CAs use an average
of 7 .2 separate CAs, managing an average of
58,639 internal or externally acquired certificates .
As shown in Figure 9, an average of 9 .12
distinct applications, such as email and network
authentication, are managed by an organization’s
PKI . This indicates that the PKI is at the core of
the enterprise IT backbone . Not only the number
of applications dependent upon the PKI but the
nature of them indicates that the PKI is a strategic
part of the core IT backbone .
Figure 9. How many distinct applications does your PKI manage certificates on? Consolidated view – extrapolated value is an average of 9.12 distinct applications
1 or 2
3 or 4
5 or 6
7 or 8
9 or 10
11 or 12
13 or 14
15 or more
5%
12%
19%
18%
17%
13%
7%
8%

15 2021 Global PKI and IoT Trends Study
In many cases, existing PKI is incapable of supporting new applications. As shown in Figure
10, the number one challenge is that 55 percent
of respondents say existing PKI is incapable of
supporting new applications . The challenge of
insufficient skills increased significantly from
34 percent of respondents to 46 percent of
respondents . The lack of visibility of the security
capabilities of existing PKI has decreased
significantly from 52 percent of respondents in
2020 to 33 percent of respondents in 2021 .
Lack of visibility of the security capabilities of existing PKI
Existing PKI is incapable of supporting new applications
No ability to change legacy apps
Lack of clear understandingof requirements
Insu�cient resources
Insu�cient skills
Too much change or uncertainty
Conflict with other apps using the same PKI
Requirements are too fragmented or inconsistent
No pre-existing PKI
Specific operational issues (such as revocation and performance)
are hard to resolve
Lack of advisory support
Figure 10. What are the challenges to enable applications to utilize PKI?Consolidated view – four responses permitted
FY17
FY18
FY19
FY20
FY21
54%
43%42%
45%34%
46%
52%49%
46%51%
41%40%
38%35%
38%
40%38%
35%31%
36%
35%35%35%
25%36%
30%29%
35%48%
35%
28%33%
36%52%
33%
30%39%
28%28%28%
23%
16%16%16%
12%19%
6%6%7%
5%8%
25%25%
26%23%
43%
56%51%
55%
57%

162021 Global PKI and IoT Trends Study
Common Criteria EAL Level 4+ is the most important security certification when deploying PKI infrastructure and PKI-based applications. According to Figure 11, 63 percent say common
criteria followed by 62 percent who say FIPS
140 is the most important when deploying
PKI . Twenty-five percent of respondents say
regional standards such as digital signature
laws are important . In the U .S ., FIPS 140 is the
standard called out by NIST in its definition of a
“cryptographic module,” which is mandatory for
most U .S . federal government applications and a
best practice in all PKI implementations .
Common Criteria EAL Level 4+
FIPS 140-2 Level 3
Regional standards suchas digital signature laws
Regional certifications foruse by government
None of the above (certificationis not an important factor)
Figure 11. Security certifications important when deploying PKI infrastructureConsolidated view – more than one response permitted
FY17
FY18
FY19
FY20
FY21
64%66%
64%67%
63%
65%62%
60%60%
62%
22%26%
25%26%
25%
20%25%
23%22%23%
12%14%
11%10%11%
Twenty-five percent of respondents say regional standards such as digital signature laws are important. In the U .S ., FIPS 140 is the standard called out by NIST in its definition of a
“cryptographic module” which is mandatory for most U .S . federal government applications
and a best practice in all PKI implementations .

17 2021 Global PKI and IoT Trends Study
SSL certificates for public-facing websites and services are most often using PKI credentials. According to Figure 12, 81 percent of respondents
say the application most often using PKI
credentials is SSL certificates for public-facing
websites and services . However, enterprise user
authentication has decreased significantly from
70 percent of respondents in 2020 to 53 percent
of respondents in 2021, and the use of public
cloud-based applications and services has
decreased significantly from 82 percent in 2020
to 52 percent of respondents in 2021 . Private
networks and VPN have increased from 60
percent to 67 percent of respondents in 2021 .
SSL certificates for public-facing websites and services
Public cloud-based applications and services
Enterprise user authentication
Private networks and VPN
Email security
Device authentication
Document/message signing
Private cloud-basedapplications
Code signing
Figure 12. What applications use PKI credentials in organizations? Consolidated view – more than one response permitted
FY17
FY18
FY19
FY20
FY21
84%84%
79%84%
81%
65%71%
69%60%
67%
51%53%
54%51%
55%
50%49%
51%70%
53%
56%56%
55%82%
52%
52%51%
50%49%50%
44%44%
46%35%
47%
42%42%44%
45%47%
31%32%32%32%33%
182021 Global PKI and IoT Trends Study
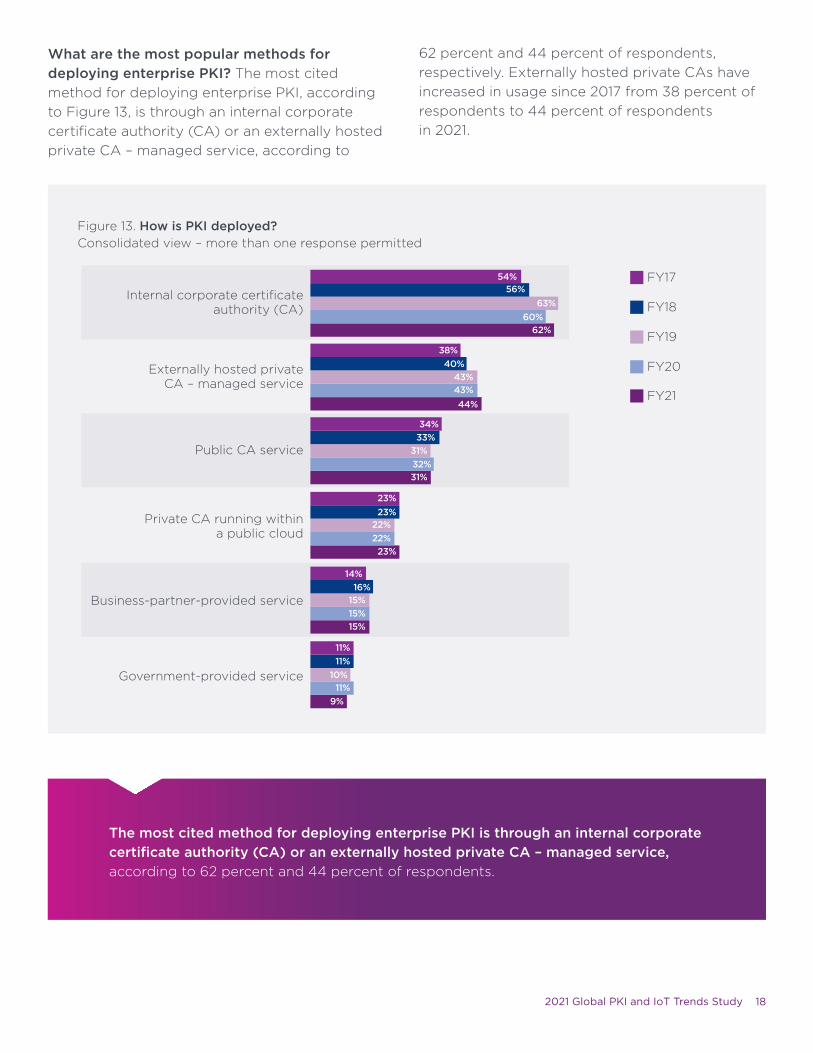
What are the most popular methods for deploying enterprise PKI? The most cited
method for deploying enterprise PKI, according
to Figure 13, is through an internal corporate
certificate authority (CA) or an externally hosted
private CA – managed service, according to
62 percent and 44 percent of respondents,
respectively . Externally hosted private CAs have
increased in usage since 2017 from 38 percent of
respondents to 44 percent of respondents
in 2021 .
Internal corporate certificateauthority (CA)
Externally hosted private CA – managed service
Public CA service
Private CA running within a public cloud
Business-partner-provided service
Government-provided service
Figure 13. How is PKI deployed? Consolidated view – more than one response permitted
FY17
FY18
FY19
FY20
FY21
54%56%
63%60%
62%
38%40%
43%43%44%
34%33%
31%32%31%
23%23%
22%22%23%
14%16%
15%15%15%
11%11%
10%11%
9%
The most cited method for deploying enterprise PKI is through an internal corporate certificate authority (CA) or an externally hosted private CA – managed service, according to 62 percent and 44 percent of respondents .

19 2021 Global PKI and IoT Trends Study
Global AnalysisIn this section, we provide the most salient
differences among the 17 countries represented
in this study .
Figure 14 shows how PKI is deployed within
respondents’ organizations . As shown, Spain
(78 percent of respondents), Japan (72 percent
of respondents), Germany (72 percent of
respondents), the United States (71 percent of
respondents), and Southeast Asia (70 percent of
respondents), are most likely to choose internal
corporate certificate authority .
Internal corporate certificate authority (CA)
Externally hosted private CA – managed service
SP
JP
DE
US
SA
KO
SW
UK
HK
AU
FR
ME
BZ
MX
NL
TW
RF
Figure 14. How would you describe how yourorganization’s enterprise PKI is deployed? Top 2 choices
78%
72%32%
72%37%
71%37%
70%64%
68%72%
67%85%
62%37%
62%46%
60%20%
60%24%
59%50%
57%20%
50%39%
46%44%
44%71%
25%46%
47%
Australia
Brazil
France
Germany
Hong Kong
Japan
Korea
Mexico
Middle East
Netherlands
Russia
Spain
Southeast Asia
Sweden
Taiwan
United Kingdom
United States
AU
BZ
FR
DE
HK
JP
KO
MX
ME
NL
RF
SP
SA
SW
TW
UK
US
Country Abbreviated

202021 Global PKI and IoT Trends Study
In contrast, Korea (72 percent of respondents),
Southeast Asia (64 percent of respondents),
Middle East (50 percent of respondents), and
Russia (46 percent of respondents), are most
likely to choose externally hosted private
certificate authorities as a managed service .
When asked about the revocation techniques
deployed, 32 percent of respondents globally say
none . As shown in Figure 15, of those respondents
who say their organizations use a certificate
revocation technique, respondents from Germany
(86 percent), UK (63 percent), Australia (63
percent), Brazil (63 percent), and Japan (63
percent) are most likely to use Online Certificate
Status Protocol (OCSP) . Respondents from
Russia (62 percent), France (54 percent), U .S .
(49 percent), and the Netherlands (45 percent)
are most likely to use automated CRLs .
DE
UK
AU
BZ
JP
FR
TW
US
SW
NL
ME
KO
SA
SP
MX
HK
RF
Online Certificate Status Protocol (OCSP)
Automated CRL
Figure 15. Which certificate revocation technique does your organization deploy? Top 2 choices = OCSP and Automated CRL
86%59%
63%40%
63%29%
63%33%
63%40%
62%54%
61%30%
60%49%
56%35%
54%45%
53%37%
51%40%
47%35%
47%38%
45%45%
41%39%
40%62%

21 2021 Global PKI and IoT Trends Study
As noted above, this implies a true chasm
between operational best practices and observed
practices . Certificates have a life span . During that
life span circumstances change, and certificates
outlive their purpose . Without a method of
revoking certificates, the population of valid,
extant certificates simply grows .
We can surmise that there are connections
between this observed deviation from best
practices and the significant lack of dedicated
personnel and skills called out in the study .
When something as basic as lack of revocation
processes is this common, one has to wonder
about the currency of documentation on and
processes for managing the average of seven
major enterprise applications that are dependent
on the PKI .
According to Figure 16, the U .S . and Germany
have the most individual CAs deployed within
their organizations (9 .41 and 9 .01, respectively) .
Mexico and the Russian Federation have the
least number of individual CAs (5 .34 and 5 .12,
respectively) .
US
DE
NL
UK
JP
SP
ME
FR
KO
SW
HK
SA
AU
TW
BZ
MX
RF
Figure 16. What best describes the number of individual CAs in your organization?Extrapolated average values
9.41
9.01
8.24
7.96
7.23
7.11
6.73
6.68
6.56
6.48
6.45
6.23
6.22
6.09
5.99
5.34
5.12

222021 Global PKI and IoT Trends Study
Again, this reinforced the penetration of the
PKI into the core IT backbone of the modern
organization . And, given the stated lack of skilled
personnel and organizational clarity, combined
with the lack of consistent revocation practices,
one has to draw attention to risks to the health
and integrity of these CAs and the important core
enterprise applications that use their certificates .
Figure 17 is the number of distinct applications
(e .g ., email, network authentication, etc .) for which
PKI manages certificates . U .S . at 12 .32 has the
largest number of distinct applications . Mexico
(6 .73) and Russia (6 .51) have the smallest number
of distinct applications, respectively .
One should note that even in the lowest figures
that the average number of applications is just
north of 6 . Given previous responses, we can
extrapolate that these likely include email, SSL
certificates, device identification, and logon
credentials . These are non-trivial applications, the
failure of which could pose existential risks to the
host organization .
US
UK
FR
DE
BZ
AU
JP
ME
HK
SP
TW
KO
SA
SW
NL
MX
RF
Figure 17. How many distinct applications does your PKI manage certificates on behalf of?Extrapolated value
12.32
10.45
10.15
9.56
8.66
8.64
8.45
8.36
8.05
7.45
7.33
7.18
7.08
6.94
6.88
6.73
6.51

23 2021 Global PKI and IoT Trends Study
Figure 18 reports the three most salient
challenges in deploying and managing PKI .
As shown, the Middle East, the U .S ., Germany,
and Australia are most likely to cite no clear
ownership as their most significant challenge .
Russia, Southeast Asia, and the U .S . are more
likely to say insufficient resources is a challenge,
and Korea, Spain, and Southeast Asia say they
are challenged by insufficient skills .
KO
SP
SA
RF
UK
ME
US
BZ
MX
SW
JP
TW
NL
FR
HK
DE
AU
No clear ownership
Insu�cient skills
Insu�cient resources
Figure 18. What are the main challenges in deploying and managing PKI? Top 3 choices
69%
67%54%
70%
67%72%
48%
58%74%
57%
56%41%
53%57%
84%
51%64%
81%
42%38%
65%
42%58%
71%
40%35%
72%
40%42%
38%41%
67%
35%47%
74%
31%54%
65%
30%54%
65%
79%
78%49%
23%
29%35%
60%
67%
50%71%

242021 Global PKI and IoT Trends Study
There is a consistent theme in these responses .
We can see the importance of the PKI growing
and its integration with core IT applications . Also,
PKI’s near-term future is being buffeted by trends
toward the cloud, mobility, and IoT . However,
globally there is a lack of trained people and
tendency towards fuzzy ownership of the PKI .
This is a significant departure from known best
practices that require direct lines of responsibility
for all PKI dependent applications and clear
documentation of the dependencies and risk
mitigation strategies . One has to wonder about
the condition of required PKI documentation and
processes given these high rates of skills and
personnel shortages .
As organizations plan the evolution of their PKI,
where are the greatest areas of possible change
and uncertainty? Figure 19 provides the top two
choices . Accordingly, Hong Kong, Japan, and
Brazil respondents say new applications such as
IoT are driving change and uncertainty . The U .S .
by far sees that external mandates and standards
are driving change and uncertainty .
HK
JP
BZ
SW
FR
US
RF
TW
NL
MX
UK
AU
SA
SP
KO
ME
DE
External mandates and standards
New applications
Figure 19. Where are the greatest areas of change and uncertainty in the evolution of your PKI? Top 2 choices
52%38%
52%44%
50%42%
49%34%
48%44%
48%60%
41%33%
41%22%
41%41%
40%24%
37%34%
36%41%
35%23%
32%28%
28%33%
28%30%
26%33%

25 2021 Global PKI and IoT Trends Study
Figure 20 reports what respondents believe are
the most important trends that are driving the
deployment of applications that make use of PKI .
As can be seen, the Netherlands, France, the
United States, and the United Kingdom are most
likely to cite cloud-based services as driving the
deployment of applications that make use of PKI .
Australia, Mexico, Sweden, and Spain respondents
are most likely to see IoT as a driver to PKI
adoption . Brazil, Middle East, France, and Russia
are more likely to see consumer mobile as a driver .
Cloud-based services
Consumer mobile
Internet of Things
Figure 20. What are the most important trends that are driving the deployment of applications that make use of PKI?Top 3 choices
AU
SW
MX
SP
NL
BZ
SA
HK
JP
DE
ME
UK
CH
KO
RF
FR
US
54%37%
44%
52%42%
35%
52%37%
36%
51%41%
34%
50%55%
32%
50%39%
49%
49%37%
40%
48%42%
43%
48%40%
42%
48%45%
37%
46%37%
44%
46%51%
39%
46%48%
36%
43%45%
41%
42%48%
43%
41%54%
43%
38%52%
40%

262021 Global PKI and IoT Trends Study
03 Methods

27 2021 Global PKI and IoT Trends Study
Table 1 reports the consolidated sample response
for 17 separate country samples . Data collection
was conducted between late December 2020 to
early January 2021 . Our consolidated sampling
frame of practitioners in all countries consisted of
167,515 individuals who have bona fide credentials
in IT or security fields . From this sampling frame,
we captured 7,090 returns of which 718 were
rejected for reliability issues . From our final
consolidated 2021 sample of 6,372, we calculated
the PKI subsample to be 2,513 .
Figure 21 reports the respondent’s organizational
level within participating organizations . By design,
56 percent of respondents are at or above the
supervisory levels and 42 percent of respondents
reported their position as associate/staff/
technician . Respondents have on average 9 .0
years of security experience with approximately
6 .2 years of experience in their current position .
Table 1. Sample response Frequency
167,515
7,090
718
6,372
2,513
41%
Sampling frame
Total returns
Rejected or screened surveys
Overall sample (encryption trends)
PKI subsample
Ratio subsample to overall sample
Senior Executive
Vice President
Director
Manager/Supervisor
Associate/Sta�/Technician
Other
Figure 21. Distribution of respondents according to position levelCountry samples are consolidated
3% 4%
16%
33%
42%
2%

282021 Global PKI and IoT Trends Study
Figure 22 identifies the organizational location of
respondents in our study . Over half (54 percent)
of respondents are located within IT operations .
This is followed by security at 22 percent of
respondents and lines of business at 9 percent of
respondents .
Figure 23 reports the industry classification of
respondents’ organizations . Fifteen percent of
respondents are located in the financial services
industry, which includes banking, investment
management, insurance, brokerage, payments,
and credit cards .
IT operations
Security
Lines of business
Compliance
Finance
Other
Figure 22. Distribution of respondents according to functional area Country samples are consolidated
54%
22%
9%
8%
4%3%
Financial services
Manufacturing & industrial
Services
Technology & software
Public sector
Retail
Health & pharmaceutical
Energy & utilities
Consumer products
Transportation
Hospitality
Education & research
Communications
Entertainment & media
Other
Figure 23. Distribution of respondents according to primary industry classificationCountry samples are consolidated
15%
12%
11%
9%9%
8%
8%
6%
4%
3%
3%
3%3% 2% 3%

29 2021 Global PKI and IoT Trends Study
Twelve percent of respondents are located in
manufacturing and industrial organizations,
and 11 percent of respondents are in service
organizations . Nine percent are located in the
technology and software sector, and another nine
percent of respondents are in the public sector .
According to Figure 24, more than half (57
percent) of respondents are located in larger-
sized organizations with a global head count of
more than 1,000 employees .
More than 75,000
25,001 to 75,000
5,001 to 25,000
1,001 to 5,000
500 to 1,000
Less than 500
Figure 24. Distribution of respondents according to organizational head countCountry samples are consolidated
7%
18%
30%
27%
16%
4%

302021 Global PKI and IoT Trends Study
04 Limitations

31 2021 Global PKI and IoT Trends Study
There are inherent limitations to survey research
that need to be carefully considered before
drawing inferences from the presented findings .
The following items are specific limitations that
are germane to most survey-based research
studies .
Non-response bias: The current findings are
based on a sample of survey returns . We sent
surveys to a representative sample of IT and IT
security practitioners in 17 countries, resulting
in a large number of usable returned responses .
Despite non-response tests, it is always possible
that individuals who did not participate are
substantially different in terms of underlying
beliefs from those who completed the survey .
Sampling-frame bias: The accuracy of survey
results is dependent upon the degree to which
our sampling frames are representative of
individuals who are IT or IT security practitioners
within global companies represented in this study .
Self-reported results: The quality of survey
research is based on the integrity of confidential
responses received from respondents . While
certain checks and balances were incorporated
into our survey evaluation process including
sanity checks, there is always the possibility
that some respondents did not provide truthful
responses .

322021 Global PKI and IoT Trends Study
About Ponemon Institute The Ponemon Institute© is dedicated to advancing responsible information and privacy
management practices in business and government . To achieve this objective, the Institute
conducts independent research, educates leaders from the private and public sectors, and
verifies the privacy and data protection practices of organizations in a variety of industries .
About Entrust CorporationEntrust keeps the world moving safely by enabling trusted identities, payments, and data
protection . Today more than ever, people demand seamless, secure experiences, whether
they’re crossing borders, making a purchase, accessing e-government services, or logging into
corporate networks . Entrust offers an unmatched breadth of digital security and credential
issuance solutions at the very heart of all these interactions . With more than 2,500 colleagues, a
network of global partners, and customers in over 150 countries, it’s no wonder the world’s most
entrusted organizations trust us . For more information, visit entrust.com.
Entrust, nShield, and the hexagon logo are trademarks, registered trademarks, and/or service marks of Entrust Corporation in the
U .S . and/or other countries . All other brand or product names are the property of their respective owners .
© 2021 Entrust Corporation . All rights reserved .
PK22Q2-2021-pki-iot-trends-study-re