pkc group plc · • pkc group plc is listed in nasdaq omx ... zacquisition of man business in...
TRANSCRIPT

1
PKC Group PlcInvestor Presentation Q4/2012
14 February 2013
Matti HyytiäinenPresident & CEO
1

2
Strong Performance During Year 2012
• Successful integration of AEES companies into PKC.
• New customers, increased sales to current customers in new market areas.
• Free cash flow of EUR 3.0 per share.
• Dividend up by 17%, the proposal is EUR 0.70 per share.
The Highlights
3
PKC’s OperationsBusiness Environment
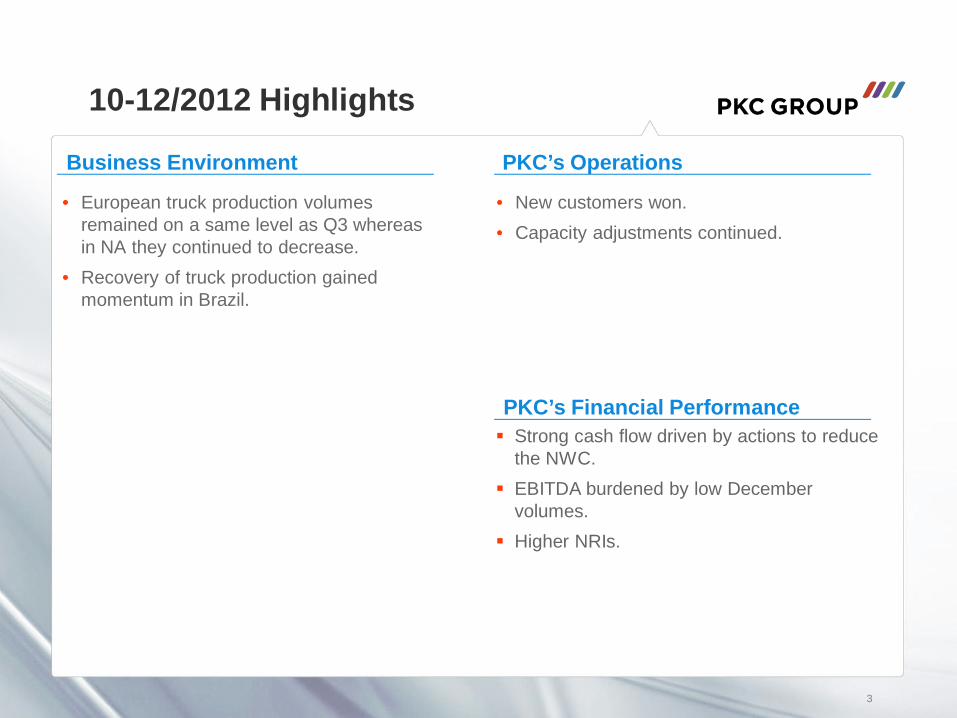
10-12/2012 Highlights
• European truck production volumes remained on a same level as Q3 whereas in NA they continued to decrease.
• Recovery of truck production gained momentum in Brazil.
• New customers won.• Capacity adjustments continued.
PKC’s Financial PerformanceStrong cash flow driven by actions to reduce the NWC.EBITDA burdened by low December volumes.Higher NRIs.

4
PKC Group Briefly
• PKC Group operates in two core business segments: Wiring Systems and Electronics
• PKC designs and manufactures electrical distribution systems, wire & cables, wiring components and electronics
• The Group’s products and services are delivered mainly to the commercial vehicle, automotive and electronics industries
• Global footprint with headquarters in Helsinki, Finland
• The Group’s net sales amounted to EUR 928.2 million in 2012
• 19,759 employees globally at the end of 2012
• PKC Group Plc is listed in NASDAQ OMX Helsinki Ltd.
4
5
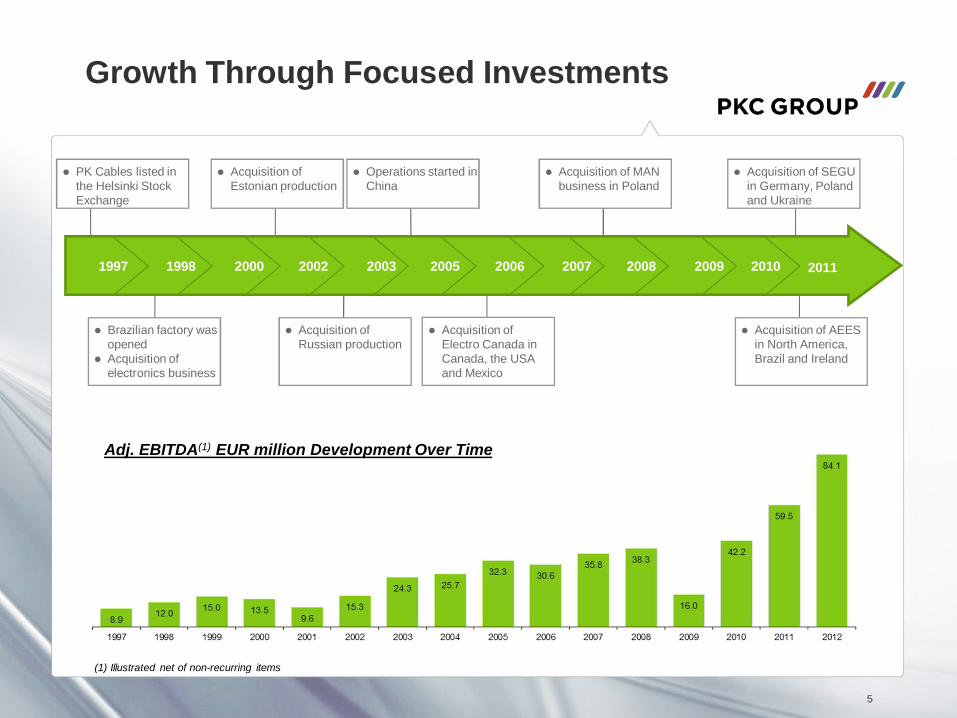
Growth Through Focused Investments
Adj. EBITDA(1) EUR million Development Over Time
(1) Illustrated net of non-recurring items
5
1997 1998 2000 2002 2003 2005 2006 2007 2008 2009
Brazilian factory was openedAcquisition of electronics business
Acquisition of Estonian production
Operations started in China
PK Cables listed in the Helsinki Stock Exchange
Acquisition of Russian production
Acquisition of Electro Canada in Canada, the USA and Mexico
Acquisition of MAN business in Poland
2010 2011
Acquisition of SEGU in Germany, Poland and Ukraine
Acquisition of AEES in North America, Brazil and Ireland

6
PKC Group, Executive Board
President & CEOMatti Hyytiäinen
WIRING SYSTEMSEUROPE
President, WS, EuropeJani Kiljala
FINANCE
CFOJuha Torniainen
LEGAL & CORPORATE
DEVELOPMENT
General CounselSanna
Raatikainen
WIRING SYSTEMS
SOUTH AMERICA
President, WS, South
AmericaPekka Korkala
WIRING SYSTEMS
NORTH AMERICA
President, WS, North America
Frank Sovis
BUSINESS DEVELOPMENT &
APAC
Senior Vice President, Business
Development & APAC
Jyrki Keronen
ELECTRONICS
President, Electronics
Jarmo Rajala

PKC locations today
77
Barchfeld, Germany (M)Dundalk, Ireland (M)Haapsalu, Estonia (M)Helsinki, Finland (HQ)Keila, Estonia (M)Kempele, Finland Kostomuksha, Russia (M)Mukachewo, Ukraine (M)Munich, GermanyRaahe, Finland (M)Sosnowiec, Poland (M)Starachowice, Poland (M)
Suzhou, China (M)
Campo Alegre, Santa Catarina, Brazil (M)Curitiba, Brazil (M)Itajuba, Brazil (M)São Bento do Sul, Brazil (M)
Wiring Systems business
Electronics business
Manufacturing
Acuna, Mexico (M)Dallas, TexasGreen Valley, ArizonaFarmington Hills, MichiganJeffersontown, KentuckyJuarez, Mexico (M)Kirkland, WashingtonMonterey, MexicoNogales, Mexico (M)Piedras Negras, Mexico (M)Portland, OregonSan Antonio, TexasTorreon, Mexico (M)Traverse City, Michigan (M)
North America
South America
Europe
Asia(M)
Hong Kong, China

PKC Sales Split
8

Geographical Split
9

10
Key Figures, 1-12/2012
EUR million 1-12/12 1-12/11 Change %
Net sales 928.2 550.2 68.7
EBITDA 84.1 59.5 41.3
Depreciation and amortisation1) 18.7 10.5 78.1
PPA depreciation and amortisation 13.9 7.0 98.6
EBIT 51.5 42.0 22.6
Non-recurring items 8.0 7.5 6.7
EBIT after non-recurring items 43.5 34.5 26.1
Financial items -8.5 -5.1
Taxes -10.9 -6.0
Net profit 24.0 23.4 2.6
EPS (EUR) 1.12 1.16 -3.41) Excluding PPA depreciation and amortisation
11
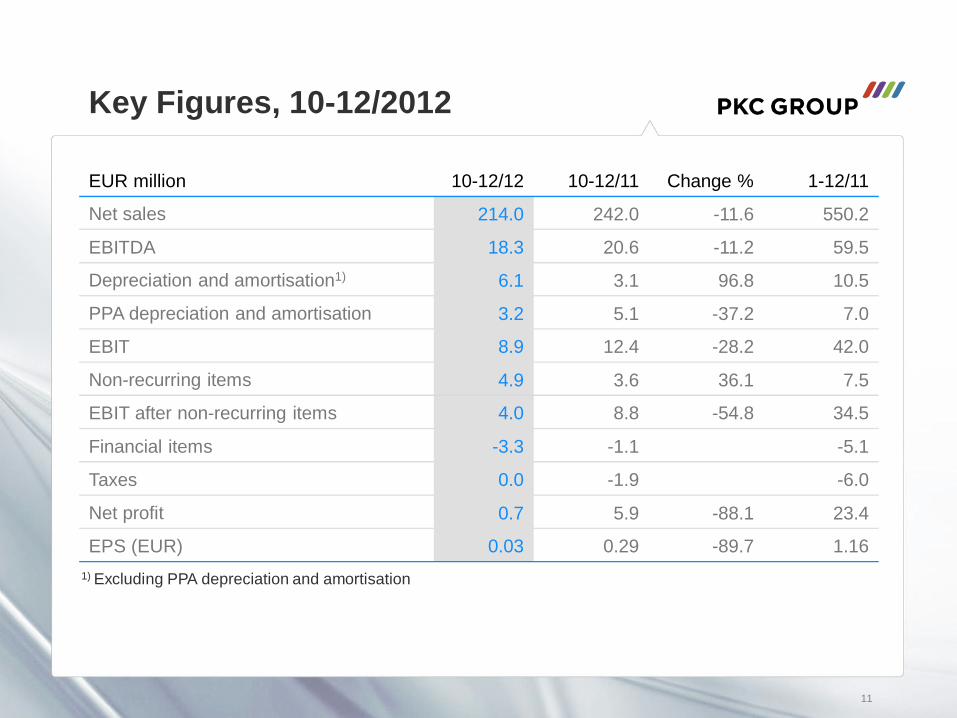
Key Figures, 10-12/2012
EUR million 10-12/12 10-12/11 Change % 1-12/11
Net sales 214.0 242.0 -11.6 550.2
EBITDA 18.3 20.6 -11.2 59.5
Depreciation and amortisation1) 6.1 3.1 96.8 10.5
PPA depreciation and amortisation 3.2 5.1 -37.2 7.0
EBIT 8.9 12.4 -28.2 42.0
Non-recurring items 4.9 3.6 36.1 7.5
EBIT after non-recurring items 4.0 8.8 -54.8 34.5
Financial items -3.3 -1.1 -5.1
Taxes 0.0 -1.9 -6.0
Net profit 0.7 5.9 -88.1 23.4
EPS (EUR) 0.03 0.29 -89.7 1.161) Excluding PPA depreciation and amortisation

12
Key Figures, 12/2012
EUR million 12/12 12/11 Change %
Goodwill 30.6 29.8 2.7
Intangible assets 43.2 50.1 -13.8
Property, plant and equipment 94.3 113.6 -17.0
Others 36.3 27.9 30.1
Total non-current assets 204.5 221.4 -7.6
Inventories 87.5 110.5 -20.8
Trade receivables 84.6 104.0 -18.7
Cash and cash equivalents 87.2 52.3 66.7
Others 21.3 20.7 2.9
Total current assets 280.6 287.4 -2.4
Total assets 485.1 508.8 -4.7

13
Key Figures, 12/2012
EUR million 12/12 12/11 Change %
Total equity 164.5 152.5 7.9
Total non-current liabilities 130.7 205.6 -36.4
Trade payables 75.5 90.8 -16.9
Other current liabilities 114.3 59.9 90.8
Total current liabilities 189.8 150.7 25.9
Total liabilities 320.5 356.3 -10.0
Total equity and liabilities 485.1 508.8 -4.7

14
Key Figures, 1-12/2012
EUR million 1-12/12 1-12/11 Change %
Net cash from operating activities 76.0 40.0 90.0
Cash flow after investments 63.7 -50.2
Net working capital 72.6 100.1 -27.5
Net debt 56.6 110.7
ROI, % 16.7 18.9
Equity ratio, % 33.9 30.0
Gearing, % 34.4 72.6
No. of employees at closing 19,759 21,895 -9.8

15
Net Sales
Adjusted EBITDA % and EBIT %
Net Sales by Geographical Areas
Key Figures, 1-12/2012
EUR million
Illustrated net of non-recurring items, %
Adjusted EBITDAIllustrated net of non-recurring items, EUR million
EUR million

16
Cash Flows after InvestmentsNet Investments
Return on Investment (ROI), %
Key Figures, 1-12/2012
EUR million EUR million
%
Earnings per Share (EPS)EUR

17
Personnel
R&D Personnel
Key Figures, 1-12/2012
-9.8%at the end of report period
at the end of report period
Personnel
R&D Expenditures
EUR millionat the end of report period

18
Wiring Systems Business Segment
18

19
Key Financials, Wiring Systems
EUR million 1-12/12 1-12/11
Net sales 858.8 477.2
EBIT before non-recurring items 53.5 42.5
% of net sales 6.2 8.9
Non-recurring items 6.4 7.0
EBIT 47.1 35.5
EUR million 10-12/12 10-12/11
Net sales 196.1 224.5
EBIT before non-recurring items 8.7 13.7
% of net sales 4.4 6.1
Non-recurring items 3.5 5.0
EBIT 5.2 8.7

20
Net Sales, Wiring Systems
EUR million

Adjusted EBIT, Wiring Systems
21
Illustrated net of non-recurring items
EUR million

Key Customer Segments
• Trucks & Buses
• Light vehicles
• Engines
• Recreational Products
• Agricultural, Forestry and Construction Equipment
22

23
North America BrazilEurope
MediumTrucks
HeavyTrucks
PKC Group Truck Market Share Globally
PKCOther
Source: ACT report, January 2013, LMC Automotive forecasting Q4/2012. Note: Europe comprised of EU27 + Efta
Class 8
Class 5-7
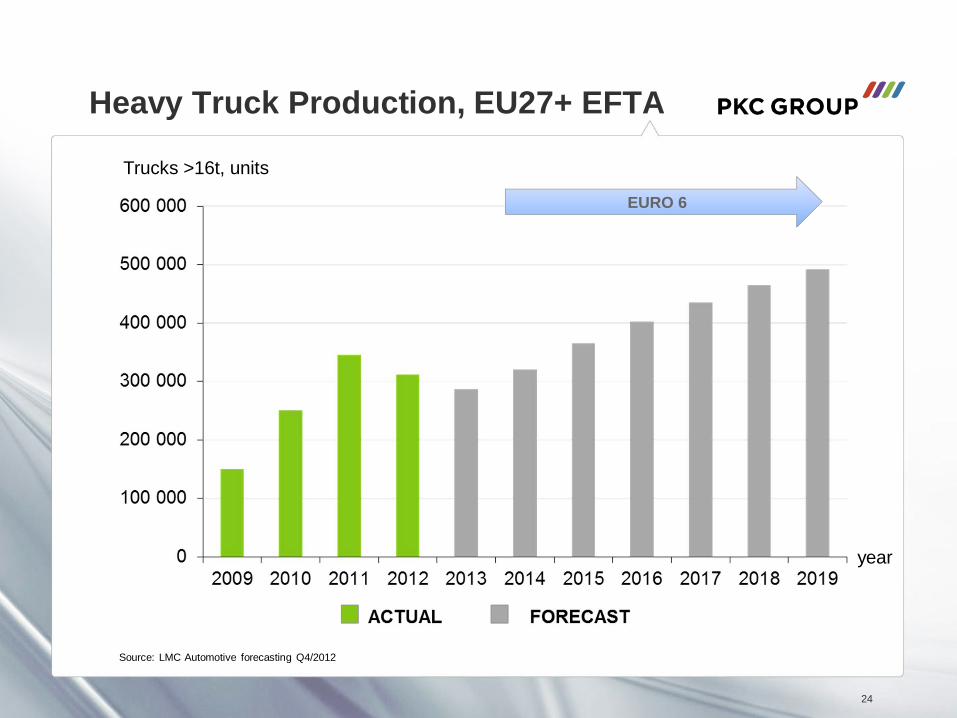
Heavy Truck Production, EU27+ EFTA
24
Trucks >16t, units
Source: LMC Automotive forecasting Q4/2012
EURO 6
year

Medium Truck Production, EU27+ EFTA
25
Trucks <16t, units
Source: LMC Automotive forecasting Q4/2012
EURO 6
year

Heavy Truck Production, North America
26
Trucks >16t, units
Source: LMC Automotive forecasting Q4/2012
EPA 2014
year

Medium Truck Production, North America
27
Trucks <16t, units
Source: LMC Automotive forecasting Q4/2012
EPA 2014
year

Light Vehicle (Pick-up and SUV) Production, North America
28
Units
Source: LMC Automotive forecasting Q4/2012
year

Heavy Truck Production, Brazil
29
Source: LMC Automotive forecasting Q4/2012
Trucks >16t, unitsEURO 5 (Brazil)
year

Medium Trucks Production, Brazil
30
Source: LMC Automotive forecasting Q4/2012
Trucks <16t, unitsEURO 5 (Brazil)
year

Electrical Distribution Systems, EDS
• Electrical Distribution Systems are responsible for power supply and transfer of information
• Manufacturing for heavy and light vehicles, buses, recreational vehicles as well as agricultural, forestry and construction equipment
• EDS are tailored to the customer-specific requirements and they must work under all conditions
• Strong experience in mass producing product variations (synchro-production)
• Factories in Brazil, China, Estonia, Germany, Mexico, Poland, Russia and Ukraine
3131
Batch harnesses
Engine harnesses
Chassis harnesses
Instrument harnesses
ABS cable
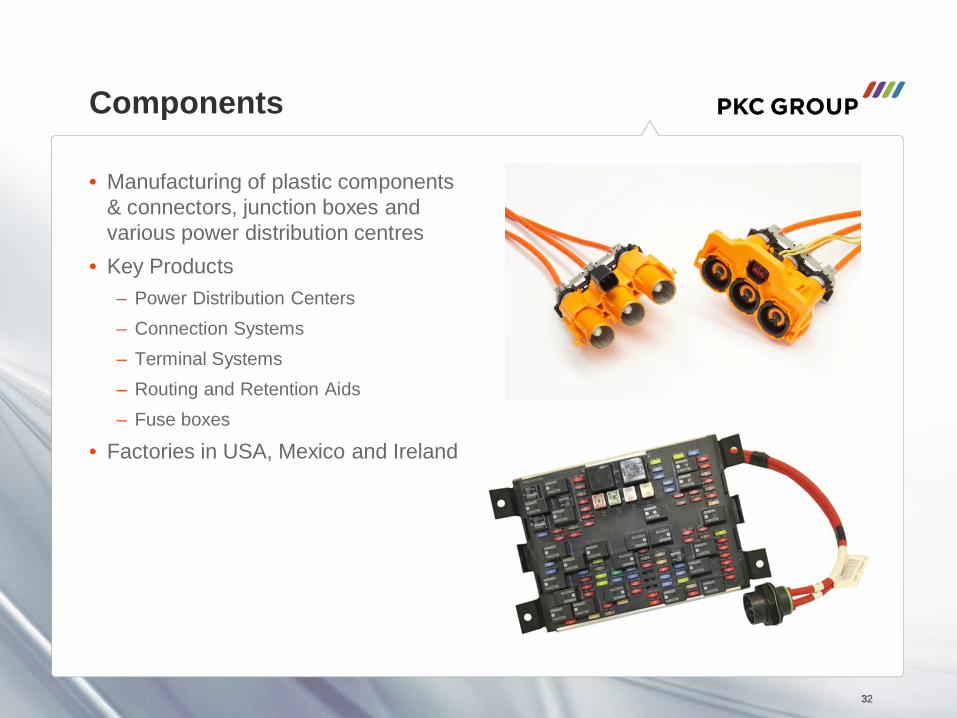
Components
• Manufacturing of plastic components & connectors, junction boxes and various power distribution centres
• Key Products– Power Distribution Centers– Connection Systems– Terminal Systems– Routing and Retention Aids– Fuse boxes
• Factories in USA, Mexico and Ireland
3232
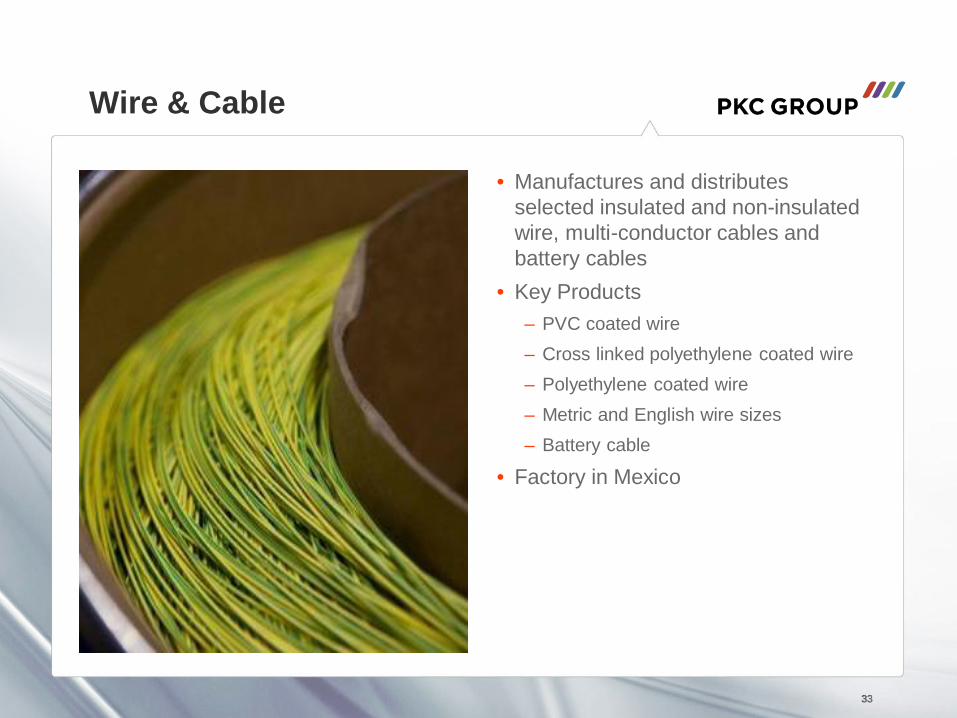
Wire & Cable
• Manufactures and distributes selected insulated and non-insulated wire, multi-conductor cables and battery cables
• Key Products– PVC coated wire– Cross linked polyethylene coated wire– Polyethylene coated wire– Metric and English wire sizes– Battery cable
• Factory in Mexico
3333

34
Electronics Business Segment
34

35
Key Financials, Electronics
EUR million 1-12/12 1-12/11
Net sales 69.4 73.0
EBIT before non-recurring items 2.1 2.8
% of net sales 3.1 3.9
Non-recurring items 1.4 0.5
EBIT 0.8 2.4
EUR million 10-12/12 10-12/11
Net sales 17.8 17.5
EBIT before non-recurring items 1.0 0.1
% of net sales 5.3 0.6
Non-recurring items 1.1 0.3
EBIT -0.2 -0.2

36
Net Sales, Electronics
EUR million

Adjusted EBIT, Electronics
37
Illustrated net of non-recurring itemsEUR million

38
Electronics Segment, 1-12/2012
• The economic uncertainty in Europe and industrial investment cautiousness of companies globally affected the demand for electronic appliances.
• Volumes of renewable-energy and energy saving products including smart grid solutions on the market continued to be good.
• The increased use of electronics in vehicles has increased the demand of vehicle electronics accordingly.

Electronics Business
• Provides design and manufacture services to industrial electronics, telecommunications and energy industries
• Products are used e.g. in power control for machinery, the testing of electronic products and for energy-saving
• The service concept includes services covering the product’s whole life-cycle
• Innovative design and product development services in Finland and China
• Factories in Finland, China and Russia
3939

Products and Industrial Segments
Products • Power supply units
• Electronics control units
• Testing equipment
• Electronics service devices
• Vehicle computers
• Security products
Industrial Segments• Energy
• Industrial electronics
• Telecommunication
• Security
40

Outlook for the Future
41

42
Market Outlook
• European heavy and medium truck production is estimated to decrease by 8% compared to 2012. The general economic uncertainty is estimated to keep the commercial vehicle demand in Europe at a lower level especially during the first half of 2013. In the second half, the production volumes are estimated to increase due to transition to Euro 6 emission standard.
• North American heavy duty truck production is estimated to decrease by 5%, medium duty truck production to increase 10% and light vehicle production to remain at 2012 level. It is estimated that the production volumes of trucks will increase gradually throughout the year.
• Brazilian heavy duty truck production is estimated to increase by 14% and medium duty truck production by 48% compared to 2012. The governmental incentive program to support the purchase of new trucks is ongoing. The continuation of the program is decided during year 2013. The continuation of the program may have an impact on the production volumes.
• PKC’s market outlook is further impacted by some light vehicle and component programs that are near end-of-life-cycle and will be ramped-down in 2013.
• Industrial investment cautiousness of companies globally is estimated to keep the demand of industrial electronic appliances not more than on a current level. Volumes of renewable-energy and energy saving products including smart grid solutions are likely to remain good.

43
PKC Group’s Outlook
• PKC Group estimates its full year 2013 net sales to be lower than in 2012 and estimates its comparable operating profit excluding non-recurring items to reach 2012 level.
• In 2012 PKC’s net sales were EUR 928.2 million and comparable operating profit excluding non-recurring items was EUR 51.5 million.

Events after the Financial Year
44
• PKC puts emphasis on Asia, President & CEO to relocate to Hong Kong.
• PKC is establishing NPI-centers (New Program Introduction-centers) in Keila, Estonia and Curitiba, Brazil.
• PKC has decided to close the operations in Ireland and transfer its production to other existing facilities in Mexico and Germany.
• PKC Group is studying the options for its metal stamping manufacturing site in Traverse City, Michigan, USA, including the potential sale of the business and its operations.

Shareholders 31.12.2012
45
8,853 owners
Major shareholders %
Ilmarinen Mutual Pension Insurance Company 10.2
AS Harju Elekter 6.4
OP-Focus Non-UCITS Fund 3.2
Varma Mutual Pension Insurance Company 2.7
Takanen Jorma 2.7
OP-Finland Small Firms Fund 2.4
Laakkonen Mikko 1.9
ODIN Finland 1.6
Nordea Nordic Small Cap Fund 1.4
Eestilä Matti 1.4
Fondica Nordic Micro Cap 1.3
Mutual Fund Evli Finnish Equity 1.2
OP-Delta Fund 1.1
Tukinvest Oy 1.0
Savings Bank Finland Fund 0.9
Total 39.4

46
Thank You!
www.pkcgroup.com