pitch perception, production and musical development of
TRANSCRIPT

1
Pitch Perception, Production
and Musical Development of
Hearing Impaired Children
Sian Edwards
UCL Ear Institute
November 2013
A thesis submitted to UCL for the degree of Doctor of
Philosophy
In the UCL faculty of Brain Sciences
2
DECLARATION
I, Sian Edwards confirm that the work presented in the thesis is my own.
Where information has been derived from other sources, I confirm that this
has been indicated in the thesis.
Signed: ………………………………………………………………….

3
ABSTRACT
Children with cochlear hearing loss are offered a range of intervention
devices to manage their hearing impairment. The most common devices
fitted are hearing aids, cochlear implants or a combination of both (bimodal
stimulation with a cochlear implant on one ear and hearing aid on the other).
The main goal of these devices is to improve listening and communication for
speech and language development. However in more recent years additional
focus has been given to non-speech sounds such as music. Pitch is an
important aspect of music because it carries the melody; however it is
represented differently by the different devices used. The impact this has on
children’s musical ability is not fully understood. This thesis explores this
area and aims to determine if groups of hearing impaired children who use
different intervention devices have a differential impact on pitch perception,
singing and general musical ability.
The primary research question addressed within the thesis was, do
differences exist between different groups of hearing-impaired children who
use different amplification devices for general musical ability, pitch
perception and singing ability?.Fifty seven children aged between 4 and 9
years old (15 Cochlear implantees, 21 hearing aid users, 8 children with
bimodal stimulation and 13 normally hearing children) were assessed for
pitch perception and singing while their parents completed a questionnaire
on their general musical ability. Results indicated that children using purely

4
electrical stimulation (bilateral cochlear implants) performed more poorly for
pitch perception, than children using acoustic information either through
bilateral hearing aids or bimodal stimulation. This result was not
demonstrated for singing competency, however a reduced comfortable
singing range and greater voice irregularity was observed for the cochlear
implantees when singing. Normally hearing children performed better with
respect to pitch perception and singing competency but did not show a
significantly better score for musical enjoyment or involvement in comparison
to all three hearing impaired groups. The results indicate that the bimodal
configuration could provide some benefits for pitch perception for hearing-
impaired children that have useable residual hearing. This doesn’t however
extend to pitch production in terms of singing competency. The findings
derived from this research study are important not only to build on current
research literature but also to inform future clinical practice.

5
TABLE OF CONTENTS
DECLARATION ............................................................................................. 2
ABSTRACT ................................................................................................... 3
LIST OF FIGURES ........................................................................................ 8
LIST OF TABLES ........................................................................................ 13
CHAPTER 1 : INTRODUCTION ................................................................ 15
1.1 AIM OF THE RESEARCH .................................................................................... 17 1.2 RESEARCH QUESTIONS ................................................................................... 17 1.3 OUTLINE OF CHAPTERS ................................................................................... 18
CHAPTER 2 : BACKGROUND ................................................................ 20
2.1 PITCH PERCEPTION IN A NORMALLY FUNCTIONING AUDITORY SYSTEM .............. 20 2.1.1 PLACE PITCH PERCEPTION ........................................................................... 21 2.1.2 TEMPORAL PITCH PERCEPTION ..................................................................... 24 2.1.3 PITCH PERCEPTION OF TONAL STIMULI.......................................................... 25 2.2 THE DEVELOPMENT OF PITCH PERCEPTION ...................................................... 29 2.2.1 PRENATAL DEVELOPMENT ........................................................................... 29 2.2.2 INFANT DEVELOPMENT (UNDER 5 YEARS OLD) ............................................... 32 2.2.3 DEVELOPMENT THROUGHOUT SCHOOL YEARS .............................................. 34 2.2.4 IMPACTS OF MUSIC INSTRUCTION .................................................................. 37 2.3 MUSIC PRODUCTION IN A NORMALLY FUNCTIONING AUDITORY SYSTEM ............ 40 2.4 THE DEVELOPMENT OF SINGING ...................................................................... 41 2.5 CONSEQUENCES OF COCHLEAR HEARING IMPAIRMENT ON PITCH PERCEPTION IN
MUSIC .................................................................................................................... 42 2.5.1 PHYSIOLOGICAL CONSEQUENCES OF COCHLEAR HEARING LOSS ................... 43 2.5.2 PERCEPTUAL CONSEQUENCES OF IHC AND OHC DAMAGE ............................ 45 2.5.3 PITCH PERCEPTION WITH COCHLEAR HEARING LOSS .................................... 48 2.6 SPEECH AND MUSIC DIFFERENCES ................................................................... 48 2.7 HEARING DEVICES AVAILABLE FOR INDIVIDUALS WITH COCHLEAR HEARING LOSS
49 2.7.1 HEARING AIDS ............................................................................................. 50 2.7.2 COCHLEAR IMPLANTS .................................................................................. 52 2.7.3 COMBINED ELECTRIC-ACOUSTIC STIMULATION ............................................. 56 2.8 SINGING WITH HEARING IMPAIRMENT ............................................................... 61 2.9 MUSICAL BEHAVIOURS AND APPRECIATION WITH HEARING IMPAIRMENT ........... 63

6
2.10 EFFECTS OF MUSICAL TRAINING ON PITCH PERCEPTION AND PRODUCTION WITH
HEARING IMPAIRMENT ............................................................................................. 64 2.11 GAPS IN RESEARCH EVIDENCE ...................................................................... 65
CHAPTER 3 : THE OPTIMISATION, VALIDATION AND NORMATIVE
DATA COLLECTION FOR THE MUSICAL STAGES PROFILE (MSP)
QUESTIONNAIRE ....................................................................................... 67
3.1 INTRODUCTION ............................................................................................... 67 3.2 METHODS ....................................................................................................... 73 3.2.1 PHASE ONE- EXPERT REVIEW:...................................................................... 74 3.2.2 PHASE TWO- PILOT STUDY: .......................................................................... 75 3.2.3 PHASE THREE– AGE APPROPRIATE NORMATIVE DATA: .................................. 76 3.2.4 ANALYSIS .................................................................................................... 78 3.3 RESULTS ........................................................................................................ 80 3.3.1 MSP QUESTIONNAIRE VALIDITY .................................................................... 80 3.3.2 MSP QUESTIONNAIRE RELIABILITY ................................................................ 83 3.3.3 PHASE THREE - AGE APPROPRIATE REFERENCE CENTILE CURVES ................... 84 3.4 DISCUSSION ................................................................................................... 86 3.5 CONCLUSION .................................................................................................. 88
CHAPTER 4 : PILOT STUDY ................................................................... 90
4.1 INTRODUCTION ............................................................................................... 90 4.2 METHODS ....................................................................................................... 92 4.2.1 PARTICIPANTS ............................................................................................. 92 4.2.2 MATERIALS .................................................................................................. 92 4.2.3 PROCEDURE ................................................................................................ 98 4.3 RESULTS ........................................................................................................ 98 4.4 DISCUSSION ................................................................................................. 104 4.5 CONCLUSION ................................................................................................ 106
CHAPTER 5 : PITCH PERCEPTION, PITCH PRODUCTION AND
MUSICAL ABILITY OF HI CHILDREN ...................................................... 107
5.1 INTRODUCTION ............................................................................................. 107 5.2 METHODS ..................................................................................................... 111 5.2.1 ETHICS APPROVAL ..................................................................................... 113 5.2.2 RECRUITMENT ........................................................................................... 114 5.2.3 GATHERING OF INFORMATION ..................................................................... 114 5.2.4 TEST SESSION ONE ................................................................................... 114 5.2.5 PARTICIPANTS ........................................................................................... 116 5.2.6 DATA COLLECTION AND ANALYSIS ................................................................ 120 5.3 MUSICAL DEVELOPMENT MEASURED USING THE MSP .................................... 120 5.3.1 METHOD .................................................................................................... 120
7
5.3.2 RESULTS ................................................................................................... 122 5.3.3 DISCUSSION .............................................................................................. 136 5.4 PITCH PERCEPTION (MEASURED VIA PMMA TEST BATTERY) ........................... 138 5.4.1 METHODS .................................................................................................. 138 5.4.2 RESULTS ................................................................................................... 139 5.4.3 DISCUSSION .............................................................................................. 147 5.5 PITCH PRODUCTION (MEASURED VIA CHILD SINGING ASSESSMENT AND
LARYNGOGRAPH) .................................................................................................. 148 5.5.1 METHOD .................................................................................................... 148 5.5.2 RESULTS ................................................................................................... 151 5.5.3 DISCUSSION .............................................................................................. 161 5.6 RELATIONSHIPS BETWEEN RESULTS .............................................................. 164 5.6.1 METHODS .................................................................................................. 164 5.6.2 RESULTS ................................................................................................... 165 5.6.3 DISCUSSION .............................................................................................. 170
CHAPTER 6 : DISCUSSION AND CONCLUSIONS ............................... 173
6.1 DISCUSSION ................................................................................................. 173 6.1.1 TEST BATTERY SELECTION ......................................................................... 173 6.1.2 PITCH PERCEPTION IN MUSICAL CONTEXTS FOR HI CHILDREN ....................... 177 6.1.3 PITCH PRODUCTION IN MUSICAL CONTEXTS FOR HI CHILDREN ..................... 180 6.1.4 MUSIC ENJOYMENT AND APPRECIATION FOR HI CHILDREN ........................... 183 6.1.5 LIMITATIONS OF THE RESEARCH .................................................................. 184 6.2 CONCLUSIONS .............................................................................................. 185 6.2.1 FUTURE DIRECTIONS .................................................................................. 187
ABBREVIATIONS ..................................................................................... 189
ACKNOWLEDGEMENTS ......................................................................... 191
BIBLIOGRAPHY ....................................................................................... 193
APPENDICES ............................................................................................ 222
Word Count (excluding Abbreviations, Bibliography and Appendices): 38,211
words

8
LIST OF FIGURES
FIGURE 1. CROSS SECTION OF THE COCHLEA, DETAILING BASILAR MEMBRANE AND
ORGAN OF CORTI. TAKEN FROM P33 (MOORE 2008) .................................. 21
FIGURE 2. A SNAPSHOT OF BASILAR MEMBRANE DISPLACEMENT, IN RESPONSE TO
PURE TONES OF TWO DIFFERENT FREQUENCIES. THE PEAK IN THE WAVEFORM
FOR EACH FREQUENCY REPRESENTS THE DISTANCE ALONG THE BASILAR
MEMBRANE WHERE THERE IS MAXIMAL DISPLACEMENT FOR THE RESPONSE,
THIS IS THE OPTIMAL RESONANT FREQUENCY FOR THAT TONE. FOR 2000 HZ
THE PEAK OF RESPONSE FALLS NEAR TO THE BASAL END AND FOR THE 200 HZ
THE PEAK IS NEARER TO THE APEX. TAKEN FROM P72 (PLACK 2005) ........... 22
FIGURE 3. AN ILLUSTRATION OF A COMPLEX TONE COMPOSED OF PURE TONES AT
HARMONIC FREQUENCIES. TAKEN FROM P24 (PLACK 2005) ........................ 26
FIGURE 4. THE SPECTRUM AND CORRESPONDING AUDITORY FILTER BANKS FOR A
COMPLEX TONE CONSISTING OF A NUMBER OF HARMONICS WITH FUNDAMENTAL
FREQUENCY OF 100HZ. TAKEN FROM P139 (PLACK 2005) ......................... 28
FIGURE 5. DISTRIBUTION OF AGES FOR THE 324 CHILDREN FOR WHICH MSP
QUESTIONNAIRES WERE COMPLETED IN PHASE THREE ................................ 77
FIGURE 6. SEVEN CENTILES OF MSP TOTAL SCORE FROM AGE 2 TO108 MONTHS,
BASED ON THE LMS CURVES GENERATED BY LMS METHOD IN
LMSCHARTMAKER .................................................................................. 85
FIGURE 7. CENTILE CHARTS FOR EACH SEPARATE DOMAIN (A SOUND AWARENESS,
B MELODY & DYNAMICS, C RHYTHM AND D EMOTIONAL ASPECTS) CONTAINED
WITHIN THE MSP QUESTIONNAIRE FROM AGE 2 TO 108 MONTHS, BASED ON
THE LMS CURVES GENERATED BY THE LMS METHOD IN LMSCHARTMAKER . 85

9
FIGURE 8. TOTAL MSP SCORE FOR RESPONDENTS ON REFERENCE CENTILE CHART
............................................................................................................ 100
FIGURE 9. RELATIONSHIP BETWEEN AVERAGE FUNDAMENTAL FREQUENCY FROM
LARYNGOGRAPH TRACE (HZ) AND IOE ASSIGNED HABITUAL SPEECH PITCH
CENTRE ................................................................................................ 103
FIGURE 10. RESEARCH STAGES AND STUDY PROTOCOL FOR THE MAIN STUDY
PHASE. ................................................................................................. 113
FIGURE 11. MEAN TOTAL MSP SCORES FOR EACH INTERVENTION GROUP (BCI,
BHA, BMS AND NH) ............................................................................. 123
FIGURE 12. MEAN SCORES FOR MSP SOUND AWARENESS DOMAIN ACROSS THE
FOUR GROUPS (BCI, BHA, BMS, NH) .................................................... 124
FIGURE 13. MEAN SCORES FOR MSP MELODY & DYNAMICS DOMAIN ACROSS THE
FOUR GROUPS (BCI, BHA, BMS, NH) .................................................... 125
FIGURE 14. MEAN SCORES FOR MSP RHYTHMICAL CHANGES DOMAIN ACROSS THE
FOUR GROUPS (BCI, BHA, BMS, NH) .................................................... 125
FIGURE 15. MEAN SCORES FOR MSP EMOTIONAL ASPECTS DOMAIN ACROSS THE
FOUR GROUPS (BCI, BHA, BMS, NH) .................................................... 126
FIGURE 16. RESPONDENT MSP TOTAL SCORES RELATED TO CHRONOLOGICAL AGE
ON REFERENCE CENTILE CHART. THE LINES DEPICT DIFFERENT CENTILE LEVELS
AND THE SYMBOLS RELATE TO INDIVIDUAL CHILDREN FROM EACH OF
INTERVENTION GROUPS (NH, BCI, BMS AND BHA) ................................. 128
FIGURE 17. RESPONDENT DOMAIN SCORES (A-SOUND AWARENESS, B-MELODY &
DYNAMICS, C-RHYTHMICAL CHANGES AND D- EMOTIONAL ASPECTS) IN
RELATION TO CHRONOLOGICAL AGE ON REFERENCE CENTILE CHART. THE LINES
DEPICT DIFFERENT CENTILE LEVELS AND THE SYMBOLS RELATE TO INDIVIDUAL

10
CHILDREN FROM EACH OF INTERVENTION GROUPS (NH, BCI, BMS AND BHA)
............................................................................................................ 130
FIGURE 18. RESPONDENT MSP TOTAL SCORES RELATED TO EXPRESSIVE
VOCABULARY AGE ON REFERENCE CENTILE CHART. THE LINES DEPICT
DIFFERENT CENTILE LEVELS AND THE SYMBOLS RELATE TO INDIVIDUAL
CHILDREN FROM EACH OF INTERVENTION GROUPS (NH, BCI, BMS AND BHA)
............................................................................................................ 132
FIGURE 19. RESPONDENT DOMAIN SCORES (A-SOUND AWARENESS, B-MELODY &
DYNAMICS, C-RHYTHMICAL CHANGES AND D-EMOTIONAL ASPECTS) RELATED
TO DEVELOPMENTAL AGE ON REFERENCE CENTILE CHART. THE LINES DEPICT
DIFFERENT CENTILE LEVELS AND THE SYMBOLS RELATE TO INDIVIDUAL
CHILDREN FROM EACH OF INTERVENTION GROUPS (NH, BCI, BMS AND BHA)
............................................................................................................ 133
FIGURE 20. MEAN TONE RAW SCORE ACROSS THE FOUR GROUPS (BCI, BHA, BMS
& NH) .................................................................................................. 140
FIGURE 21. RHYTHM RAW SCORE ACROSS THE FOUR GROUPS (BCI, BHA, BMS&
NH) ..................................................................................................... 144
FIGURE 22.RELATIONSHIP BETWEEN IOE ASSIGNED HABITUAL SPEECH PITCH
CENTRE FREQUENCY AND AVERAGE SPEECH FUNDAMENTAL FREQUENCY
OBTAINED FROM LARYNGOGRAPH TRACES. BOTH TAKEN FROM A SECTION OF
CHILDREN COUNTING BACKWARDS FROM 10 AS PART OF THE NSP CHILD
SINGING ASSESSMENT ............................................................................ 153
FIGURE 23. COMFORTABLE SINGING RANGE (IN SEMITONES) ACROSS THE GROUPS
............................................................................................................ 154

11
FIGURE 24. NORMALISED SINGING SCORE (NSS) FOR THE DIFFERENT GROUPS OF
CHILDREN ............................................................................................. 155
FIGURE 25. CFX SHOWING SPREAD OF IFX FOR EACH SEPARATE GROUP (A-BCI, B-
BHA, C-BMS AND D-NH) ..................................................................... 156
FIGURE 26. CQX SHOWING SPREAD OF IQX FOR EACH SEPARATE GROUP (A-BCI,
B-BHA, C-BMS AND D-NH) .................................................................. 157
FIGURE 27. IFX (%) ACROSS THE FOUR GROUPS (BCI, BHA, BMS AND NH) .... 158
FIGURE 28. IQX (%) ACROSS THE FOUR GROUPS (BCI, BHA, BMS AND NH) ... 159
FIGURE 29 .Q-Q PLOTS COMPARING OBSERVED IFX DATA POINTS TO EXPECTED
PROBABILITIES FOR EACH GROUP (A-BCI, B-BHA, C-BMS AND D-NH) ..... 160
FIGURE 30.Q-Q PLOTS COMPARING OBSERVED IQX DATA POINTS TO EXPECTED
PROBABILITIES FOR EACH GROUP (A-BCI, B-BHA, C-BMS AND D-NH) ..... 161
FIGURE 31. RELATIONSHIP BETWEEN MSP MELODY AND DYNAMIC CHANGES
DOMAIN SCORE AND PMMA TONE RAW SCORE. ...................................... 166
FIGURE 32. RELATIONSHIP BETWEEN MSP RHYTHMICAL CHANGES DOMAIN AND
PMMA RHYTHM RAW SCORE .................................................................. 166
FIGURE 33. RELATIONSHIP BETWEEN MSP EMOTIONAL ASPECTS DOMAIN SCORE
AND PMMA TONE RAW SCORE ............................................................... 167
FIGURE 34. RELATIONSHIP BETWEEN MSP MELODY AND DYNAMIC CHANGES
DOMAIN SCORE AND NSP CHILD SINGING ASSESSMENT NORMALISED SINGING
SCORE ................................................................................................. 168
FIGURE 35. RELATIONSHIP BETWEEN PMMA TONE RAW SCORE AND NSP CHILD
SINGING ASSESSMENT NORMALISED SINGING SCORE .............................. 169

12
FIGURE 36. RELATIONSHIP BETWEEN SUCCESSIVE VOCAL FOLD VIBRATIONAL
FREQUENCY IRREGULARITY (IFX) AND VOCAL FOLD CONTACT PHASE
IRREGULARITY (IQX) .............................................................................. 170

13
LIST OF TABLES
TABLE 1. MSP ITEMS FALLING BELOW 65% AGREEMENT CRITERIA IN EXPERT
REVIEW DOMAIN ALLOCATION .................................................................... 82
TABLE 2. PAIRED SAMPLES T-TEST RESULTS COMPARING EACH SEPARATE DOMAIN
IN THE MSP FOR QUESTIONNAIRES COMPLETED AT THE TWO TIME POINTS .... 83
TABLE 3. MEASURES OF TEST-RETEST RELIABILITY ............................................ 84
TABLE 4. RAW MEAN SCORES (OUT OF 40) FOR EACH AGE GROUP ON PMMA TASKS
............................................................................................................ 101
TABLE 5. PERCENTAGE DISTRIBUTION OF APTITUDE LEVELS (LOW, MEDIUM AND
HIGH) ASSIGNED BY PMMA TEST MATERIALS BASED ON NORMATIVE VALUES
FOR TOTAL PILOT SAMPLE ....................................................................... 102
TABLE 6. NHS RECRUITMENT SITES FOR THE STUDY ....................................... 116
TABLE 7. INCLUSION AND EXCLUSION CRITERIA FOR HI CHILDREN INCLUDED IN
STUDY .................................................................................................. 117
TABLE 8. DEMOGRAPHIC INFORMATION FOR GROUPS INCLUDED IN THE STUDY ... 119
TABLE 9. DEMOGRAPHIC INFORMATION FOR GROUPS WHERE PARENTS HAD
COMPLETED THE MSP ........................................................................... 121
TABLE 10. DISTRIBUTION OF RESPONDENT TOTAL MSP SCORES WITHIN EACH
CENTILE OF THE MSP REFERENCE CENTILE CHART (FOR CHILD’S
CHRONOLOGICAL AGE) ........................................................................... 128
TABLE 11. DISTRIBUTION OF RESPONDENT SCORES IN EACH MSP DOMAIN WITHIN
EACH CENTILE ON THE MSP REFERENCE CENTILE CHART (FOR CHILD’S
CHRONOLOGICAL AGE). COUNT VALUES AND PERCENTAGES ARE SHOWN ... 131

14
TABLE 12. DISTRIBUTION OF RESPONDENT TOTAL MSP SCORES WITHIN EACH
CENTILE OF THE MSP REFERENCE CENTILE CHART (FOR EXPRESSIVE
VOCABULARY AGE – 47 RESPONDENTS)................................................... 134
TABLE 13. DISTRIBUTION OF RESPONDENT SCORES IN EACH MSP DOMAIN WITHIN
EACH CENTILE ON THE MSP REFERENCE CENTILE CHART (FOR
DEVELOPMENTAL AGE – 47 RESPONDENTS) ............................................. 135
TABLE 14. DEMOGRAPHIC INFORMATION FOR GROUPS INCLUDED IN PMMA
DATASET ............................................................................................... 139
TABLE 15. RAW MEAN PITCH SCORE (OUT OF 40) FOR EACH AGE GROUP (BASED ON
CHRONOLOGICAL AGE) ON PMMA TASK .................................................. 141
TABLE 16. RAW MEAN PITCH SCORE (OUT OF 40) FOR EACH AGE GROUP (BASED ON
DEVELOPMENTAL AGE) ON PMMA TASK* ................................................. 142
TABLE 17. RAW MEAN RHYTHM SCORE (OUT OF 40) FOR EACH AGE GROUP (BASED
ON CHRONOLOGICAL AGE) ON PMMA TASK ............................................. 145
TABLE 18. RAW MEAN RHYTHM SCORE (OUT OF 40) FOR EACH AGE GROUP (BASED
ON DEVELOPMENTAL AGE) ON PMMA TASK* ............................................ 146
TABLE 19. DEMOGRAPHIC INFORMATION FOR GROUPS WHO COMPLETED THE NSP
CHILD SINGING ASSESSMENT ................................................................. 150

15
CHAPTER 1 : INTRODUCTION
Music forms an integral part of our modern society; it is important in
educational, developmental and social domains (Trehub 2003). Music can
influence many different areas of our lives, and in turn can impact directly on
quality of life. A quote from Ludwig van Beethoven (1934) illustrates this
point perfectly:
"Music is a higher revelation than all wisdom and philosophy. Music is the
electrical soil in which the spirit lives, thinks and invents” (Ludwig van
Beethoven 1934)
In all societies around the world, a substantial amount of time is spent
listening to music. It is important to understand the extent of self-exposure to
music because it provides an indication of the different functions and
importance of music within society. Sloboda (2009) suggested that there are
six main activities for listening to music within western culture. These are:
when travelling (e.g. in the car, walking), conducting physical work (e.g.
cleaning, cooking), brain work (e.g. private study, reading), body work (e.g.
exercise), emotional work (e.g. mood management) or attendance at live
musical performance. Within these activities four recurring functions are
observed: distraction, entertainment, energizing and meaning enhancement
(Denora 2000). With such a wide range of potential uses it is likely that
different individuals use music in their own ways depending on their lifestyle
and interests.

16
As children develop, they are encouraged to get involved in musical activities
because of the pleasure it could bring and the importance it has on
educational and emotional development. In the United Kingdom (UK) music
forms part of the national curriculum for the education of children aged from
5 to 16 years old (Department of Education 2013). It is expected that the
developing child will improve their level of ability as they develop through the
educational “key stages”.
Music enjoyment is a holistic experience and people respond differently to
the diverse range of instruments and artists. However there are key
elements that make up the majority of musical pieces and if these can be
analysed separately it can provide information on the critical aspects for
perception. Pitch is considered to be the most important aspect of music
because it relates to the delivery of melody information (Chasin and Russo
2004). Other attributes of music also play their part, such as rhythm and
timing, dynamic changes in level and the timbre of the musical instruments or
voices.
For hearing-impaired (HI) children music delivery is altered due to the
limitations due to their hearing loss and also the hearing instrument (cochlear
implants, (CI) and hearing aids, (HA)) that they use. Hearing instruments are
designed and fitted in order to improve hearing abilities with respect to
speech perception (Flynn et al. 1996; Geers 1997; Geers and Moog 1991;
Osberger et al. 1991; Snik et al. 1997; Somers 1991; Wilson 2000; Wilson
and Dorman 2008a; Wilson and Dorman 2008b). However the signal

17
processing approaches used in the hearing instruments could detrimentally
affect pitch perception and production of music (McDermott 2004). This area
has not been extensively researched because historical focus has been on
enhancing speech perception rather than non-speech stimuli such as music.
1.1 Aim of the research
The primary aim of this research project was to determine if different
amplification devices (bilateral CIs (BCIs), bilateral HAs (BHAs) and bimodal
stimulation (BMS)) for hearing impairment (HI) have differential impact on
pitch perception, pitch production and general musical ability in children.
Comparison was also made between HI groups and a normal hearing (NH)
group of children of the same age. These aims were undertaken within the
thesis as the main study phase.
An additional aim was to ensure (wherever possible) that the materials used
as a means of assessment within the main study phase were validated and
provided a base of normative or baseline values for typically developing
children. This was undertaken through a questionnaire validation study and a
pilot study prior to the main study phase.
1.2 Research Questions
Do differences exist between different groups of HI children using
different amplification devices for their hearing loss in terms of general
musical ability, pitch perception and singing ability?

18
Are there differences in general musical ability, pitch perception and
singing ability between HI and NH children
1.3 Outline of chapters
In Chapter 2 literature covering pitch perception and production in both a
normally functioning auditory system and an auditory system with HI is
reviewed. In this chapter pitch development in childhood, the consequences
of HI, the common amplification devices for HI and the effects that those
devices may have on pitch are discussed. The chapter also covers musical
appreciation and enjoyment of HI listeners and the impact musical training
can have.
As an additional research aim was to use validated measures within the main
study phase of the research, validation of the Musical Stages Profile (MSP)
questionnaire is presented in Chapter 3. The chapter also describes the
collection of normative data and the creation of reference centile curves for
the MSP questionnaire. Within Chapter 4 a pilot study is described, where
feasibility of the main study phase protocol and test materials were examined
with a group of NH children.
The final experimental chapter, Chapter 5, gives details of the main study
phase. In this chapter results are presented on the pitch perception, singing
and general musical ability of both NH and HI children. Interactions between
perception, production and musical abilities are also discussed within the

19
chapter. In chapter six results are synthesized and discussed, conclusions
are then drawn and an indication of directions for future research is given.
20
CHAPTER 2 : BACKGROUND
2.1 Pitch Perception in a Normally Functioning Auditory System
According to the American National Standards pitch is defined as: “that
attribute of auditory sensation in terms of which sounds may be ordered on a
scale extending from low to high. Pitch depends primarily on the frequency
content of the sound stimulus, but also depends on the sound pressure and
the waveform of the stimulus.” (ANSI 1994).
Pitch is the perceptual correlate of fundamental frequency. Within the
musical context, pitch is associated with musical melody information,
harmony and key (Chasin and Russo 2004). It is seen as the most important
perceptual acoustic dimension for categorising musical pieces (Patel 2008).
In order to understand the way in which pitch is processed within the auditory
system it is necessary to explore the differing theories and proposed models
associated with pitch perception for both pure and complex tones (Plack
2005).
The physiology of the auditory system is such that sound signals that enter it
pass through the outer, middle and inner ear. It isn’t until reaching the inner
ear that frequency analysis and coding takes place. There are two main
theories (place and temporal) for encoding pitch, and it is thought that both
could be employed to achieve satisfactory pitch perception over a wide range
of frequencies.

21
2.1.1 Place Pitch Perception
The “place” method for frequency coding is attributed to the structure of the
basilar membrane and can account for perception of a range of frequencies.
The basilar membrane (BM) divides the cochlea, and aligned along its length
is the organ of corti, containing sensory hair cells which stimulate auditory
nerve fibres (see figure 1). The inherent mechanical features of the BM
(width, thickness and stiffness) enable each point along it to have a unique
resonating frequency; organised tonotopically from apex to base .i.e.
different frequency components have maximum excitation at different points
along the BM when the sound wave travels along its length as seen in figure
2.
Figure 1. Cross section of the cochlea, detailing basilar membrane and organ
of corti. Taken from P33 (Moore 2008)

22
Figure 2. A snapshot of basilar membrane displacement, in response to pure
tones of two different frequencies. The peak in the waveform for each
frequency represents the distance along the basilar membrane where there
is maximal displacement for the response, this is the optimal resonant
frequency for that tone. For 2000 Hz the peak of response falls near to the
basal end and for the 200 Hz the peak is nearer to the apex. Taken from p72
(Plack 2005)
Directed towards each point along the basilar membrane are a number
corresponding neurons synapsing with inner hair cells (IHC’s) in that region.
The vibration of the basilar membrane causes stereocilia of IHC’s to
depolarize which in turn stimulates the auditory nerve fibres directed at that
point on the basilar membrane. The BM performs a spectral analysis and this
can be modelled as if there were a series of overlapping band-pass filters
each tuned to a particular frequency. These filters are referred to as “auditory
filters” (Moore 2008) and the centre frequency of each one is known as the
“characteristic frequency”. Neural activity relating to the stimulation is not
represented by one individual auditory nerve fibre but by a distribution of

23
responses by a population of neurones. This pattern of neural activity is
known as the excitation pattern.
This frequency analysis is enhanced by an active tuning process attributed to
the outer hair cells (OHC’s) of the organ of corti. OHC’s change shape, and
their steorocilia bundles move in response to stimulation, which both lead to
an increase in displacement of the travelling wave. This results in a
sharpening of the excitation pattern around the characteristic frequency
giving rise to the differing widths of auditory filters along the basilar
membrane. Examination of agents affecting OHC functions has shown a loss
of this active mechanism. The work of Ruggero and Rich (1991)
demonstrated that the OHCs were responsible for this tuning. They
conducted a study where furosemide was injected into the BM of a chinchilla.
Furosemide was chosen because of its known adverse effect on OHC
motility. Results from their study showed that the frequency selectivity and
sensitivity of the system to detect sounds significantly decreased in response
to tones and clicks presented in cases where the furosemide was injected.
These results therefore demonstrated that mechanical responses of the BM
are dependent upon the normal function of the organ of Corti and OHC’s
(Ruggero & Rich 1991).
The tonotopic organisation demonstrated by the basilar membrane and
nerve fibre organisation is preserved through structures to the higher centres
of the auditory pathway and are present within the primary auditory cortex in

24
both cerebral hemispheres (Bendor & Wang 2005). Therefore ‘place pitch’
originates in the BM and is maintained up the auditory pathway.
2.1.2 Temporal Pitch Perception
The second theory of frequency coding is attributed to the behaviour of
neural firings over time, and is known as “temporal” coding. IHC stereocilia
excitation is based on the shearing motion between stereocilia and the
tectorial membrane caused by the vibrating basilar membrane. As a result
nerve fibres synchronise to fire at a particular phase of basilar membrane
vibration relating to the stimulating waveform, this is known as “phase
locking” (Plack 2005). Frequency information is extracted from the period
between successive firing patterns which therefore has a relationship to the
stimulus frequency.
Extraction of temporal information provides accurate low frequency coding
however cannot convey frequencies above 5kHz due to two limitations. The
first is based on the fact that each individual neuron has a recovery period
after firing which limits excitation to an upper frequency limit of 1kHz. Due to
a population of neurons firing, timing information can be averaged across
multiple neurons phase locking to encode excitation of frequencies up to
5kHz after which breakdown of phase locking occurs.
25
2.1.3 Pitch Perception of Tonal Stimuli
Pure tones are rarely found in the real world. They are made up of sinusoidal
variations in pressure over time, with a frequency spectrum with energy at
only a single frequency. They are regarded as the basic units of most sounds
and by summing them together in phase; complex waveforms are created
(Plack 2005). The frequency of a pure tone refers to a waveform’s repetition
rate and correlates to the perceived pitch, through combinations of both
place and temporal methods. The method is dependent on the frequency of
the pure tone (Moore 2008).
Complex tones are made up of more than one pure tone (see figure 3), in
which a number of frequency components are present which may evoke a
pitch sensation. Complex tones are extremely common and the ability to
extract pitch information from a mixture of frequencies is important,
especially for music perception.

26
Figure 3. An illustration of a complex tone composed of pure tones at
harmonic frequencies. Taken from p24 (Plack 2005)
Early research reported that the pitch of complex tones was based on the
frequency of the lowest harmonic, “the fundamental frequency” (Ohm 1843).
However later evidence demonstrated that pitch could still be evoked when
this harmonic had either been removed (Schouten 1938), or masked by
noise (Licklider 1956). This indicates that it must be possible for pitch
information to be extracted from higher harmonics.
A variety of different models have been put forward to explain pitch
perception of complex tones in the auditory system. Generally these have
been related to the duality of place and temporal coding and therefore fall

27
into two main types – “pattern recognition” models (Goldstein 1973; Terhardt
1974; Wightman 1973) and “temporal” models (Schouten 1940).
2.1.3.1 Pattern Recognition Models
Pattern recognition models propose that extraction of pitch is achieved by
using the pattern of frequencies within resolved harmonics to derive the
fundamental frequency (Cheveigne 2005). The resolution of harmonics is
dependent on the frequency i.e. harmonic number, with low harmonics being
resolved on the basilar membrane and higher harmonics being unresolved.
Resolved harmonics are individually separated out as each harmonic would
fall within a different auditory filter. When the travelling wave passes further
along the basilar membrane multiple higher harmonics fall within individual
auditory filters so that they are no longer individually separated out (see
figure 4) (Plack 2005). The constraint of pattern recognition models is that
they offer no explanation on how pitch is extracted from solely unresolved
harmonics (Moore 2008).

28
Figure 4. The spectrum and corresponding auditory filter banks for a complex
tone consisting of a number of harmonics with fundamental frequency of
100Hz. Taken from p139 (Plack 2005)
2.1.3.2 Temporal Models
Temporal models propose that extraction is achieved through combinations
of nerve fibre firings of both resolved and unresolved harmonics. This
difference in resolution with higher harmonics means that pitch may be
represented either by phase locking to individual low resolved harmonics, or
by neurones phase locking to the envelope resulting from the interaction of
the higher unresolved harmonics (Cheveigne 2005). Smith et al (2002)
conducted a study which investigated the perceptual importance of envelope
versus fine structure information. They synthesized stimuli which have an
envelope of one sound and the fine structure of another, naming them
‘auditory chimaeras’. They were able to demonstrate that the envelope was
most important for speech reception, and the fine structure information was
most important for sound localisation and pitch perception.

29
The importance of fine structure information is confirmed as it has been
shown that pitch is dominated by components derived from resolved
harmonics (Plack et al. 2005) thus supporting a pattern recognition theory.
However as reported previously pitch can still be perceived from just
unresolved harmonics therefore implying that combinations of both models
can be used.
Based on the models described above literature would suggest that a
combination of both pattern recognition and temporal models are used for
perception of both speech and music. However the fine structure
(represented by resolved harmonics on the basilar membrane) is of
paramount importance to musical pitch perception
2.2 The Development of Pitch Perception
2.2.1 Prenatal Development
The development of perception associated with music begins in the prenatal
period, with the acquisition of perceptual, cognitive, motor and emotional
skills. Prior to birth all human sensory systems begin to function (Hepper
1992) but hearing is regarded as the dominant sense, with the cochlea
processing sounds from approximately 20 weeks gestation. At 25 weeks
gestation the cochlea structure is fully formed but the sensory cells and
connections continue to develop (Bibas et al 2008).
30
The assessment of the perceptual abilities of foetuses have been carried out
with observation of foetal reaction and show that at 19 weeks gestation
reaction to 500Hz tones can be observed. The frequency range then extends
into the lower frequencies and then into the higher frequencies as the foetus
develops (Hepper and Shahidullah 1994). In the Hepper and Shahidullah
(1994) study the authors conducted a behavioural experiment which
examined foetal reactions (between 19 and 35 weeks gestation) to pure tone
auditory stimuli at 100, 250, 500, 1000, and 3000 Hz. A loudspeaker was
placed on the mother’s abdomen and foetal movement was recorded via an
ultrasound scanner. By approximately 27 weeks gestation there were
responses to 100, 250 and 500Hz stimuli. By weeks 33-35 the foetus
responded to the higher frequencies (1000 and 3000Hz). Results of this
study confirm that as the cochlea develops the range of acoustic information
available to the foetus is enriched allowing greater discrimination of acoustic
patterns that are important for pitch perception.
By 36 weeks gestation, the foetus has been shown to be responsive to
external sounds and can discriminate between familiar and different
speakers. Decasper et al. (1994) showed that foetuses of 36 weeks were
able to discriminate between their mother’s voice and the voice of a female
stranger. This was demonstrated by examining foetal heart-rate changes in
response to a tape recording of a speaker reciting a child’s rhyme. There
were two speakers one was the mother the second was a control. The same
result was observed by Kisilevsky et al. (2003) where they measured an
increase in foetal heart rate (from mean heart rate prior to voice onset) when

31
a recording of the mother’s speech was played; whereas the heart rate
decreased with a recording of unfamiliar voice.
Although discrimination does improve in the foetus with maturation, it is
restricted until birth due to the anatomical constraints. The amniotic fluid
causes an amplification (of approximately 30dBA) in the spectral range
between 100-1000Hz (Richards et al. 1992). This acts as a low-pass filter
and means that vowels are usually more audible than consonants and
fundamental frequency contours are enhanced more than broad spectral
information (Smith et al. 2003).
By the time the foetus reaches full term (40 weeks gestation) discrimination
between different vowel sounds and the processing of auditory sound
streams associated with speech or music have been shown to be present
(Granier-Deferre et al. 2011). In this study Granier-Deferre and colleagues
(2011) assessed heart rate changes in 82 foetuses during sleep. They
presented 5 stimuli altogether: a silent control, two different piano melodies,
a natural Icelandic sentence and a chimera of a sentence where spectral
information was removed. All auditory stimuli elicited heart rate change
(deceleration), and there was a significant difference between conditions
indicating discrimination and processing of the different complex stimuli in
this stage of foetal development.
It has been demonstrated that the early development of the hearing
mechanism ensures that the foetus begins perceptual learning associated

32
with musical pitch perception prior to birth, whether sounds are generated
internally or externally to the mother’s body.
2.2.2 Infant Development (Under 5 years old)
Infants are immersed in rich auditory environments from birth, which helps to
develop their expertise as listeners, especially within their home and cultural
settings (Hargreaves 2009). Unlike in the prenatal period, examination of
infant’s perceptual abilities can be carried out using both behavioural and
objective measures.
The perceptual abilities of neonates at birth show that they are able to
process and discriminate a mixture of simple and complex auditory signals.
Behavioural measures demonstrate that newborns are able to distinguish
their mother’s voice from that of other females (Eimas et al. 1971;Kuhl et al.
1992), as was also found for the prenatal period. Electrophysiological studies
examining high density evoked potentials of neonates in a sleeping state
show that relevant phonetic information is extracted from noise (Dehaene-
Lambertz and Pena (2001) and discrimination of changing pitch contours is
possible from a very early age (Carral et al 2005).
At 2 months of age melody recognition and discrimination has been acquired
(He et al. 2007; Plantinga and Trainor 2009). He and colleagues (2007)
investigated the emergence of discriminative responses to pitch changes in
melodies. This was achieved by recording electroencephalogram (EEG)
responses from 39 infants (between 2-4 months old) to pitch changes in

33
piano tones. Responses to the deviant tones were significantly different from
responses to standard tones, indicating discrimination of the pitch change.
Plantinga and Trainor (2009) assessed 16, 2-3 month old infants. In this
study an eye-movement preference procedure was used to distinguish
discrimination and memory of melodies using stimuli created on an acoustic
piano and played through a computer and speaker system. Results from the
study confirmed the presence of pitch and melody discrimination abilities in
infants of this age.
In addition to melody recognition and discrimination, perception of other
musical attributes is possible during the early months of life. Baruch and
Drake (1997) showed that infants at 2 months old can discriminate tempo
changes in tone sequences. Other researchers have also shown rhythmic
pattern discrimination at this very early developmental stage (Demany et al.
1977).
By 3 months of age it has be shown that infants display frequency resolution
abilities in line with adults for low frequency stimulation (Werner and
Vandenbos 1993). This was demonstrated by tracking eye-movement to
short melody sequences and examining discrimination between melody
sequences. This frequency resolution is assumed to be accurate enough for
processing music (Trehub 2003).
The development of the acoustic perception abilities described above can be
attributed to infant sound exposure. Young infants are often spoken to by

34
carers using modified speech patterns; this type of speech is referred to as
“Infant Directed Speech (IDS)” (also called motherese or parentese). IDS is
characterised by exaggerated prosody, raised voice fundamental frequency,
expanded pitch contours, larger dynamic range and rhythmic regularity
(Clark 2009; Fernald 1991). A number of early studies have investigated
infant’s reactions to IDS by observing infant gaze patterns to loudspeakers
playing both IDS and conventional adult speech (Cooper and Aslin 1990;
Fernald 1985; Werker and McLeod 1989). The infants’ abilities and
preferences shown in these studies along with others previously noted
confirms that pitch extraction and understanding is an inherent attribute
which develops further with experience throughout infancy.
As demonstrated by the above studies basic pitch perception aspects such
as pitch discrimination are processed very early in development (i.e. in
infancy). These basic aspects form the basis of development of higher-level
pitch structures, such as musical scales and harmony, which, are common to
western music. It does however take considerable experience for cultural
specific scales to arise such as tonal hierarchy and this can extend into the
school years (Trainor and Unrau 2012).
2.2.3 Development throughout School Years
The way in which children develop musically is variable, and can depend
upon individual differences such as innate abilities and environmental
experience. As children develop through the school years, their perception of
musical elements (such as pitch and rhythm) becomes more accurately

35
measurable through assessment of singing and musical improvisation
(Lamont 1998).
Evidence of pitch development is split into different areas. The main
difference in the research methods literature is whether enquiry is focussed
on fundamental pitch capacities such as absolute pitch detection and
labelling pitch height; or whether melodic and harmonic relationships
between notes are investigated. Assessment of relationships between
pitches has been identified as being important for pitch perception within
musical contexts Takeuchi and Hulse 1993).
Absolute pitch detection may be acquired during the school years for some
children (Takeuchi and Hulse 1993). Young children seem to be able to
perceive pitch height however they have difficulty labelling it. This mismatch
is attributed to the fact that the terminology used to describe the relationships
between musical and verbal concepts takes time to learn and understand
(Costa-Giomi and Descombes 1996).
There is evidence that by 6 or 7 years of age children may have pitch
identification accuracy that is similar to that observed in adults when
detecting mistuned harmonics or melodies (Trainor and Trehub 1994; Trehub
et al 1986). Trehab et al. (1986) conducted a study examining the sensitivity
of the semitone and musical scale structure by infants and children. Testing
was conducted with infants (aged between 9 and 11 months of age) and
children (aged 4 to 6 years old) using a five note melody sequence, in a

36
same-different task. The experiment results indicated that older children
(aged between 4 and 6 years old) were better than infants in detecting
semitone changes within musical scales. The infant group detected semitone
change in all positions, however in contrast to the older group the infants
were not influenced by whether they were presented within a musical scale.
The findings suggested that infants and children can discriminate a semitone
in musical contexts and that priority of diatonic structures emerges by 4 to 6
years of age. In a later study Trainor and Trehub (1994) investigated the role
of key membership and implied harmony in a group of 18 adults (aged
between 17 and 39 years old) and 84 children (42 aged 5 years old, 42 aged
7 years old). Listeners in all three groups were evaluated on their ability to
detect three types of changes in one note of a melody (the three changes
being out-of-key, out-of-harmony and within-harmony). Results showed that
adults and 7 year olds performed better on out-of-key and out-of-harmony
changes than within-harmony changes which reflects their ability to use
knowledge of key membership and implied harmony. The younger group (5
year olds) performed better on the out-of-key change than the other two
changes. This reflects the influence of key membership but not implied
harmony in the younger sample.
The understanding of pitch and tonality has been shown to speed up with
musical training as well as with age, however only by a small margin (Lamont
1998; Morrongiello and Roes 1990). Morrongiello and Roes (1990)
conducted a study where two groups of children (one group of 5 year olds
and the second group of 9 year olds) were assessed by asking them to draw

37
melodic contours or patterns of rising or falling pitches. Children were split
into groups based on their level of musical training. Their results showed that
at both ages musically trained children performed slightly better than there
untrained peers. Lamont (1998) examined children’s listening skills
associated with musical pitch. 408 children were recruited from two primary
schools and two secondary schools. Participants were aged between 6 and
16 years of age and were tested using probe-note method. The note
sequences consisted of seven diatonic scale notes with three different probe
notes to be rated for goodness of fit. The three probe notes were the tonic
(scale note), median (scale note) and the flattened submediant (non-scale
note). Children were played 26 different sequences whereby a gap followed
with one of the probe notes. The participants were asked to decide whether
this probe note was a suitable next note in the melody. Following the
listening task participants were asked to answer questions relating to their
musical background, age, class and gender. The results showed that
differentiation amongst categories of probe tones were different between
three main age groups (6-8, 8-11 and 11-16) and within the broad age
groups mentioned better performance was linked with experience. Lamont’s
(1998) results indicate that children (aged 6-16) are able to identify pitch in
music; and pitch sensitivities increase as children mature and with musical
experience.
2.2.4 Impacts of Music Instruction
Cognitive transfer is when individuals transfer knowledge learnt and applied
in one context to another new context. Music instruction has been shown to

38
improve pitch perception abilities however there is also evidence that other
areas of cognitive reasoning may also be affected (Rauscher 2009).
The relationship between music instruction and cognitive processing triggers
debate as currently, studies in the area cannot conclusively explain
relationships observed (Rauscher 2009). The majority of results are
presented as correlations but with no explanation of cause of relationships
observed.
Links have been made to cognitive skills such as sequencing, spatial
awareness, phonological awareness, reading abilities and general cognitive
performance (Anvari et al. 2002; Costa-Giomi 1999; Gromko and Poorman
1998; Hurwitz et al. 1975; Rauscher et al. 1997; Rauscher and Zupan 2000;
Schellenberg 2004).One of the earliest studies examined sequencing and
spatial skills associated with instrumental instruction (Hurwitz et al 1975) and
involved children aged 6 and 7 years old randomly allocated to one of two
groups: one receiving music instruction five days a week for seven months
and the other which acted as the control and did not receive any training.
Outcomes included sequencing and spatial tasks as well as tasks of verbal
intelligence. Significantly higher scores were seen by the experimental group
for sequencing and spatial tasks but not for the verbal tasks. It was noted
however that the positive effect observed could be attributed to the
Hawthorne effect (McCarney et al. 2007), that is, an effect which observes
participant’s improving performance solely because they are being studied
and not due to the experimental parameters.
39
A later study was conducted by Rauscher (1997) to control for this effect. A
similar style assessment with pre-school children was conducted where
children’s spatial reasoning was tested with four tasks from the Performance
sub-test of the Wechsler Preschool and Primary Scale of Intelligence. There
were three groups: one with music instruction, one with computer instruction
using software designed to teach reading and simple arithmetic skills and
one without any instruction. The music group was further split into two where
half had individual keyboard instruction and the other group singing
instruction. After several months children were assessed using the spatial
and sequencing tasks. Significantly higher scores were seen for the
keyboard music group for spatial tasks only, however no significant
differences were seen for all the other children assessed. This raises another
question concerning whether it is just instruction that causes the effect seen.
Other skills which may be enhanced by music instruction include general
cognitive performance (Rauscher et al. 1997); phonological awareness and
reading abilities as demonstrated by Anvari (2002) in a study examining 100,
four and five year olds. A link between musical ability and general
intelligence has been demonstrated (Schellenberg 2004). Schellenberg
(2004) tested 144 six year olds split into two music groups (keyboard and
singing lessons) and two control groups (drama lessons and no lessons).
General intelligence was assessed before and after musical instruction and
was shown to be significantly higher in both experimental groups. A later

40
review of this study attributes the positive result gained to development of
spatial intelligence (Rauscher 2009).
The findings from these related studies, although taken with caution, give an
interesting perspective in children’s development as the sound categorisation
used to distinguish music from speech may have shared mechanisms (Patel
2008). The influence of confounding variables e.g. socio-economic
background, exposure to extra-curricular activities etc should however be
considered and has not within these reported studies.
2.3 Music Production in a Normally Functioning Auditory System
The term music production covers a wide range of musical abilities, such as
improvisation, playing an instrument and singing. This review will focus
predominantly on singing. This has been selected based on the recognised
correlation of singing abilities to perception skills in particular with reference
to pitch (Murbe et al. 2002). The vocal tract, larynx and lungs are considered
to function as a musical instrument when singing.
Many characteristics of the vocalisation of singing are similar to those used for
speech production. The human vocal tract is used to form the phonemes in a similar
way for both speech and singing but the nature of the specific articulatory closures
may be modified in singing to optimise the acoustic delivery of the sound. During
singing production the sounds are typically voiced unless whispering is used for
dramatic effect. In singing production, the vocal apparatus is used to create a wider
41
range of frequencies, larger dynamic level changes and many more duration
contrasts than are typically used for speech production (Sundberg 1987).
2.4 The Development of Singing
From an early age both at home and in school, infants are both exposed to
and encouraged to participate in singing activities. Parents will often use
lullabies to help to calm a child at night time, or nursery rhymes or activity
songs for enjoyment (Trehub et al. 1997). This early exposure not only
provides enjoyment, comfort and singing development, but also facilitates
speech perception, production and rehabilitation (Wan et al 2010).
Prior to the 1970’s singing skills were assessed and categorised and children were
labelled as either “musical” or “unmusical”. Within school settings if children were
considered to be singing ‘out of tune’ they were categorised as “unmusical” and
were not offered further musical training (Good et al. 1997). Davies and Roberts
(1975; 1976) shifted the thinking away from this approach, recognising that all
children had the potential to improve and develop their singing abilities with training.
Welch (1985) suggested that singing ability for all typically developing children falls
on a continuum where children acquire their singing skills by passing through well-
defined developmental stages. With singing training this development can be
accelerated and also the bypass the original endpoint.
There is a wide range and variability in children’s singing skills. The time taken for
children to reach musical developmental milestones can vary across children
(Leighton and Lamont 2006). Welch et al. (1996; 1997) conducted a longitudinal

42
study to map singing skills of 5 year old children over a period of 3 years.
Improvements in melodic test battery scores (Matching individual pitches, echoing
melodic contours and copying small melodic fragments) were observed as children
developed. Welch et al (1996; 1997) suggested that these results provide evidence
that singing is a developmental process that is continuously changing. Two major
studies have drawn on the developmental theories on singing development and
have proposed phased models (Rutkowski 1997; Welch 1998). Both models were
generated from systematic evaluations of singing behaviours (one in US and one in
the UK) and agree that different phases of singing competency are exhibited from
any group of children. These phases range from speech-like chanting up to the
demonstration of expanded vocal pitch ranges that is allied with skilled competency
in vocal pitch matching. The development of a child’s singing has been found to be
constrained by natural ability, training and anatomical features; as well as
perceptual ability (Welch 2006).
2.5 Consequences of Cochlear Hearing Impairment on Pitch
Perception in Music
This section focuses on the mechanisms associated with severe-profound
cochlear HI only, because this is of relevance to the research carried out.
Individuals with sensori-neural HI are more likely to have poorer pitch
perception than their NH peers. There are different potential causes of this
and a large variability in ability between listeners, potentially due to different
configurations of hearing loss and underlying residual abilities (Moore and
Carlyon 2005a; Moore and Carlyon 2005b).

43
HAs and CIs aim to improve speech perception and address other
perceptual difficulties; however, due to underlying perceptual limitations
based on the effects of hearing loss, they cannot restore normal perception.
In addition to this, the processing in both HAs and CIs will affect the
perception of certain parameters in their own way due to their specific
approaches to signal analysis and delivery. This will be explained further
later in this chapter.
2.5.1 Physiological Consequences of Cochlear Hearing Loss
Cochlear hearing loss is responsible for a number of changes that affect
representation of sound stimulation in the auditory system (Moore 2008).
Most commonly this is attributed to damage to the sensory hair cells within
the cochlea. This takes the form of damage to either the outer hair cells
(OHCs), more rarely the inner hair cells (IHCs) or combinations of both for
more severe hearing losses (Moore 1995).
The largest consequence of OHC damage is the reduction in the
effectiveness and sometimes total loss of the active mechanism (Ruggero
1994). The normal functioning of this active mechanism gives rise to the high
sensitivity and sharp tuning of the basilar membrane (BM), all of which are
dependent on the integrity of the OHCs. The first evidence of the
vulnerability of the active mechanism within the cochlea came from studies of
responses to single neurones in the auditory nerve (Evans 1975; Evans and
Harrison 1976; Robertson and Manley 1974). In these studies, OHC function

44
was altered by restricting oxygen or by injection of ototoxic agents such as
kanamycin, cyanide and furosemide. Lack of air supply, noise exposure and
ototoxic agents all induce cochlear damage which results in HI. All the above
studies demonstrate decreases in threshold and tuning properties of the
auditory nerve response. Later animal models support this by showing
negative effects of ototoxic agents and noise on the BM (Liberman et al.
1986; Ruggero and Rich 1991).
Loss of the active mechanism results in a number of perceptual changes (in
humans) occurring in line with the physiological evidence above; these
include reduced sensitivity to weak sounds, broadening of auditory tuning
curves causing decreased frequency selectivity and loss of compressive
non-linearity of the BM input/output response leading to loudness recruitment
(Moore 1995).
IHCs are the sensory cells of the cochlea and are the transducers used to
stimulate nerve fibres. In some cases of cochlear hearing loss, IHC’s may be
absent or non-functional. In these areas corresponding auditory nerve fibres
are susceptible to death due to lack of stimulation, these particular areas are
called “dead regions” (Moore 2008). The loss of such cells means auditory
stimulation in these areas is perceived by off frequency neurones (neurones
not directed to that point on the BM), or requires a much higher intensity
level. When OHC’s are present within dead regions, the active mechanism
still functions by providing sharp tuning but at an elevated intensity level. This
has been demonstrated by Liberman et al (1986) in a series of studies in

45
which sampling the activity of different single nerve fibres with different
characteristic frequencies assessed the functional state of the cochlea.
Structural changes were observed resulting from both IHC and OHC
damage. They, however, reported that IHC damage is rare and when it is
observed it is usually teamed with OHC damage meaning that in these cases
a lack of sensitivity and loss of active mechanism is observed.
2.5.2 Perceptual Consequences of IHC and OHC damage
The changes noted above can be responsible for the perceptual
consequences listed below. These can be important for music and speech
perception:
Reduced Frequency Selectivity
There is typically a reduction in frequency selectivity (ability of the ear to
separate out different frequency components of a sound) (Plack 2005) ,which
in turn is essential for many aspects of auditory perception; these include
loudness sensitivity, frequency discrimination, speech understanding, timbre
awareness, sound source separation and pitch distinction (Moore 1995).
Individuals with cochlear HI have poorer frequency resolution due to a
reduction or loss of the active mechanism suggesting that they have broader
filtering (2 to 3 times wider auditory filters) than NH counterparts. This usually
is proportional to the extent of the individual’s HI. In this case, segregation is
degraded and poorer frequency selectivity is observed in comparison to a
normal auditory system. Studies measuring frequency difference limens

46
(DLFs) in individuals with cochlear HI compared to NH groups support this
finding (Moore and Peters 1992).
Reduction in the Precision of Phase Locking
Phase locking refers to the consistent relationship between action potential
firing in an auditory nerve fibre and the phase of the stimulating sound wave.
Phase locking forms the basis of the temporal models of pitch perception
described earlier in the chapter. Cochlear damage has differing effects on
phase locking. Harrison and Evans (1979) conducted a study where
kanamycin was used to damage OHC’s within the cochlea of a guinea pig.
They found that this had no impact on the auditory nerve phase locking. In
contrast Woolf et al (1981) conducted a similar animal study on a chinchilla,
where they found that phase locking was significantly reduced over a range
of frequencies between 400 and 3000 Hz. This effect on phase locking was
also supported by a study which examined phase locking to complex tones in
a cat (Miller et al. 1997). In this study Miller et al (1997) observed cat nerve
fibres damaged with noise when presented with a synthesized vowel. Their
results showed that fibres in the region of acoustic trauma (1–6 kHz) showed
a reduced synchrony in phase locking to formant peaks of synthesized vowel
sounds. Based on these animal studies assumptions can be made that
human individuals with cochlear hearing loss may have reduced precision of
phase locking to nerve firings, although this may not always be observed.
Support for this assumption is shown by a human study which compared the
ability of HI and NH subjects to use temporal fine structure information from
complex tones. The study investigated the use of temporal fine structure

47
information represented as a means of assessing the integrity of phase-
locking in HI subjects. Subjects were required to discriminate a non-shaped
stimuli where both spectral and temporal information was present (a tone
that contained five equal-amplitude components) from shaped stimuli where
spectral information was removed (the tone contained many components,
but were passed through a fixed bandpass filter to reduce excitation pattern
changes). If subjects were able to discriminate the shaped stimuli as
accurately as the non-shaped it would show that they were utilising temporal
cues and were not reliant on spectral cues. Results showed that HI subjects
performed more poorly than NH for the shaped stimuli indicating that they
were unable to access the fine temporal structure information with similar
accuracy to NH subjects. HI performance was improved with non-shaped
stimuli where spectral information was available (Hopkins and Moore 2007).
Loudness recruitment
Loudness recruitment refers to the abnormal growth of loudness that occurs
when people have cochlear damage. It is associated with the loss of the
active mechanism (Moore 1995). Once a sound becomes audible, the growth
in perceived loudness increases more rapidly than normal. The upper level of
comfort is typically at the same level as NH. This leads to exaggeration of
perceived dynamic qualities (loudness) with auditory signals (Moore et al.
1996).

48
Affects in Temporal Processing and Integration
For everyday sounds there are unpredictable fluctuations in amplitudes
observed. Listeners with cochlear HI may show reduction in temporal
processing and integration abilities in comparison to listeners with NH
(Carlyon et al. 1990). Poor temporal resolution is thought to occur due to a
loss of cochlear nonlinearity and compression leading to loudness
recruitment, loss of audibility and poorer frequency selectivity.. Accuracy of
temporal integration is attributed to the level of hearing loss.
All of these factors can lead to problems in discriminating and identifying
speech, music and environmental sounds (Moore 1996).
2.5.3 Pitch Perception with Cochlear Hearing Loss
The changes occurring due to cochlear damage have been shown to lead to
a decrease in pitch discrimination and to introduce inconsistencies in pitch-
scaling tasks (Moore and Carlyon 2005a). The degree to which this happens
is, however, unknown and appears unrelated to level of hearing loss (Looi
2008). The broadening of auditory filters can lead to the loss of resolution of
the fundamental frequency and resolved harmonics, thus impacting on
overall pitch quality and pitch perception abilities (Moore 1995).
2.6 Speech and Music differences
Speech and music have different acoustic characteristics and therefore HA
and CI settings that are appropriate for speech may not be optimal for music.

49
For accurate categorisation of sounds the auditory system has to develop
rules to perceive native vowels, consonants, timbre and pitches used for both
verbal communication and music appreciation (Patel 2008). Although many
perceptual attributes associated with speech can also be appropriate for
enjoying music; the perception of music can be considered more complex
because musical enjoyment is not about categorisation of individual aspects,
but is a much more holistic experience (Chasin and Russo 2004).
When considering the main reasons why the perceptual classification of
speech and music differ within the auditory system it is of interest to observe
the spectral and temporal profile produced by each. Speech is a predictable
controlled signal with restricted variability. This is because speech signals
are limited by human anatomy i.e. articulation in the human vocal tract.
Therefore there is a restricted set of outputs that it can produce in terms of
frequency, intensity and timbre. Music is typically a more complicated signal
comprised of a wider range of frequencies and dynamic amplitude changes
(Chasin and Russo 2004). Music has far fewer “universal” features than
speech because it is changeable based on instrument, singer, genre and
culture. This produces varied profiles both spectrally and temporally (Patel
2008).
2.7 Hearing Devices Available for Individuals with Cochlear Hearing
Loss
Individuals with cochlear hearing loss are offered a range of intervention
devices, their goal being to improve listening and communication. The choice

50
of interventions is often governed by level of HI, as well as individual
characteristics such as health, duration of deafness and preference. The
most common forms of intervention offered are HAs, CIs or devices
combining acoustic and electrical stimulation. Each of these devices has
different approaches to sound delivery and also different manufacturers have
their own ethos on the processing schemes and hardware to use to achieve
optimal results. In turn, the way in which these intervention methods affect
pitch perception and production in musical contexts differ (Chasin and Russo
2004). All devices are intended to enhance and improve listening and
communication situations for HI listeners.
2.7.1 Hearing Aids
A HA is comprised of components that work to pick up a signal via a
microphone, amplify it according to a prescription formula before filtering and
passing to a receiver which converts it back into an acoustic signal (Dillon
2001). HAs contain multiple filters covering the low to high frequency range
(up to 8,000Hz) to allow the amplification characteristics to be adjusted on a
channel by channel basis to provide appropriate gain for the hearing loss
(Kuk and Baekgaard 2009).
HA Prescription formulas are based on speech spectra to optimise audibility
of the critical speech frequencies (Dillon 2001). Prescriptions do not,
however, optimise frequencies across the range or allow dynamic variability
appropriate for some music signals. The range of accessible frequencies will
also be restricted by the bandwidth of the devices, which has been

51
connected with a reduction in perceived quality of music (Franks 1982).
Another area which has unknown effects on musical outputs are changes in
amplification caused by the HAs specialized speech optimizing systems
altering signal processing e.g. noise reduction and feedback suppression
(Chasin and Russo 2004).
2.7.1.1 Pitch Perception with Hearing Aids
The processing scheme used in HAs could negatively impact on melody
perception in addition to the limitations that are imposed by the hearing loss
that the HI individual has.
Hearing Aid Parameters Affecting Pitch Perception
Compression characteristics
The concept of compression within HAs dates back to 1937 (Steinberg and
Gardener 1937). Compressive amplifiers (also known as automatic gain
controls) allow individuals with sensori-neural HI access to a range of
intensities even though their dynamic range (range of audible intensities) is
restricted and loudness recruitment may be present. Compression systems
can often be helpful in musical contexts, by providing access to a larger
range of intensities when the dynamic range is limited.
There are many different ways of implementing HA compression to avoid
discomfort, reduce inter-phonemic intensity differences, make sounds
comfortably loud, normalise loudness, reduce noise and maximise speech
intelligibility. HAs combine various rationales for achieving desirable listening

52
conditions for speech perception. These are achieved by altering
compression attack/release times, compression ratios, compression
thresholds/knee points, multiple compressors for different frequency bands
or higher frequencies compressed into lower frequency ranges (Dillon 2001).
For optimal pitch perception it has been suggested that adjacent channel
compressors are set to similar levels and the compression knee points are
raised from previous settings (Chasin and Russo 2004). The evidence
supporting these recommendations is limited and very little consideration has
been given to the impact that frequency compression (FC), frequency
transposition (FT) or multi-band compression has on music.
Feedback and Noise reduction systems
Most modern HA’s have mechanisms to reduce environmental and wind
noise and prevent acoustic feedback. The algorithms differ across different
manufacturers. These features are beneficial to HA wearers in many
situations but the effect that these have on pitch perception within music is
currently unknown. It has been suggested that they appear to confuse some
high frequency musical inputs with feedback noise and therefore erroneously
reduce the intensity of those sounds (Chasin and Russo 2004).
2.7.2 Cochlear Implants
Over the past fifty years CIs have been introduced and implemented in
clinical settings as a viable (re)habilitation option for patients with severe to

53
profound HI bilaterally, who receive no or little benefit from acoustic
amplification. CIs can be implanted either unilaterally or bilaterally depending
on the individual situation. There are also individuals using bimodal
stimulation, i.e. a CI on one ear with a HA on the contra lateral ear (BMS) or
combined electro-acoustic stimulation on the same ear (EAS).
A CI is an electronic device, which transduces acoustic sound into electrical
signals, which can directly stimulate auditory nerve fibres. The purpose is to
by-pass the dysfunctional peripheral auditory apparatus to give sound
perception (Cooper 1991). Current evidence confirms improved speech
perception in quiet for severely or profoundly deaf adults and children
following implantation (McDermott 2004). However the success of musical
perception and production may be quite different.
2.7.2.1 Pitch Perception with Cochlear Implants
Research shows that cochlear implantees perform significantly worse than
NH controls in pitch-based tasks, especially for tonal languages (Lee et al.
2002; Wang et al. 2012) and with music (Looi 2008; Wang et al. 2012). Tonal
languages are of relevance as different speech characters or words are
sometimes solely categorised based on pitch.
Lee at al. (2002) examined Cantonese tone perception of 15 unilaterally
implanted Cantonese children. When compared to a matched NH group, the
CI group performed significantly worse on a task where they had to identify
Cantonese tones. A similar pattern of results was found by Wang et al (2012)

54
where NH and CI adult groups were compared on lexical tone perception
and the musical sounds in cochlear implants (MuSIC) perception test. Their
CI group performed significant worse than the NH group in tasks of pitch
discrimination, instrument identification, instrument detection and lexical tone
perception. Their lexical tone perception also positively correlated to pitch
discrimination within their CI group.
When making comparisons between CI users and HA users, CI groups show
significantly poorer scores on pitch perception tasks (Looi et al. 2008). Looi
et al (2008) conducted a study which examined pitch intervals within a music
test battery. Pitch stimuli were recordings of the vowel /a/ sung by a trained
male or female singer. Each stimulus consisted of two different notes with
the same vowel, sung by the same singer, either one octave (12 semitones),
half an octave (6 semitones), or a quarter of an octave (3 semitones) apart.
This results showed significantly poorer results for CI groups in comparison
to HA groups. In a more recent study the same researcher conducted
assessments comparing four different groups (NH, unilateral CI users,
bilateral HA users and individuals using bimodal stimulation (BMS)) (Looi
and Radford 2011). The groups were compared for speech recognition as
well as the same pitch ranking task performed in earlier studies (Looi et al.
2008). Again this study showed that children using HAs perform significantly
better than children with CIs.

55
Cochlear Implant Parameters Affecting Pitch Perception
Cochlear Implant Coding
One reason for degraded pitch perception amongst CI users can be
attributed to pitch-coding mechanism of the CI itself. Pitch associated with
music contains more “fine-grained information” than is required for speech,
where usually changes in pitch would signal gross linguistic information
unless tonal languages are being discussed (Vongpaisal et al. 2006). Most
CI speech processors extract only temporal envelope cues from auditory
stimulation, meaning that fine structure cues are missed. The fine structure
information encoded through normal cochlear auditory filters are beneficial
for good pitch perception (Smith et al. 2002; Wilson et al. 2004).
Electrode Array Placement
Electrode arrays are common to every CI system however the length of the
array and number of electrodes along the array can differ. Current CI’s range
from 12 to 22 electrodes mounted on a carrier, which is surgically implanted
in the scala tympani via the round window or cochleostomy. Most electrode
arranges range from 18-24mm and will extend into the first turn and a half of
the cochlea, although there are some which can extend up to 31mm and are
designed to follow the full length of the basilar membrane (Boyd 2011). In
order to elicit different pitch perceptions signals are filtered and directed to
different electrodes according to the frequency-place map in normal hearing,
with low frequencies being transmitted to the apical electrodes and high
frequencies to the basal electrodes (Vermeire et al 2008). However varying
insertion depths, insertion placements and mismatched frequency to place

56
stimulations can affect the accuracy of pitch perception (Baumann & Nobbe
2006, Boex et al 2006, Dorman et al 2007 and Vermeire et al 2008).
Cochlear Implant Input Frequency Range
Typically a CI input frequency range will not reach under 100Hz or above
8kHz therefore this will limit the range of achievable pitches that will be
transferred especially for music where often a wider range of frequencies are
present than what is observed in speech. This has greater impact when
frequencies are then mismatched due to electrode placement (Baskent &
Shannon 2004)
2.7.3 Combined Electric-Acoustic Stimulation
Combining electric and acoustic inputs for individuals with residual hearing in
the low frequencies gives the potential for better sound localisation, improved
speech in noise and greater perception of music (Ching et al. 2009;
McDermott 2011) because fine structure information is provided in the low
frequency region where there is good residual hearing (Smith et al. 2002). In
cases with this natural residual hearing, improvements in binaural hearing
abilities and reduction of auditory deprivation are reported (Ching et al.
2009).
There are two approaches to providing bimodal stimulation, the first by
combining a CI with a HA on the contra-lateral ear (Kong et al. 2005); the
second by using a modified shortened electrode array with acoustic

57
amplification in the same ear (Gantz et al. 2005) known as electro-acoustic
(EAS) or hybrid stimulation. EAS devices aim to amplify sounds in the low
frequencies acoustically, as a HA would and to stimulate higher frequencies
electrically, through CI electrical stimulation.
2.7.3.1 Pitch Perception with Combined Electric-Acoustic Stimulation
The limitations associated with pitch processed through CIs have been
discussed previously; however there is evidence that combining electrical
stimulation with acoustic hearing could improve outcomes (Dorman et al.
2008; Gfeller et al. 2006; Kong et al. 2005; McDermott 2011) although this is
not always demonstrated (Cullington and Zeng 2011; Looi and Radford
2011). The two may provide complimentary auditory cues for pitch
perception as CIs provide high frequency information and HAs give more
reliable fundamental frequency information (Looi 2008).
In 2005 a group of researchers investigated the melody recognition skills of
five adult BMS users (a CI on the ipsilateral ear with a HA on the
contralateral ear) (Kong et al. 2005). Participants were asked to perform
tasks with each device alone and then combined so that they received sound
stimulation bimodally. Results showed that better performance was achieved
for the melody recognition tasks with bimodal stimulation than either mode
alone. The results were attributed to the potential of the acoustic HA to
provide cues for pitch perception. It is important to note that these individuals
were experienced users of bimodal stimulation and therefore this factor could
have had an effect on results when using the modes separately. The study

58
was also conducted on a small number of adult subjects (n=5) which may not
be representative of a larger sample.
By contrast a later study conducted by Looi and Radford (2011) assessed
the pitch ranking abilities of four different groups of children aged between
six and 16 years old (NH listeners, unilateral CI users, bilateral HA users and
BMS users). They did not observe a significant difference between the
bimodal and unilateral CI participants for the pitch ranking task. They
attributed the lack of measurable benefit by their bimodal group to the fact
that children may have been experiencing conflicts in pitch changes between
their devices or that lack of maturity meant that they were unable to utilise
the information as well as post-lingually deafened adults. There were
differences between the groups in terms of aetiology of HI, with a larger
portion of the bimodal group being born prematurely and/or or suffering with
hypoxia or anoxia at birth and also a significant age difference between BMS
and CI users (with BMS users being significantly younger than the CI users)
which may of contributed to the results obtained. Cullington and Zeng (2011)
added further support to these findings because their study showed no
significant bimodal advantage in pitch perception tests either. They tested 13
BMS users and 13 bilateral CI users on four pitch related tasks: the hearing
in noise test (HINT) (Nilsson et al. 1993), the Montreal battery of evaluation
of amusia (Peretz et al. 2003), the aprosodia (prosody deficit) battery (Ross
et al. 1997) and talker identification. Their results showed no significant
differences between the bimodal and bilaterally implanted children on any of
their measures. Their adult groups were matched in age, duration of

59
deafness and speech perception performance however the BCI group had
significantly longer length of cochlear implant use (7.2 years) than the BMS
group (2.6 years) which could have had influence over the results. A lack of
measurable difference could also be attributed to the test battery sensitivity.
Based on these two studies it cannot be concluded that acoustic input from a
HA is not beneficial for pitch perception due to the group differences.
Two studies on use of EAS devices (ipsilateral acoustic and electric
stimulation) are reported by Gfeller and colleagues; one conducted in 2006
and the other in 2007. In the first study, a group of adult EAS device users
were compared to a group of adult conventional CI users for song
recognition and instrument identification. The later study compared EAS and
CI users (all adults) on pitch-ranking abilities. The results obtained on both
studies demonstrated that EAS device users had superior ability in these
tasks with a significant difference between the groups in all tasks completed
(Gfeller et al 2006; Gfeller et al 2007). Results were also compared to a third
normal hearing group, who had significantly higher scores than both HI
groups. This indicated that although the EAS device shows musical/pitch
advantages it is not to the level of NH pitch perception. A study by Golub et
al (2012) also demonstrated that adult EAS users performed better in
musical tasks. They conducted a study using EAS and conventional CI users
(all adults) and they were compared on measures of spectral and temporal
sensitivity (spectral-ripple discrimination, temporal modulation detection,
Schroeder-phase discrimination andclinical assessment of music perception
(Kang et al. 2009)). For spectral-ripple discrimination 500ms stimuli were

60
generated either in standard or inverted ripple form. In order to determine
spectral-ripple resolution threshold an adaptive forced choice paradigm was
used. Temporal modulation detection was attained by asking participants to
choose the interval containing modulated noise in a forced choice procedure.
For the Schroeder-phase discrimination test, positive and negative
Schroeder-phase stimuli pairs were created at two frequencies (50 and
200Hz) these were presented to participants again in a forced choice
procedure. The subject was asked to discriminate test from reference stimuli
in this adaptive task. The clinical assessment of music perception was used
to assess melody, timbre and pitch recognition. Participants underwent three
forced choice tasks; for pitch a complex tone pitch discrimination test was
administered at three different frequencies (262, 300 and 391Hz).
Participants were asked to select the highest frequency in a 1-up and 1-down
tracking procedure; for timbre a musical instrument identification test was
undertaken, instruments included piano, guitar, clarinet, saxophone, flute,
trumpet, violin and cello; and for melody participants were asked to
discriminate different familiar melodies e.g. “twinkle twinkle” in a 12 forced
choice task. Their results showed that EAS users’ performance on clinical
assessment of music perception pitch test and spectral-ripple discrimination
was significantly better than the CI alone group. The temporal modulation
detection, melody and timbre clinical assessment of music perception tests
and Schroeder-phase discrimination test showed no significant difference
between groups (Golub et al. 2012). These results suggest that some benefit
may be observed for BMS users for spectral discrimination but not for
temporal discrimination.

61
Current research suggests that bimodal stimulation (BMS and EAS devices)
could be beneficial for musical tasks associated with pitch perception. There
are, however, few studies on pitch perception for children.
2.8 Singing with Hearing Impairment
The issues discussed in the previous sections not only affect direct perception of
sound but also the auditory feedback process, which has an impact on monitoring
and adjusting production (Murbe et al 2002). It is therefore logical to assume that
these factors may in turn affect singing abilities.
Xu et al. (2009) demonstrated that cochlear implantees perform significantly poorer
than NH matched peers on singing skill. They assessed 7 children with CIs aged
between 5 and 12 years old against a control group of 14 NH children aged
between 4 and 8 years old. They asked all children to sing a song of the child’s
choice and recorded the production. The fundamental frequency (F0) of each note
in the recorded songs was extracted for acoustic analyses. The children with CIs
showed significantly poorer performance in the pitch-based singing assessments
compared to the NH children. They attributed this lack of ability to the unsatisfactory
perception of musical pitch. One limitation of the study was that children were asked
to select the song they wanted to sing which led to a variety of different songs being
chosen. Therefore variation in song choices meant musical structures were
inconsistent across the whole sample which could have influenced the accuracy of
evaluation.

62
A later study conducted by Wang and Huang (2010) compared the pitch perception
and pitch production of 14 CI children aged between 2 and 9 years of age. The
children’s perception was assessed through a same-different task; and their
production was assessed by asking them to vocalise the musical tones after
listening to the same notes vocalised by a female speaker. The results suggested
that the CI children were able to discriminate musical notes two or more semitones
apart. However their musical production showed significantly lower fundamental
frequency than the original sounds heard. Subjective analysis of vocal production
also showed poor pitch contour recognition. This therefore suggests that CI
children’s pitch production does not necessarily reflect their perceptual ability. This
study was conducted on a small sample of mandarin speakers which could have
influence on interpreting and comparing results to western children who are not
regularly exposed to tonal language.
On the basis of these studies, it could be suggested that individuals using HAs or
BMS may have better singing abilities than individuals using just electric stimulation
via CIs. Direct evidence could not be found within the literature to support this with
the paediatric population. Ching et al. (2007) predicted that BMS stimulation would
lead to a group of adult users demonstrating a better voice quality. Nittrouer and
Chapman (2009) predicted improvements in speech and language development for
the paediatric population using BMS.
Psychoacoustic experiments can give insights into actual perception and production
skills, but there is also the important psychological component of musical
appreciation and enjoyment.

63
2.9 Musical Behaviours and Appreciation with Hearing Impairment
By observing enjoyment and appreciation of music it can give an insight into
patient perspectives on how devices process musical elements such as
pitch. Typically this data is collected in questionnaire format but is therefore
susceptible to bias and participant influence.
Results from a study by Gfeller et al. (2000a) suggest that HI adults’ level of
musical enjoyment is not directly comparable to NH matched controls. There
are a variety of findings when comparisons are made across the different
intervention methods for HI. Findings from Looi et al (2008) indicate that
music appreciation for HA users are similar to that of cochlear implantees.
They conducted a study with 30 hearing-impaired adults matched on level of
hearing loss (15 aided and 15 implanted). They rated and compared their
appreciation of musical sounds. Their results indicated that cochlear
implantees rated the musical sounds as more pleasant however the
difference between the groups was not significant. The comparison to NH
subjects was not made within this study and these findings were based on a
relatively small number of adult users.
Results from adult questionnaire data suggests that combined electric and
acoustic hearing could provide some advantages in music perception (Kong
et al. 2005). One may assume that better music perception may increase
musical listening and participation (Fitzpatrick 2009) although this has not
been confirmed (Gfeller et al 2008). Gfeller et al (2008) conducted a study
with 209 adult CI users to assess whether there were predictors of musical

64
perception and musical appraisal. Their results showed that significant
predictors of percept accuracy were not predictors of appraisal. This study
suggests that perceptual skill may have little effect on involvement and
appreciation although specific studies directed at musical behaviours,
appreciation and enjoyment with combined electro-acoustic stimulation have
not been reported in the literature especially with paediatric populations.
2.10 Effects of Musical Training on Pitch Perception and Production
with Hearing Impairment
There are investigations into the potential benefits of musical training for HI
individuals. Studies in this area have primarily assessed cochlear implantees
due to their musical difficulties. It is known that the processing and
transmission of certain musical parameters such as pitch are limited based
on device coding strategies. However studies over the past ten years have
promoted music listening and training packages to assist adult CI users in a
variety of musical tasks, some designed specifically for pitch perception
(Galvin et al. 2007; Gfeller et al. 2000b; Gfeller et al. 2001). Results from
these studies indicate that despite device limitations, training packages can
improve musical perception for cochlear implanted individuals.
A few studies of musical training effects have also been undertaken with
children showing positive results (Abdi et al. 2001; Rocca and Boyle 2011;
Yucel et al 2007; Yucel et al. 2009). Two studies were specifically designed
to assess whether training improvements singing skills of CI children are of
particular relevance for this research (Rocca and Boyle 2001; Yuba et al.

65
2009). Yuba and colleagues recorded the singing voices of 8 CI children,
letting them sing the melody from the first two bars of the ‘‘Frog Chorus’’ (a
well known Japanese song) before and after instruction. The instruction
given was focused on the falsetto voice by letting each subject listen
individually to the instructor’s model singing, and electric piano sounds. The
participants were asked to imitate what they heard as part of the instruction.
Comparisons were made of fundamental frequencies before and recorded
after instruction. Significant differences were recorded between time-point 1
and 2. Rocca and Boyle (2011) monitored children’s development when
undertaking a musical training programme – “A musical journey” in a pilot
study. Children were assessed using tests of pitch development, vocal
training and the singing and recognition of melodic sequences. Video
recordings were graded by blind analysis in relation to a target series of
intervals and melodic sequences based on these assessments. Rocca and
Boyle’s (2011) results indicate that musical habilitation can enhance the
ability to repeat intervals, or melodic sequences and to sing in tune.
2.11 Gaps in Research Evidence
Through review of the literature, gaps have been identified where further
exploration would be beneficial for better understanding of the pitch
perception and production in HI children. These include areas associated
with the normally functioning auditory system, such as gaining a greater
understanding of the perceptual mechanisms associated with pitch
perception; and gathering further evidence of links between musical and
cognitive processes. In addition a greater literature base is required

66
specifically focussed on HI populations, for example, which intervention
devices provide optimal auditory conditions for musical perception and
production for certain individuals, how much residual hearing and fine
structure preservation is necessary to see binaural improvement with
combined electric-acoustic stimulation, and what effects HA signal
processing features and CI mechanisms have on musical signals (e.g.
compression systems, feedback cancellation systems, NFC technology).
Further investigation into the musical appreciation of HI children and the
effects of training would also be of interest.
These areas require further exploration because of the critical role that pitch
has with respect to musical enjoyment and speech and language
development. The outcomes could have an impact on clinical choices for
children with cochlear HI.
As noted above the current literature base does not present comparisons
between intervention devices (CI, HA or BMS/EAS) associated with HI, with
respect to both musical pitch perception and production. This gap in the
research literature forms the basis of the current primary research aim. In
order to investigate this area, validated measures of pitch perception,
production and musical ability are preferable. Within the next chapter
validation of the chosen parental questionnaire is presented.

67
CHAPTER 3 : THE OPTIMISATION, VALIDATION AND NORMATIVE DATA COLLECTION FOR THE MUSICAL STAGES PROFILE (MSP) QUESTIONNAIRE
3.1 Introduction
Music forms an integral part of our modern society (Trehub 2003). As
children develop, there are many opportunities for involvement in music,
within the family and wider social interactions. Within the UK the benefit from
music for learning is underpinned by the inclusion of music within the
National Curriculum for children and adolescents aged from 5 to 16 years
old (Department of Education 2013). The curriculum framework is built upon
the assumption that the level of musical ability will increase as children
progress through the educational “key stages”. It is helpful therefore to have
methods of monitoring children’s musical development; however at present
this is not carried out in a formalised way. The lack of coherent and validated
assessment gives rise to variability across schools and teachers in
comparing musical ability for both NH and HI children at different stages of
development (Scattergood and Limb 2010).
Musical enjoyment is acknowledged as being a holistic experience with
different individuals liking a diverse range of music. However, it is easier to
assess overall musical ability if music is broken down into key elements that
can be measured and evaluated separately however these cannot be
assumed to be linked with musical enjoyment. These can include aspects of
pitch, rhythm and timbre perception as well as emotional interpretation.
When dissected in this way individual perceptual skill levels can be derived

68
to give an indication of ability in each area as well as for overall musical
development. This is particularly relevant when assessing populations with
possibilities in different sound processing abilities such as those with
dyslexia, auditory processing disorders or HI. Children with these difficulties
have perceptual constraints arising from distortion in hearing or central
processing of sound. For some of the HI children additional difficulties may
also arise due to signal processing within their hearing devices. This study is
focussed on HI because that was the particular population of interest in the
main study phase, but the work has relevance for the wider population of
children with sound processing difficulties.
Hearing loss can be responsible for a number of changes that effect
representation of sound and therefore perception of music signals in the
auditory system (Moore 2008). Commonly this is attributed to damage to the
sensory hair cells within the cochlea affecting musical perception in varying
ways as described in Chapter 2. As a result listeners suffering with hearing
loss can experience poor frequency selectivity (Moore 1995), reduction in the
precision of phase locking (Woolf et al. 1981), loudness recruitment (Moore
1995) and reduction in temporal processing and integration (Carlyon et al.
1990). All of which can be responsible for poor performance in music
perception tasks. Individuals with cochlear hearing loss are offered a range
of intervention devices, their goal being to improve listening and
communication. The choice of interventions is often governed by level of HI,
as well as individual characteristics such as health, duration of deafness,
aetiology of deafness and preference. The most common forms of

69
intervention offered are HAs, CIs or devices combining acoustic and
electrical stimulation (BMS or hybrid devices). Within each of these areas
there are differences in the approaches to sound delivery due to different
manufacturers using their own approaches to process sound for optimal
listening. The way in which these intervention methods affect perception and
production in musical contexts differ (Chasin & Russo 2004), it is therefore
likely that different signal processing and fitting strategies of hearing devices
will vary the listeners’ perception, production, and appreciation of music. One
example of this is for children who use CIs. Paediatric cochlear implantees
are likely to perform more poorly in pitch and timbre perception tasks than
children using HAs or NH children. However rhythmical perception is likely to
be equivocal between the different groups (Limb & Rubinstein 2012;
McDermott 2004). The possible reasons for these differences have been
described in Chapter 2.
At present there are few validated measures for assessment of musical
ability for young children; particularly measures which can be used for both
children with NH and HI (Kang et al. 2009). Young children can be
challenging to assess behaviourally, but by using subjective parental
evaluation, insight into the perceptual abilities could be gained prior to the
age when a child is developmentally appropriate for behavioural testing. This
is important for special populations, where the emergence of musical abilities
may develop later than expected based on chronological age.

70
There are questionnaires that have been developed to assess musical
aspects in adults with HI (Gfeller et al 2000; Gfeller and Lansing 1991;Leal et
al 2003; Looi et al 2008; Looi and She 2010; Mirza et al 2003; Veekmans et
al 2009) but at present there are very few used for assessing overall musical
ability level in young HI children. Questionnaires have been developed to
quantify music exposure and enjoyment for HI children but do not offer a
means of specifically assessing perceptual or production skills (Gfeller et al.
1998; Mitani et al. 2007; van Besouw et al. 2011). Two of the studies cited
here are of interest because they document their validation processes.
Gfeller et al. (1998) developed a questionnaire to assess musical
background and appreciation for children with CIs. This questionnaire was
adapted from a previous questionnaire for adults (Gfeller et al 1998b). The
validity of the questionnaire was assessed by a panel of four professionals
with experience of working with HI children. The expert recommendations
were taken into account and modifications made prior to the questionnaire
being distributed. Van Besouw et al (2010) reported the development of a
parental questionnaire looking at CI children’s music exposure and
appreciation. In the process of development this questionnaire was reviewed
by parents of CI children to determine the feasibility of the questionnaire.
Although the questionnaires mentioned here have undergone some degree
of validation, they have not been through a full standardisation process to
determine the normative ranges of performance for NH and HI children.

71
In order to develop a musical ability measure with norms for children from
birth to nine years of age, the Musical Stages Profile (MSP) questionnaire
was developed and assessed in a pilot study (Vickers et al. 2007). The MSP
is a parent interview questionnaire looking at the development of musical
skills in young children. The MSP was developed by a collaboration of
professionals in the fields of music education, music therapy and cochlear
implantation. Questions were based on their joint experience of the
emergence of musical skills as a child develops from birth up to nine years of
age. The format of the MSP is similar to the Meaningful Auditory Integration
Scale (MAIS) (Robbins et al 1999), a parental interview scale in which
parents provide information on their child’s listening skills using a five point
scale (1. Never, 2.Rarely, 3.Occasionally, 4.Frequently, 5.Always). As with
the MAIS questionnaire, the MSP was designed to measure emerging
abilities in different skill areas. Questions in the original MSP questionnaire
were categorised into domains which were rated as integral to musical
development by professionals working with both NH and HI children. These
included: sound awareness and general reaction to sound, exposure to
music, melody and dynamic changes, rhythmical changes and emotional
aspects. Each question is answered following observation of the child’s
behaviour with the same five point scale as the MAIS. A score is calculated
for each individual question (out of five), sum of all questions in a domain, as
well as a sum of all the questions on the MSP. The scores were intended to
reflect a child’s current musical ability, with a higher score indicating a higher
level. The questionnaire has been designed to cover a wide age range in
children (0-9 years old), to allow the assessment of children’s musical skill as

72
abilities develop. The limitation of such a wide age range is that parents
completing the questionnaire may encounter particular difficulties answering
questions at particular stages e.g. having knowledge of musical activities and
behaviours undertaken at school when they are not present. However within
this current research the wide age range is particularly relevant as HI
children are unlikely to develop musical skill levels equivalent to a NH child of
the same chronological age and both are to be included in the main study
phase. The version of MSP questionnaire cited in Vickers et al (2007) has
been used in studies assessing the impact of musical training for children
with CIs in Turkey (Yucel et al. 2007; Yucel et al. 2009). Yucel et al (2009)
reported significant differences using the MSP, between a group of children
with CIs that received musical training and a control group of implanted
children that did not receive training. This suggests that the MSP may be
sensitive differences in musical ability shown between CI children.
The aim of the current study was to optimise the content of the MSP and to
determine the reliability and validity of the MSP for use in assessment of
musical ability in groups of children with NH and with HI; with the goal of
determining how effective and sensitive it is for children with different profiles
of hearing loss in the emergence of musical abilities. The optimisation and
validation of the MSP questionnaire was considered important for this
research as it ensured the questionnaire provided reliable data in which to
draw suitable conclusions from for future studies. The validation approach
was conducted using an approach outlined by Jackson & Furnham (2000).

73
The MSP was chosen because it subjectively quantifies music perception
and production skills as well as other emotional aspects relating to musical
appreciation and enjoyment. This is important for this research because the
test population of HI and NH children may have very different patterns of
emerging musical skills. A questionnaire was selected because it is a useful
measure for assessing young children prior to an age when they are
developmentally capable of undertaking assessments of ability. This may
also be true for special populations with development delays.
3.2 Methods
Ethics approval was given by the UCL ethics committee (UCL Ethics Project
ID Number: 1927/001) prior to data collection for this study.
There were three main phases to the study. Phase One was an expert panel
review of the MSP. The expert opinion given in this phase was used to make
amendments to the questionnaire by improving the clarity of the wording and
by moving questions to different sections of the MSP where they were
considered to be more appropriate. Phase Two was a pilot study to assess
the validity and reliability of the newly optimised MSP questionnaire. In phase
Three, normative data was collected for the MSP and reference centile
charts created.

74
3.2.1 Phase One- Expert Review:
A group of 14 experts in the field of musical development and hearing were
recruited to review the MSP for its validity and appropriateness, following
email invitation. Their opinions were used to determine which critical
questions within each domain were useful to understand the development of
key skills for musical ability. The panel was made up of two professionals in
fields of audiology, three speech and language therapists, three CI
audiologists, and six specialists in music development and music education.
The MSP was supplied to each expert in an online form using a web-based
questionnaire package (Opinio 1998) with all domain headings removed.
After each question a drop down menu was provided with a choice of domain
headings from the questionnaire. These headings were –“sound awareness
and general reaction to sound”, “exposure to music”, “melody and dynamic
changes”, “rhythmical changes” and “emotional aspects”. The experts were
also provided with a comments box after each question to allow them to
make additional suggestions or comments.
Experts were asked to review each question for clarity (noting suggestions
for improvement within the comments boxes) and then to allocate each item
to a particular domain that they felt it belonged to from the drop down menu.
They were also asked to add additional comments on the general
characteristics of each question if they felt it was appropriate e.g. language
use, time taken to answer, and clarity. Validity was assessed by looking at

75
which domain the experts selected for each item and calculating the domain
percentage agreement between experts.
The MSP questionnaire was amended so that items that were identified as
ambiguous by the expert review panel were changed or moved into different
domains to improve clarity. The optimised version of the MSP questionnaire
is presented in Appendix 1.
3.2.2 Phase Two- Pilot Study:
A random opportunity sample of parent participants was recruited from local
nurseries, schools and play groups in and around London. The study was
advertised on notice boards and through letters sent home to children’s
carers. The only inclusion criterion was that children needed to be within the
age range 0-9 years of age. Each questionnaire related to one individual
child; although some parents completed more than one questionnaire if they
had more than one child. Parents/guardians were asked to complete the
MSP questionnaire based on their observation of their child’s current
behaviour concerning music, for example: “when singing a song will your
child vary loudness appropriately?”. The questionnaire was delivered as an
online survey (Opinio 1998) and took approximately fifteen minutes to
complete (measured between start and stop times).
MSP questionnaires were completed by parents for 60 children. There was
incomplete information in eight of the questionnaires collected, so a total of
52 of the questionnaires were used in the analyses (relating to 52 children).

76
The mean age of the children was 53 months and the age range was from 6
to 108 months. The gender distribution was 42.3% male to 57.7% female.
This data collected was analysed to evaluate the questionnaire’s validity and
reliability.
Two weeks after completing the first online survey, a second identical
questionnaire was given to the parent respondents to complete. These data
were used to give an indication of the questionnaire’s repeatability (test-re-
test reliability). A two week break between the first and second questionnaire
was chosen so that respondents would not remember responses given in the
first completion but also to ensure the child’s ability level had not changed
between the two time intervals. 36 parents (69% of sample) repeated the
questionnaire for a second time.
3.2.3 Phase Three– Age Appropriate Normative Data:
To collect normative data for the MSP questionnaire a random opportunity
sample of respondents (parents/carers of children) were recruited from
nurseries, schools, play groups and internet sites with agreed access. Once
recruited the questionnaire was distributed in an online form (Opinio 1998).
Parents/guardians were asked to complete the questionnaire at their
convenience. The survey remained open for 10 months.
The exclusion criteria were parents/guardians of children who fell outside the
age range set by the limits of the MSP questionnaire (children between 0-9
years of age) and children who had known HI or other difficulties which

77
would suggest potential atypical development (no children fell within this
category from parents that had completed the questionnaire).
324 questionnaires were fully completed in this phase of the study. The
ages of the children reported in the MSP responses ranged from 2 to 108
months with a mean of 48 months (see figure 5 for age distribution) and
there was an even gender distribution (Males 48.5% Females 51.5%). Data
was analysed and smoothing reference centile curves were generated using
the LMS method (Cole and Green 1992). A method which summarises
changing distribution of three curves L- coefficient of variation, M- median, S-
skewness. The centile curves were generated for each domain and also the
total MSP score.
Figure 5. Distribution of ages for the 324 children for which MSP
questionnaires were completed in phase three

78
3.2.4 Analysis
All data were entered into a database in accordance with the Data Protection
Act (Data Protection Act 1998) and analysed using the SPSS 14 and LMS
chartmaker software packages.
3.2.4.1 Validity analysis
Validity was assessed through two different methods within the study. Initially
validity was examined by calculating percentage agreement between experts
in question domain allocations (Phase One). Following questionnaire
modification, Phase Two of the study asked for parental opinion. The
statistical techniques chosen were based on the methodology reported by
Jackson & Furham (2000) and in previous studies (Gfeller et al 1998a; Van
Besouw et al 2010).
3.2.4.2 Reliability analysis
Reliability was assessed through measures of test-retest and internal
consistency. Test-retest reliability measures stability of scores at repeated
occasions and was evaluated via within-subject standard deviation, σω(Bland
and Altman 1996) after the assumption of normality was assessed and met.
The calculation of within-subject standard deviation σω involves computing
the variance of scores for each respondent, and then taking the square root
of the mean variance for the group of respondents. Lower values of σω
indicate better reliability. An individual’s score is expected to lie within

79
±1.96σω of their true score for 95% of observations. Therefore σω can also
be used to calculate the repeatability of a measure by using data from this
formula, *1.96σω (Bland and Altman 1996). The difference between two
measurements from the same respondent is expected to be less than
*1.96σω for 95% of pairs of observations when completed under the same
conditions.
Internal consistency was assessed with a Cronbach alpha coefficient,
(Cronbach 1951). A Cronbach alpha coefficient, is used to measure
multiple-item measurements to give an averaged correlation between the
items. The coefficient indicates the reliability of the items within the
questionnaire for measuring a common concept or theme. A measure is
considered reliable when the index is greater than 0.7.
3.2.4.3 Statistical techniques used to create age appropriate centile curves
Age appropriate smooth centile curves were created through the LMS
chartmaker software package via the LMS method. The LMS method
summarises the changing distribution of three curves. The three curves
represent the data sets’ median, coefficient of variation and skewness.
Through a method of maximum penalised likelihood (Green 1987) the three
curves are fitted and smoothed to create reference centile charts (Cole and
Green 1992). Reference centile charts are used widely in medical practice
especially for measures such as height and weight (Cole et al. 1988) in order
to identify subjects who may be unusual (Cole and Green 1992). The
intention is that the MSP centile charts will also be used for this purpose with

80
future populations, in particular assessing HI children against normative
values.
3.3 Results
3.3.1 MSP Questionnaire Validity
In phase one the expert panel reviewed 32 questionnaire items (contained
within the original MSP questionnaire). Demographic questions were
removed for this process. The experts selected the domain (sound
awareness and general reaction to sound, exposure to music, melody and
dynamic changes, rhythmical changes and emotional aspects) that they
considered each question had addressed from the drop down menu supplied
after each item. They also supplied comments on each questionnaire item.
Based on comments received the separate ‘exposure to music’ domain was
deemed inappropriate to include within a calculation of musical ability. Those
four questions were put together with the demographic information to form a
general information section; those values were not included in the total MSP
score. Three items in the sound awareness section were also deemed
confusing in terms of why they were included within a musical questionnaire
so were removed completely. The three removed questions were: Does your
child react when a) a dog barks?, b) a glass falls?, or you knock a glass with
a spoon and c)a car horn sounds?.
The expert’s domain allocations of the remaining items (25 questions) were
grouped and a percentage agreement between the experts was calculated

81
for each question/item. It was decided that items that achieved less than
65% agreement would be reconsidered (Jackson and Furnham 2000).
Agreement above this criterion was achieved for 14 items (56% of the
remaining questionnaire items). This is an indication that the items fell into a
specific domain of the questionnaire and thus remain within the same
domain in the resulting optimised MSP. The comments for the remaining 11
showed that there was disagreement between experts as to which domain
the questions should fall into. These are presented in Table 1. These 11
questions were reconsidered and some were adapted using comments from
the expert panel to improve clarity of the questions and to ensure that the
questions fell within the appropriate domain. Some of the 11 items remained
unchanged because the highest scoring domain allocation was for the
domain that they originally were assigned to and it was considered
appropriate when domain headings were visible. An optimised MSP
questionnaire was created from this data (Appendix 1).
A comment section was included both within Phase One and Phase Two to
gather information on the questionnaire’s validity. On review of these
subjective comments, common themes were noted and the general opinion
was that the questionnaire was measuring what it was intended to within
each domain and the overall MSP was appropriate for following emerging
skills just as long as the music exposure domain was removed from the
overall score.

82
Table 1. MSP Items falling below 65% agreement criteria in expert review
domain allocation
Item no
Item % agreement for correct domain
Other domains selected
4 Does your child start clapping when they hear a song or music being played?
28.6% (SA) 42.9% (R), 7.1% (EA), 14.3% (EM). 7.1% (MD)
8 Does your child start moving or dancing when there is some music being played (radio, tv,...)?
35.7% (SA) 35.7% (R), 14.3% (EM), 14.3% (EA)
9 When you listen to music or you hum the melody, does your child try to vocalise?
35.7% (MD) 42.9% (SA), 14.3% (EM), 7.1% (EA)
10 Does your child sing the correct tune and all the words to any songs?
35.7% (MD 42.9% (EM), 21.4% (SA)
13 When listening to a song will your child start to sing words at the ends of the phrases?
35.7% (MD) 35.7% (SA), 28.6% (EM)
14 Does your child ever spontaneously: a) clap hands to music? b) drum a beat on something (drum, pot, ...) to music?
64.3% (R) 28.6% (SA), 7.1% (MD)
16 Does your child spontaneously try and sing a familiar melody (like nursery rhymes or lullabies he/she has heard)?
42.9% (MD) 35.7% (EM), 21.4% (SA)
22 Does your child ever spontaneously ask you to sing or play music?
50% (EA) 42.9% (EM), 7.1% (SA)
25 Does your child react to lively music?
35.7% (EA) 35.7% (SA), 14.3% (EM), 7.1% (R), 7.1% (MD)
28 Does your child ever ask to listen to a particular CD or tape?
50% (EA) 50% (EM)
29 Can your child say when a favourite song is being played?
21.4% (EA) 28.6% (EM), 28.6% (SA), 21.4% (MD)
SA – Sound Awareness, EM – Exposure to music, MD – Melody and
dynamic changes, R - Rhythmical changes, EA – Emotional Aspects

83
3.3.2 MSP Questionnaire Reliability
3.3.2.1 Test-retest
A two tailed paired-samples t-test was used to indicate whether there was
systematic variation between scores at the two time points. This was
included within the analysis to confirm there had not been a learning effect
between the two occasions the MSP was completed by parents. T-test
results showed that there was no significant difference (t =-0.091, df =30,
p=0.928, r=-0.06) between MSP total mean scores obtained from the two
occasions when the MSP was completed by parents. There were also no
other significant differences found between the two time points for all
separate domain scores contained within the questionnaire (at the p<0.05
level) (see Table 2).
Table 2. Paired Samples t-test results comparing each separate domain in
the MSP for questionnaires completed at the two time points
Test-retest t Df Sig. (2-tailed)
Effect size (r)
Pair 1- Sound Awareness 0.4 30 0.7 0.02
Pair 2- Melody & Dynamics 0.8 30 0.5 0.02
Pair 3- Rhythmical Changes -0.9 30 0.4 -0.04
Pair 4- Emotional Aspects -0.6 30 0.6 -0.03
The selected measure of reliability (within-subject standard deviation, σω)
was also conducted after assumption of normality was met and results are
presented in Table 3. Low values indicate good test-retest reliability.

84
Table 3. Measures of test-retest reliability
Test-retest MSP Total Score
Sound Awareness Score
Melody & Dynamics Score
Rhythm Score
Emotional Aspects Score
Within-subject standard deviation, σω
4.1 1.2 2.2 1.8 1.8
Repeatability,
*1.96σω
11.4 3.3 6.1 5.0 5.0
3.3.2.2 Item reliability index
A Cronbach alpha coefficient, was used to determine internal consistency
on the phase two data and was above 0.7 (0.92) indicating strong internal
reliability.
3.3.3 Phase Three - Age appropriate reference centile curves
The normative ranges of each domain and total MSP score were calculated
using the optimised MSP questionnaire (following Phase One & Two). The
LMS chartmaker software package was used to fit reference centile curves
using the LMS method (Cole and Green 1992). A set of 7 centiles were
included on each chart (3rd,10th, 25th, 50th, 75th, 90th and 97th), each centile
being equally spaced two-thirds of a Z score apart. MSP score centile charts
are shown in Figure 6 & 7.

85
Figure 6. Seven centiles of MSP total score from age 2 to108 months, based
on the LMS curves generated by LMS method in LMSchartmaker
Figure 7. Centile charts for each separate domain (A Sound Awareness, B
Melody & Dynamics, C Rhythm and D Emotional Aspects) contained within
the MSP questionnaire from age 2 to 108 months, based on the LMS curves
generated by the LMS method in LMSchartmaker

86
3.4 Discussion
The MSP questionnaire was optimised, validated and its reliability
determined through phase one and two of this study. In addition,
developmental age-appropriate centile charts were created in order to
compare future populations to normative values (Phase Three).
Data collected from the expert review (Phase One) was used to assess
validity in a similar approach to that reported by Gfeller (1998a). The data
collected suggested modifications were necessary, because some questions
were ambiguous as to which musical domain they belonged to in the experts’
opinion and others were considered not useful for a musical development
measure. These particular questions were reviewed separately and some
were deleted completely (3) and some were moved (4). Of the 11 questions
that did not meet the 65% criteria 8 weremodified based on comments
received, the remaining three questions were left unchanged as they were
deemed appropriate when domain headings were present . A newly
optimised version of the MSP questionnaire was created for future use (see
Appendix 1). Examination of the MSP questionnaire validity and reliability
followed the optimisation phase.
Phase two data showed the MSP questionnaire to be a valid and reliable
measure in its optimised form. In Van Besouw et al’s (2011) musical
questionnaire study they assessed face validity by asking likely respondents
(parents) to review questionnaire items. This information was collected by

87
parent review of the questions in the current study and the review
demonstrated strong face validity of the MSP questionnaire. This strong face
validity could however lead to social desirability bias. This is not considered
likely for this questionnaire due to there being little personal gain to be
achieved by “faking” answers for the questionnaires intended future use.
Small σω values (total MSP = 4.1) confirmed strong test-re-test reliability for
the MSP questionnaire. A Cronbach alpha coefficient over 0.7 also
confirmed good internal reliability of the MSP questionnaire.
Phase three of the study was used to generate reference centile curves for
the MSP questionnaire score domains and total. This process is very
common when considering health related scales, but is not available for the
other questionnaires directed at this area of interest. Observation of the
centile charts demonstrated that there was an increase in MSP score with
age for NH children showing the emergence of musical abilities over time.
However at approximately 44 months of age the rate of change of the
function slows down dramatically and plateaus suggesting that the MSP is
unlikely to be sensitive to developmental changes beyond this age for a
typically-developing NH child. It may therefore be more appropriate to use a
different measure beyond this stage to assess musical development.
Children beyond a developmental age of 44 months should be able to
complete musical behavioural assessments accurately (Trainor 2005), so the
MSP would provide a resource to allow monitoring of development for the
stages when the child is too young or developmentally delayed to complete

88
formal assessments. In addition to the plateau observed at 44 months there
is also a dip is observed at the age of 77 months which is explained by the
unfortunate lack of questionnaires completed by parents with children of this
age group. Due to the fact that the data surrounding this time period fell on
the plateau of the function it can reasonably be assumed that this time period
should also fall at the plateau level.
3.5 Conclusion
Results obtained from this study show that the original MSP questionnaire
(Vickers et al. 2007) required adjustments as a result of expert feedback.
Once in the optimised form, validation and reliability measures show that the
MSP questionnaire is suitable for use in the assessment of musical ability of
normally developing children; and is most sensitive to development up to the
age of 44 months old. The questionnaire would still be considered valuable
to use with older normally developing children so that comparisons can be
made using the same scale to age-matched HI children who may have
developmental delay based on their hearing loss. This has particular
relevance to this research. Future work to collect MSP data from HI groups
and establishing reference centile curves for these populations would also be
valuable.
It is acknowledged that the sample used in all three phases of the study were
small especially to create normative centile charts in phase three. The
researcher was limited by time and this influenced recruitment, therefore it

89
would also be beneficial to continue to collect normative responses to add
into the reference centile charts as a future direction.

90
CHAPTER 4 : PILOT STUDY
4.1 Introduction
Prior to conducting the main study phase of the research a pilot study was
undertaken to ensure the selected test materials and procedures intended for
the main study phase were appropriate. The purpose of the study was to trial
the test protocol with a group of NH children and assess whether adaptions
were necessary.
It is advisable to conduct a pilot study to reduce the chance of failed trials
within a large scale study, which is particularly important when testing
children and difficult to recruit populations. For such groups the test sessions
need to be optimised for effective data acquisition and the pilot study allows
problems to be identified and resolved to ensure a more streamlined
process.
The primary role of a pilot study is to examine the feasibility of an approach
intended for a larger scale study (Porta 2008). The approaches chosen to be
incorporated in the pilot study should be selected based on theory or similar
studies in the same subject area. The feasibility covers recruitment,
assessment procedures, new methods and novel interventions. Pilot studies
also provide opportunity for the experimenter to train and strengthen the
competencies required for accurate and precise data integrity and the
protection of human subjects (Leon et al. 2011).

91
Well implemented pilot studies provide useful information on the sample,
testing procedures and materials, and the need for modification of protocol. A
pilot study will not however provide a means for hypothesis testing (Leon et
al. 2011). Hypothesis testing is not appropriate because there is limited
knowledge of the methods or interventions; and sample size is normally
small.
The aim of this pilot study was to assess the appropriateness of the test
protocol and trial the selected testing materials (MSP questionnaire, Primary
Measures of Musical Audiation (Gordon 1979) and the National Singing
Programme Child Singing Assessment (Welch et al. 2009)) (See section
4.2.2) with a group of typically developing NH children of the same age group
as the population of interest for the main study phase (4-9 years old). The
intention was to highlight any problems with the test protocol and assess
whether the instructions and training for the use of the tests and the
laryngograph was sufficient. In addition the results recorded were compared
to materials normative values to ensure they follow the same pattern in terms
of development with age. Additionally the time taken to administer the full
test battery was recorded and the quality of the laryngograph recordings
were analysed to determine if the procedure was effective.
The pilot study was not conducted with HI children because participant
recruitment was difficult and all the HI children were required for testing in
the main study phase.

92
4.2 Methods
4.2.1 Participants
Following ethical approval 14 children aged between 4 and 9 years of age
were recruited from a primary school in North London, where the researcher
had agreed access. The inclusion criteria was that children were aged
between the selected age range, had English language understanding (in
order to undertake the tests involved) and had hearing level of 20dBHL or
less in both ears. Of the 14 children, one child fell outside the NH range and
therefore was excluded from further testing. The remaining children were
aged between 58 and 95 months, with a mean age of 72.5 months (SD
10.9).
4.2.2 Materials
Wherever possible materials selected for the main study phase of the
research had previously been validated and normative values were available.
Due to the subjective nature of the Child Singing Assessment scoring,
additional validation was sort by making comparisons to
electrolaryngography recordings (laryngograph) made while the child
completed the assessment.
4.2.2.1 Musical Stages Profile (MSP) Questionnaire
The MSP questionnaire was designed to measure emerging abilities in
different skill areas for children aged between birth and nine years of age.
The MSP was validated and normative values collected as part of an earlier

93
study (see Chapter 3). Questions in the MSP questionnaire were categorised
into domains considered to be integral to musical development for both NH
and HI children. These included: sound awareness, melody and dynamic
changes, rhythmical changes and emotional aspects. Each question was
answered following observation of the child’s behaviour with one of the
following responses 1. Never, 2.Rarely, 3.Occasionally, 4.Frequently,
5.Always. A score was calculated for each individual question (out of five),
each domain, as well as a total MSP score by summing the scores across all
domains. The total scores were intended to reflect a child’s musical ability,
with a higher score indicating a higher level. This questionnaire was chosen
for the research because it was validated, had normative reference centile
curves (see Chapter 3) and it permitted collection of data related to
perceptual and production skills, which is particularly useful for children who
are developmentally unready to perform behavioural assessment. The MSP
questionnaire used in the pilot study and main study phase can be found in
Appendix 1. The MSP questionnaire was chosen for this research to allow
different groups of children (both HI and NH) to be assessed subjectively for
musical ability on the same scale. It is acknowledged that within the earlier
validation study (Chapter 3) lack of sensitivity to changes beyond 44 months
of age was found for the group of NH children used to create the MSP
reference centile curves; however it is likely that HI children will not sit at the
same developmental stage as their chronologically age matched NH peers.
Therefore the MSP questionnaire allows data to be recorded from both HI
and NH children of an older age within this research and is still considered

94
valuable especially where children may not be developmentally ready to
complete behavioural assessments.
4.2.2.2 Primary Measures of Musical Audiation (PMMA)
The PMMA is a measure used in the field of music education to determine
the ability level of children with respect to pitch and rhythm perception. It was
developed for kindergarten aged children (4-5 years old) up to Grade 3 aged
children (8-9 years old).
The PMMA was selected because it is a well-established validated test
battery with normative values for comparison purposes. It is a simple test to
administer and has been specifically designed for use with children of the
appropriate age. The PMMA has also been shown to be sensitive for
detecting perceptual differences with HI and CI children and adults (Gfeller et
al. 1997; Gfeller and Lansing 1991; McDermott 2004), the population of
interest in this work.
It uses a same-different task where children respond (by clicking the
associated box) to say whether two musical note sequences are the same or
different in terms of “tone” (pitch perception) or “rhythm”. There were forty
questions with two practice examples for each test (pitch and rhythm). The
stimuli ranged from notes C4 (261.3Hz) to C5 (523.3Hz) and the testable
range is between one and 12 semitones. It took the children between 40-50
minutes to complete both the tone and rhythm tasks in the PMMA. The
PMMA computerised version (1.0) was used for this research. The program

95
was run on a laptop (Samsung NI30 with realtek high definition audio card);
with stimuliplayed through a loudspeaker at 65dBA (Behringer MS20 active
loudspeaker) at a distance of one meter in front of the child’s seated position.
The child’s head movements were not restricted.
4.2.2.3 National Singing Programme (NSP) – Child Singing Assessment
recorded with Laryngograph
The children’s singing production was assessed using the “National Singing
Programme Child Singing Assessment” (Welch 2009). The NSP forms part
of a UK government initiative aimed at assessing the development of musical
and singing activities within schools as well as providing singing activities
within the curriculum, under a programme known as “sing-up” (Sing up
2013).
As part of the NSP programme, baseline singing skills of children in primary
schools prior to using sing-up and also following sing-up intervention were
assessed. The Child Singing Assessment was developed as a means of
conducting these evaluations (Welch et al. 2009). The NSP baseline data
was used as a comparison in this study and was derived from over 13,000
child singing assessments.
The Child Singing Assessment consists of three aspects of children’s vocal
behaviour:
i. Children’s habitual speech pitch centre - (achieved by asking the child to
count backwards from 10)

96
ii. Comfortable singing range – (achieved by the child producing the highest
and lowest tones that they can using pitch slides)
iii. Normalised singing score (NSS). A measure of singing accuracy based
on the child singing two well-known songs (usually. “Happy Birthday to
You” and “Twinkle, Twinkle Little Star” unless unknown by the child).
The scoring method used within the Child Singing Assessment was created
from a combination of scoring schemes based on singing development
models by Rutkowski (1997) and Welch (1998). The scoring sheet is
presented in Appendix 6. The NSP was selected for the main study phase
because it had been shown to be sensitive to differences between groups for
the age range of interest, and contained a comprehensive range of tasks.
The utterances produced in the NSP Child Singing Assessment by the
children were recorded using the electrolaryngograph Speech Studio
Software (Laryngograph 2013). This produced both speech audio recordings
and Laryngograph traces to be able to conduct acoustic analyses to
quantitatively assess voice fundamental frequency and efficiency of vocal
fold closure. These measurements were made using a USB
electroglottograph (model: EGG-D200, serial no:100220) with the Speech
Studio software program run on a NI30 samsung laptop. A pair of medium
laryngograph electrodes was placed on the child’s neck to record vocal fold
closure. A Labtec over ear microphone (model:Axis-002) was used to create
audio recordings. Within the pilot study the audio recordings were used to

97
score the NSP child singing assessment and the Larynograph traces were
used to validate the subjective scores assigned in the NSP analysis.
It was considered important that the NSP Child Singing Assessment values
obtained in the current research were comparable to data collected by the
NSP team at the Institute of Education (IoE). The researcher was trained but
not experienced in scoring the NSP Child Singing Assessment. Therefore in
order to remove this margin of error between researcher scoring and IoE
staff scoring, an audio recording of the assessment for each participant was
sent, analysed and scored by members of the NSP IoE team. The analysis of
the NSP scores were carried out by trained listeners at the IoE. The listeners
were musically trained and had many years of experience conducting the
NSP Child Singing Assessments using subjective judgement of pitch
accuracy. The IoE listener assigned singing behaviour scores based on
singing quality and accuracy of the production. To avoid any bias the trained
listeners from the IoE were blind to the hearing status of the individual
children; they scored recordings and the results were stored with a code
number for each child.Audio recordings were sent rather than live scoring as
NSP IoE staff were not available to attend the current study test sessions.
Within this pilot study audio and laryngograph recordings were reviewed by
the researcher and IoE NSP staff to ensure that they were of sufficient
quality for use in the main study phase. They were also used as a means of
ensuring validity of the IoE subjective scoring method.

98
4.2.3 Procedure
Testing took place in a in a small quiet room (ambient levels were lower than
the 40dBA criterion level) in a primary school in North London. The hearing
status of every child was assessed by the researcher using pure tone
audiometry screening at 20dBHL at octave frequencies between 250-
8000Hz. This was undertaken on a Maico MA41 portable audiometer.
Children who failed the screening test were excluded from the study and the
school advised parents to visit their GP for further testing and management.
All remaining children undertook the full test battery (PMMA tone and rhythm
tasks and NSP Child Singing Assessment recorded with laryngograph).
Within the test session children were given one hour and 30 minutes to
complete the full test battery and hearing screening. The MSP questionnaire
was sent home for parents to complete and return on the day of the test
session.
Throughout the test session, notes were taken of subject compliance, time
taken for assessments and the child’s reaction to each task. Following the
test session the NSP Child Singing Assessments were sent to staff at the IoE
and recording quality was subjectively assessed.
4.3 Results
The time values noted for the duration of testing ranged from 40-65 minutes
to complete the test battery, excluding hearing assessment. Hearing
assessment was not included in the time recordings because it was not part

99
of the protocol for testing the HI children in the main study phase. All of the
13 children tested were keen to participate in all of the tests. Only six MSP
questionnaires were returned by parents, indicating that it was important for
the main study phase that the parents completed the MSP at the time of
testing, wherever possible, to reduce the amount of missing data. All of the13
children completed all the other tests in the test battery so their results have
been included as part of those analyses.
All children demonstrated a good understanding of the instructions and all
tests were completed correctly. All of the children did, however, report
boredom during the PMMA test due to the length but both tone and rhythm
sequences were completed successfully. This indicated that it may be
appropriate to break up the testing sequence and provide breaks during
testing in the main study phase.
A range of total MSP scores were obtained from the pilot participants and
they fell within the age appropriate normative range (see Figure 8).
Examination of individual scores indicated that the sample was a typically
developing group falling on and above the 50th centile of normative range.

100
0
10
20
30
40
50
60
70
80
90
100
110
120
130
0 20 40 60 80 100
97th centile
90th centile
75th centile
50th centile
25th centile
10th centile
3rd centile
PilotParticipants
MSP
Sco
re (
ou
t o
f 1
35
)
Age in Months
Figure 8. Total MSP score for respondents on reference centile chart
To examine the PMMA test results, children were split into three groups
based on age so that relationships to previous normative data could be
viewed. Mean scores were generated for each age group and the musical
domain (pitch or rhythm) (see Table 4). Difference in raw scores between the
age ranges was examined through a two-tailed one-way ANOVA with ‘Grade’
(Kindergarten, Grade 1, Grade 2) as a factor. There was a statistically
significant main effect of Grade at the p<0.05 level for both Pitch raw scores
(F(2-10)=59.5, p=0.03, eta squared=0.5) and Rhythm raw scores (F(2-10)=47.2,
p=0.03, eta squared=0.5). Least Significant Difference (LSD) Post hoc tests
showed the Grade 1 group (M=28.7, SD 3.1) scored significantly higher than
the Kindergarten group (M=26.6, SD 3.8) for Pitch raw score. For Rhythm
raw score the Grade 2 group (M=31, SD 1.4) scored significantly higher than
the Kindergarten group (M=25.9, SD 3.4). No other significant differences
were observed between the groups.
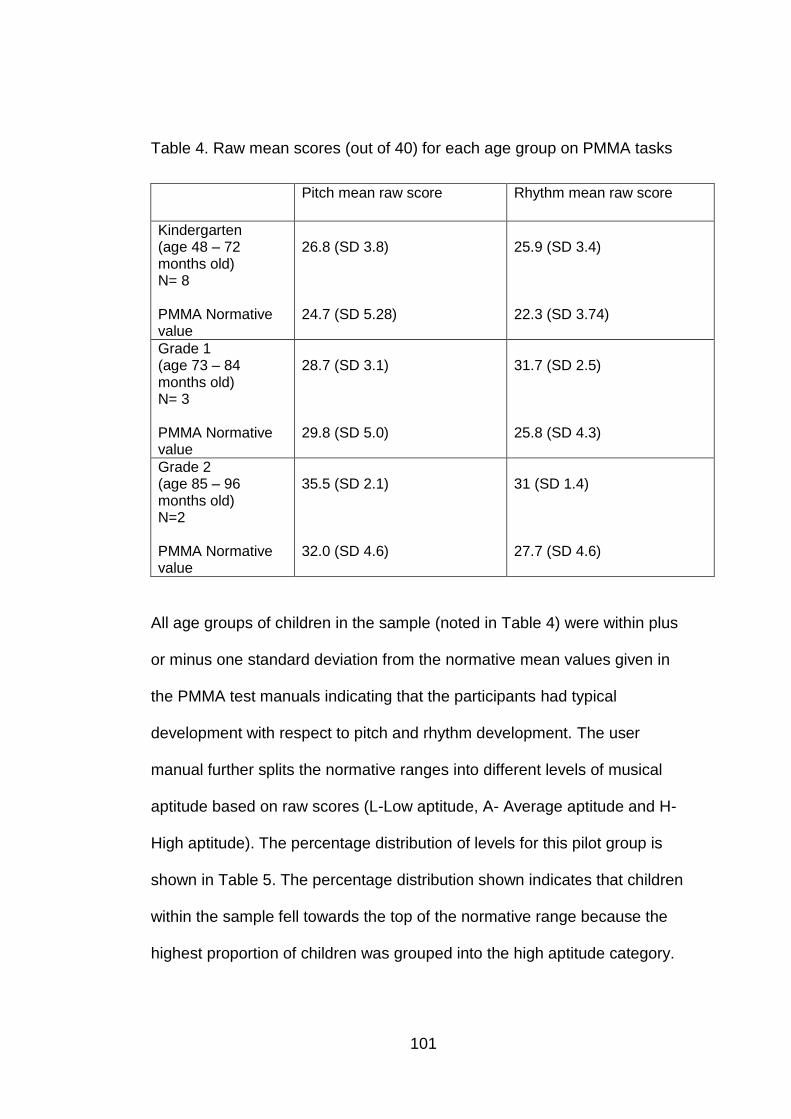
101
Table 4. Raw mean scores (out of 40) for each age group on PMMA tasks
Pitch mean raw score Rhythm mean raw score
Kindergarten (age 48 – 72 months old) N= 8 PMMA Normative value
26.8 (SD 3.8)
24.7 (SD 5.28)
25.9 (SD 3.4) 22.3 (SD 3.74)
Grade 1 (age 73 – 84 months old) N= 3 PMMA Normative value
28.7 (SD 3.1) 29.8 (SD 5.0)
31.7 (SD 2.5) 25.8 (SD 4.3)
Grade 2 (age 85 – 96 months old) N=2 PMMA Normative value
35.5 (SD 2.1) 32.0 (SD 4.6)
31 (SD 1.4) 27.7 (SD 4.6)
All age groups of children in the sample (noted in Table 4) were within plus
or minus one standard deviation from the normative mean values given in
the PMMA test manuals indicating that the participants had typical
development with respect to pitch and rhythm development. The user
manual further splits the normative ranges into different levels of musical
aptitude based on raw scores (L-Low aptitude, A- Average aptitude and H-
High aptitude). The percentage distribution of levels for this pilot group is
shown in Table 5. The percentage distribution shown indicates that children
within the sample fell towards the top of the normative range because the
highest proportion of children was grouped into the high aptitude category.

102
This result in aptitude grouping shows that the PMMA test materials would
be most suitable and sensitive for children of this ability level and lower.
Table 5. Percentage distribution of aptitude levels (Low, Medium and High)
assigned by PMMA test materials based on normative values for total pilot
sample
Low Aptitude
Average Aptitude
High Aptitude
Pitch
7.7%
38.5%
53.8%
Rhythm
0%
46.2%
53.8%
For the assessments of singing ability some children felt inhibited and
required encouragement to participate. However a number of participants
stated that the singing assessment was their favourite task from the entire
test battery after completing it (n=7). The quality of recordings generated by
the laryngograph and the audio recordings were reviewed by both by the
researcher and a National Singing Programme co-ordinator based at the IoE.
The recordings were considered to be of a sufficiently high standard for later
analysis and scoring.
In order to validate the IoE NSP child singing assessment scoring method,
the scores obtained from the IoE assigned habitual speech pitch centre were
correlated with laryngograph traces made from the same recorded sample
using a Pearson Product-Moment correlation coefficient (see Figure 9).

103
There was a strong positive correlation between average fundamental
frequency from laryngograph trace and assigned IoE habitual speech pitch
centre (n=13, r=0.87, p=0.00) indicating that the subjective method for
scoring singing assessments was strongly related to the laryngograph
measurements. There was one outlier (P14) where IoE assigned habitual
speech pitch centre was lower in frequency than average fundamental
frequency. This recording was reviewed, and this child showed large
variation in pitch when the child counted backwards from 10. Therefore it
was difficult to obtain a sustained vowel sound which would provide an
accurate acoustic analysis within the laryngograph recording.
Figure 9. Relationship between average fundamental frequency from
Laryngograph trace (Hz) and IoE assigned habitual speech pitch centre

104
4.4 Discussion
Results showed the method and materials used within the pilot study were
suitable for typically developing children in the 4-9 years age group. The
instructions were clear and understood by all the participants. Boredom was
reported by children when completing the PMMA test battery, therefore
within the main study phase adequate breaks would be included and pitch
and rhythm tasks would not be undertaken in succession of each other. Time
taken to administer all the tests in the battery fell under 1 hour 30 minutes
(including hearing tests and breaks). This indicates testing sessions selected
for main study phase would allow sufficient time to compete the full test
battery inclusive of breaks.
MSP results showed that the pilot sample were age appropriate with the
individual scores falling between the 50th and 97th percentile of the MSP
reference centile chart. No children scored the maximum value for the test.
However based on the high scores obtained by the NH pilot group, results
indicate that the MSP would be most suitable for children who score the
same or lower than this group otherwise ceiling effects may be observed.
The MSP is considered appropriate for the main study phase of this research
as HI children are to be investigated. As described in Chapter 2 HI children
are unlikely to perform better than a NH sample when considering musical
aspects due to limitations associated with their HI and the intervention
devices they have to manage it.

105
Musical perception for the sample was shown to fall within the one standard
deviation from the mean normative score for pitch and rhythm scores on the
PMMA assessment. PMMA test sensitivity was examined through
comparisons between age groups (Kindergarten, Grade 1 and Grade 2).
Significantly better scores were shown for older children in comparison to the
younger children for both pitch and rhythm raw scores. This result indicates
that the PMMA test materials were sensitive enough for detecting
developmental differences in pitch and rhythm perceptual domains within this
NH sample. PMMA aptitude rankings indicated that a large proportion of NH
pilot sample scored in the highest ability range for both pitch and rhythm
tasks (set out by the PMMA test manual), although none scored the
maximum of 40. As was described above this is not considered an issue for
the main study phase as groups of HI children are to be tested.
NSP Child Singing Assessment recordings made using the laryngograph
were reviewed by both the researcher and IoE NSP staff. The recordings
were useable for both IoE scoring and voice quality analysis via
laryngograph speech studio software. A strong positive correlation between
the IoE assigned habitual speech pitch centre and average fundamental
frequency validates the subjective pitch matching technique used in scoring
the NSP Child Singing Assessment. Slight discrepancies observed between
the two values assigned can be attributed to the fact that IoE allocations are
given as musical notes which have been converted to equivalent frequencies
(Hz). There was one outlier identified, this child had a lower IoE assigned
habitual pitch centre than was recorded by laryngograph recording analysis.

106
This result can be attributed to the pitch variations displayed by the child
when counting backwards from ten (which made it difficult to gain an
accurate sustained vowel sound to conduct analysis on), rather than
inaccuracy of IoE pitch allocations.
4.5 Conclusion
The purpose of the pilot study was to investigate the feasibility of the test
protocol and testing materials. Results indicated that the protocol was
appropriate for the age range of interest (4-9 years). The tests do not suffer
from floor and ceiling effects and that there was a wide range in test scores
for the typically developing population, indicating that the tests should be
sufficiently sensitive to pick out perceptual differences between different
groups of children, which are important for the main study phase.
Results indicated that the testing time of 1 hour and 30 minutes is
appropriate; and that the quality of recordings for the singing assessments
and laryngograph measurements is accurate and sufficiently clear for
analysis.

107
CHAPTER 5 : PITCH PERCEPTION, PITCH PRODUCTION AND
MUSICAL ABILITY OF HI CHILDREN
5.1 Introduction
For HI children the primary focus of intervention with a hearing device is to
optimise speech perception. However very little is known about the impact
this could have on music and pitch perception, which is now acknowledged
to be beneficial not only for music enjoyment but also for the impact that it
has on speech, reading and language development and other cognitive
areas (Anvari et al. 2002; Costa-Giomi 1999; Gromko and Poorman 1998;
Hurwitz et al. 1975; Rauscher et al. 1997; Rauscher and Zupan 2000;
Schellenberg 2004). It is expected that HI children will perform more poorly
than NH children in certain domains of music perception due to perceptual
limitations associated with their HI (Moore 1996). However all aspects of
music perception will not necessarily be equally affected. Based on the
dominance pitch has within musical signals, and the different pitch signal
processing approaches within hearing devices, the primary focus of the
current research has been on pitch perception and production.
The Impact of Hearing Devices on Pitch Perception
The most common forms of intervention offered to HI children are HAs, CIs
or BMS devices. EAS devices are currently available but are not routinely
fitted to children. Within each device category there are differences in
approaches to sound delivery due to manufacturers using various processing
schemes and different hardware to achieve satisfactory results primarily for

108
speech. The processing in both HAs and CIs will therefore affect perception
differently, especially with respect to musical elements such as pitch (Chasin
and Russo 2004; Scattergood and Limb 2010).
As was described in Chapter 2, HA prescriptions are based on speech
spectra to optimise audibility of the critical speech frequencies (Dillon 2001)
rather than focussing on music signals. Therefore the dynamic variability,
restricted bandwidth of the device, and additional front end processing
systems may have detrimental effect on musical signals. CIs have the same
primary function as HAs in that enhancement of speech perception is the
main aim. Speech in noise, tonal language perception and musical
perception has been shown to be challenging for implant users (McDermott
2004). This is attributed to degraded pitch representation due to the loss of
fine structure information within CI processing and the status of the cochlea.
The fine structure information is beneficial for good pitch perception and is
responsible for delivering the fundamental frequency (F0) in NH subjects
(Smith et al. 2002; Wilson et al. 2004), the perception of which is often poor
for CI users (Yucel et al. 2007; Moore and Carylon 2005a; Moore and
Carylon 2005b).
A combination of electric and acoustic inputs (with BMS or EAS devices)
have the potential for better delivery of pitch and melody information for
individuals with residual hearing in the low frequencies (Ching et al. 2009).
This is due to the acoustic signal helping to deliver the fine structure
information. The two devices provide complimentary auditory cues for pitch

109
perception because CIs provide place pitch information and high-frequency
content and HAs supply the low frequency F0 information (Smith et al. 2002).
There is evidence to demonstrate that this configuration of electric and
acoustic inputs can improve perception of pitch elements (Dorman et al.
2008; Gfeller et al. 2006; Kong et al. 2005) although this has not been
demonstrated for children (Looi and Radford 2011).
The Impact of Hearing Devices on Pitch Production/Singing
For success in musical production auditory feedback is required to monitor
and adjust productions (Murbe et al 2002). Due to the importance of auditory
feedback on both speech and singing production it is therefore logical to
assume that HI and the use of hearing devices (HAs, CIs, and BMS) that
limit or modify the auditory signal could in turn affect singing abilities.
Evidence has shown that CI users perform poorer that NH matched peers
when singing skills were analysed in terms of accuracy of fundamental
frequency (F0) (Xu et al. 2009).This was attributed to the unsatisfactory
delivery of musical pitch with CIs. On the basis of this study individuals using
HAs or BMS may have better singing abilities with respect to melody
production than individuals using purely electrical stimulation via CIs but
there is little evidence to support this hypothesis.
Music enjoyment and Involvement
Musical aptitude is important from many perspectives including musical
enjoyment and involvement. Gfeller et al (2000a) suggested that HI
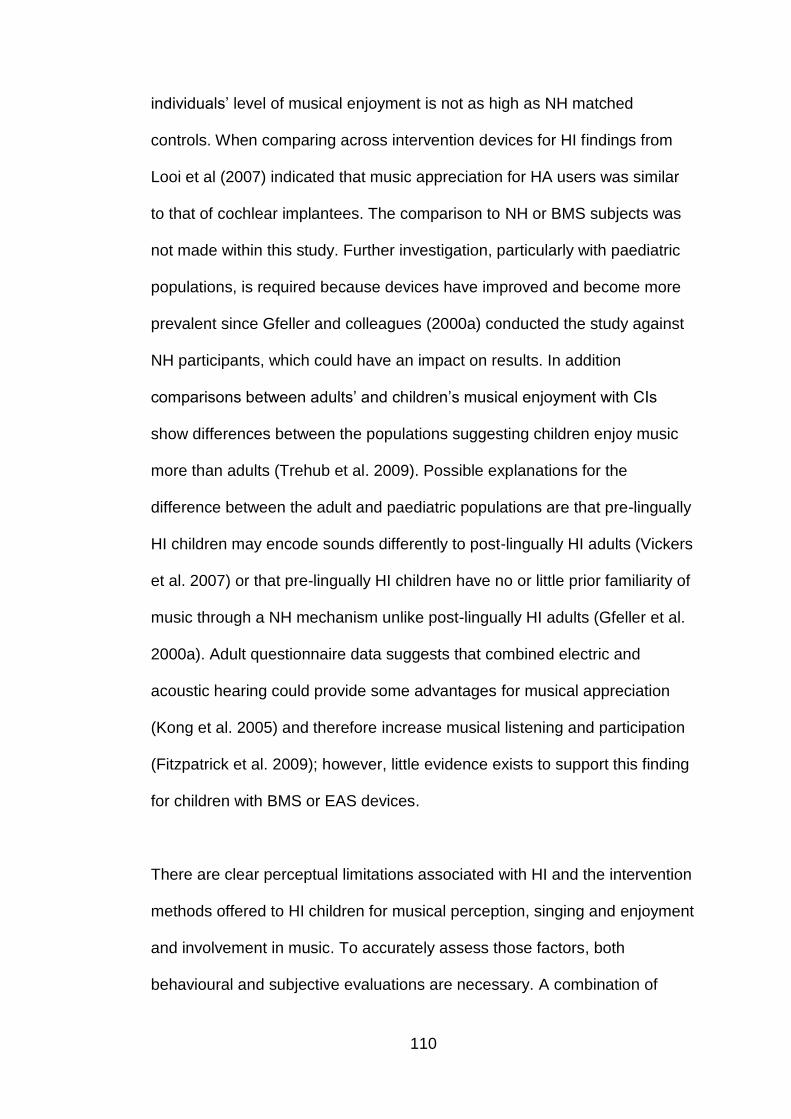
110
individuals’ level of musical enjoyment is not as high as NH matched
controls. When comparing across intervention devices for HI findings from
Looi et al (2007) indicated that music appreciation for HA users was similar
to that of cochlear implantees. The comparison to NH or BMS subjects was
not made within this study. Further investigation, particularly with paediatric
populations, is required because devices have improved and become more
prevalent since Gfeller and colleagues (2000a) conducted the study against
NH participants, which could have an impact on results. In addition
comparisons between adults’ and children’s musical enjoyment with CIs
show differences between the populations suggesting children enjoy music
more than adults (Trehub et al. 2009). Possible explanations for the
difference between the adult and paediatric populations are that pre-lingually
HI children may encode sounds differently to post-lingually HI adults (Vickers
et al. 2007) or that pre-lingually HI children have no or little prior familiarity of
music through a NH mechanism unlike post-lingually HI adults (Gfeller et al.
2000a). Adult questionnaire data suggests that combined electric and
acoustic hearing could provide some advantages for musical appreciation
(Kong et al. 2005) and therefore increase musical listening and participation
(Fitzpatrick et al. 2009); however, little evidence exists to support this finding
for children with BMS or EAS devices.
There are clear perceptual limitations associated with HI and the intervention
methods offered to HI children for musical perception, singing and enjoyment
and involvement in music. To accurately assess those factors, both
behavioural and subjective evaluations are necessary. A combination of

111
assessments can then give valuable information on the impact of HI and the
associated interventions.
The aim of this research was to determine whether there are differences in
general musical ability (including musical involvement and enjoyment), pitch
perception and singing ability between children using different amplification
methods (BCI, BHA and BMS) and also whether HI children have different
competency and ability levels when compared to NH children and normative
or baseline data associated with the selected test materials.
Research Questions
• Do differences exist between different groups of HI children using different
amplification devices for their hearing loss in terms of general musical ability,
pitch perception and singing ability?
• Are there differences in general musical ability, pitch perception and singing
ability between HI and NH children?
5.2 Methods
The research protocol for the main study phase is shown in Figure 10. All
participants followed the same protocol regardless of their hearing devices
(BCI, BHA, or BMS). There were a number of participants unable to
complete parts of the full test battery; in these cases data from the completed
tasks were collected and used within the analyses. Participants’
demographic information is provided for each test material, as well as
overall, so that information of the sample that completed that test is given.
112
One child was unable to complete the full battery of tests in one session due
to time constraints, so a second session was arranged within two weeks of
the original test session to ensure that all tests could be conducted. A NH
group were also recruited, so that the scores from the HI children could be
compared to NH children tested with exactly the same test set up, as well as
to test material normative values. The NH group included within the main
study phase were the same 13 children who completed the pilot study. They
repeated the test session for the main study phase approximately five
months after being tested within the pilot study. It is acknowledged that this
NH group may have additional advantage over the other experimental
groups due to practice effect experienced by repeating the test battery but
including a NH group was deemed valuable to provide additional
comparisons with the same experimental conditions.

113
Figure 10. Research stages and study protocol for the main study phase.
5.2.1 Ethics approval
Ethical approval for the research was obtained from the NHS London REC 2
committee after review of the research protocol (REC reference:
11/LO/0236). Approvals were also gained from research and development
departments at each hospital trust involved with the project prior to
recruitment. This approval covered recruitment from charities and schools.
RECRUIT
GATHER INFORMATION FROM MEDICAL
NOTES/PARENTS
TEST SESSION ONE-
2 weeks
REPEAT SESSION 1,
IF NECESSARY
ETHICAL APPROVAL
Musical Ability (including emotional aspects)- MSP Parental Questionnaire
Perception- PMMA test battery: Tone/Pitch discrimination task Rhythm discrimination task
Production- NSP Child Singing Assessment recorded with electrolaryngography
Expressive Vocabulary Age (a proxy for developmental Age)- Renfrew Word Finding Vocabulary test

114
5.2.2 Recruitment
There were two methods of recruitment for the research:
a) A member of the child's healthcare team or school sent a letter of
invitation to the child’s parents, along with the postal information sheet
(Appendix 2). If the parents wished to take part, they returned a tear-
off slip to the researcher. Consent was obtained by the researcher at
the start of the first testing session using the consent form (Appendix
3).
b) Adverts were published in newsletters of schools and charities such
as the Cochlear-Implanted Children's Support Group (CICS), National
Deaf Children’s Society (NDCS) and Ear Foundation. Interested
parents were then sent a copy of the postal information sheet
(Appendix 4). If the parents wished to take part, they returned a tear-
off slip and full consent was obtained at the start of the first
assessment session with the consent form.
5.2.3 Gathering of information
After the parents had given consent, the direct healthcare team consulted the
child's medical notes to provide researcher with demographic details,
audiological status and test results. If recruited through a charity or school
parents and teachers provided the necessary information at test session one.
5.2.4 Test Session One
Test sessions took place in a quiet room (under 45dBA measured with a
sound level meter) at the UCL Ear Institute or in the participant’s own home

115
or school. The parent and child were greeted and a review of parental
information and completion of consent forms took place. The child also had
the research study explained to them with assistance from children’s
information sheet (Appendix 5). During the session participants completed
pitch and rhythm aspects of the PMMA test battery, the NSP Child Singing
Assessment (recorded with a laryngograph) and an expressive vocabulary
test (Renfrew Word Finding Vocabulary test; Renfrew,2010; fourth edition) to
determine the child’s expressive vocabulary age (a proxy for developmental
age) (Bloom 1993; Hoff 2005). This was considered an important component
of the research because large differences in developmental stage could have
an impact on performance and therefore needed to be accounted for in the
analysis. In the Renfrew test the children had to identify and name the
pictures presented on individual cards and a score was calculated based on
the amount of correctly identified pictures. The score was compared to tables
of developmental age. This test was not included within the pilot study as
participants should not complete the Renfrew within six months of first
completing it and therefore the gap between test sessions would not have
sufficient in order to use the Renfrew in both.
While each child completed the test battery parents were asked to complete
the MSP questionnaire in a separate room. Where children were tested
within school, the MSP questionnaire, study information and consent forms
were sent home, completed and returned on the day of the test session.

116
5.2.5 Participants
57 participants were identified and recruited from paediatric Cochlear Implant
and Audiology departments, charities and schools in and around the London
area. The NHS recruitment sites are listed in Table 6. In addition to NHS
sites, participants were recruited through the NDCS, CICS, The Ear
Foundation, Cowley Hill Primary School, Darrick Wood Primary School and
Maple Primary School.
Table 6. NHS recruitment sites for the study
NHS Hospital
Recruiting Department(s)
Royal National Nose, Throat and Ear Hospital – London
Paediatric Audiology & Cochlear Implants
Great Ormond Street Hospital – London
Paediatric Audiology & Cochlear Implants
Bedford Hospital – Bedford Paediatric Audiology
Peace Children’s Centre – Watford Paediatric Audiology
Royal Berkshire Hospital – Reading Paediatric Audiology
Children were grouped according to the device used to manage their HI. Of
the 57 participants13 had NH. There were four groups in total – Bilateral
cochlear implantees (BCI), bilateral hearing aided participants (BHA),
bimodal stimulation users (BMS), and normally hearing participants (NH).
Inclusion and Exclusion criteria for the research were set out to ensure that
each participant was able to complete the intended test battery successfully
and allow accurate comparisons across groups. The criteria for the HI

117
participants are listed in Table 7. Inclusion criteria for the NH group was to
have hearing thresholds 20dBHL or better (at 500Hz, 1kHz, 2kHz and 4kHz)
and having good English language knowledge defined as children having
been within mainsteam UK education since aged four.
Table 7. Inclusion and exclusion criteria for HI children included in study
Inclusion Criteria Exclusion Criteria
Aged 4-9 years
Moderate to profound hearing impairment (better hearing ear 0.5-4kHz average)
Using either CI’s, HA’s or BMS
Have used intervention for at least 6 months
Hearing loss diagnosed under 2 years of age
Have good English language knowledge (due to test materials involved)
Primarily an Aural Communicator
Cases where there was a conductive/fluctuating element to hearing loss
Asymmetrical losses (average 0.5-4kHz to be within 20dBHL between right and left ears)
5.2.5.1 Demographic summary
The children’s mean chronological age was 82.12 months (SD 15.8) and the
gender distribution was 25 male to 32 female. Four children could not
complete the Renfrew Word Finding Vocabulary Test due to cognitive
development issues so these children could not be controlled for in terms of
developmental age. The vocabulary age of the remaining sample was 76.9

118
months (SD 17.2). Differences between chronological and developmental
age for the sample was investigated through two one-way ANOVAs. No
significant differences were shown between the groups (BCI, BHA, BMS,
NH) at the p<0.05 level. The sample included 13 children from minority
ethnic backgrounds (Group split: BCI=5, BHA=7,BMS=1,NH=0). Every child
had English as their primary language with no parents reporting that their
child was bilingual. However 13 children within the sample spoke additional
languages (Group split: BCI=4, BHA=4, BMS=4, NH=1). Reported additional
languages were Lithuaiuian (n=1), BSL (n=2), Italian (n=1), Urdu (n=3),
Arabic (n=1), Hebrew (n=2), French (n=1), Cantonese (n=1- within BCI
group) and Japanese (n=1- within BMS group).Each child’s special
educational needs (SEN) status was obtained from their school records and
it was confirmed that all of the children with SEN status had been
categorised based primarily on their permanent hearing loss. Parental
questionnaires were completed by either the mother or father of the child.
The sample was split based on the intervention device used for HI (BCI,
BHA, BMS and NH). Demographic information for each separate group is
shown in Table 8.

119
Table 8. Demographic information for groups included in the study
Group N=57
BCI BHA BMS NH
Number of subjects 15 21 8 13
Mean Age (months) (SD)
80 18.1
83.2 13.8
91.3 20.4
77.2 11.9
Mean Expressive vocabulary Age (months) * N=53 (SD)
76.1 20.1
72.9 17.8
84.3 15.4
80.6 12.8
Gender Distribution (percentage)
Male= 40 Female= 60
Male= 52 Female= 48
Male= 38 Female= 62
Male= 39 Female= 61
4 Frequency Average (0.5-4kHz) Hearing Threshold (dBHL)
104 68 98.3 Under 20**
Year group distribution (percentage)
Rec = 13.3 Year 1= 20 Year 2= 46.7 Year 3= 13.3 Year 4= 0 Year 5= 6.7
Rec = 4.8 Year 1= 19 Year 2= 42.9 Year 3= 19 Year 4= 14.3 Year 5= 0
Rec = 12.5 Year 1= 12.5 Year 2= 12.5 Year 3= 25 Year 4= 25 Year 5= 12.5
Rec = 7.7 Year 1= 46.2 Year 2= 38.5 Year 3= 0 Year 4= 7.7 Year 5= 0
Special Educational Needs Status (SEN) (percentage)
None = 13.3 School Action= 0 School Action Plus= 0 Statemented = 86.7
None = 9.5 School Action= 9.5 School Action Plus= 9.5 Statemented = 71.4
None = 0 School Action= 0 School Action Plus= 12.5 Statemented = 87.5
None = 100 School Action= 0 School Action Plus=0 Statemented = 0
Aetiology of HI (no.)
Genetic = 6 Cytomegalovirus = 0 Jaundice = 1 Meningitis = 2 Unknown = 6 Syndrome = 0
Genetic = 7 Cytomegalovirus = 2 Jaundice = 0 Meningitis = 0 Unknown = 11 Syndrome =1
Genetic = 3 Cytomegalovirus = 1 Jaundice = 0 Meningitis = 0 Unknown = 2 Syndrome =2
N/A
Manufacturer of HI management devices (no. of children with devices)***
Advanced Bionics = 1 Cochlear = 13 Med-el = 1
Oticon = 5 Phonak = 16
Advanced Bionics & Phonak = 4 Cochlear & Phonak = 4
N/A
* Four children (of the 57) were not included in these figures because they
were unable to complete the Renfrew test (BCI11, BHA10, BMS 8 & NH4)
** NH children all had their hearing screened at a level of 20dBHL (500Hz,
1kHz, 2kHz and 4kHz) within pilot study
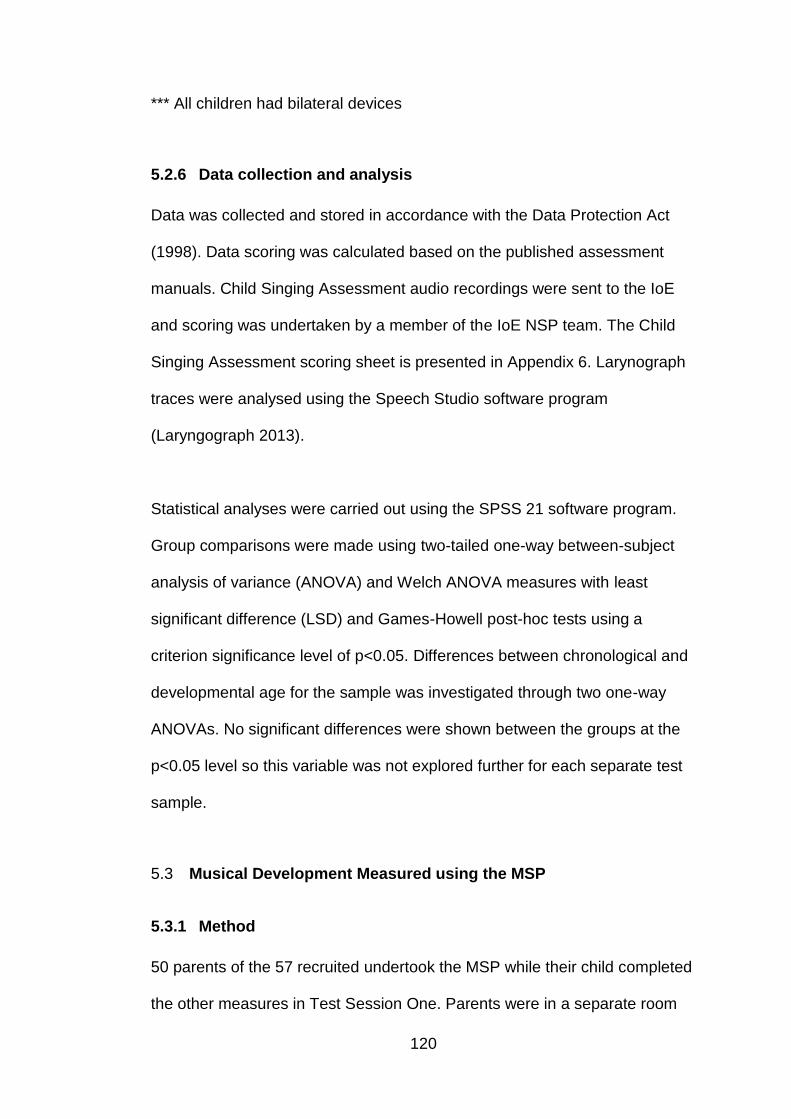
120
*** All children had bilateral devices
5.2.6 Data collection and analysis
Data was collected and stored in accordance with the Data Protection Act
(1998). Data scoring was calculated based on the published assessment
manuals. Child Singing Assessment audio recordings were sent to the IoE
and scoring was undertaken by a member of the IoE NSP team. The Child
Singing Assessment scoring sheet is presented in Appendix 6. Larynograph
traces were analysed using the Speech Studio software program
(Laryngograph 2013).
Statistical analyses were carried out using the SPSS 21 software program.
Group comparisons were made using two-tailed one-way between-subject
analysis of variance (ANOVA) and Welch ANOVA measures with least
significant difference (LSD) and Games-Howell post-hoc tests using a
criterion significance level of p<0.05. Differences between chronological and
developmental age for the sample was investigated through two one-way
ANOVAs. No significant differences were shown between the groups at the
p<0.05 level so this variable was not explored further for each separate test
sample.
5.3 Musical Development Measured using the MSP
5.3.1 Method
50 parents of the 57 recruited undertook the MSP while their child completed
the other measures in Test Session One. Parents were in a separate room

121
from their child while completing the questionnaire. The children in this
sample had a mean chronological age of 82.8 months (SD 16.4) and the
gender distribution was 22 male to 28 female. Completed parental
questionnaires were split into groups based on the mode of intervention that
the child had. The expressive vocabulary age for each child was also
determined using the Renfrew Word Finding Vocabulary Test (Renfrew
2010). The average difference between estimated vocabulary age and
chronological age was -7.4 months (M=76.4 months, SD=17.7).
Demographic information for each separate group is presented in Table 9.
Table 9. Demographic information for groups where parents had completed
the MSP
Group
BCI BHA BMS NH
Number of subjects N=50
15 21 8 6
Mean Age (months) (SD)
80 18.1
83.2 13.8
91.3 20.4
77 14.5
Mean Expressive vocabulary Age (months) * N=47 (SD)
76.1 20.1
72.9 17.8
84.3 15.4
79.8 14.4
Gender Distribution (percentage)
Male= 40 Female= 60
Male= 52.4 Female= 47.6
Male= 37.5 Female= 62.5
Male= 33.3 Female= 66.7
4 Frequency Average (.5-4kHz) Hearing threshold (dBHL)
104 67.9 98.3 Under 20**
* 3 children from the 50 were excluded from this calculation as they were
unable to perform or complete the Renfrew Vocabulary test (BCI 11, BHA10
& BMS8)

122
** All NH children had their hearing screened at 20dBHL (at 500Hz, 1kHz,
2kHz and 4kHz) within pilot study
Two-tailed one-way ANOVAs with between-subjects factor of HI group were
conducted and the LSD test for pairwise comparisons was used when a
significant main effect was found. Individual scores were compared to the
normative values for the MSP by referencing against centile curves created
from over 300 completed MSP questionnaires (see Chapter 3). Fishers exact
tests, a version of the 2 X 2 Chi-square test were used to assess whether
there were differences between groups for the proportion of participants with
scores above and below the 50th percentile. Groups were compared in a
pairwise fashion because of the limitation of the Fishers exact test only
allowing 2 X 2 comparisons. Fishers exact tests were chosen because when
the counts of participants in different percentile groups were collated some of
the cells had counts less than five. In this situation Chi-square would not be
suitable because low cell counts can lead to erroneous results due to the
approximation calculations. Comparisons between the NH, BCI, BHA and
BMS groups were examined with two-tailed one-way ANOVAs with LSD
post-hoc tests after checking the assumptions were met.
5.3.2 Results
5.3.2.1 Participant Variables
Level of HI was assessed by comparing the three HI groups’ four frequency
(500Hz, 1kHz, 2kHz and 4kHz) better hearing ear average. This was
conducted for each separate measure so that differences could be

123
established where sample size changed. The two-tailed one-way ANOVA
with group as a factor revealed that there was a significant difference shown
between the three HI groups at the p<0.05 level (F(3-46)=89.8, p=0.00, eta
squared=0.9) for the 50 participants. LSD post-hoc tests revealed the BHA
group had significantly lower four frequency better hearing average
(M=67.9dBHL, SD=13.9) than both the BCI (M=104dBHL, SD=9.9) and BMS
(M=98.3dBHL, SD=11) groups. The BCI and BMS were not significantly
different from each other. This is expected based on criteria of candidacy for
provision of CIs for children in the UK (NICE 2009).
5.3.2.2 Musical Ability Level Group Comparisons
A two-tailed one-way ANOVA with group (NH, BHA, BCI, BMS) as a factor
was conducted to explore the impact that the three different hearing devices
had on musical development, as measured by the MSP parental
questionnaire. There was a statistically significant main effect of group at the
p<0.05 level for MSP total scores (F (3-46)=3.3, p=0.03, eta squared=0.18).
Group scores are shown in Figure 11.
Figure 11. Mean total MSP scores for each intervention group (BCI, BHA,
BMS and NH)
Post-hoc comparisons using the LSD test indicated that the mean total MSP
score for the NH group (M=108.3, SD=9.7) was significantly higher than all
three HI groups (BCI: M=84.1, SD=15.6; BHA: M=84.3, SD=19.8; BMS:

124
M=83.5, SD=19.8). But that the HI groups were not significantly different
from one another.
Comparisons were also made for the separate domains (sound awareness,
melody & dynamic changes, rhythmical changes and emotional aspects)
contained within the MSP using two-tailed one-way ANOVA tests. Group
mean scores are shown in Figures 12,13, 14 and 15. No significant
differences were found between any of the groups for the sound awareness
and the emotional aspects domains at the p<0.05 level. There was a
statistically significant main effect of group for the melody & dynamic
changes (MD) domain (F(3-46)=3.6, p=0.02, eta squared=0.19) and the
rhythmical changes (R) domain (F=(3-46)3.2, p=0.02, eta squared=0.17).
Figure 12. Mean scores for MSP Sound Awareness Domain across the four
groups (BCI, BHA, BMS, NH)
Error Bars: 95% Confindence Intervals
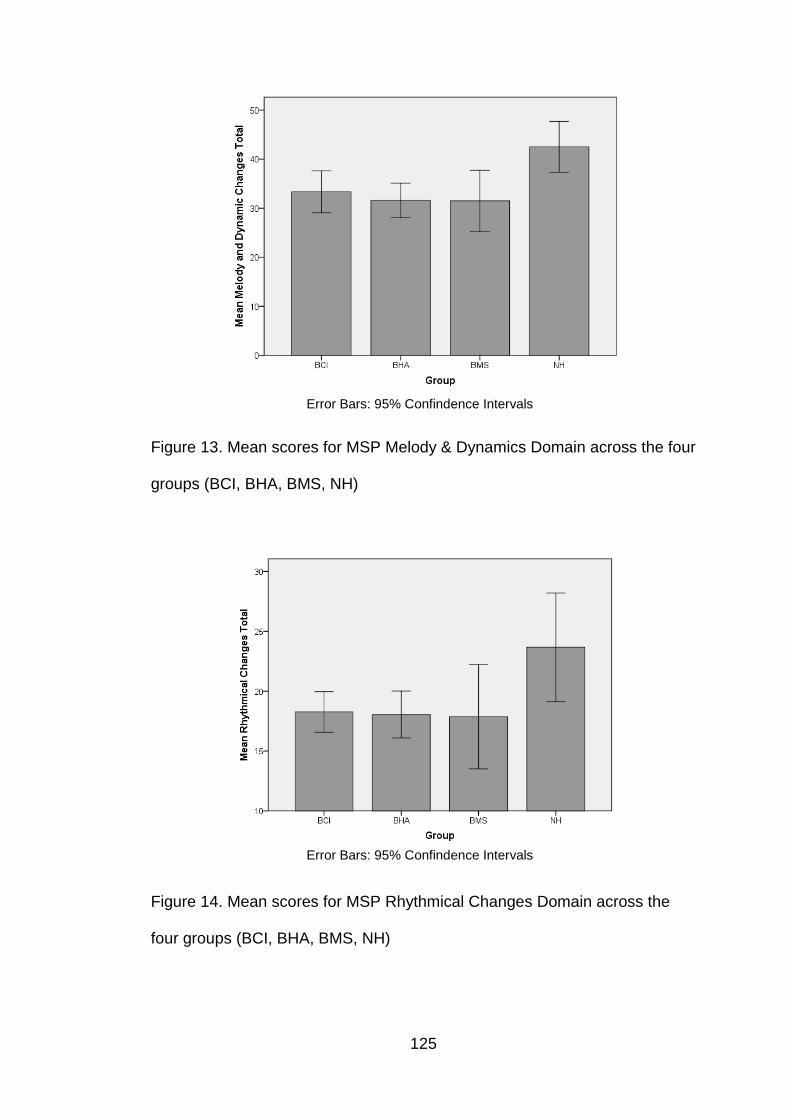
125
Figure 13. Mean scores for MSP Melody & Dynamics Domain across the four
groups (BCI, BHA, BMS, NH)
Figure 14. Mean scores for MSP Rhythmical Changes Domain across the
four groups (BCI, BHA, BMS, NH)
Error Bars: 95% Confindence Intervals
Error Bars: 95% Confindence Intervals

126
Figure 15. Mean scores for MSP Emotional Aspects Domain across the four
groups (BCI, BHA, BMS, NH)
Post-hoc LSD comparisons for the two significant domains (M&D and R)
indicated that mean M&D score for the NH group (M=42.5, SD=4.9) was
significantly different from all three HI groups (BCI: M=33.3, SD=7.7; BHA:
M=31.5, SD=7.7; BMS: M=31.5, SD=7.5). The mean R score for the NH
group (M=23.7, SD=4.3) was also significantly different from all three HI
groups (BCI: M=18.3, SD=3.1; BHA:M=18.0, SD=4.3; BMS:M=17.9,
SD=5.2). No other significant differences were seen between the groups
within these domains.
Error Bars: 95% Confindence Intervals

127
5.3.2.3 Comparisons to MSP Reference Centile Charts (for Child’s
Chronological Age)
Individual participant scores were plotted on MSP reference centile charts so
that comparisons could be made to normative data previously collected from
over 300 NH children. Respondents’ total MSP scores as a function of
chronological age are presented on the reference centile curves in Figure 16.
When examining the groups visually on Figure 16 in terms of individual total
MSP scores, it can be observed that the majority of the NH group included in
this sample scored from the 50th centile upwards in comparison to the
normative values; whereas the majority of HI respondents fell below the 50th
centile irrespective of their method of intervention. The NH subjects’ data
points are similar to pilot study results indicating that subjects had not
developed significantly since their parents completed the MSP questionnaire
five months before. The distribution of respondent scores in each centile is
shown in Table 10. Fishers exact tests were performed relating to the
distribution of centiles for total MSP score based on group. Results showed a
significant difference between distribution of centile scores (above 50th
centile versus below 50th centile) for the NH group and all the other HI
groups (BHA p=0.01, BMS p=0.03 and BCI p<0.01). No significant
differences were shown between the pairings of different HI groups on this
measure indicating no overall intervention advantage for musical ability.

128
Figure 16. Respondent MSP total scores related to chronological age on
reference centile chart. The lines depict different centile levels and the
symbols relate to individual children from each of intervention groups (NH,
BCI, BMS and BHA)
Table 10. Distribution of respondent total MSP scores within each centile of
the MSP reference centile chart (for child’s chronological age)
Groups/ Domains
Total MSP Score
Centile
<3 3-10 10-25 25-50 50-75 75-90 90-97 >97
NH Count %
0 0
0 0
0 0
1 16.7
2 33.3
2 33.3
1 16.7
0 0
BCI
Count %
3 20
4 26.7
2 13.3
5 33.3
0 0
1 6.7
0 0
0 0
BHA Count %
6 28.6
3 14.3
4 19
3 14.3
2 9.5
2 9.5
1 4.8
0 0
BMS –
Count %
3 37.5
1 12.5
1 12.5
2 25
0 0
1 12.5
0 0
0 0

129
Individual domain scores for the MSP questionnaire were also examined
against corresponding reference centile charts. These are presented in
Figure 17. Distribution of respondent scores for each domain contained
within the MSP questionnaire in each centile are presented in Table 11. In
terms of sound awareness and emotional aspects there was a wide spread
across the centile chart with no particular pattern in terms of intervention
method for hearing loss. Fishers exact tests between the groups and
distribution of centiles (above versus below 50th centile) showed no
significant differences between any pairing of the included groups at the
p<0.05 level for either of these domains. Across the other domains (melody
& dynamics and rhythm) on inspection of Figure 17 the NH group appear to
perform better than the other groups with the lowest scoring NH participant
consistently falling above the 10th centile; whereas the lowest scoring
participants within the HI groups fall below the 3rd centile of the normative
values. Fishers exact tests comparing groups for the Melody & Dynamics
domain show distribution of centiles are significantly different between the
NH group and other HI groups (BHA p=0.00, BMS p=0.03 and BCI p=0.04).
Within the rhythmical domain Fishers Exact tests only show a significant
difference between the distribution of centiles for the NH and BHA groups
(p=0.02), all other group comparisons are not significant at the p<0.05 level.
Across the different intervention methods within the HI groups there is no
distinguishable pattern and individual scores seem to be spread across the
centile ranges, Fishers exact tests results confirm this because no significant
differences between the HI groups were found for any of the domains
included on the MSP questionnaire.

130
Figure 17. Respondent domain scores (A-Sound Awareness, B-Melody &
Dynamics, C-Rhythmical changes and D- Emotional aspects) in relation to
chronological age on reference centile chart. The lines depict different centile
levels and the symbols relate to individual children from each of intervention
groups (NH, BCI, BMS and BHA)

131
Table 11. Distribution of Respondent Scores in each MSP domain within
each centile on the MSP reference centile chart (for child’s chronological
age). Count values and percentages are shown
Groups/ Domains
Centile
<3 3-10 10-25 25-50 50-75 75-90 90-97 >97
SA Score
NH
Count %
0 0
0 0
1 16.7
1 16.7
1 16.7
0 0
3 50
0 0
BCI Count %
0 0
1 6.7
3 20
4 26.7
6 40
1 6.7
0 0
0 0
BHA Count %
2 9.5
1 4.8
1 4.8
6 28.6
4 19
1 4.8
6 28.6
0 0
BMS Count %
0 0
1 12.5
3 37.5
1 12.5
0 0
2 25
1 12.5
0 0
M&D Score
NH Count %
0 0
0 0
1 16.7
0 0
1 16.7
4 66.7
0 0
0 0
BCI Count %
2 13.3
4 26.7
2 13.3
3 20
2 13.3
1 6.7
1 6.7
0 0
BHA Count %
4 19
7 33
4 19
3 14.3
1 4.8
2 9.5
0 0
0 0
BMS Count %
1 12
4 50
0 0
2 25
1 12.5
0 0
0 0
0 0
R Score
NH Count %
0 0
0 0
0 0
2 33.3
2 33.3
0 0
2 33.3
0 0
BCI Count %
0 0
4 26.7
4 26.7
4 26.7
3 20
0 0
0 0
0 0
BHA Count %
4 19
2 9.5
6 28.6
6 28.6
2 9.5
0 0
1 4.8
0 0
BMS Count %
2 25
1 12.5
2 25
1 12.5
1 12.5
0 0
1 12.5
0 0
EA Score
NH Count %
0 0
0 0
1 16.7
3 50
0 0
2 33.3
0 0
0 0
BCI Count %
4 26.7
1 6.7
5 33.3
4 26.7
1 6.7
0 0
0 0
0 0
BHA Count %
6 28.6
4 19
2 9.5
2 9.5
4 19
2 9.5
0 0
1 4.8
BMS Count %
3 37.5
0 0
2 25
0 0
2 25
1 12.5
0 0
0 0
SA – Sound Awareness, M&D – Melody & Dynamics, R – Rhythmical
changes, EA – Emotional Aspects
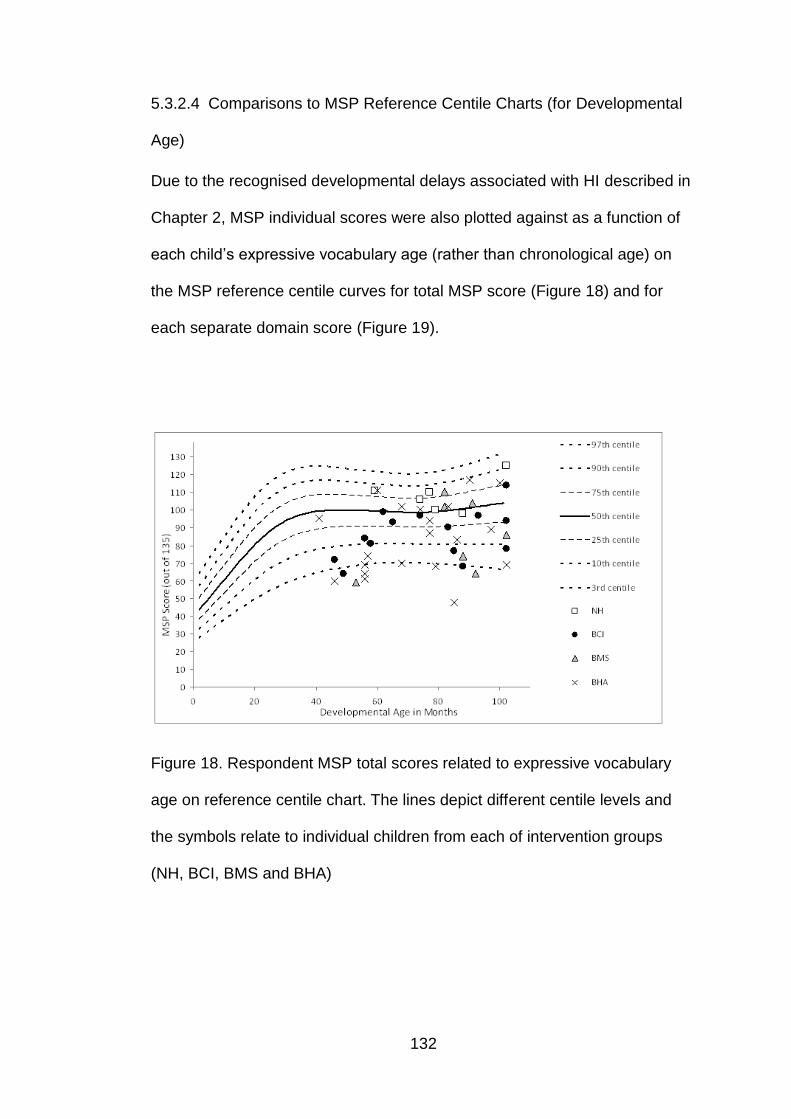
132
5.3.2.4 Comparisons to MSP Reference Centile Charts (for Developmental
Age)
Due to the recognised developmental delays associated with HI described in
Chapter 2, MSP individual scores were also plotted against as a function of
each child’s expressive vocabulary age (rather than chronological age) on
the MSP reference centile curves for total MSP score (Figure 18) and for
each separate domain score (Figure 19).
Figure 18. Respondent MSP total scores related to expressive vocabulary
age on reference centile chart. The lines depict different centile levels and
the symbols relate to individual children from each of intervention groups
(NH, BCI, BMS and BHA)

133
Figure 19. Respondent domain scores (A-Sound Awareness, B-Melody &
Dynamics, C-Rhythmical Changes and D-Emotional Aspects) related to
developmental age on reference centile chart. The lines depict different
centile levels and the symbols relate to individual children from each of
intervention groups (NH, BCI, BMS and BHA)
Visual examination of reference centile curves created for developmental
age show similar results to chronological age. Actual distribution of
respondent scores within each centile is shown in Table 12 for total MSP
score and Table 13 for other MSP questionnaire domains. As reported for
chronological age, difference in distribution of respondents in centiles (above
vs below 50th centile) was investigated between pairings of groups included
in the sample using Fishers exact tests. For total MSP score the only

134
significant difference shown was between the NH and BCI group at the
p<0.05 level.
For the separate domains included within the questionnaire there were
significant differences shown between the NH group and all three of the
hearing-impaired groups (BHA p=0.00, BMS p=0.03 and BCI p=0.02) in
terms of Melody & Dynamics and no significant differences shown between
any of the groups’ distribution of scores for Sound Awareness and Emotional
Aspects at the p<0.05 level. In contrast to what was reported for
chronological age, centile distributions within the Rhythmical Changes
domain showed a significant difference between the NH and BCI groups
(p=0.01) but not any other group combinations at the p<0.05.
Table 12. Distribution of respondent total MSP scores within each centile of
the MSP reference centile chart (for expressive vocabulary age – 47
respondents)
Groups/ Domains
Total MSP Score
Centile
<3 3-10 10-25 25-50 50-75 75-90 90-97 >97
NH –
Count %
0 0
0 0
0 0
1 16.7
2 33.3
2 33.3
1 16.7
0 0
BCI –
Count %
2 14.3
4 28.6
2 14.3
5 35.7
1 7.1
0 0
0 0
0 0
BHA -
Count %
7 35
2 10
3 15
2 10
3 15
3 15
0 0
0 0
BMS –
Count %
2 28.6
1 14.3
1 14.3
0 0
2 28.6
1 14.3
0 0
0 0

135
Table 13. Distribution of Respondent Scores in each MSP domain within
each centile on the MSP reference centile chart (for developmental age – 47
respondents)
Groups/ Domains
Centile
<3 3-10 10-25 25-50 50-75 75-90 90-97 >97
SA Score
NH –
Count %
0 0
0 0
1 16.7
1 16.7
0 0
1 16.7
3 50
0 0
BCI –
Count %
0 0
1 7.1
3 21.4
5 35.7
3 21.4
2 14.3
0 0
0 0
BHA –
Count %
2 10
1 5
2 10
3 15
7 35
0 0
5 25
0 0
BMS –
Count %
0 0
1 14.3
2 28.6
1 14.3
1 14.3
1 14.3
1 14.3
0 0
M&D Score
NH –
Count %
0 0
0 0
1 16.7
0 0
1 16.7
4 66.7
0 0
0 0
BCI -
Count %
2 14.3
3 21.4
4 28.6
2 14.3
1 7.1
2 14.3
0 0
0 0
BHA -
Count %
5 25
6 30
3 15
3 15
2 10
1 5
0 0
0 0
BMS -
Count %
1 14.3
3 42.9
0 0
2 28.6
1 14.3
0 0
0 0
0 0
R Score
NH –
Count %
0 0
0 0
0 0
2 33.3
2 33.3
0 0
1 16.7
1 16.7
BCI –
Count %
0 0
2 14.3
6 42.9
5 35.7
0 0
1 7.1
0 0
0 0
BHA -
Count %
3 15
2 10
6 30
5 25
3 15
0 0
1 5
0 0
BMS –
Count %
1 14.3
3 42.9
0 0
1 14.3
1 14.3
0 0
1 14.3
0 0
EA Score
NH –
Count %
0 0
0 0
1 16.7
3 50
0 0
2 33.3
0 0
0 0
BCI –
Count %
3 21.4
2 14.3
4 28.6
4 28.6
1 7.1
0 0
0 0
0 0
BHA –
Count %
6 30
3 15
2 10
3 15
3 15
2 10
0 0
1 5
BMS –
Count %
2 28.6
0 0
3 42.9
0 0
1 14.3
1 14.3
0 0
0 0
SA – Sound Awareness, M&D – Melody & Dynamics, R – Rhythmical
changes, EA – Emotional Aspects

136
5.3.3 Discussion
The aim of the research conducted with the MSP questionnaire was to
determine if there were differences in general musical development for
different hearing device (BCI, BHA or BMS) users. Comparisons between the
HI groups indicated that there were no significant differences between the
groups across these intervention methods with respect to overall musical
development level.
When considering the separate domains of the MSP questionnaire, results
from the Melody & Dynamic changes domain showed no significant
differences between intervention groups which is in contrast to the Looi and
Radford (2011) study which also focussed on pitch perception. In that study,
paediatric CI and BMS users scored significantly lower than HA users. The
differences in results obtained could be attributed to the fact that the Melody
and Dynamics section of the MSP relates not only to pitch perception but
also to identification and discrimination of dynamic changes. Results from
the rhythmical, sound awareness and emotional aspects domains also show
no significant differences between device groups. An adult study using the
Musical Sounds in Cochlear Implants (Mu.S.I.C) test battery support these
findings because they also did not show significant differences between CI,
HA and BMS groups for these perceptual areas (Brockmeier et al. 2010)
although this could also be attributed to the test battery not being sensitive
enough to detect differences.

137
Although no particular intervention method was shown to be advantageous
for musical development the results showed that not surprisingly, all the HI
groups scored lower than the NH group on the total MSP score. This was
also demonstrated when comparing scores to the normative centile
distributions across the groups. Respondents within the NH group performed
in a higher percentile range than their HI counterparts. On further
examination of the lower scores for the HI children it shows that they are
heavily influenced by the perceptual domains of Melody & Dynamics and
also Rhythm rather than the Sound Awareness and Emotional Aspects
domains. These lower perceptual domain scores are expected based on the
fact that HI individuals will have additional challenges with perception based
on not only their hearing loss but also on the processing limitations of their
different devices (Chasin and Russo 2004; Limb and Rubinstein 2012; Moore
and Carlyon 2005; Scattergood and Limb 2010). These results are supported
by studies demonstrating that CI children perform significantly worse than
NH children in perceptual tasks (Vongpaisal et al. 2006; Vongpaisal et al
2009). The comparisons made with the NH group within this study should
however be taken with caution as parents had previously answered the
questionnaire (within the pilot study) and they also appear to be a high
performing NH group compared with the normative data.
It is interesting to note that even though difficulties are reported in the
perceptual domains for the HI groups, mean scores within the emotional
aspects domain are not significantly lower than the NH group indicating that
their enjoyment and appreciation may be not be considerably different to that

138
of a NH child irrespective of their difficulties. These results are supported by
findings from Stordahl (2002) where CI recipients performed similarly to NH
participants in terms of self-reported musical involvement and music listening
habits.
The numbers in this study were small (50 children) for separating into
groups. However individual scores were compared against the centile charts
for the children’s developmental stage to be able to explore both group and
individual levels of performance.
5.4 Pitch Perception (measured via PMMA test battery)
5.4.1 Methods
55 of the participants took part in the PMMA tone and rhythm tests. The 55
children’s mean chronological age was 82.7 months (SD 15.8) and the
gender distribution was 23 male to 32 female. The average difference
between estimated vocabulary age and chronological age for children who
could complete Renfrew (n=51) was -6.3 months (M= 77 months; SD= 17.2).
All HI children were split into groups based on the mode of intervention (BCI,
BHA & BMS). Of the 55 participants 13 of them were children with NH.
Demographic information for each separate group is presented in Table 14.
Participant variables and grouping comparisons were examined with one-
way between-subjects ANOVAs with LSD post-hoc tests after checking the
assumptions were met.

139
Table 14. Demographic information for groups included in PMMA dataset
Group N=55
BCI BHA BMS NH
Number of subjects 15 20 7 13
Mean Age (months) (SD)
80 18.1
83.7 14
95.9 16.9
77.2 11.9
Expressive vocabulary Age (months) * N=53 (SD)
76.07 20.1
72.9 17.8
84.3 15.4
80.6 12.8
Gender Distribution (percentage)
Male= 40 Female= 60
Male= 50 Female= 50
Male= 28.6 Female= 71.4
Male= 38.5 Female= 61.5
4 Frequency Average (.5-4kHz) Hearing threshold (dBHL)
104 67.4 98.6 Under 20**
* Two children (of the 55) were not included in these figures as they were
unable to complete the Renfrew test (BCI11& NH4)
**All NH children had their hearing screened at 20dBHL (at 500Hz, 1kHz,
2kHz and 4kHz) within pilot study
5.4.2 Results
5.4.2.1 Participant Variables
The level of hearing (based on participants’ better hearing ear 4 frequency
average in dBHL) was analysed with a two-tailed one-way ANOVA with
group as a factor. NH participants were not included when comparing level of
HI. There was a significant difference at the p<0.05 level (F(2,39)=42.1, p=0.00,
eta squared=0.7). Post hoc comparisons using LSD test indicated the BHA
(M=67.4, SD=14.1) group had a significantly lower mean hearing level to

140
both the BCI (M=104, SD=9.9) and BMS (M=98.6, SD=11.9) groups. The
BCI and BMS were not significantly different from each other.
5.4.2.2 Pitch Perception
Raw tone PMMA score was used as a measure of pitch perception. Group
scores are shown in Figure 20. A two-tailed one-way ANOVA was conducted
with group as a factor. There was a significant difference at the p<0.05 level
(F(3-51)=4.9, p=0.004, eta squared= 0.2). Post hoc comparisons using the LSD
test indicated that the BCI group (M=24.4, SD=4.5) had a significantly lower
score than the other three groups, including both HI groups (BHA M=28.6,
SD=4.5; BMS M=29.14, SD=3.9; NH M=30.6, SD=4.5). No other significant
differences are observed between the groups.
Figure 20. Mean tone raw score across the four groups (BCI, BHA, BMS &
NH)

141
5.4.2.3 Comparisons to PMMA pitch normative data
Within each group (BCI, BHA, BMS and NH) participants were further split
into four groups (Kindergarten, Grade 1, Grade 2, Grade 3) so that
comparisons could be made with normative data. Mean raw pitch score
based on these age groupings for chronological age is shown in Table 15
and developmental age in Table 16.The amount of standard deviations from
the normative mean is indicated by colour coding.
Table 15. Raw mean pitch score (out of 40) for each age group (based on
chronological age) on PMMA task
Age Grouping (based on chronological age)
Pitch mean raw score (out of 40)
BCI BHA BMS NH
Kindergarten (age 48 – 72 months old)
23 (SD 5.2)
29 (SD 5.7)
26 (SD 0)
28 (SD 4.9)
Grade 1 (age 73 – 84 months old)
23.9 (SD 3.9)
28.1 (SD 2.0)
27 (SD 0)
29 (SD 0)
Grade 2 (age 85 – 96 months old)
28.5 (SD 6.4)
29 (SD 6.5)
27 (SD 0)
34 (SD 1.4)
Grade 3 (age 97 – 108 months old)
27 (SD 0)
26.8 (SD 5.1)
31 (SD 4.4)
36 (SD 0)
Within 1 SD above normative mean; Within 1 SD below normative mean;
Within 2 SD below normative mean; Within 3 SD below normative mean

142
Table 16. Raw mean pitch score (out of 40) for each age group (based on
developmental age) on PMMA task*
Age Grouping (based on developmental age*)
Pitch mean raw score (out of 40)
BCI BHA BMS NH
Kindergarten (age 48 – 72 months old)
23.8 (SD 4.9)
27.1 (SD 4.2)
27 (SD 0)
31.5 (SD 3.5)
Grade 1 (age 73 – 84 months old)
26 (SD 7.1)
30.2 (SD 3.4)
26.5 (SD 0.7)
30.8 (SD 4.0)
Grade 2 (age 85 – 96 months old)
24.3 (SD 2.3)
27 (SD 1.7)
29.3 (SD 3.5)
31.25 (SD 2.9)
Grade 3 (age 97 – 108 months old)
27.5 (SD 7.8)
29.7 (SD 8.7)
36 (SD 0)
36 (SD 0)
Within 2SD above normative mean; Within 1 SD above normative mean;
Within 1 SD below normative mean; Within 2 SD below normative mean
* Two children (of the 55) were not included in these figures as they were
unable to complete the Renfrew test (BCI11& NH4)
All age groups of children in the sample (noted in Tables 15 and 16) were
within plus or minus three standard deviations from the mean normative
ranges outlined in the PMMA test manuals for pitch raw score.
Examination of colour coding shows that the majority of NH group scores fall
above the normative mean, the only exceptions being the Grade 1 group for

143
chronological age, and the Grade 2 group for developmental age that both
fall less than one standard deviation below the normative mean.
When looking at the results for the HI groups they did not perform as well as
the NH group. Their group mean scores ranged from within one standard
deviation above the normative mean to three standard deviations below.
Further investigation of the findings shows that when groups are corrected
for developmental age all HI participants fall within the 95% confidence
interval (defined by falling within 2 standard deviations of the normative
mean), indicating that all HI groups are not significantly worse than the
normative mean values. This however is not the case when chronological
age is examined where both BCI and BHA Grade 3 groups are 3 standard
deviations below the normative mean values.
5.4.2.4 Rhythm Perception
A two-tailed one-way ANOVA was conducted to explore whether differences
were seen between the groups for rhythm raw score. No significant
differences were shown between the four groups at the p<0.05 level
(F(3,51)=0.4, df=3, p=0.7, eta squared= 0.03). Mean Rhythm raw scores for
each group are shown in Figure 21.

144
Figure 21. Rhythm raw score across the four groups (BCI, BHA, BMS& NH)
5.4.2.5 Comparisons to PMMA rhythm normative data
As was shown for pitch raw score, the relationship to rhythm normative data
was explored by splitting each group (BCI, BHA, BMS and NH) into four
further groups (Kindergarten, Grade 1, Grade 2, Grade 3). Mean raw rhythm
score based on these age groupings for chronological age is shown in Table
17 and developmental age in Table 18.The amount of standard deviations
from the normative mean is indicated by colour coding.

145
Table 17. Raw mean rhythm score (out of 40) for each age group (based on
chronological age) on PMMA task
Age Grouping (based on chronological age)
Pitch mean raw score (out of 40)
BCI BHA BMS NH
Kindergarten (age 48 – 72 months old)
27 (SD 2.6)
26.3 (SD 3.9)
31 (SD 0)
24.2 (3.0)
Grade 1 (age 73 – 84 months old)
25.9 (SD 2.9)
27.9 (SD 4.3)
21 (SD 0)
31 (4.2)
Grade 2 (age 85 – 96 months old)
30.5 (SD 5.0)
28.4 (SD 7.1)
30 (SD 0)
31.6 (SD 0.5)
Grade 3 (age 97 – 108 months old)
29 (SD 0)
27.3 (SD 3.0)
30 (SD 5.0)
34 (SD 0)
Within 3 SD above normative mean; Within 2 SD above normative mean;
Within 1 SD above normative mean; Within 1 SD below normative mean;
Within 2 SD below normative mean

146
Table 18. Raw mean rhythm score (out of 40) for each age group (based on
developmental age) on PMMA task*
Age Grouping (based on developmental age*)
Pitch mean raw score (out of 40)
BCI BHA BMS NH
Kindergarten (age 48 – 72 months old)
27.7 (SD 2.2)
24.8 (SD 3.7)
21 (SD 0)
24 (4.2)
Grade 1 (age 73 – 84 months old)
24 (SD 2.8)
31.8 (SD 2.8)
30.5 (SD 0.7)
28.6 (SD 3.3)
Grade 2 (age 85 – 96 months old)
25.7 (SD 3.5)
27.7 (SD 2.5)
28.3 (SD 4.5)
31.3 (SD 2.5)
Grade 3 (age 97 – 108 months old)
31 (SD 4.2)
28.7 (SD 6.4)
35 (SD 0)
34 (SD 0)
Within 3 SD above normative mean; Within 2 SD above normative mean;
Within 1 SD above normative mean; Within 1 SD below normative mean;
Within 2 SD below normative mean
* Two children (of the 55) were not included in these figures because they
were unable to complete the Renfrew test (BCI11& NH4)
Examination of colour coding shows that all groups included within the
sample range between three standard deviations above and two standard
deviations below the mean normative value. In contrast to pitch results the
rhythm results show no particular pattern between the different groups (BCI,
BHA, BMS and NH).

147
5.4.3 Discussion
The aim of the research conducted with the PMMA test battery was to
assess whether differences were found in pitch and rhythm perception
between the four groups (BCI, BHA, BMS or NH).
Pitch perception results showed that the BCI group scored significantly lower
than the other three groups (BHA, BMS and NH). These results are
supported by studies which show combined electric-acoustic benefit in pitch
perception with EAS devices (Gfeller et al. 2006; Gfeller et al. 2007; Golub et
al. 2012). This pattern was also observed when comparing values obtain with
chronological age to normative values for the PMMA. This effect was not
shown when groups were controlled for developmental age. These results
differ from results obtained via the MSP questionnaire within this current
research (see section 6.3.2) where no differences were shown between the
three HI groups. The discrepancy in results obtained with measures from the
current study may be attributed to the fact that the MSP questionnaire has a
combined melody and dynamics section so will not provide as refined result
for primarily pitch perception as the PMMA pitch test material. No other
significant differences were found between the groups for pitch perception
suggesting that both the BHA and BMS groups perform equally well to each
other as well as to the NH group.
In contrast to the pitch perception scores, PMMA rhythm perception scores
showed no significant differences between any of the groups (BCI, BHA,

148
BMS or BMS). This configuration of results is supported by previous
literature using the PMMA test battery (Gfeller and Lansing 1997) and other
methodologies (Kong et al 2004).
It was noted previously that the numbers in this study were small (55
children) for separating into groups. However scores were compared against
PMMA normative values for both chronological and developmental age to
reduce the impact that this might have on the analysis. It should also be
acknowledged that the NH group within the study had previously completed
the PMMA test battery within the pilot study and therefore may perform better
based on this factor. They also appear to be a high performing group in
comparison to the normative data so comparison of this group to the HI
groups should be taken with care.
5.5 Pitch Production (measured via Child Singing Assessment and
Laryngograph)
5.5.1 Method
53 children took part in the NSP Child Singing Assessment as part of the
main study phase. Larynogograph traces obtained while recording the
assessment were used to validate the IoE scoring (same method as
described within pilot study in Chapter 4) and as a means of assessing
singing voice quality through examination of spread of irregularity. The
Larynograph analysis was carried out on the sustained spoken vowels from
when the child was counting backwards from 10. The vowels were
149
concatenated and an average fundamental frequency value was measured.
This then correlated to IoE assigned centre pitch frequency which was
subjectively assigned based on the same section of speech. The frequency
of successive vocal fold vibrations (Fx) and vocal fold contact timing (Qx)
were also examined from the Larynograph traces within the singing section
of the recording (e.g. Happy Birthday, Twinkle twinkle) to obtain an indication
of spread and extent of voice irregularity. Irregularity of both Fx and Qx is
generated by observing voice fold patterns (cycle by cycle), and plotting
cycle by cycle variation on a grid of spaced lines that are separated by
distances appropriate to connected speech (Cross-plot). The central
diagonal core of this cross-plot contains only points where cycle pairs (either
Fx or Qx) differ by less than a set value 1DL (DL=just noticeable change).
Irregularity measures give the total of all the occurrences when a
corresponding pair of values falls into a cell that is outside the main central
diagonal (Fourcin 2009). In order to make visual comparisons between the
voice irregularities for each group (BCI, BHA, BMS and NH) Laryngograph
traces were appended together and cross-plots produced for the whole
group collectively as well as individually. Of the 53 who completed the
assessment five participants did not have larygograph traces due to subject
compliance.
The children’s mean chronological age was 82.4 months (SD 16.0) and the
gender distribution was 25 male to 28 female. The average difference
between estimated vocabulary age and chronological age of children that
were able to complete the vocabulary assessments (n=49) was -5.9 months

150
(Mean= 77.8 months; SD= 16.95). Demographic information for each
separate group is presented in Table 19.
Table 19. Demographic information for groups who completed the NSP Child
Singing Assessment
Group N=53
BCI BHA BMS NH
Number of subjects 14 18 8 13
Mean Age (months) (SD)
78.9 18.2
85.1 13.6
91.3 20.4
77.2 11.9
Mean Expressive vocabulary Age (months) * N=49 (SD)
77.6 20.1
73.2 17.6
84.3 15.4
80.6 12.8
Gender Distribution (percentage)
Male= 42.9 Female= 57.1
Male= 61.1 Female= 38.9
Male= 37.5 Female= 62.5
Male= 38.5 Female= 61.5
4 Frequency Average (.5-4kHz) Hearing threshold (dBHL)
104 66 98 Under 20**
* Four children (of the 53) were not included in these figures because they
were unable to complete the Renfrew test (BCI11, BHA10, BMS 8 & NH4)
** All NH children had their hearing screened at 20dBHL (at 500Hz, 1kHz,
2kHz, 4kHz) within the pilot study
In order to compare results to the baseline data collected by the IoE NSP two
extra participant groups from the IoE normative data were included in the
analysis. These groups (sing up and non-sing up) were created from the
baseline dataset and are categorised based on whether they attend a
participating sing-up school or not. The data collected in this research was
compared to baseline data from 9,494 assessments in the IoE dataset.
These assessments were selected from the IoE baseline dataset and only

151
children in the same age range as the main phase study group were
included. The full IoE database contained children from cathedral schools but
these were not included in the analysis because they were not considered to
be typical with respect to singing ability for their age.
Participant variables (hearing level) were examined with two-tailed one-way
ANOVA with LSD post-hoc tests after checking the assumptions were met.
For group comparisons for singing data, the IoE National Singing programme
baseline data was also included so that additional comparisons could be
made. This was achieved using two-tailed one-way ANOVA Welch tests with
Games-Howell post-hoc tests. This form of ANOVA and post-hoc testing was
selected because the data contained groups that were unequal in size and
variance when the additional IoE data groups were added into the dataset.
Group comparisons for singing voice quality were made with two-tailed one-
way ANOVAs with LSD post-hoc tests.
5.5.2 Results
5.5.2.1 Participant Variables
The level of hearing (based on participants better hearing ear 4 frequency
average in dBHL) of each HI group was analysed with a two-tailed one-way
ANOVA. There was a significant difference at the p<0.05 level (F(2,37)=48.8,
p=0.00, eta squared=0.7, p<0.001). Post hoc comparisons using LSD test
indicated that there was significant difference between the BHA group
(M=65.9, SD=12.7) and both the BCI (M=104.1, SD=10.3) and BMS groups
152
(M=98.3, SD=11.03). The BCI and BMS were not significantly different from
each other.
5.5.2.2 Habitual Speech Pitch Centre
Habitual speech pitch centre score was generated by each child counting
backwards from 10. As a method of validation of the IoE scoring, sections of
each participant’s larynograph traces were examined. These were the same
sample sections that the IoE staff used to determine participants’ habitual
centre frequency estimates. An average speech fundamental frequency was
determined using the speech studio software program. The result was
correlated to the IoE assigned habitual centre frequency (based on a musical
note) using two-tailed Pearson Product-Moment correlation coefficient.
There was a strong positive correlation between the two variables (r=0.87,
n=48, p=0.00). The relationship between these frequencies is shown in
Figure 22.
A two-tailed one-way ANOVA Welch test found no significant differences
between the groups for habitual speech pitch centre at the p<0.05 level. IoE
scorings were used for the group comparisons (rather than laryngograph
trace average fundamental frequency scores) so that all 53 participants’
scores would be included within the analysis along with data from IoE
baseline groups (laryngograph traces were not available for five participants
or any of the IoE baseline datasets).

153
Figure 22.Relationship between IoE assigned habitual speech pitch centre
frequency and average speech fundamental frequency obtained from
Laryngograph traces. Both taken from a section of children counting
backwards from 10 as part of the NSP child singing assessment
5.5.2.3 Comfortable Pitch Range
Comfortable pitch range was taken from the participants’ pitch slides within
the NSP assessment. Groups were compared in terms of comfortable pitch
range (in semitone) using a two-tailed one-way ANOVA Welch test. There
was a significant difference shown between the groups (F(5-32.67)=4.48,
p=0.07, eta squared=0.001) (see Figure 23). Games-Howell post-hoc tests
showed that the only significant differences were between the BCI group

154
(M=10.57, SD=3.65) and both the IoE sing up group (M=14.18, SD=5.13)
and IoE non-sing up group (M=13.84, SD=5.08).
Figure 23. Comfortable Singing Range (in semitones) across the groups
5.5.2.4 Normalised Singing Score (NSS)
NSS scores were generated based on participants’ singing behaviour to two
well-known songs (e.g. Happy Birthday and Twinkle twinkle). NSS scores
were analysed with a two-tailed one-way ANOVA Welch test with factor of
“group”. A significant difference between groups was shown (F(5-32.6)=3.53,
p=0.00, eta squared=0.02)(see Figure 24). Games-Howell post-hoc tests
revealed significant differences between the NH group (M=81.06,SD=11.20)
and the three HI groups (BCI M=54.20, SD=14.7; BHA M=61.25, SD=17.19;

155
BMS M=47.81,SD=18.09). There was no significant difference observed
between the NH group and both the Sing up and Non-sing up IoE baseline
dataset groups. There were also no significant differences shown between
the three HI groups.
Examination of IoE groups revealed that the IoE sing up group had a
significantly better NSS score (M=77.01,SD=17.83) than the three HI groups
and the IoE non-sing up group (M=71.47, SD=20.06). The non-sing up group
however only scored significantly higher than the BCI group.
Figure 24. Normalised singing score (NSS) for the different groups of
children
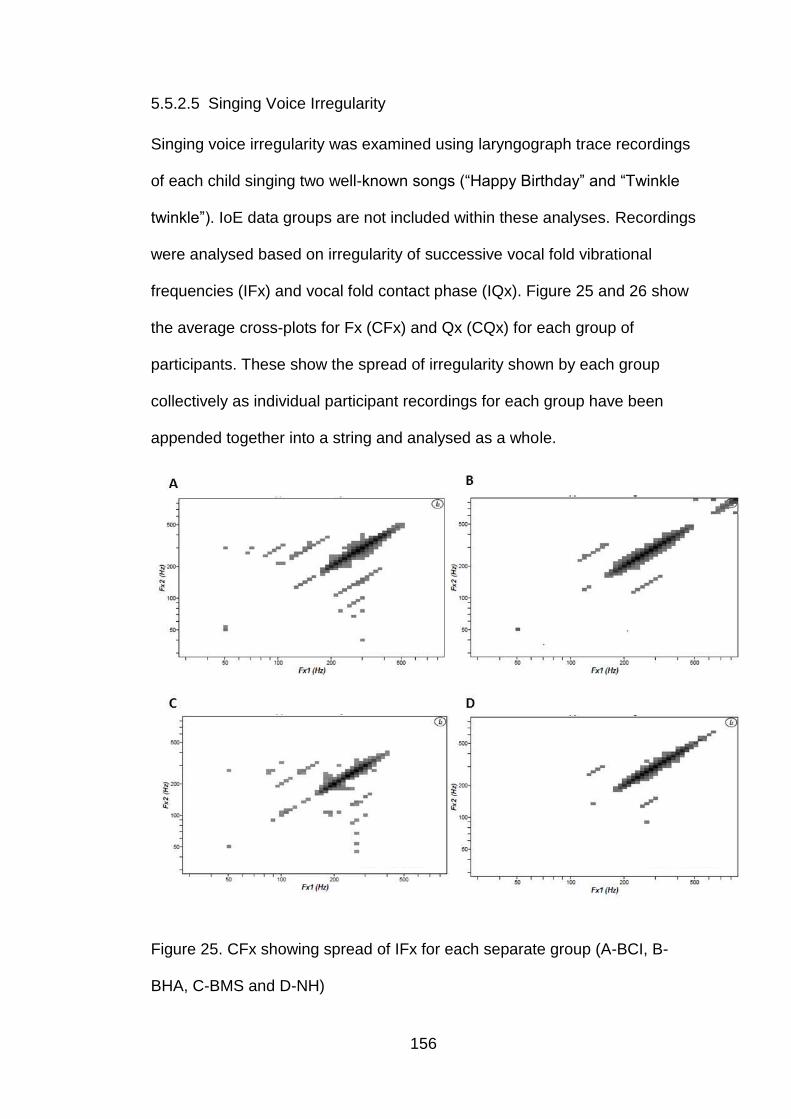
156
5.5.2.5 Singing Voice Irregularity
Singing voice irregularity was examined using laryngograph trace recordings
of each child singing two well-known songs (“Happy Birthday” and “Twinkle
twinkle”). IoE data groups are not included within these analyses. Recordings
were analysed based on irregularity of successive vocal fold vibrational
frequencies (IFx) and vocal fold contact phase (IQx). Figure 25 and 26 show
the average cross-plots for Fx (CFx) and Qx (CQx) for each group of
participants. These show the spread of irregularity shown by each group
collectively as individual participant recordings for each group have been
appended together into a string and analysed as a whole.
Figure 25. CFx showing spread of IFx for each separate group (A-BCI, B-
BHA, C-BMS and D-NH)

157
Figure 26. CQx showing spread of IQx for each separate group (A-BCI, B-
BHA, C-BMS and D-NH)
The cross-plots showed that both BCI and BMS groups had the worst voice
quality in terms of IFx due to their marked bimodal configuration. Qx is worst
for the BCI group indicating that this group had the greatest irregulairity in
terms of vocal fold contact.
Individual participant’s recording results were also used to compare the
groups in terms of voice irregularity (IFx and IQx) using a two-tailed one-way
ANOVA test. A significant difference between groups was shown at the
p<0.05 level for IQx (F(3-44)=4.1, p=0.01,eta squared=0.2) however not for IFx

158
(see Figures 27 and 28). LSD post-hoc tests indicated the IQx percentage
was significantly lower for the NH group (M=50.1%,SD=17.6%) in
comparison to both the BCI group (M=68.1%,SD=12.8%) and the BHA group
(M=63.5%, SD=11.7%) but not BMS group (M=50.0%, SD=21.8%).
When comparing the three HI group mean values, the BMS group had a
lower irregularity percentage than the other two groups, however, there was
only a significant difference between that group and the BCI group at the
p<0.05 level.
Figure 27. IFx (%) across the four groups (BCI, BHA, BMS and NH)

159
Figure 28. IQx (%) across the four groups (BCI, BHA, BMS and NH)
Due to the small number of participants, group spread of irregularity could be
highly affected by individuals who have greater spreads than what would be
expected. Figure 29 and 30 show Q-Q plots for IFx and IQx, here individual
participant data points and individual data points with those that might be
expected from normal distribution can be compared. A small amount of
deviation from the line would suggest that the data point would be close to
normality and therefore fit with the majority of the group. Small departures
from the straight lines depicted indicate there is a tendency to normality for
the majority of children within each group. Observation of the Q-Q plots show
that some participants deviate more than others from the line indicating those
participants show a greater spread of irregularity than is expected from the
rest of the group.

160
A B
C D
Figure 29 .Q-Q plots comparing observed IFx data points to expected
probabilities for each group (A-BCI, B-BHA, C-BMS and D-NH)

161
A B
C D
Figure 30.Q-Q plots comparing observed IQx data points to expected
probabilities for each group (A-BCI, B-BHA, C-BMS and D-NH)
5.5.3 Discussion
The aim of the research conducted with the NSP Child Singing Assessment
(recorded with a laryngograph) was to assess whether differences are found
in singing competency between the four groups (BCI, BHA, BMS or NH).
Singing competency was assessed through examination of Habitual Speech
Pitch Centre, Comfortable Singing range, Normalised Singing Score and
Singing Voice Irregularity (Fx and Qx).

162
Prior to examination of results connected to these singing competency areas
the IoE NSP scoring technique validity was examined by comparing average
F0 obtained from laryngograph recordings to IoE assigned habitual speech
pitch centres. A similar pattern of results was observed as seen in the pilot
study. There was a strong positive correlation between the two measures of
habitual pitch indicating that the subjective estimates used in the IoE scoring
were accurate.
Results comparing the four experimental groups (BCI, BHA, BMS and NH)
habitual speech pitch centre and comfortable pitch range showed that there
were no significant differences between the groups. However when
compared to the IoE dataset the BCI group had a significantly smaller
comfortable singing range (in semitones). This result may be expected based
on the range of accessible frequencies represented by a CI. Based on
recognised auditory feedback mechanisms one would assume that a child
will only produce pitches in the range of what they perceive (Murbe et al.
2002). The perceivable pitch range will be constraint by a number of factors.
These include electrode insertion depth and placement relating the place
pitch perception; CI frequency input range which will typically be limited
(between 100-800Hz) and based on electrode placement often be
mismatched to corresponding neurons; and by the fact that temporal pitch
perception is only represented by phase locking to the envelope of a signal
(Macherey et al. 2011). These factors will lead to poorer pitch representation
and resolution. .

163
NSS scores gave an indication of singing behaviour and competency. As
might be expected, results indicated that the NH group had a significantly
higher score than all three HI groups and the NH group was not significantly
different to the IoE dataset groups. These results concur with other studies
which also found poorer vocal pitch abilities in CI children compared to NH
groups (Nakata et al. 2006; Xu et al. 2009). The results from this current
research differ from these cited studies, as groups of HA and BMS children
are also included for comparison against NH groups. This comparison
between NH and HI groups should however be taken with caution as the NH
group had previously undertaken the singing test battery within the pilot
study and therefore there may be some practice effect observed.
When considering NSS scores for HI groups separately, no significant
differences were shown between the three groups. Based on the theoretical
knowledge of pitch representation within these different intervention devices
(discussed in Chapter 2) it may be expected that the HA and BMS groups
would perform better than the BCI group due to acoustic signal providing
better F0 information, this is not however, confirmed by the current results.
However, when singing irregularity was examined, the CI groups (BCI and
BMS) showed marked diplophonia indicating poor voice quality (known as
creaky voice) in terms of IFx. This was shown by interactions of different
pitches within simultaneous voice being observed within the CFx cross-plot
for those groups. This finding could be attributed to the degraded pitch
representation cochlear implantees experience via CI signal processing
(Moore 2003). Differences between the groups were not found to be

164
significant for IFx. When considering IQx, the BCI group showed a high
spread of irregularity, suggesting that participants were not operating well in
regard to vocal fold contact control compared with the other groups and this
was confirmed by the BCI group having significantly higher IQx than both NH
and BMS groups. Again this finding may be attributed to degraded pitch
perception based on CI processing and hardware limitations. The link
between CI perception and vocal voice control has been demonstrated by a
study showing that young CI participants (aged between 11 and 15 years
old) perform better with regard to voice pitch range, pitch regularity, vocal
fold contact phase range and contact regularity when they have access to
processing of their devices (rather than when they are switched off, meaning
they have no auditory feedback available) (Fourcin et al. 2011).
5.6 Relationships between Results
5.6.1 Methods
The relationship between the results using the different outcome measures
(MSP questionnaire, PMMA test battery and NSP Child Singing Assessment,
Laryngograph measurements) were correlated to identify associations
between different attributes or tests using a Pearson Product-Moment
correlation following exploration of data to ensure that the normality
assumptions were met. Data from the whole sample was used for the
correlation analysis; however, due to potential differences between the
groups for certain outcome measures (BCI, BHA, BMS or NH) the influence
of ‘group’ was also controlled for through partial correlation with group as a
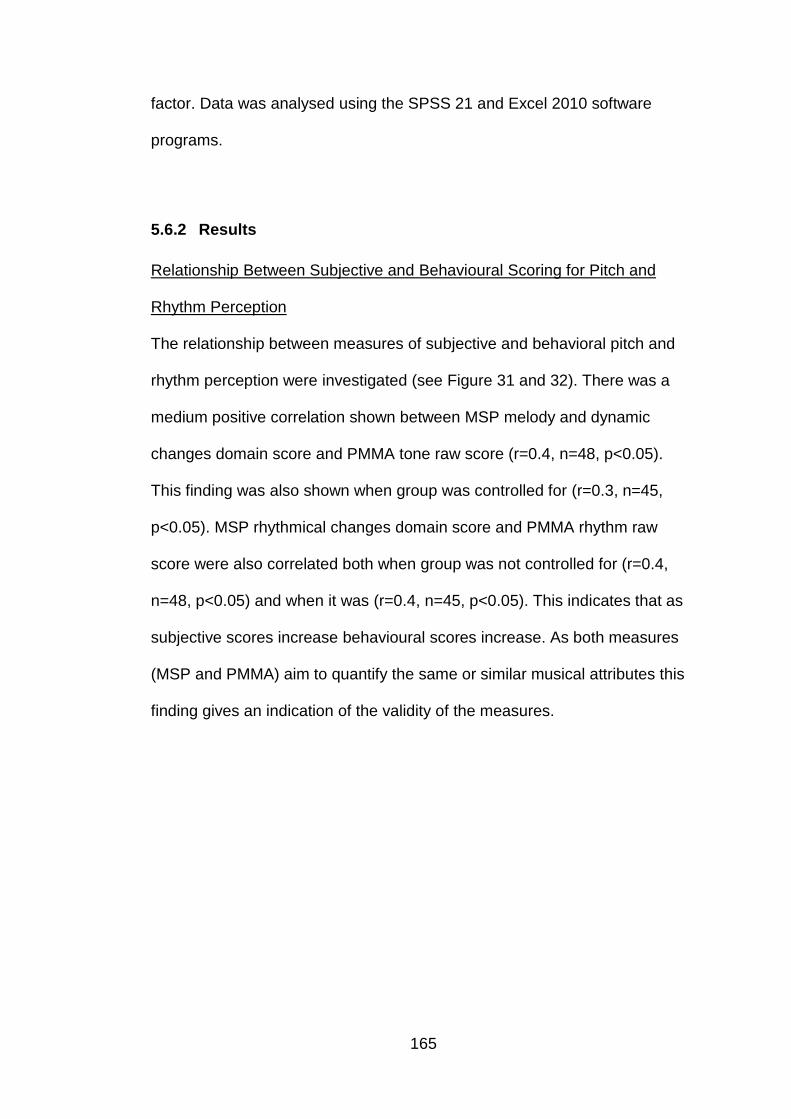
165
factor. Data was analysed using the SPSS 21 and Excel 2010 software
programs.
5.6.2 Results
Relationship Between Subjective and Behavioural Scoring for Pitch and
Rhythm Perception
The relationship between measures of subjective and behavioral pitch and
rhythm perception were investigated (see Figure 31 and 32). There was a
medium positive correlation shown between MSP melody and dynamic
changes domain score and PMMA tone raw score (r=0.4, n=48, p<0.05).
This finding was also shown when group was controlled for (r=0.3, n=45,
p<0.05). MSP rhythmical changes domain score and PMMA rhythm raw
score were also correlated both when group was not controlled for (r=0.4,
n=48, p<0.05) and when it was (r=0.4, n=45, p<0.05). This indicates that as
subjective scores increase behavioural scores increase. As both measures
(MSP and PMMA) aim to quantify the same or similar musical attributes this
finding gives an indication of the validity of the measures.
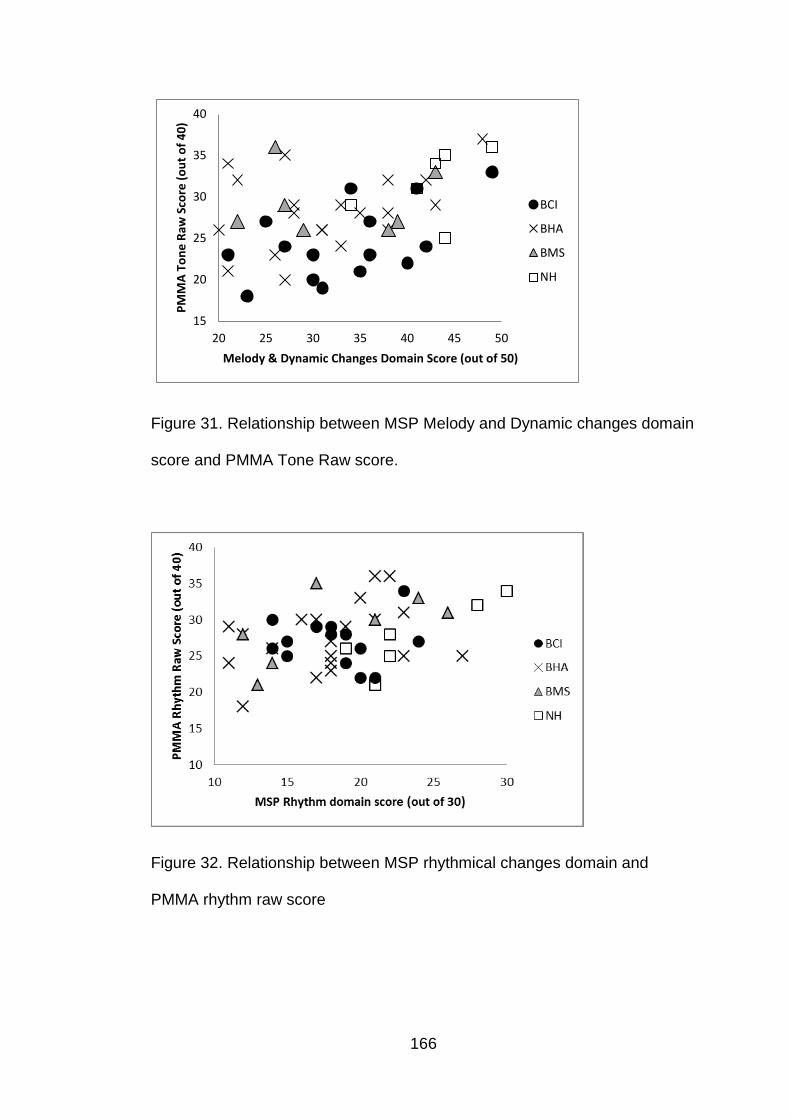
166
15
20
25
30
35
40
20 25 30 35 40 45 50
PM
MA
To
ne
Raw
Sco
re (
ou
t o
f 4
0)
Melody & Dynamic Changes Domain Score (out of 50)
BCI
BHA
BMS
NH
Figure 31. Relationship between MSP Melody and Dynamic changes domain
score and PMMA Tone Raw score.
Figure 32. Relationship between MSP rhythmical changes domain and
PMMA rhythm raw score

167
Relationship Between Emotional Aspects and Pitch Perception
The relationship between emotional aspects and pitch perception ability was
examined by correlating scores from the emotional aspects domain of the
MSP questionnaire with PMMA tone raw score. There was a medium
positive correlation between the two variables (r=0.4, n=48, p<0.05) (when
group was controlled for (r=0.4, n=45, p<0.05)), with higher levels on
perceptual test being associated with higher score on the emotional aspects
domain within the MSP questionnaire. Examination of the scatterplot (Figure
33) shows this association appears to be stronger for the BCI and NH groups
rather than for all groups.
Figure 33. Relationship between MSP Emotional Aspects domain score and
PMMA tone raw score

168
Relationship between Pitch Perception and Production
The association between pitch perception ability and singing competency
was investigated by correlating both the MSP Melody and Dynamic changes
domain score (see Figure 34) and the PMMA tone raw score (see Figure 35)
with NSS score obtained through the NSP Child Singing Assessment. A
medium positive correlation between variables was shown between NSS and
both MSP Melody and Dynamic changes domain score (r=0.4, n=48, p<0.05)
((r=0.3, n=45,p<0.05) when group was controlled for) and PMMA tone raw
score (r=0.5, n=53, p<0.05) ((r=0.3, n=50, p<0.05) when group was
controlled for). This indicates that as perceptual ability increases so does
singing competency.
Figure 34. Relationship between MSP Melody and Dynamic changes domain
score and NSP Child Singing Assessment Normalised Singing Score

169
Figure 35. Relationship between PMMA tone raw score and NSP Child
Singing Assessment Normalised Singing Score
Relationship between Voice Irregularities (Fx and Qx)
The relationship between voice irregularity measures of successive vocal
fold frequency and vocal fold contact phase was examined. There was a
strong positive correlation shown between to two variables (r=0.8, n=48,
p<0.05) ((r=0.8, n=45, p<0.05) when group was controlled for) indicating that
large irregularity in one will often indicate large irregularity in the other.
Observation of the scatterplot in Figure 36 indicates that this pattern is
common to all separate groups but greater spread is seen from the HI
groups.
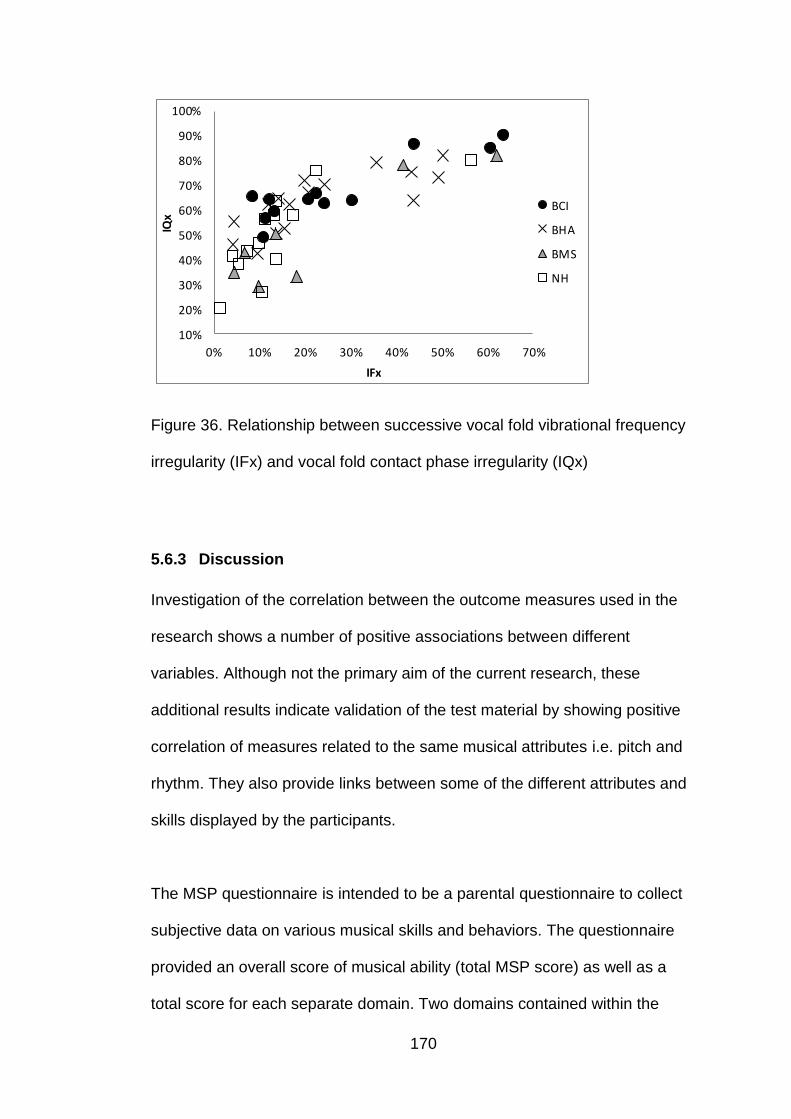
170
10%
20%
30%
40%
50%
60%
70%
80%
90%
100%
0% 10% 20% 30% 40% 50% 60% 70%
IQx
IFx
BCI
BHA
BMS
NH
Figure 36. Relationship between successive vocal fold vibrational frequency
irregularity (IFx) and vocal fold contact phase irregularity (IQx)
5.6.3 Discussion
Investigation of the correlation between the outcome measures used in the
research shows a number of positive associations between different
variables. Although not the primary aim of the current research, these
additional results indicate validation of the test material by showing positive
correlation of measures related to the same musical attributes i.e. pitch and
rhythm. They also provide links between some of the different attributes and
skills displayed by the participants.
The MSP questionnaire is intended to be a parental questionnaire to collect
subjective data on various musical skills and behaviors. The questionnaire
provided an overall score of musical ability (total MSP score) as well as a
total score for each separate domain. Two domains contained within the

171
MSP were focused on measuring perceptual abilities (melody & dynamic
changes and rhythmical changes). Correlations shown between these
domain scores and behavioral pitch and rhythm perception tests measured
using the PMMA test battery indicated that subjective evaluations can
provide a reliable way of predicting behavioral perceptual outcome. This
would be beneficial when testing younger or developmentally delayed
children where behavioural measures are unsuitable.
The MSP questionnaire also includes a domain focused on emotional
aspects associated with music. A positive correlation in this domain and
PMMA tone raw score indicated that children who have better pitch
perception show a higher emotional reaction to musical signals. These
results are supported by studies showing children with pitch perception
deficits due to CI processing will show less music appreciation (Galvin et al.
2007; McDermott 2004).
In Chapter 2 the importance of auditory feedback mechanisms for voice
production was highlighted. It was be assumed that musical pitch perception
would therefore be linked with vocal pitch production (singing). Results in this
current study support this assumption because of the correlations between
pitch perception assessments (PMMA tone raw score and MSP melody and
dynamic changes domain score) and singing competency (NSP Child
Singing Assessment Normalised Singing Score). A study of the relationship
between auditory feedback and singers’ pitch production demonstrates a
strong link between pitch perception and production (with relation to singing)

172
which supports the correlation observed from the current research (Murbe et
al. 2002). Inspection of scatterplots (Figures 29 and 30) show a spread of
data points with some children performing better or worse than the main
cluster. This result is expected based on the diversity of children recruited in
terms of age, level of HI, musical experience; and the known variation of
singing development amongst children (Welch 2006).
Voice irregularity in terms of Fx and Qx has been previously discussed (see
section 4.2.2.3) as a means of assessing singing voice quality. Correlation
between these two variables in the normal voice would be reasonable to
observe because the mucosal layers that are so crucial to vocal fold contact
protection would have an influence on both IFx and IQx. It is however
common with voice pathology to have low IFx and high IQx (Fourcin 2009).
As none of the children who undertook the test battery had known vocal fold
pathology the strong positive correlation observed would therefore be
expected.

173
CHAPTER 6 : DISCUSSION AND CONCLUSIONS
6.1 Discussion
This research was comprised of a series of studies investigating the musical
abilities of HI children using different intervention devices for their hearing
loss. They were assessed using validated measures with normative ranges.
The project had a focus on pitch perception and production due to the
recognised importance of pitch within musical signals, and the impact that
the different methods of sound processing employed by the different
intervention devices may have, as was described in Chapter 2.
6.1.1 Test Battery Selection
There are a number of different test materials available for assessment of
musical skills in children which date back over the last 60 years (Bentley
1966; Gordon 1979; Gordon 1990; Karma 2007; Seashore et al 1960; Wing
1948). The test materials selected for this research were based on the
primary aim of the research which was to determine if there were differences
in pitch perception, production and general musical ability of 4-9 year old HI
children using different intervention devices. Test materials were selected
that had previously been used with children of the appropriate age, been
validated and had normative data available. If they were not validated this
was carried out along with collection of norms within the research. This was
considered important for the reliability of results to ensure that group and
individual results could be explored. This is important when testing HI

174
children because there is often variability across individuals and it is
challenging to recruit large sample sizes to overcome this difficulty. This was
especially evident in this research because the group of HI children was
separated into three intervention groups (CI, HA and BMS). To reduce the
variance a restricted age group was used but by having normative ranges for
many of the tests it meant that the age appropriate level of performance
could be established and used for comparison in the analysis. By looking at
values with reference to normative ranges as a function of vocabulary age it
gave an opportunity to reduce the effect of developmental delay being the
cause of poorer scores for some individuals.
Three separate test materials were used within the project to answer the
research question. These were the MSP questionnaire, the PMMA test
battery and the NSP Child Singing Assessment (with laryngograph
measurements). As outlined in Chapter 4, both the PMMA test battery and
the NSP Child Singing Assessment had previously been used with large
numbers of children of the appropriate age and had large normative
databases with which to make comparisons to (Gordon 1979; Welch et al.
2009). Unfortunately, prior to this research project the MSP questionnaire
had not undergone a validation process nor did it have associated normative
values. The MSP questionnaire was considered valuable to include within
the main study phase of this research because it provided a means of
collecting information on emotional factors associated with music, as well as
providing subjective assessment of perceptual skills (pitch and rhythm). This
was an important component of this research project because two

175
participants (BHA 10 and BMS 8) were unable to complete behavioural
PMMA assessments due lack of co-operation or cognitive understanding.
Therefore, prior to use within the pilot study (Chapter 4) and main study
phase (Chapter 5), the MSP questionnaire underwent validation, normative
data was collected and percentile charts created (Chapter 3).
Although some previous questionnaires directed towards music appreciation
and musical exposure of HI children provide results on validity similar to what
is described for the MSP (Gfeller et al. 1998; van Besouw et al. 2011); the
important and distinctive feature of the present research was the collection of
normative data from over 300 typically developing children, and the
generation of reference centile curves for both the individual perceptual
areas and also the overall MSP score. Validation results and normative data
collected and reported in Chapter 3 were not only considered valuable within
the current research project, but also for future research studies where
subjective assessment of musical development is required.
The feasibility of using the test materials selected was examined in a pilot
study (Chapter 4). The purpose of the pilot study was to trial the research
protocol and test materials with a small sample of NH children to ensure that
they would be appropriate for the main study phase. Due to recruitment
challenges HI children were not included in the pilot study. Pilot study results
showed that the intended test protocol and materials were appropriate for
use with children of the selected age range (4-9 years old) and that the
testing could be conducted within one hour.

176
Another pilot study aim was to investigate the method of recording and
scoring the NSP Child Singing Assessment. This was undertaken to ensure
assessments completedwithin this research were comparable to the NSP IoE
normative data; to judge the validity of the NSP subjective scoring technique
for accurate pitch production assessment; and to ensure that the quality of
the laryngograph recordings were sufficient for acoustic analyses. The
acoustic analyses were used as a method of quantifying singing voice quality
in terms of irregularity of successive vocal fold frequency and vocal fold
contact phase.
A high correlation ( r=0.87, p<0.005) was demonstrated between NSP IoE
subjective frequency estimations of the habitual speech pitch centre and
acoustic frequency measurements obtained using the laryngograph trace
analysis of F0 average value for the same section of speech analysed by the
IoE. This correlation demonstrated that the subjective scoring method used
by NSP IoE staff was sufficiently accurate. This correlation of variables was
repeated in the main study phase of the research and again a high
correlation was found adding further support to the pilot study results.
The Renfrew Word Finding Vocabulary test (Renfrew 2010) was added to
the selected test materials to be undertaken by participants within the main
study phase of the research as a mean of establishing developmental age.
The addition of this test was thought to be necessary so that developmental

177
age could be controlled for between the HI groups where chronological and
developmental ages may differ due to developmental delay.
6.1.2 Pitch Perception in musical contexts for HI Children
Results reported in Chapter 5 display comparison of pitch perception ability
between the four groups using both behavioural (PMMA tone raw score) and
subjective (MSP Melody and Dynamic changes domain score) assessment
methods. The results not only built on the current research evidence for the
perceptual skills of different groups of HI children; but also provided evidence
that could impact on clinical choices for HI children.
Based on the literature discussed in Chapter 2 one might expect children
with BMS to have an advantage over the other HI groups for musical pitch
perception, due to the complimentary auditory cues given by both the
acoustic and electric signals. The difference in hearing level does however
need to be considered. Past research studies have not be able to
demonstrate a BMS benefit (Looi & Radford 2011; Cullington & Zeng 2011);
however, PMMA results from the current study have. PMMA tone raw score
was shown to be significantly lower for the BCI group in comparison to both
other HI groups (BHA and BMS). These results indicate that the participants
within both HA and BMS groups have advantage over the BCI group for pitch
discrimination; and this could be attributed to a number of factors such as
degree and type of hearing loss, level of residual hearing as well as to better
fine structure representation through use of acoustic information from their
HAs. Although past studies do not concur with this finding (for children using

178
BMS), support is provided when studies of combined electric and acoustic
stimulation through EAS devices are considered (Gfeller et al 2006, Gfeller et
al 2007 and Golub et al 2012). These studies have shown better pitch
discrimination in individuals with EAS compared with conventional CI users.
Current NICE guidance recommends that suitable children with bilateral
severe-profound HI are offered BCIs (NICE 2009). BCIs have been shown to
be beneficial for children’s speech perception (both in noise and in quiet)
(Galvin et al. 2007; Steffens et al 2008; Wolfe et al. 2007) and sound
localisation (Grieco-Calub et al. 2008; Grieco-Calub & Litovsky 2010;
Steffens et al. 2008; Van Deun et al. 2009). However, based on this
recommendation children with useable residual hearing who undergo
conventional bilateral cochlear implantation may forfeit the potential benefit
for pitch perception achieved through a BMS configuration (CI with HA in
contralateral ear). A benefit which has be demonstrated by the current pitch
discrimination results. A potential solution to this issue would be to have
enhanced surgical techniques in order to preserve residual hearing so the
bilateral EAS devices can be used. There are studies which show benefit of
EAS devices over conventional CIs for adult populations with regard to pitch
perception (Gfeller et al 2006, Gfeller et al 2007 and Golub et al 2012);
however currently fitting of EAS devices for paediatric populations is rare.
In contrast to the PMMA results shown in the current research, MSP scores
were not significantly different between the three HI groups, suggesting that
all groups of children performed at the same level for melody and dynamic

179
perceptual abilities. The discrepancy shown within the current study between
MSP and PMMA results could be attributed to the fact that the MSP domain
used to make comparisons also contains items directed at dynamic changes.
Therefore the results obtained using the MSP melody & dynamic changes
domain will not be as focused on purely pitch perception (pitch
discrimination) as a behavioral pitch discrimination test such as the PMMA
tone task. Another reason for the discrepancy observed could be that
parents may be inaccurate at judging their child’s ability subjectively
especially when compared to a direct behavioural measure. Behavioural
results obtained in the current study are further supported by other studies
which show better pitch discrimination demonstrated by HA users than CI
users (Looi et al 2008; Looi & Radford 2011).
Differences in pitch perception between NH and HI children were also
investigated through in the current study group comparisons. These results
should be interpreted with caution as the NH group had previously
undertaken the test battery within the pilot study and therefore there may be
some practice effect observed. They also appear to be a high performing NH
group in comparison to the normative data. MSP results showed significantly
better perception for the NH group compared to all three HI groups. This
result is expected based on the pitch processing limitations HI listeners
experience (Moore 1995) however could also be attributed to the group
having advantage in terms of practice effect. PMMA tone results showed that
the NH group performed significantly better than the BCI group, however
differences between the NH and both the BHA and BMS groups did not

180
reach the significance level of p<0.05. Inspection of the results obtained
show that one child within the NH group performed particularly poorly in
comparison to the rest of the group on the PMMA tone task, therefore this
child could have had influence over group mean score. This make
comparison to normative data even more valuable. The results obtained by
both subjective and behavioural measures were in agreement with other
studies showing that pitch discrimination is poorer for CI users than groups
with NH (Lee et al 2002; Looi et al 2008; Wang et al 2012).
It is well documented that even though CI users experience difficulty in pitch
perception, the same effect is not observed for rhythm perception
(McDermott 2004). Current research results with both subjective (MSP
rhythmical changes domain) and behavioral (PMMA rhythm score) rhythm
assessments further confirm this, because there were no significant
differences between the HI groups. These results indicate that although the
BCI group had poorer pitch perception than the BHA and BMS groups,
rhythm perception ability was similar across intervention groups. This
configuration of results is supported by previous literature using the PMMA
test battery (Gfeller and Lansing 1997) and other methodologies (Kong et al
2004).
6.1.3 Pitch Production in Musical Contexts for HI Children
There is a recognised association between auditory perception and
production abilities, especially with respect to pitch (Murbe et al. 2002). This
has been further confirmed by current results showing medium positive

181
correlations between both behavioural and subjective pitch perception
measures and NSP Normalised Singing Score. This indicated that children
with better pitch perception skills may have better singing competency. One
would therefore assume that limitations associated with degraded pitch
perception (such as CI pitch representation) would have direct impact on
vocal pitch production. Theoretical knowledge might lead one to assume that
differences in pitch production would be observed between different groups
of HI listeners (using CIs, HAs or BMS/EAS) based on differences in pitch
representation within their intervention devices. However, at present there
are no published studies making such comparisons. The importance of this
current research is therefore apparent in terms of adding to the current
insufficient research literature and offering results which could also inform
clinical practice.
Singing competency and voice irregularity were measured as an indication of
vocal pitch production accuracy and overall voice control within the current
research. There were no significant differences between participant groups
(NH, BCI, BHA and BMS) with respect to the habitual speech pitch centre or
comfortable singing range used. Comparisons were also made with the
normative values obtained in the IoE dataset. These comparisons were
made because the intention was always to compare scores to the normative
values for an assessment because that would be a better representation of
the normative range than the sample tested within the study. When the
groups were compared to NSP IoE normative data the BCI group had a
significantly smaller comfortable singing range than both the NSP IoE Sing
182
up and Non Sing up groups. This may be expected based on the cochlear
implantees’ perceivable pitch range being constraint by electrode insertion
depth and input frequency range relating the place pitch perception; and that
temporal pitch perception is only represented by phase locking to the
envelope of a signal (Macherey et al. 2011). This poor fine structure delivery
of the CI will lead to poorer pitch representation and resolution.
For the singing behaviour and competency, NSP normalised singing score
results showed that the NH group scored significantly higher than the three
HI groups. This result is in agreement with the findings of Xu et al (2009)
where singing skills were found to be significantly worse for CI users than a
NH group. Results from the current study indicate that although all three HI
groups are worse than the NH group in terms of singing competency they do
not differ significantly from each other.
Although significant differences between HI groups were not identified in
singing competency, voice irregularity from laryngograph recordings
indicatied that vocal production was worse for users of CIs. Singing voice
irregularity was attained through examination of Fx and Qx cross-plots. IFx
cross-plots showed that both the BCI and BMS groups had marked
diplophonia in their spread of irregularity. This indicated that both implanted
groups’ singing voice quality was not as accurate in terms of pitch as the NH
and BHA groups, even though IFx differences between HI groups were not
found to be significant. IQx comparisons show the NH group to have smallest
amount of irregularity in vocal fold contact of the four groups. However the

183
IQx value was only just significantly lower than the BCI and BHA groups. Qx
cross-plots show that the BCI group had the greatest spread of irregularity
and this group has been found to be significantly worse than the BMS group.
No other significant differences between HI groups were observed. These
voice irregularity results suggest that CI pitch representation does have a
negative effect on vocal pitch production although this could also be
attributed to group differences for example degree and type of hearing loss,
and other factors such as unequal sample numbers between groups.
6.1.4 Music enjoyment and Appreciation for HI Children
It has been reported that HI adults report reduced musical appreciation and
enjoyment when compared with NH groups (Gfeller et al. 2000a). However,
when HI children are examined conflicting results are found (Stordahl 2002).
Results from the current study examine theseaspects associated with music
and therefore provide comparison of these subjective variables between
paediatric NH and HI populations with different intervention devices (BCI,
BHA and BMS). This comparison between different groups of HI children
offers a distinct difference to what has been presented in current published
literature and therefore has value both in research and clinical disciplines.
Results from the current study confirm the findings of Stordahl (2002)
because no significant differences were shown between any of the groups
(BCI, BHA, BMS and NH) on the MSP emotional aspects domain. These
results indicate that emotional reactions associated with music are not
heavily influenced by limitations in pitch perception or production for HI
children; this being regardless of intervention device they use. Despite this a

184
medium positive correlation was found between the MSP emotional aspects
domain score and PMMA tone raw score, suggesting that as pitch perception
improves this will have a positive impact on emotional aspects.
6.1.5 Limitations of the research
Recruitment was challenging and only 57 participants were recruited to take
part in the main study phase, which was then further split into four
intervention-device groups. In order to minimise the effect that small
numbers of participants would have, the data was collected using validated
test measures where normative values were available.
The NH group was the same group who undertook the pilot study therefore
would have repeated the tests in the main study phase. This could have
given them advantage over the other groups in the main study phase. They
also appeared to be a high performing NH group in comparison to the
normative data, therefore it was considered important to make comparisons
to normative data as well as to this group who completed the test battery in
the same experimental conditions.
Within the study it was difficult to control for level of hearing loss in the
different intervention groups. Hearing levels were significantly better for the
BHA group in comparison to the BMS and BCI groups. This is expected
based on the preferred method of intervention for children with severe-
profound hearing loss being CIs and therefore finding hearing-aided

185
participants with comparable levels of hearing loss who have not been
implanted was challenging.
In addition, gaining an indication of hearing age and controlling for this
across the groups was very difficult. A developmental equivalent (Renfrew
word finding vocabulary test) was chosen; however, it was acknowledged
that making a judgement based on a measure of spoken vocabulary may not
be completely appropriate for indicating general developmental stage when
hearing is an issue. However there is a lot of evidence to suggest that
vocabulary age is a strong indicator of developmental stage (Bloom 1993;
Hoff 2005) so it was considered to be a reasonable proxy that could be
estimated very quickly within the test session.
Some of the other potential confounding variables were device manufacturer,
configuration of device settings, duration of implant use, change in HI over
time, prior music exposure and musical training. Controlling for these
variables was difficult due to the small sample size and variability in the
sample.
6.2 Conclusions
The main research questions addressed with the work carried out within this
thesis were: do differences exist between different groups of HI children
using different amplification devices for the hearing loss, and do these
groups also differ from NH children in terms of general musical ability, pitch
perception and singing ability. Based on these questions the primary aims of

186
the work undertaken within this thesis were to establish if differences in pitch
perception, production and general musical ability were displayed between
different groups of HI children. The different groups were defined by the
intervention devices the children use to manage their hearing loss (CIs, HAs
or both). Additionally comparisons to NH children were made.
Results presented in Chapter 5 indicated that HI children do not perform as
well as NH children in tasks associated with pitch perception or production.
However, this difference was not observed between NH and HI children for
rhythm perception tests or for emotional aspects associated with music such
as enjoyment and appreciation.
Comparisons between HI groups showed that children with BCI have
significantly worse pitch perception (discrimination) than both BHA and BMS
groups. This provides an indication that CI children who have useable
residual hearing may benefit from acoustic amplification for musical pitch
perception. This finding presents interesting information because current
NICE technical guidance recommends that suitable children with severe-
profound HL should be offered BCI. When considering music, results from
the current research indicate that this NICE recommendation may prevent
some children (with bilateral conventional CIs) accessing the optimal auditory
environment based on the processing limitations of their devices. Although a
relationship was found between pitch perception and singing competency
within the sample, significant differences in singing competency between HI
groups was not found. However, singing voice irregularity measures

187
indicated that CIs or level of HI could negatively impact on vocal pitch
production. This was shown because CI users had a wider spread of
successive vocal fold frequencies and vocal fold contact phases.
6.2.1 Future Directions
The research presented in this thesis gives valuable information about the
differences observed between groups of HI children using different
intervention devices in terms of musical pitch perception, production and
general musical development in children. It would ,however, be
advantageous to conduct similar assessments with a larger cohort of children
with a greater age range and track them over time. This would not only
provide robust results but also provide developmental profiles associated
with each groupand each measure so that perceptual and production skills
can be tracked. It would also be of interest to examine the effects of musical
exposure, musical training, and intervention device settings on these
outcome measures. Further studies in these areas would provide an
evidence base which could inform clinical practice and enhance the
understanding of limitations and expectations of different HI children using
various management devices for music. They could also provide information
on optimal device settings for music and what types of music exposure and
training may be beneficial for the development of musical skills in HI children.
Voice analysis within the current research highlighted the potential impact of
differing hearing impairments and the intervention devices that are used for
hearing loss on voice production. This type of voice assessment would also

188
be an important area to include in future studies as it could influence voice
therapy. Voice therapy is considered a useful part of the habilitation process
for children with CIs. Currently therapists (both speech and language and
music) work with multi discipline teams to device individual voice therapy
plans (including auditory training) in order to enhance voice production.
Laryngograph assessment would provide a resource whereby quick objective
assessments can be made without being intrusive. This assessment could
be used in studies to assess voice therapy and track development over time.
Additional studies on voice production would also be an interesting area to
explore further with HI children. Very few studies have been published to
date which focus on the singing abilities of HI children and the factors which
could affect development. Therefore further research examining singing with
different groups of HI children of varied age groups would be of interest. It
would also be informative to track singing development over time and
examine the affect of specific training programs. It could then be established
how these skills develop and how improvements can be made for these
populations.

189
ABBREVIATIONS
ANOVA – Analysis of Variance
BCI – Bilateral Cochlear Implant
BHA – Bilateral Hearing Aid
BM – Basilar Membrane
BMS – Bimodal Stimulation
CFx – Cross Plots for Fx
CI – Cochlear Implant
CICS – Cochlear-Implanted Children’s Support Group
CQx – Cross Plots for Qx
DL – Difference Limen
DLF – Frequency Difference Limen
EA – MSP Emotional Aspects Domain
EAS – Electro-Acoustic Stimulation
EEG – Electroencephalogram
EM – MSP Exposure to Music Domain
F0 – Fundamental Frequency
FC – Frequency Compression
FT – Frequency Transportation
Fx – Successive Vocal Fold Vibrations
HA – Hearing Aid
HI – Hearing Impaired/Hearing Impairment
HINT – Hearing In Noise Test
IDS – Infant Directed Speech
IHC – Inner Hair Cells

190
IoE – Institute of Education
IFx – Irregularity of Successive Vocal Fold Vibrational Frequencies
IQx – Irregularity of Vocal Fold Contact Phase
LSD – Least Significant Difference
MAIS – Meaningful Auditory Integration Scale
MD – MSP Melody and Dynamic Domain
MSP – Musical Stages Profile
MuSIC – Musical Sounds In Cochlear Implants
NDCS – National Deaf Children’s Society
NFC – Non-Linear Frequency Compression
NH – Normal Hearing
NICE – National Institute for Health and Care
NSP – National Singing Programme
NSS – Normalised Singing Score
OHC – Outer Hair Cells
PMMA – Primary Measures of Musical Audiation
Qx – Vocal Fold Contact Timing
R – MSP Rhythmical Changes Domain
SA – MSP Sound Awareness Domain
SEN – Special Educational Needs
UK – United Kingdom

191
ACKNOWLEDGEMENTS
I would like to thank my supervisors Dr Debi Vickers and Dr Merle Mahon for
their constant support and guidance throughout PhD Study. I would also like
to thank a number of others who have provided guidance on particular areas
of the research project.
Firstly I would like to thank Dr Jo Saunders, Professor Graham Welch and Dr
Evangelos Himonides for their help and guidance with the assessment of
participants’ singing abilities. This included advice on selecting appropriate
test materials, training on delivery of test protocol and analysis of
participants’ singing recordings. I would also like to thank Professor Adrian
Fourcin and Dr Evelyn Abberton for their advice and guidance on use and
analysis of the Laryngograph recordings within the research study.
I am particularly grateful to all families who gave up their time to take part in
the research project. I also would like to thank the charities (Children’s
Cochlear Implanted support group, the National Deaf Children’s Society and
the Ear Foundation), schools (Darrick Wood Primary School, Maple Primary
School and Cowley Hill Primary School) and hospitals (Royal National Ear,
Nose and Throat hospital, Bedford hospital, Great Ormond Street hospital,
Reading hospital and St Albans & Watford hospital) in which they were
recruited from. I particularly acknowledge Trisha Kemp of the Children’s
Cochlear Implanted support group who informed a large number of families
about the research.

192
I would also like to thank Dr Josephine Marriage for reviewing early versions
of the PhD thesis, and Dr Clara Kalu, Professor Tim Cole, Dr Angie Wade
and Dr Rosie Lovett who all provided guidance on statistical analysis.
I also am grateful to Advanced Bionics and Phonak UK for providing financial
support for the PhD study.

193
BIBLIOGRAPHY
Abdi, S., Khalessi, M., Khorsandi, M., & Gholami, B. (2001) Introducing
music as a means of habilitation for children with cochlear implants.
International Journal of Pediatric Otorhinolaryngology. 59 (2) 105-113
ANSI (1994) American National Standard Acoustical Terminology. American
Standards Institute. New York
Anvari S, Trainor L, Woodside J, & Levy B (2002) Relations among musical
skills, phonological processing, and early reading ability in preschool
children. J. Experimental Child Psychology. 83, 111–130
Asp, F.,M ä ki-Torkko, E., Karltorp, E., Harder, H., Hergils, L., Eskilsson, G.,
& Stenfelt, S. (2012) Bilateral versus unilateral cochlear implants in children:
Speech recognition, sound localization, and parental reports. International
Journal of Audiology. 51(11), 817-832
Baruch, C., & Drake, C. (1997) Tempo discrimination in infants. Infant
Behaviour & Development, 20 (4) 573-577
Bendor, D., & Wang, X., (2005) The neuronal representation of pitch in
primate auditory cortex. Nature, 436 (7054) 1161-1165
Baskent, D. & Shannon, R. (2004) Interactions between cochlear implant
electrode insertion depth and frequency-place mapping. J. Acoust. Soc. Am.
117 (3), 1405-1416
194
Baumann, U. & Nobbe, A. 2006. The cochlear implant electrode-pitch
function. Hearing Research, 213, 34-42
Bentley A (1966) Musical ability in children and its measurement. London,
England: Harrap.
Bibas, A., Xenellis, J., Michaels, L., Anagnostopoulou, S., Ferekidis, E., &
Wright, A. (2008) Temporal bone study of development of the organ of Corti:
correlation between auditory function and anatomical structure. Journal of
Largngology and Otology. 122 (4) 336-342
Bland, J.M & Altman, D.G. (1996a).Measurement error. British Medical
Journal (Clinical research edition), 313, 744.
Bloom, L. (1993) Language acquisition and the power of expression. In H. L.
Roitblat, L. M. Herman & P. E. Nachtigall (Eds.), Language and
communication: comparative perspectives. Hillsdale, NJ: Erlbaum
Boex, C., Baud, L., Cosendai, G., Sigrist, A., Kos, M. I. & Pelizzone, M.
(2006). Acoustic to electric pitch comparisons in cochlear implant subjects
with residual hearing. Journal of the Association for Research in
Otolaryngology, 7, 110-124.
Bond, M., Mealing, S., Anderson, R., Elston, J., Weiner,G., Taylor, R.,
Hoyle, M., Liu, Z., Price, A., & Stein, K. (2009) The effectiveness and cost-
effectiveness of cochlear implants for severe to profound deafness in
children and adults: a systematic review and economic model. NIHR Health
Technology Assessment programme: Executive Summaries.

195
Boyd, P. J. (2011). Potential Benefits From Deeply Inserted Cochlear Implant
Electrodes. Ear and Hearing, 32, 411-427.
Brockmeier, S., Peterreins, M., Lorens, A., Vermeire, K., Helbig, S.,
Anderson, I., Skarzynski, H., Van de Heyning, P., Gstoettner, W., & Kiefer, J.
(2010) Music Perception in Electric Acoustic Stimulation Users as Assessed
by the Mu.S.I.C. Test. Cochlear Implants and Hearing Preservation. Adv
Otorhinolaryngol. 67,70–80
Carlyon, R., Buus, S., & Florentone, M. (1990) Temporal integration of trains
of tone pulses by normal and by cochlearly impaired listeners. Journal of the
Acoustic Society of America. 87 (1) 260-268
Carlyon, R., Lynch, C. & Deeks, J. (2010). Effect of stimulus level and place
of stimulation on temporal pitch perception by cochlear implant users.
Journal of the Acoustical Society of America 127(5),2997-3008
Carral, V., Huotilainen, M., Ruusuvirta, T., Fellman, V., Naatanen, R., &
Escera, C. (2005) A kind of auditory ‘primitive intelligence’ already present at
birth. European Journal of Neuroscience. 21(11) 3201-3204
Chasin, M., & Russo, F. (2004) Hearing aids and music. Trends in
Amplification. 8 (2) 35-47
Cheveigne, A. (2005) Pitch Perception Models. In:Plack et al, eds. Pitch.
Neural Coding and Perception. Springer, pp 169-235

196
Ching, Y., Massie, R., Van. W., Rushbrooke, E., & Psarros, C. (2009)
Bimodal fitting or bilateral implantation? Cochlear Implants International. 10
Suppl 1, 23-27
Ching, T., van Wanrooy, E., & Dillon, H. (2007) Binaural-Bimodal Fitting or
Bilateral Implantation for Managing Severe to Profound Deafness: A Review.
Trends Amplif 2007; 11; 161
Clark, E. V. (2009) First Language Acquisition (2nd edn). Cambridge:
Cambridge University Press.
Cole, T. (1988) Fitting smoothed centile curves to reference data. Journal of
the Royal Society, Series A, 151, 385-418
Cole, T & Green, P. (1992) Smoothing reference centile curves: the LMS
method and penalized likelihood. Statistics in Medicine, 11, 1305-1319
Cooper, H. (1991) Practical Aspects of Audiology:Cochlear Implants. A
Practical Guide. San Diego, Singular Publishing Group
Cooper, R & Aslin, R. (1990) Preference for infant directed speech in the first
month after birth. Child Development, 61, 1584-1596
Costa-Giomi, E (1999) The effects of three years of piano instruction on
children’s cognitive development. Journal of Reasearch in Muisc Education,
47, 198-212

197
Costa-Giomi, E & Descombes, V. (1996) Pitch labels with single and multiple
meanings: a study with French-speaking children. Journal of Research in
Music Education, 44 (3), 204-214
Cronbach LJ (1951). Coefficient alpha and the internal structure of tests.
Psychometrika 16 (3): 297–334
Cullington, H., & Zeng, F. (2011) Comparison of Bimodal and Bilateral
Cochlea Implant Users on Speech Recognition with Competing Talker, Music
Perception, Affective Prosody Discrimination, and Talker Identification. Ear
and Hearing, 32 (1), 16-30
Data Protection Act (1998) Data Protection Action. [online] Available from:
http://www.legislation.gov.uk/ukpga/1998/29/contents [Accessed 5 May
2013]
Davies. A. D. M., & Roberts, E. (1975). Poor pitch singing: A survey of its
incidence in school children. Psychology of Music, 3 (2), 24-36.
DeCasper, A.J., Lecanuet, J.-P., Busnel, M.-C., Granier-Deferre, C., &
Maugeais, R. (1994). Fetal reactions to recurrent maternal speech. Infant
Behavior and Development, 17, 159-164
Dehaene-Lambertz,C & Pena (2001) Electrophysiological evidence for
automatic phonetic processing in neonates. Cognitive Neuroscience and
neuropsychology, 12(14) 3155-3158

198
Demany, L. Mckenzie, B., & Vurpillot, E. (1977) Rhythm perception in early
infancy. Nature. 266 (5604), 718-719
Denora (2000). Music in everyday life. Cambridge, Cambridge University
Press
Department of Education. 2013. 2014 National Curriculum. [online]. Available
from
http://www.education.gov.uk/schools/teachingandlearning/curriculum/national
curriculum2014 [Accessed 1 May 2013]
Dillon, H. (2001) Hearing Aids. United States of America. Boomerang Press
Dorman, M., Gifford, R., Spahr, A., & McKarns, S. (2008) The benefits of
combined acoustic and electric stimulation for the recognition of speech,
voice and melodies. Audiology & Neuro-Otology. 13(2), 105-112
Dorman, M. F., Spahr, T., Gifford, R., Loiselle, L., McKarns, S., Holden, T.,
Skinner, M. & Finley, C. (2007). An electric frequency-to-place map for a
cochlear implant patient with hearing in the nonimplanted ear. Journal of the
Association for Research in Otolaryngology, 8, 234-240
Eimas, P., Siquelan, E., Jusczyk, P., & Vigorito, J. (1971) Speech Perception
in Infants. Science. 171 (3968) 303
199
Evans, E. (1975) The sharpening of frequency selectivity in the normal and
abnormal cochlea. Audiology, 14, 419-442
Evans, E. & Harrison, R. (1976) Correlation between outer hair cell damage
and deterioration of cochlear nerve tuning properties in the guinea pig.
J.Physiol, 252, 43-44
Fernald (1985) Four-month-old infants prefer to listen to motherese. Infant
Behaviour and Development, 8, 181-195
Fernald (1991) Prosody in Speech to Children:Prelinguistic and linguistic
functions. Annals of Child Development, 8, 43-80
Fitzpatrick, E. M., Seguin, C., Schramm, D.,Chenier, J., & Armstrong, S.
(2009). Users' experience of a cochlear implant combined with a hearing aid.
International Journal of Audiology, 48(4), 172 - 182
Flynn, M., Dowell, R., & Clark, G. (1996) Speech perception of hearing aid
versus cochlear implantees. Cochlear Implants 261-265
Fourcin, A. (2009) Aspects of Voice Irregularity Measurement in Connected
Speech. Folia Phoniatr Logop, 61, 126-136
Fourcin, A., Abberton, E., Richardson, K., & Shaw, T. (2011) Aspects of
Voice Measurement with young users of cochlear implants. Seminars in
Hearing. 32(1), 42-52

200
Franks, J. (1982) Judgments of Hearing Aid Processed Music, Ear and
Hearing. 3(1), 18–23
Galvin III, J., Fu, Q., & Nogaki, G (2007) Melodic contour identification by
cochlear implant listeners. Ear and Hearing. 28 (3), 302-319
Galvin K.L., Mok M. & Dowell R.C . (2007) Perceptual benefit and functional
outcomes for children using sequential bilateral cochlear implants .Ear
Hear,28, 470– 482
Gantz, B., Turner, C., Gfeller, K., & Lowder (2005) Preservation of hearing in
cochlear implant surgery:Advantages of combined electrical and acoustic
speech processing. Laryngoscope. 115 (5), 796-802
Geers, A. (1997) Comparing implants with hearing aids in profoundly deaf
children. Otolaryngology-Head and Neck Surgery, 117(3), 150-154
Geers, A., & Moog, J (1991) Evaluating the Benefits of Cochlear Implants in
and Education Setting. American Journal of Otology, 12, 116-125
Gfeller, K., Christ, A., Knutson, J., Witt, S., Murray, K., & Tyler, R. (2000a)
Musical Backgrounds, listening habits, and aesthetic enjoyment of adult
cochlear implant recipients. Journal of the American Academy of Audiology.
11(7), 390-406

201
Gfeller, K., & Lansing, C. (1991) Melodic, rhythmic and timbral perception of
adult cochlear implant users. Journal of Speech and Hearing Research. 34
(4), 916-920
Gfeller, K., Turner, C., Oleson, J., Zhang, X., Gantz, B., Froman, R., &
Olszewski, C (2007) Accuracy of cochlear implant recipients on pitch
perception, melody recognition, and speech reception in noise. Ear and
Hearing. 28(3), 412-423
Gfeller, K., Woodworth, G., Robin, D., Witt, S., & Knutson, J. (1997)
Perception of rhythmical and sequential pitch patterns by normally hearing
adults and adult cochlear implant users. Ear and Hearing. 18(3), 252-260
Gfeller, K., Witt, S., Kim, K., & Knutson, J. (1998) The Iowa Music Perception
and Appraisal Battery.
Gfeller, K., Witt, S.A., Spencer, L.J., Stordahl, J., & Tomblin, B. (1998).
Musical involvement and enjoyment of children who use cochlear implants.
Volta Review, 100, (4) 213-233
Gfeller, K., Olszewski, C., Turner, C., Gantz, B., & Oleson, J. (2006) Music
perception with cochlear implants and residual hearing. Audiology & Neuro-
Otology. 11 Suppl 1, 12-15
Gfeller, K., Mehr, M., & Witt, S. (2001) Aural Rehabilitation of Music
Perception and Enjoyment of Adult Cochlear Implant Users. Journal of the
Academy of Rehabilitative Audiology, 34, 27

202
Gfeller, K., Oleson, J., Knutson, J.F., Breheny, P., Driscoll, V. & Olszewski,
C. (2008). Multivariate predictors of music perception and appraisal by adult
cochlear implant users. Journal of the American Academy of Audiology, 19,
120-134.
Gfeller, K., Witt, S., Stordahl, J., Mehr, M., & Woodworth, G. (2000b) The
effects of training on melody recognition and appraisal by adult cochlear
implant recipients. Journal of the Academy of Rehabilitative Audiology, 33,
138
Goldstein, J (1973) An optimum processor theory for the central formation of
the pitch of complex tones. Journal of the Acoustical Society of America, 54,
1496-1516
Golub, J., Won, J., Drennan, W., Worman , T., & Rubinstein, J. (2012)
Spectral and temporal measures in hybrid cochlear implant users: on the
mechanism of electroacoustic hearing benefits. Otology & Neurology, 33 (2),
147-153
Good, J., Aggleton, J., Kentridge, R., Barker, J., & Neave, N. (1997)
Measuring musical musical aptitude in children:on the role of age,
handedness, scholastic achievement, and socioeconomic status. Psychology
of Music, 25(1), 57-69
Gordon, E.E. (1979). Manual for the Primary measures of music audiation.
Chicago, IL.: G.I.A. Publications, Inc.

203
Gordon EE (1990) Predictive validity study of AMMA: A one-year longitudinal
predictive validity study of the Advanced Measures of Music Audiation.
Chicago, IL: GIA Publications.
Grannier-Deferre, C., Ribeiro, A., Jacquet, A., & Bassereau, S. (2011) Near-
term foetuses process temporal features of speech. Developmental Science,
14(2), 336-352
Green, P.(1987) Penalized likelihood for general semi-parametric regression
models, International Statistical review, 55, 245-259
Grieco-Calub T.M. & Litovsky R.Y. (2010) Sound localization skills in children
who use bilateral cochlear implants and in children with normal acoustic
hearing . Ear Hear , 31 , 645 – 656
Grieco-Calub T.M. , Litovsky R.Y. & Werner L.A. (2008) Using the observer
based psychophysical procedure to assess localization acuity in toddlers
who use bilateral cochlear implants . Otol Neurotol , 29 , 235 – 239
Gromko, J., & Poorman, A. (1998) The effect of music training on
preschoolers’ spatial-temporal task performance. Journal of Research in
Music Education, 46, 173-181
Hallam, S., Cross, I., & Thaut, M. (2009) The Oxford Handbook of Music
Psychology. Oxford. Oxford University Press

204
Hargreaves, D.J (2009) Musical Development. In In S.Hallum, I.Cross and
M.Thaut eds. The Oxford Handbook of Music Psychology. Oxford. Oxford
University Press, pp217-252
Harrison RV, Evans EF (1979) Cochlear fibre responses in guinea pigs with
well defined cochlear lesions. Stand Audio1 [Suppl] 9, 83-92.
He, C., Hotson, L., & Trainor, L. (2007) Mismatch responses to pitch
changes in early infancy. Journal of Cognitive Neuroscience, 19(5), 878-892
Hepper, P.(1992) Fetal psychology: an embryonic science. In J. Nijhuis ed.
Fetal Behaviour. Oxford. Oxford University Press, pp 129-156
Hepper, P., & Shahidullah, B. (1994) Deevelopment of Fetal Hearing.
Archives of Disease in Childhood, 71(2), F81-F87
Hoff, E (2005). Language Experience and Language Milestones During Early
Childhood. In K. McCartney & D. Phillips (Eds). Blackwell Handbook of early
childhood development: Blackwell Publishing, blackwell reference online
Hopkins, K., and Moore, B., (2007) Moderate cochlear hearing loss leads to
a reduced ability to use temporal fine structure information J. Acoust. Soc.
Am. 122(2), 1055-1068
Hurwitz, I., Wolff, P., Bortnick, B., & Kokas, K. (1975) Nonmusical effects of
Kodaly music curriculum in primary grade children. Journal of Learning
Disabilites, 8, 167-174

205
Jackson, C. & Furnham, A. (2000). Designing and analysing questionnaires
and surveys: a manual for health professionals and administrators. London,
UK. Whurr Publishers:
Kang, R., Nimmons, G., Drennan, W., Longnion, J., Ruffin, C., Nie, K., Won,
J., Worman, T., Yueh, B., & Rubinstein, J. (2009) Development and
validation of the University of Washington clinical assessment of music
perception test. Ear and Hearing.30(4)411-418
Karma, K. (2007) Musical aptitude definition and measure validation:
Ecological validity can endanger the construct validity of musical aptitude
tests. Psychomusicology: Music, Mind and Brain 19, 79–90
Kisilevsky, B., Hains, S., Lee, K., Xie, X., Huang, H., Ye, H., Zhang, K., &
Wang, Z. (2003) Effects of experience on fetal voice recognition.
Psychological Science, 14(3), 220-224
Kong, Y.Y., Cruz, R., Jones, J.A., & Zeng, F.G. (2004) Music perception with
temporal cues in acoustic and electric hearing. Ear Hear 25,173-185
Kong, Y., Stickney, G., & Zeng, F.(2005) Speech and melody recognition in
binaurally combined acoustic and electric hearing. Journal of the Acoustic
Society of America. 117(31), 1351-1361

206
Kuhl, P., Williams, K., Lacerda, F., Stevens, K., & Lindblom, B. (1992)
Linguistic experience alters phonetic perception in infants by 6 months of
age. Science. 255 (5044) 606-608
Kuk, F., & Baekgaard, L. (2009) Considerations in fitting hearing aids with
extended bandwidths. Hearing Review, 16(11), 32-38
Lamont, A. (1998) Music, Education, and the development of pitch
perception: the role of context, age and musical experience. Psychology of
Music, 26, 7-25
Laryngograph (2013). Speech Studio [online]. Available from:
http://www.laryngograph.com/pr_studio.htm [Accessed 3rd May 2013]
Leal, M., Shin, Y., Laborde, M., Calmels, M., Verges, S., Lugardon, S.,
Andrieu, S., Deguine, O., & Fraysse, B. (2003). Music perception in adult
cochlear implant recipients. Acta Oto-Laryngologica.123 (7), 826-835
Lee, K., Van Hasselt, C., Chiu, S., & Cheung, D. (20020 Cantonese tone
perception ability of cochlear implant children in comparison with normal
hearing children. Internal Journal of Pediatric Otorhinolaryngogolgy, 63, 137-
147
Leighton, G., & Lamont, A. (2006) Exploring children’s singing
development:do experinces in early schooling help or hinder? Music
Education Research, 8(3), 311-330

207
Leon, A., Davis, L., & Kraemer, H. (2011). The role and interpretation of Pilot
Studies in Clinical research. J Psychiatr Res. 45(5):626-629
Licklider, J. (1956). Auditory frequency analysis. In: Information Theory.
Academic Press, p253-268
Liberman, M., Dodds, L., & Learson, D.(1986) Structure-function correlation
in noise-damaged ears:a light and electron-microscopic study. In: R Salvi et
al eds. Basic and Applied Aspects of Noise-Induced Hearing Loss. York,
Plenum, pp 163-176
Limb, C. & Rubinstein, J. (2012) Current Research on Music Perception in
Cochlear Implant Users. Otolaryngologic Clinics of North America, 45, (1)
129-+
Looi, V. (2008) The effect of cochlear implantation on music perception. A
review. Otolaryngology, 58, 169-190
Looi, V., McDermott, H., McKay, C., & Hickson, L. (2008) Music perception of
cochlear implant users compared with that of hearing aid users. Ear and
Hearing. 29(3), 421-434
Looi, V., & Radford, C. (2011) A comparison of the speech recognition and
pitch ranking abilities of children using unilateral cochlear implant, bimodal
stimulaton or bilateral hearing aids. International Journal of Pediatric
Otorhinolaryngology, 75(4), 472-482

208
Looi, V. & She, J. (2010) Music perception of cochlear implant users: A
questionnaire, and its implications for a music training program. International
Journal of Audiology, 49, (2) 116-128
Ludwig van Beethoven (1934). BrainyQuote.com [online] Available from.
http://www.brainyquote.com/quotes/quotes/l/ludwigvanb153104.html
[Accessed August 23, 2012)
McCarney R, Warner J, Iliffe S, van Haselen R, Griffin M, & Fisher P (2007).
The Hawthorne Effect: a randomised, controlled trial. BMC Med Res
Methodol 7: 30
Macherey, O., Deeks, J., & Carlyon, R. (2011) Extending the Limits of Place
and Temporal Pitch Perception in Cochlear Implant Users. JARO 12, 233–
251
McDermott, H (2011) Benefits of combined acoustic and electric hearing for
music and pitch perception. Seminars in Hearing. 32(1), 103-114
McDermott, H. (2004) Music perception with cochlear implants: A review.
Trends in Amplification. 8(2), 49-82
Miller, R., Schiling, J., Franck, K., & Young, E. (1997) Effects of acoustic
trauma on the representation of the vowel/./ in cat auditory nerve fibres.
Journal of the Acoustic Society of America. 101, 3602-3616

209
Mitani, C., Nakata, T., Trehub, S.E., Kanda, Y., Kumagami, H., Takasaki, K.,
Miyamoto, I., & Takahashi, H. (2007). Music recognition, music listening, and
word recognition by deaf children with cochlear implants. Ear and Hearing.28
(SUPPL.2)29S-33S
Mirza, S., Douglas, S.A., Lindsey, P., Hildreth, T., & Hawthorne, M. (2003)
Appreciation of music in adult patients with cochlear implants: A patient
questionnaire. Cochlear Implants International.4 (2) 85-95
Moore, B.(1995) Perceptual consequences of cochlear damage. Oxford.
Oxford University Press
Moore, B. (2003) Coding of sounds in the auditory system and its relevance
to signal processing and coding in cochlear implants. Otol. Neurotol. 24,
243–254
Moore, B., & Carlyon, R. (2005a) Pitch for Hearing-Impaired Listeners and
Cochlear Implantees. In: A Fay & A. Popper eds. Pitch, Neural Coding and
Perception. Springer, pp 234-277
Moore, B. (2008) An introduction to the Psychology of Hearing (5th edition).
London. Academic Press
Moore, B., & Carlyon, R. (2005b) Perception of Pitch by People with
Cochlear Hearing Loss and by Cochlear Implant Users. In: Plack et al eds.
Pitch. Neural Coding and Perception. Springer, pp 234-277

210
Moore, B., & Peters, R. (1992) Pitch Discrimination and Phase sensitivity in
young and elderly subjects and its relationship to frequency selectivity.
Journal of the acoustical society of America. 91, 2881-2893
Moore, B. (1996) Perceptual consequences of cochlear hearing loss and
their implications for the design of hearing. Ear and Hearing, 17(2), 133-161
Moore, B., Wojtczak, M., & Vickers, D (1996) Effect of loudness recruitment
on the perception of amplitude modulation. Journal of Acoustical Society of
America. 100 (1), 481-489.
Morrongiello, B., & Roes, C. (1990) Developmental changes in children’s
perception of musical sequences: effects of musical training. Developmental
Psychology. 26, 814-820
Murbe, D., Pabst, F., Hofmann, G., & Sundberg, J. (2002) Significance of
auditory and kinaesthetic feedback to singers’ pitch control. Journal of voice.
16(1), 44-51
Nakata, T., Trehub, S.E., Mitani, C., & Kanda, Y. (2006) Pitch and timing in
the songs of deaf children with cochlear implants. Music Percept. 24, 147–
154
National Institute for Health and Care Excellence (NICE) (2009) Cochlear
implants for children and adults with severe to profound deafness. NICE
technology appraisal guidance 166. London: National Institute for Health and
Care Excellence.

211
Nilsson, M., Soil, S., & Sullivan, J.(1993) Development of the Hearing In
Noise Test for the measurement of speech reception thresholds in quiet and
in noise. J acoustic society of Am. 95 (2) 1085-1099
Nittrouer, S., & Chapman, C. (2009) The effects of bilateral electric and
bimodal electric-acoustic stimulation on language development. Trends in
Amplification. 13(3), 190-205
Ohm, G. (1843) Uber die Definition des tones, nebst daran geknupfter
Theorie der Sirene und ahnlicher tonbildender Vorrichtungen. Ann Phys
Chem. 59, 513-565
Opinio 1998. [online] Available from: http://www.ucl.ac.uk/isd/staff/e-
learning/tools/opinio [Accessed 1st July 2009]
Osberger, M., Robbins, A., Miyamoto, R., Beryy, S., Myres, W., Kessler, K.,
& Pope, M. (1991) Speech Perception Abilities of Children with Cochlear
Implants, Tactile Aids, or Hearing Aids. American Journal of Otology. 12,
105-115
Patel, A. (2008) Music, Language and the Brain. Oxford. Oxford University
Press
Peretz, I., Champod, A., & Hyde, K. (2003) Varieties of musical disorders:
The Montreal Battery of Evaluation of Amusia. Annals of the New York
Academy of the Sciences. 999, 58–75.

212
Plack, C (2005) The Sense of Hearing. New Jersey. Lawrence Erlbaum
Associates
Plack, C., Oxenham, A., Fay, R., & Popper, A. (2005) Pitch, Neural Coding
and Perception. New York, Springer Science.
Plantinga, J. & Trainor, L (2009) Melody recognition by two-month-old
infants. Journal of the Acoustical Society of America. 125 (2), EL58-EL62
Porta, M. (2008) Dictionary of Epidemiology. 5. Oxford: Oxford University
Press.
Rauscher, F. (2009) The impact of music instruction on other skills. In S.Hall,
I. Cross & M. Thaut eds. The Oxford Handbook of Music Psychology. Oxford.
Oxford University Press, pp244-252
Rauscher, F., Shaw, G., Levine, L., Wright, E., Dennis, W., & Newcomb, R.
(1997) Music training causes long-term enhancement of preschool children’s
spatial-temporal reasoning abilities. Neurological Research, 19, 1-8
Rauscher, F., & Zupan, M. (2000) Classroom keyboard instruction improves
kindergarten children’s spatial-temporal performance: A field experiment.
Early childhood Research Quarterly, 15, 215-228

213
Renfrew, C.E. (2010). The Renfrew Language Scales: Word finding
vocabulary test. Revised edition: Speechmark
Richards, D., Frentzen, B., Gerhardt., McCann, M., & Abrams, R. (1992)
Sound levels in the huan uterus. Obstetrics and Gynecology. 80, 186-190
Robbins, A., Renshaw, J., & Berry, S. (1991) Evaluating meaningful auditory
integration in profoundly hearing impaired children. Am J Otol 12, 144-150
Robertson, D., & Manley, G. (1974) Manipulation of frequency anaylsis in the
cochlear ganglion of the guinea pig. J. Comp.Physiol. 91, 363-375
Rocca, C. & Boyle, P. (2011) Muiscal potch perception and production in
children with cochlear implants. International Journal of Pediatric
Otorhinolaryngology. Conference:10th Europeon Symposium on Paediatric
Cochlear Implantation. Athens, Greece. May
Ross, E., Thompson, R., & Yenkosky, J. (1997) Lateralization of Affective
Prosody in Brain and the Collosal Integration of Hemispheric Language
Functions. Brain and Language 56, 27 – 54.
Ruggero, M (1994) Cochlear delays and travelling waves: comments on
‘Experimental look at cochlear mechanics’. Audiology. 33, 131-142
Ruggero, M., & Rich, N. (1991) Furosemide alters organ of corti
mechanisms: Evidence for feedback of outer hair celss upon basilar
memebrane. J.Neuroscience. 11, 1057-1067

214
Rutkowski, J (1997) The nature of children’s singing voices: Characteristics
and Assessment. In The phenomenon of singing. Ed B.A. Roberts, 201-9. St
John’s, NF: Memorial University Press
Scattergood, L. & Limb, C. (2010). Music Perception in Children with
Cochlear Implants. Perspectives on Hearing and Hearing Disorders in
Childhood, 20, 32-37
Schellenberg, E. (2004) Music lessons enhance IQ. Psychological Science.
15, 511-514
Schouten, J. (1938) The perception of subjective tones. Proc Kon Akad
Wetenschap. 41, 1086-1093
Schouten, J. (1940) The residue and mechanism of hearing. Proc Kon Ned
Akad Wetenschap. 43, 991-999
Seashore, C., Lewis, D., Saetveit, J.G. (1960) A second revision of the
manual of instructions and interpretations for the Seashore Measures of
Musical Talents (1939 revision). New York, NY: The Psychological
Corporation.
Sing up (2013). The sing up programme [online]. Available from:
http://www.singup.org/ [Accessed 3rd May 2013]

215
Sloboda, J (2009) The role of music in everyday life. In S.Hallum, I.Cross
and M.Thaut eds. The Oxford Handbook of Music Psychology. Oxford.
Oxford University Press, pp 429-490
Smith, S., Gerhardt, K., Griffiths, S., Huang, X., & Abrams, R. (2003)
Intelligibility of sentences recorded from the uterus of a pregnant ewe and
from the fetal inner ear. Audiology and Neuro-Otology. 8, 347-353
Smith, Z., Delguette, B., & Oxenham, A. (2002) Chimaeric sounds reveal
dichotomies in auditory perception. Nature. 416(6876), 87-90
Snik, A., Vermeulen, A., Brokx, J. & VanderBroek, P (1997) Long-term
speech perception in children with cochlear implants compared with
convential hearing aids. American Journal of Otology. 18(6), S129-S130
Somers, M. (1991) Speech-Perception Abilites in Children with Cochlear
Implants or Hearing Aids. American Journal of Otology. 12, 174-178
Steffens, T., Lesinski-Schiedat, A., Strutz, J., Aschendorff, A., Klenzner, T.,
Rühl, S., Voss B.,Wesarg, T., Laszig, R., & Lenarz, T. (2008) The benefits of
sequential bilateral cochlear implantation for hearing-impaired children . Acta
Otolaryngol , 128 , 164–176
Steinberg, J. & Gardener, M. (1937) The dependence of hearing impairment
on sound intensity. Journal of the Acoustic Society of America. 9, 11-23

216
Stordahl J (2002) Song recognition and appraisal: a comparison of children
who use cochlear implants and normally hearing children. Journal of Music
Therapy 39(1),2-19
Sundberg, J. (1987) The Science of the Singing Voice. Northern Illinios.
University Press
Takeuchi, A. & Hulse, S (1993) Absolute Pitch. Psychological Bulletin.
113(2), 345-361
Terhardt, E. (1974) Pitch, consonance and harmony. Journal of the
Acoustical Society of America. 55, 1061-1069
Trainor, L. & Trehub, S. (1994) Key membership and implied harmony in
wertern tonal music: developmental perspectives. Perception and
Psychophysics. 56, 125-132
Trainor, L. J., & Unrau, A. J. (2012). Development of pitch and music
perception. In L. Werner, R. R. Fay & A. N. Popper (Eds.), Springer
Handbook of Auditory research: Human Auditory Development. 223-254.
New York. Springer
Trehub, S. (2003) The developmental origins of musicality. Nature
Neuroscience. 6(7),669-673
Trehub, S., Cohen, A., Thorpe, L. & Morrongiello, B (1986) Development of
the perception of musical relations:semitone and diatonic structure. Journal
217
of Experimental Psychology:Human Perception and Performance. 12, 295-
301
Trehub, S.E., Unyk A, Kamenetsky S, Hill D, Trainor, L., & Henderson J
(1997) Mothers' and Fathers' singing to infants. Developmental Psychology,
33, 500-507
Trehub, S., Vongpaisal, T., & Nakatab, T. (2009) Music in the Lives of Deaf
Children with Cochlear Implants. The Neurosciences and Music III—
Disorders and Plasticity: Ann. N.Y. Acad. Sci. 1169, 534–542.
van Besouw, R.M., Grasmeder, M.L., Hamilton, M.E., & Baumann, S.E.
(2011). Music activities and responses of young cochlear implant recipients.
International Journal of Audiology, 50, (5) 340-348
Van Deun L. , van Wieringen A. & Wouters J (2010) Spatial speech
perception benefits in young children with normal hearing and cochlear
implants .Ear Hear , 31 , 702 – 713
Veekmans, K., Ressel, L., Mueller, J., Vischer, M., & Brockmeier, S. (2009)
Comparison of music perception in bilateral and unilateral cochlear implant
users and normal-hearing subjects. Audiology and Neurotology.14(5), 315-
326
Vermiere, K., Nobbe, A., Schleich, P., Nopp, P., Voormolen, M. H. & van de
Heyning, P. H. (2008). Neural tonotopy in cochlear implants: An evaluation in
unilateral cochlear implant patients with unilateral deafness and tinnitus.
Hearing Research, 245, 98-106.

218
Vickers, D., Dincer, H., Boyle, P., Kirkim, G., Olgun, L., Incesulu, A., Yucel,
E., Onder, S., & Aygener, N. (2007) Development of Musical Behavior in
Children with Cochlear Implants. Advanced Bionics Auditory Research
Bulletin , 146-148.
Vongpaisal, T., Trehub, S.E., & Schellenberg, E.G. (2006). Song recognition
by children and adolescents with cochlear implants. Journal of Speech,
Language, and Hearing Research, 49, (5) -1103
Vongpaisal T., Trehub S.E., & Schellenberg E.G. (2009) Identification of TV
tunes by children with cochlear implants. Music Perception, 27: 17–24.
Wan C, Rüber T, Hohmann A, & Schlaug G. (2010) The Therapeutic Effects
of Singing in Neurological Disorders. Music Percept. 27(4): 287–295
Wang, S., & Huang, J. (2010) Musical note perception and musical sound
vocal production in cochlear implant children. Proceedings of 20th
International Congree on Acoustics, ICA. 23-27
Wang, S., Liu, B., Dong, R., Zhou, Y., Li, J., Qi, B., Chen, X., Han, D., &
Zhang, L. (2012) Music and lexical tone perception in chinese adult cochlear
implant users. Laryngoscope, 122, (6), 1353-1360
Welch, G (1985). Variability of practice and knowledge of results as factors in
learning to sing in tune. Bulletin of the Council for Research in Music
Education, 85, 238-247

219
Welch G.F (1998) Early childhood musical development. Research studies in
Music Education 11:27-41
Welch, G. (2006), Singing and vocal development," In G. McPherson, ed.
The Child as musician: a handbook of musical development, Oxford: Oxford
University Press, pp. 311-329.
Welch, G., Himonides, E., Papageorgi, I., Saunders, J., Rinta, T., Stewart,
C., Preti, C., Lani, M., Vraka, M., & Hill, J. (2009). The National Singing
Programme for primary schools in England: an initial baseline study. Music
Education Research, 11, (1) 1-22
Welch, G.F. (1996). The Singing Competencies of 5-Year-Old Developing
Singers. Bulletin of the Council for Research in Music Education (127) 155-
162
Welch, G.F., Sergeant, D.C., & White, P.J. (1997). Age, sex, and vocal task
as factors in singing "in tune" during the first years of schooling. Bulletin of
the Council for Research in Music Education (133) 153-160
Werker, J. & McLeod, P. (1989). Infant preference for both Male and Female
infant-directed talk: a developmental study of attention and affective
responsiveness. Canadian Journal of Psychology, 43, 230-246

220
Werner, L.A. & Vandenbos, G.R. (1993). Psychology Update -
Developmental Psychoacoustics - What Infants and Children Hear. Hospital
and Community Psychiatry, 44, (7) 624-626
Wightman, F. (1973). The pattern-transformation model of pitch. Journal of
the Acoustical Society of America, 54, 407-416
Wilson, B. (2000) Cochlear implant technology In J. Niparko et al., eds.
Cochlear Implants: Principles & Practices. New York: Lippincott, Williams &
Wilkins, pp. 109-118.
Wilson, B., Sun, X., Schatzer, R., & Wolford, R. (2004). Representation of
fine structure or fine frequency information with cochlear implants.
International Congress Series, 1273, 3-6
Wilson, B.S. & Dorman, M.F. (2008a). Cochlear implants: A remarkable past
and a brilliant future. Hearing Research, 242, (1-2) 3-21
Wilson, B.S. & Dorman, M.F. (2008b). Cochlear implants: Current designs
and future possibilities. Journal of Rehabilitation Research and Development,
45, (5) 695-730
Wing H (1948) Tests of musical ability and appreciation: An investigation into
the measurement, distribution, and development of musical capacity.
London, England: Cambridge University Press.

221
Wolfe, J., Baker, S., Caraway, T., Kasulis, H., Mears, A., Smith, J., Swim, L.,
& Wood, M. (2007) One-year postactivation results for sequentially implanted
bilateral cochlear implant users. Otol Neurotol , 28, 589–596
Woolf, N., Ryan, A., & Bone, R. (1981). Neural phase locking properties in
the absence of cochlear outer hair cells. Hearing Research, 4, 335–346.
Xu, L., Zhou, N., Chen, X., Li, Y., Schultz, H., Zhao, X., & Hanb, D. (2009)
Vocal singing by prelingually-deafened children with cochlear implants Hear
Res. 255(1-2),129–134
Yuba, T., Itoh, T., & Kaga, K. (2009). Unique Technological Voice Method
(The YUBA Method) Shows Clear Improvement in Patients with Cochlear
Implants in Singing. Journal of Voice.23 (1), 119-124
Yucel, E., Vickers, D., Sennaroglu, G., Dincer, H., Budak, B., & Belgin, E.
(2007) Effects of Pitch, Rhythm, and Melody Training on Speech and Music
Development in Children with Cochlear Implants. Advanced Bionics Auditory
Research Bulletin , 150-151.
Yucel, E., Sennaroglu, G., & Belgin, E. (2009). The family oriented musical
training for children with cochlear implants: Speech and musical perception
results of two year follow-up. International Journal of Pediatric
Otorhinolaryngology.73 (7) 1043-1052

222
APPENDICES
Appendix 1: Musical Stages Profile Questionnaire
Musical Stages Profile
These questions have been developed to cover some of the key areas of musical development. It may be that your child does not yet do many of the activities listed. Please do not worry, the activities are
intended to cover a wide age range and not all children will do all the different items.
Please try to answer the questions as carefully as possible and write
any comments that could give us further information.
Thank you for taking the time to help
A. General Information
Today’s Date: …../…../….. Subject Identifier: .................................. Date of birth of child: …../…../….. .............. Child’s age: .................. Session Information .................................................................................................. Child’s gender: Male □ Female □ Your relationship to child: .......................................................................................... Does the child have any siblings: Yes □ No □ How many? ............................................................... Age and Gender of each child...................................................................................
.................................................................................................................................. What is the family language spoken at home? ......................................................... Does your child speak other languages? Yes □ No □ If so, please list the languages spoken .....................................................................
..................................................................................................................................

223
Child’s Preference:
Male Voices
Female Voices
No Preference Does your child have any Hearing problems? Yes □ No □ If yes, complete the next highlighted section. If not please skip highlighted section Hearing problem: Right ear □ Left ear □ Both ears □ What was the hearing problem caused by? (e.g. family history/infection/unknown)……………………………………………. Hearing loss? Yes □ No □ If so:- When was hearing loss acquired? (e.g. from birth/3 months/2 years)………… Degree of hearing impairment: Mild □ Mild-Moderate □ Moderate □ Moderate-Severe □ Severe □ Severe-Profound □ Profound □ What has child’s management been for hearing impairment? Surgical procedure □ Hearing aid(s) □ If so - Unilateral □ Bilateral □ Cochlear implant(s) □ If so - Unilateral □ Bilateral □ Bimodal (hearing aid + implant) □ Age at implantation? ..................... Date of switch on………………………… Mode of communication? Verbal □ Sign □ Gesture □ Other……………………………………….

224
In which of the following places does your child like to listen to music:
a. at home
□ Never □ Rarely □ Occasionally □ Frequently □ Always
b. in the car
□ Never □ Rarely □ Occasionally □ Frequently □ Always
c. at school / pre-school / nursery / playgroups
□ Never □ Rarely □ Occasionally □ Frequently □ Always
Does your child participate in music lessons/music groups (in/or out of school):
Yes □ No □ If so please comment ....................................................................................................................................................................................................................................................................................................................................................................................................................................

225
Does your child play a musical instrument? Yes □ No □ If yes, what do they play ...........................................................................................
Are there any other instruments your child likes to play?
...................................................................................................................................... ...................................................................................................................................... ......................................................................................................................................
What are your child’s Favourite Songs or Nursery Rhymes? ...................................................................................................................................... ...................................................................................................................................... ......................................................................................................................................
B. Sound awareness and general reaction
1. Does your child start moving or dancing when there is some
music being played (radio etc …)?
□ Never □ Rarely □ Occasionally □ Frequently □ Always
2. Does your child start clapping when they hear a song or music
being played?
□ Never □ Rarely □ Occasionally □ Frequently □ Always

226
The following questions relate to musical listening, it may be that your child does not perform the activity and that can be perfectly normal. Please feel free to add comments after any
of the questions to clarify your answer. If you answer “Never” to any of the questions please add a note to clarify
whether the question is irrelevant or if “Never” is the appropriate answer. This is of particular relevance for
questions about playing a musical instrument or singing.
C. Melody and dynamics changes
3. Does your child spontaneously understand changes in melody within musical tunes?
□ Never □ Rarely □ Occasionally □ Frequently □ Always
Comments .................................................................................................................... ...................................................................................................................................... ...................................................................................................................................... ......................................................................................................................................
4. Does your child spontaneously try to sing a familiar melody (like
nursery rhymes or lullabies he/she has heard)?
□ Never □ Rarely □ Occasionally □ Frequently □ Always
Comments .................................................................................................................... ...................................................................................................................................... ...................................................................................................................................... ......................................................................................................................................

227
5. When you listen to music or you hum the melody, does your child try to vocalise?
□ Never □ Rarely □ Occasionally □ Frequently □ Always
Comments .................................................................................................................... ...................................................................................................................................... ...................................................................................................................................... ......................................................................................................................................
6. If your child tries to sing can he/she follow the melody of the
song?
□ Never □ Rarely □ Occasionally □ Frequently □ Always
Comments..................................................................................................................... ...................................................................................................................................... ...................................................................................................................................... ......................................................................................................................................
7. Does your child spontaneously understand variations in loudness
within musical tunes?
□ Never □ Rarely □ Occasionally □ Frequently □ Always
Comments..................................................................................................................... ...................................................................................................................................... ...................................................................................................................................... ......................................................................................................................................

228
8. Can you recognise the songs that your child sings?
□ Never □ Rarely □ Occasionally □ Frequently □ Always
Comments..................................................................................................................... ...................................................................................................................................... ...................................................................................................................................... ......................................................................................................................................
9. Does your child sometimes vocalise as though they are singing
(i.e. with large changes in pitch)?
□ Never □ Rarely □ Occasionally □ Frequently □ Always
Comments..................................................................................................................... ...................................................................................................................................... ...................................................................................................................................... ......................................................................................................................................
10. When listening to a song will your child start to sing words at the ends of the phrases?
□ Never □ Rarely □ Occasionally □ Frequently □ Always
Comments..................................................................................................................... ...................................................................................................................................... ...................................................................................................................................... ......................................................................................................................................

229
11. When singing a song will your child vary loudness appropriately?
□ Never □ Rarely □ Occasionally □ Frequently □ Always
Comments..................................................................................................................... ...................................................................................................................................... ...................................................................................................................................... ......................................................................................................................................
12. If your child plays an instrument can s/he monitor and control the loudness appropriately (in a group/ in response to the dynamic variations)? Any instrument at all: woodblock, tambourine, piano……
□ Never □ Rarely □ Occasionally □ Frequently □ Always
Comments..................................................................................................................... ...................................................................................................................................... ...................................................................................................................................... ......................................................................................................................................

230
D. Rhythmical changes
13. Does your child ever spontaneously:
a. clap hands to music?
□ Never □ Rarely □ Occasionally □ Frequently □ Always
b. drum a beat on something (drum, pot, …) to music?
□ Never □ Rarely □ Occasionally □ Frequently □ Always
Comments .................................................................................................................... ...................................................................................................................................... ...................................................................................................................................... ......................................................................................................................................
14. When you listen to music with your child and you clap the beat
with your hands, does your child clap along with you?
□ Never □ Rarely □ Occasionally □ Frequently □ Always
Comments..................................................................................................................... ...................................................................................................................................... ...................................................................................................................................... ......................................................................................................................................
231
15. If your child claps or bangs a beat to music, is it in time with the beat of the music?
□ Never □ Rarely □ Occasionally □ Frequently □ Always
Comments..................................................................................................................... ...................................................................................................................................... ...................................................................................................................................... ......................................................................................................................................
16. Does your child clap at different speeds in response to musical rhythm?
□ Never □ Rarely □ Occasionally □ Frequently □ Always
Comments..................................................................................................................... ...................................................................................................................................... ...................................................................................................................................... ......................................................................................................................................
17. If your child is following a beat by banging, clapping,
marching…are they able to follow a change in a tempo?
□ Never □ Rarely □ Occasionally □ Frequently □ Always
Comments..................................................................................................................... ...................................................................................................................................... ...................................................................................................................................... ......................................................................................................................................

232
E. Emotional aspects
18. Does your child ever spontaneously ask you to sing or play music?
□ Never □ Rarely □ Occasionally □ Frequently □ Always
Comments..................................................................................................................... ...................................................................................................................................... ...................................................................................................................................... ......................................................................................................................................
19. Does your child like to listen to recorded music (e.g. on CD) or your singing when he/she is going to sleep?
□ Never □ Rarely □ Occasionally □ Frequently □ Always
Comments..................................................................................................................... ...................................................................................................................................... ...................................................................................................................................... ......................................................................................................................................
20. Does your child ever ask to listen to a particular CD or tape?
□ Never □ Rarely □ Occasionally □ Frequently □ Always
Comments..................................................................................................................... ...................................................................................................................................... ...................................................................................................................................... ......................................................................................................................................

233
21. Can your child say when a favourite song is being played?
□ Never □ Rarely □ Occasionally □ Frequently □ Always
Comments..................................................................................................................... ...................................................................................................................................... ...................................................................................................................................... ......................................................................................................................................
22. Does music change your child’s mood?
□ Never □ Rarely □ Occasionally □ Frequently □ Always
Comments..................................................................................................................... ...................................................................................................................................... ...................................................................................................................................... ......................................................................................................................................
23. Does singing have a comforting effect on your child e.g. when distressed or going to sleep?
□ Never □ Rarely □ Occasionally □ Frequently □ Always
Comments..................................................................................................................... ...................................................................................................................................... ...................................................................................................................................... ......................................................................................................................................

234
24. Does your child show emotional reactions to different music?
□ Never □ Rarely □ Occasionally □ Frequently □ Always
Comments..................................................................................................................... ...................................................................................................................................... ...................................................................................................................................... ......................................................................................................................................
25. Does your child appear to enjoy music?
□ Never □ Rarely □ Occasionally □ Frequently □ Always
Comments..................................................................................................................... ...................................................................................................................................... ...................................................................................................................................... ......................................................................................................................................
26. How important is music to your child? □ Not at all Important (Music of no interest, potentially even disliked) □ Slightly Important (Occasionally responds but very little interest) □ Moderately Important (Enjoyed but not essential, never requested) □ Very Important (Enjoys music and requests to listen or play music) □ Extremely Important (Crucial to everyday life)
Thank you for taking the time to complete this questionnaire.

235
UCLEAR INSTITUTE
INFORMATION FOR PARENTS/GUARDIANS ABOUT THE RESEARCH
Music Perception and Production in Hearing Impaired Children
Invitation We would like to invite you and your child to take part in a study which forms part of some PhD research. Before you decide whether or not to take part, we would like you to understand why the research is being done and what it would involve for you. One of our team is always available to go through the information sheet with you and answer any questions you have at any point. Talk to others about the study if you wish. (Part 1 tells you the purpose of this study and what will happen to you and your child if you take part. Part 2 gives you more detailed information about the conduct of the study). Ask us if there is anything that is not clear.
PART 1 What is the purpose of the study? The study will compare the musical abilities of children with different management options for their hearing impairment i.e. cochlear implants, hearing aids or combinations of both. The results will be used to give information on how best to utilize signal processing options to build on music perception and enjoyment for hearing impaired children of this age. It may also have implications for future product development with respect to enhancing musical skills and enjoyment for hearing impaired individuals. This study represents a collaboration between University College London and Audiology and Cochlear-implant centres in and outside of London.
Why have my child and I been invited? You and your child have been invited because your child is cared for by [insert programme name here] and is aged between 5 and 7 years. Approximately 50 families will take part.
Do we have to take part? No. It is up to you and your child to decide whether or not to join the study. We are available to describe the study to you and go through this information sheet with you before you make any decision to be involved. If you agree to take part, we will ask you to sign a consent form. You and your child are free to withdraw at any time, without giving a reason. This would not affect the standard of care you or your child receives from your Audiology or cochlear-implant centre.
What will happen to my child and me if we agree to take part? We shall pass your contact details to Sian Edwards at the Ear Institute, University College London. She will arrange a time for you to visit the Ear Institute. The first visit takes place within a month of your child starting the study. The visit will take up to two hours. If your child is tired during a visit, we may ask you to come back on another day. This means there will be a minimum of one visit, and a maximum of two. We will try to arrange the visits at times that are convenient for you.
Appendix 2: Parent information sheet 1

236
During each visit, we shall ask your child to take part in musical and singing tasks designed to assess their musical abilities, along with some tests of hearing and speech. We shall ask you to complete some questionnaires relating to your experience of your child’s hearing impairment and about your child’s musical development and enjoyment. The aim of the study is to compare musical outcomes for groups of children, not to compare individual children. Taking part in the study will not affect the medical care that your child receives. Further details are given in Part 2 of this information sheet.
Expenses and payments For each visit, we will pay you an inconvenience allowance; this is intended to cover the cost of travel to the Ear Institute, childcare costs for siblings and to thank you for taking part. If visit is to take place within your local Audiology department the inconvenience allowance will be revised to reflect less travel expenses.
What are the other possible disadvantages and risks of taking part? There are no risks in taking part. Some children may find the assessments boring. We will take breaks during the assessments to minimise this. It is possible you might find some of the questionnaires difficult to answer (for example, some parents find it difficult to estimate the quality of life of their child). You would need to travel and to give up some of your time in order to help us. We would prefer you not to bring siblings to the assessments, so you would need to arrange alternative care for them.
What are the possible benefits of taking part? The information that we obtain from you and your child will help us to compare the perception of musical attributes for the different management options available for children of this age. This information will help clinicians and parents to make decisions about how best to enhance these musical abilities for hearing-impaired children in the future. We will send you a report after each visit to describe the results of the assessments of your child.
What if there is a problem? Any complaint about the way you have been dealt with during the study or any adverse effect on you or your child caused by the study will be addressed. Detailed information is given in Part 2.
Will my taking part in the study be kept confidential? Yes. We will follow ethical and legal practice and all information about you will be handled in confidence. The details are included in Part 2.
This completes Part 1 of the Information Sheet. If the information in Part 1 has interested you and you are considering taking part, please read the additional information in Part 2 before making any decision.

237
PART 2
What will happen to my child and me if we take part? Why would we have to visit the Ear Institute? We have special equipment for measuring children’s listening and musical skills in the Ear Institute. How would we travel to the Ear Institute? The Ear Institute is close to Kings Cross and easy to reach by public transport. Parking in the local area is very limited. We will give you detailed instructions on how to find the Ear Institute. What will happen at the Ear Institute? We shall ask you to spend up to one and a half hours with us at each appointment. We will assess your child’s musical abilities through pitch, rhythm and timbre discrimination tasks as well as a measurement of their singing voice. All tests have been selected to be appropriate for children of this age. We will have several breaks. We shall ask you to remain in the room with your child and to help by giving your child praise and encouragement. Sometimes it is difficult to interpret a young child's responses during the assessment. We will make voice-recording of part of the session, so that we can refer back if necessary. We will ask you about your child’s musical abilities and behaviours, and about your child’s health and well-being in questionnaire form. Sometimes, children are tired during a visit. If this happens, we may ask you to come back to the Ear Institute to repeat some of the assessments. We will pay you an inconvenience allowance designed to cover travelling costs for each visit. If it would be more convenient, it may be possible for one of the research team to visit you and your child at home/audiology or cochlear implant department to complete the assessments. How long will the study go on? You and your child would be involved in the study for up to 12 months.
What will happen if I don’t want to carry on with the study? You may withdraw from the study at any time and without giving a reason. If you withdraw, we will need to use the research data that we have gathered from you and your child up to that point.
What if there is a problem? If you have a concern about any aspect of this study, you should speak to Sian Edwards who will do her best to answer your questions (telephone 07779269757). Every care will be taken in the course of this study. However, in the unlikely event that you are injured by taking part, compensation may be available.
In the event that something goes wrong and you are harmed and this is due to someone’s negligence then you may have grounds for a legal action for compensation against University College London. If you suspect that the injury is the result of the Sponsor’s (University College London) or the hospital's negligence then you may be able to claim compensation. After discussing with your research doctor, please make the claim in writing to Dr Debi Vickers who is the Chief Investigator for the research and is based at the Ear Institute, 332-336 Gray’s Inn Road, London. WC1X 8EE.The Chief Investigator will then pass the claim to the Sponsor’s Insurers, via the Sponsor’s office. You may have to bear the costs of the legal action initially, and you should consult a lawyer about this.
Regardless of this, if you wish to complain, or have any concerns about any aspect of the way you have been approached or treated by members of staff or about any side effects (adverse

238
events) you may have experienced due to your participation in the research, the normal National Health Service complaints mechanisms are available to you. Please ask your research doctor if you would like more information on this. Details can also be obtained from the Department of Health website: http://www.dh.gov.uk
Will our taking part in this study be kept confidential? Any information which you and your child give to the research team, and all of the measurements that are collected from you and your child, will be confidential. Some parts of your child’s medical records and the data collected for the study will be looked at by authorised persons from your child’s hospital and from the research team. All will have a duty of confidentiality to you and your child and nothing that could reveal your identity or the identity of your child will be disclosed outside the research team without your permission. We will send you a report after each visit to describe the results of the assessments of your child. If you wish, we will send a copy of these reports to your child's audiologist. This is voluntary. The research team will comply with the terms of the UK Data Protection Act 1988. They will store the information and the measurements in anonymous computer files and in locked filing cabinets. They will store names and address separately from other data. No names will be used when the research is written up. Your results will be kept for 20 years and will then be destroyed. Some study documents may also be looked at by authorised representatives from University College London (UCL) Research & Development Unit to check that the study is being carried out correctly. Professional standards of confidentiality will be followed by the authorised representatives. The handling, processing, storage and destruction of their data will be in accordance with the UK Data Protection Act 1998 and UCL’s Data Protection policy.
What will happen to the results of the research study? We shall report the results at medical and scientific meetings and in medical and scientific journals. We will send you a one-page summary of the results of the study. Neither your identity, nor that of your child, will be disclosed when we report the results of the study.
Who is organising and funding the research? The research is organised by the Ear Institute, University College London. None of the researchers, nor their institution, will be paid for including you and your child in the study. The research is funded by sponsorship from Advanced Bionics and PhonaK UK.
Who has reviewed the study? All research in the NHS is looked at by an independent group of people, called a Research Ethics Committee, to protect your interests.
What should we do next? Please read the Consent Form that is attached to this Information Sheet. We will give you copies of these documents to take home. If you would like to take part, please complete the consent form and hand in or post to your Audiology/cochlear implant department or alternatively bring it with you to your next routine appointment. If you would like more information, please get in touch with Sian Edwards at the Ear Institute. She can be reached by telephone at 07779269757, by e-mail at [email protected], or by letter at the address at the end of this information sheet.
Thank you for considering taking part in this study. If you choose to take part, you will be given this information sheet and a copy of your signed consent form to keep

239
UCL EAR INSTITUTE
Patient identification number for this study: __________
CONSENT FORM FOR PARENTS/GUARDIANS
Title of Project: Music Perception and Production in Hearing Impaired Children
1. I confirm that I have read and understood the information sheet dated 18/01/2011
(version 1.1) for the above study. I have had the opportunity to consider the information and to ask questions. I have had these questions answered satisfactorily.
2. I understand that the participation of my child and me in the study is voluntary
and that we are free to withdraw at any time without giving a reason, without our medical care or legal rights being affected.
3. I understand that information from relevant sections of my child’s medical notes,
including our contact details, will be sent to individuals at the Ear Institute. I give permission for these individuals to have access to my child’s records and to the data generated by the research.
4. I agree that researchers at the Ear Institute may make a voice-recording while my
child takes part in tests. This recording will not be seen by anyone other than the researchers involved in the study, unless I give my agreement in writing after visiting the Ear Institute. The recording will be destroyed as soon as possible.
5. I agree that the anonymous findings from the research can used in publications
and reports as detailed in the information sheet. I understand that the identity of me and my child will not be revealed.
6. I understand that study documents may be looked at by responsible
representatives from the Research Governance Sponsor of this study (UCL/UCLH R&D Unit) to ensure that the study is being conducted properly. I give permission for these individuals to have access the necessary information.
7. I agree that my child may take part in the study.
8. I agree to take part in the study, myself. 9. I would like my child’s audiologist to be sent a report describing my child’s results. YES/NO (this is optional - please delete as appropriate)
Name of audiologist___________________________ Name of hospital/clinic_________________________
Please initial box
Appendix 3: Parental Consent form
Please initial box

240
_____________________________ Name of child _________________________________ _______________ ________________________ Name of parent/guardian Date Signature _________________________________ _______________ ________________________ Name of person taking consent Date Signature
When completed: 1 for parent; 1 for Ear Institute file; 1 (original) to be kept in medical notes.

241
UCL EAR INSTITUTE
POSTAL INFORMATION SHEET FOR PARENTS/GUARDIANS ABOUT THE RESEARCH
Music Perception and Production in Hearing Impaired Children
Invitation We would like to invite you and your child to take part in a study which forms part of some PhD research. Before you decide whether or not to take part, we would like you to understand why the research is being done and what it would involve for you. Please read this information sheet carefully. Talk to others about the study if you wish. (Part 1 tells you the purpose of this study and what will happen to you and your child if you take part. Part 2 gives you more detailed information about the conduct of the study). Please contact Sian Edwards if there is anything that is not clear. Contact details for Sian are at the end of this information sheet.
PART 1 What is the purpose of the study? The study will compare the musical abilities of children with different management options for their hearing impairment i.e. cochlear implants, hearing aids or combinations of both. The results will be used to give information on how best to utilize signal processing options to build on music perception and enjoyment for hearing impaired children of this age. It may also have implications for future product development with respect to enhancing musical skills and enjoyment for hearing impaired individuals. This study represents a collaboration between University College London and Audiology and Cochlear-implant centres and charities in and outside of London.
Why have my child and I been invited? You and your child have been invited because your child is aged between 5 and 8 years and suffers with hearing impairment. Approximately 50 families will take part.
Do we have to take part? No. It is up to you and your child to decide whether or not to join the study. We will describe the study and go through this information sheet with you before you make any decision to be involved. If you agree to take part, we will ask you to sign a consent form. You and your child are free to withdraw at any time, without giving a reason. This would not affect the standard of care you or your child receives from your audiology or cochlear-implant centre.
What will happen to my child and me if we agree to take part? We shall pass your contact details to Sian Edwards at the Ear Institute, University College London. She will arrange a time for you to visit the Ear Institute. The visit takes up to one and a half hours. If your child is tired during a visit, we may ask you to come back on another day. This means there will be a minimum of one visit, and a maximum of two. We will try to arrange the visits at times that are convenient for you. During the visit, we shall ask your child to take part in musical and singing tasks designed to assess their musical abilities, along with some tests of hearing and speech. We shall ask you to complete some questionnaires relating to your experience of your child’s hearing impairment and about your child’s musical development and enjoyment. The aim of the study is to compare musical outcomes for groups of children, not to compare individual children. Taking part in the study will not affect the medical care that your child receives.
Appendix 4 – Postal information sheet
242
Further details are given in Part 2 of this information sheet.
Expenses and payments For each visit, we will pay you an inconvenience allowance (£30); this is intended to contribute the cost of travel to the Ear Institute, childcare costs for siblings and to thank you for taking part. If visit is to take place within your home/alternative location the inconvenience allowance will be revised to reflect less travel expenses.
What are the other possible disadvantages and risks of taking part? There are no risks in taking part. Some children may find the assessments boring. We will take breaks during the assessments to minimise this. It is possible you might find some of the questionnaires difficult to answer (for example, some parents find it difficult to estimate the quality of life of their child). You would need to travel and to give up some of your time in order to help us. We would prefer you not to bring siblings to the assessments, so you would need to arrange alternative care for them.
What are the possible benefits of taking part? The information that we obtain from you and your child will help us to compare the perception of musical attributes for the different management options available for children of this age. This information will help clinicians and parents to make decisions about how best to enhance these musical abilities for hearing-impaired children in the future. We will send you a report after each visit to describe the results of the assessments of your child.
What if there is a problem? Any complaint about the way you have been dealt with during the study or any adverse effect on you or your child caused by the study will be addressed. Detailed information is given in Part 2.
Will my taking part in the study be kept confidential? Yes. We will follow ethical and legal practice and all information about you will be handled in confidence. The details are included in Part 2.
This completes Part 1 of the Information Sheet. If the information in Part 1 has interested you and you are considering taking part, please read the additional information in Part 2 before making any decision. PART 2 What will happen to my child and me if we take part? Why would we have to visit the Ear Institute? We have special equipment for measuring children’s listening and musical skills in the Ear Institute, however this equipment can be portable so alternative locations can be arranged How would we travel to the Ear Institute? The Ear Institute is close to Kings Cross and easy to reach by public transport. Parking in the local area is very limited. We will give you detailed instructions on how to find the Ear Institute. What will happen at the Ear Institute? We shall ask you to spend up 1 ½ hours with us at each appointment. We will assess your child’s musical abilities through pitch and rhythm discrimination tasks as well as a measurement of their singing voice. All tests have been selected to be appropriate for children of this age. We will have several breaks. Sometimes it is difficult to interpret a young child's responses during the assessment. We will make voice-recording of part of the session, so that we can refer back if necessary.

243
We will ask you about your child’s musical abilities and behaviours, and about your child’s health and well-being in questionnaire form. Sometimes, children are tired during a visit. If this happens, we may ask you to come back to the Ear Institute to repeat some of the assessments. We will pay you an inconvenience allowance designed to cover travelling costs for each visit. If it would be more convenient, it may be possible for one of the research team to visit you and your child at home/audiology or cochlear implant department to complete the assessments. How long will the study go on? You and your child would be involved in the study for up to 12 months.
What will happen if I don’t want to carry on with the study? You may withdraw from the study at any time and without giving a reason. If you withdraw, we will need to use the research data that we have gathered from you and your child up to that point.
What if there is a problem? If you have a concern about any aspect of this study, you should speak to Sian Edwards who will do her best to answer your questions (telephone 07779269757). Every care will be taken in the course of this study. However, in the unlikely event that you are injured by taking part, compensation may be available.
In the event that something goes wrong and you are harmed and this is due to someone’s negligence then you may have grounds for a legal action for compensation against University College London. If you suspect that the injury is the result of the Sponsor’s (University College London) or the hospital's negligence then you may be able to claim compensation. After discussing with your research doctor, please make the claim in writing to Dr Debi Vickers who is the Chief Investigator for the research and is based at the Ear Institute, 332-336 Gray’s Inn Road, London. WC1X 8EE.The Chief Investigator will then pass the claim to the Sponsor’s Insurers, via the Sponsor’s office. You may have to bear the costs of the legal action initially, and you should consult a lawyer about this.
Regardless of this, if you wish to complain, or have any concerns about any aspect of the way you have been approached or treated by members of staff or about any side effects (adverse events) you may have experienced due to your participation in the research, the normal National Health Service complaints mechanisms are available to you. Please ask your research doctor if you would like more information on this. Details can also be obtained from the Department of Health website: http://www.dh.gov.uk
Will our taking part in this study be kept confidential? Any information which you and your child give to the research team, and all of the measurements that are collected from you and your child, will be confidential. Some parts of your child’s medical records and the data collected for the study will be looked at by authorised persons from your child’s hospital and from the research team. All will have a duty of confidentiality to you and your child and nothing that could reveal your identity or the identity of your child will be disclosed outside the research team without your permission. We will send you a report after each visit to describe the results of the assessments of your child. If you wish, we will send a copy of these reports to your child's audiologist. This is voluntary. The research team will comply with the terms of the UK Data Protection Act 1988. They will store the information and the measurements in anonymous computer files and in locked filing cabinets. They will store names and address separately from other data. No names will be used when the research is written up. Your results will be kept for 20 years and will then be destroyed.

244
Some study documents may also be looked at by authorised representatives from University College London (UCL) Research & Development Unit to check that the study is being carried out correctly. Professional standards of confidentiality will be followed by the authorised representatives. The handling, processing, storage and destruction of their data will be in accordance with the UK Data Protection Act 1998 and UCL’s Data Protection policy.
What will happen to the results of the research study? We shall report the results at medical and scientific meetings and in medical and scientific journals. We will send you a one-page summary of the results of the study. Neither your identity, nor that of your child, will be disclosed when we report the results of the study.
Who is organising and funding the research? The research is organised by the Ear Institute, University College London. None of the researchers, nor their institution, will be paid for including you and your child in the study. The research is funded by sponsorship from Advanced Bionics and PhonaK UK.
Who has reviewed the study? All research in the NHS is looked at by an independent group of people, called a Research Ethics Committee, to protect your interests.
What should we do next? If you would like to take part, please complete the tear-off slip at the end of this form and post/email it to Sian Edwards. Sian will contact your child’s hospital or clinic to obtain some information form your child’s medical records. Sian will then contact you to arrange a convenient time for you to visit the Ear Institute. If you would like more information, please get in touch with Sian Edwards at the Ear Institute. She can be reached by telephone at 07779269757, by e-mail at [email protected], or by letter at the address at the end of this information sheet. Thank you for considering taking part in this study.
detach slip here
Music Perception and Production in Hearing Impaired Children I am interested in taking part in this study. I give consent for the research team to access my child’s medical records and to contact me. Name of child:_____________________________DOB:__________________
Ethnicity:_________________
Name of parent/guardian:___________________________
Signature of parent/guardian: ________________________ Date: _______
Address: __________________________________________________
_________________________________________________________
Telephone number: _____________________________Email
Address:________________________________

245
Name of the hospital or clinic that looks after your child’s hearing aids or cochlear
implants:__________________________________________________
Please detach this slip and return it to: Sian Edwards, UCL Ear Institute, 332-336 Gray’s Inn Road,
London, WC1X 8EE or email to [email protected]

246
CHILDREN’S INFORMATION SHEET
Dear (participants name here), My name is Sian. I would like to invite you to help me with my research.
“How do children hear and sing music?”
I want to know more about the way you hear and understand music –
as well as the way you sing What will happen? You will be invited to your hospital Audiology department my University…
I will carry out some music tasks with you.
Appendix 5 – Children’s Information Sheet

247
For some of the games you will have to listen For some you will have to sing
And others you will play games on a computer!
It won’t take too long! And we will take lots of breaks so that you do not get tired.
You can ask me any questions.

248
You can always talk to me about it…
What happens when the research study finishes? If you or parents/carers want
You will receive a letter telling you what the study found.
Thanks for reading! Would you like to take part? (can be answered verbally) Yes □ No □

249
Appendix 6: NSP Child Singing Assessment form