pirozzi, igor (2009) a factorial approach to defining the...
TRANSCRIPT
This file is part of the following reference:
Pirozzi, Igor (2009) A factorial approach to defining the dietary protein and energy requirements of
mulloway, Argyrosomus japonicus : optimising feed formulations and feeding strategies. PhD thesis, James
Cook University.
Access to this file is available from:
http://eprints.jcu.edu.au/11697

A factorial approach to defining the dietary protein and energy requirements of mulloway, Argyrosomus japonicus:
optimising feed formulations and feeding strategies.
Thesis submitted by Igor Pirozzi BSc(Hons)
July 2009
For the degree of Doctor of Philosophy School of Marine & Tropical Biology
James Cook University Townsville Australia

i
19/02/2010
STATEMENT OF ACCESS
I, the undersigned, the author of this thesis, understand that James Cook University
will make it available for use within the University Library and, by microfilm or other
means, allow access to users in other approved libraries. All users consulting this
thesis will have to sign the following statement:
“In consulting this thesis I agree not to copy or closely paraphrase
it in whole or in part without the written consent of the author; and
to make proper public written acknowledgement for any assistance
which I have obtained from it.”
Beyond this, I do not wish to place any restriction on access to this thesis.
____________________ ____________ Igor Pirozzi Date

ii
19/02/2010
STATEMENT OF SOURCES DECLARATION
I declare that this thesis is my own work and has not been submitted in any form for
another degree or diploma at any university or other institution of tertiary education.
Information derived from the published or unpublished work of others has been
acknowledged in the text and a list of references is given.
____________________ ____________ Igor Pirozzi Date

iii
19/02/2010
ELECTRONIC COPY
I, the undersigned, the author of this work, declare that the electronic copy of thesis
provided to the James Cook University Library is an accurate copy of the print thesis
submitted, within the limits of the technology available.
____________________ ____________ Igor Pirozzi Date

iv
19/02/2010
DECLARATION ON ETHICS
The research presented and reported in this thesis was conducted within the
guidelines for research ethics outlined in the National Statement on Ethics Conduct in
Research Involving Human (1999), the Joint NHMRC/AVCC Statement and
Guidelines on Research Practice (1997), the James Cook University Policy on
Experimentation Ethics. Standard Practices and Guidelines (2001), and the James
Cook University Statement and Guidelines on Research Practice (2001). The
proposed research methodology received clearance from the James Cook University
Experimentation Ethics Review Committee (approval number A1102).
____________________ ____________ Igor Pirozzi Date

v
STATEMENT ON THE CONTRIBUTION OF OTHERS
Funding • Aquafin CRC, PhD Scholarship • Aquafin CRC, Training Support Travel Grant • School of Marine & Tropical Biology, James Cook University, Postgraduate
Travel Award. • Graduate Research Scheme Grant, James Cook University • Australian Centre for International Agricultural Research (ACIAR) and the
Australian Academy of Technological Sciences and Engineering (ATSE) Crawford Fund. Aquaculture Nutrition Master Class, Bangkok, Thailand
• NSW DPI Fisheries • Commercialisation Training Scheme (CTS) Award, James Cook University. Post
Graduate Certificate in Research Commercialisation Supervision • Dr Mark Booth, NSW DPI Port Stephens Fisheries Institute • Dr Geoff Allan, NSW DPI Port Stephens Fisheries Institute • Professor Rocky de Nys, School of Marine & Tropical Biology, James Cook
University • Dr Tish Pankhurst, School of Marine & Tropical Biology, James Cook University Research in-kind support • NSW DPI Port Stephens Fisheries Institute • Anthony O’Donohue, Clearwater Mulloway Chemical analyses • Queensland Department of Primary Industries Administration • Helena Heasman, NSW DPI Port Stephens Fisheries Institute
vi
Publications Associated with this Thesis
Peer Reviewed Journal Articles
Pirozzi, I., Booth, M.A., 2009. The effect of temperature and body weight on the
routine metabolic rate and postprandial metabolic response in mulloway,
Argyrosomus japonicus. Comparative Biochemistry and Physiology - Part A:
Molecular & Integrative Physiology. 154, 110-118
Pirozzi, I., Booth, M.A., 2009. The routine metabolic rate of mulloway (Argyrosomus
japonicus: Sciaenidae) and yellowtail kingfish (Seriola lalandi: Carangidae)
acclimated to six different temperatures. Comparative Biochemistry and
Physiology - Part A: Molecular & Integrative Physiology. 152, 586-592.
Pirozzi, I., Booth, M.A., Allan, G.L., In press. Protein and energy utilization and the
requirements for maintenance in juvenile mulloway (Argyrosomus japonicus).
Fish Physiology and Biochemistry. doi: 10.1007/s10695-10008-19296-10690.
Pirozzi, I., Booth, M.A., Allan, G.L., In press. The interactive effects of dietary
protein and energy on feed intake, growth and protein utilization of juvenile
mulloway (Argyrosomus japonicus). Aquaculture Nutrition. doi:
10.1111/j.1365-2095.2007.00641.x
Pirozzi, I., Booth, M.A., Pankhurst, P.M., 2009. The effect of stocking density and
repeated handling on the growth of juvenile mulloway, Argyrosomus
japonicus (Temminck & Schlegel 1843). Aquaculture International. 17, 199-
205.

vii
Conferences
Pirozzi, I., Booth, M.A., Allan, G.L. 2008. Defining the dietary and energy needs of
mulloway: Investigations using factorial bioenergetic approaches to nutrient
requirements. XIII ISFNF – International Symposium of Fish Nutrition and
Feeding. Florianopolis, Brasil. June 1 – 5, 2008. (Oral presentation)
Workshops
Pirozzi, I. (2006) Aquaculture Feed Management. In: Allan, G., Heasman, H., and
Ferrar, P (eds.). Report on the Aquaculture Nutrition Master Class held at
Asian Institute of Technology, Bangkok, Thailand 7-19 August 2006. The
ATSE Crawford Fund. Parkville, VIC. (Oral Presentation).
Technical Reports Booth, M.A., Pirozzi, I., Allan, G.L., Fielder, D.S. In Prep. Aquafin CRC: Feed
technology for temperate fish species. Volume 2: Diet Development. FRDC
Project No. 2004/220.

viii
Acknowledgements
I gratefully acknowledge the advice, support, encouragement and assistance of the following people:
Dr Geoff Allan provided me the opportunity to undertake this research in 2005 and over the subsequent years has continued to encourage and support the development of my career as a scientist. Thank you.
This thesis would be a very different document without the advice and input
of Dr Mark Booth. Mark, I am eternally grateful for your help over the years, often times which I would consider above and beyond. Your knowledge and enthusiasm made my task infinitely more achievable.
I am also grateful for the support of my university supervisors, Dr Tish
Pankhurst and Professor Rocky de Nys.
I acknowledge and appreciate the technical assistance of the following staff at NSW DPI Port Stephens Fisheries Institute (PSFI): Ian Russell, Ben Doolan, Paul Beevers, Luke Vandenberg, Luke Cheviot, Deb Ballagh, Ben Kearney, Lynne Foulkes and Steve O’Connor. The Marine Fish Breeding Unit produced the mulloway and yellowtail kingfish used in this research. I am also grateful to Helena Heasman for her administrative support.
I thank Dr Wayne O’Connor, Dr Mike Dove and Dr Stewart Fielder at PSFI for critically reviewing the manuscripts in this thesis. The Aquafin CRC provided financial support including a scholarship stipend and travel contributions. In particular I would like to acknowledge the support of Professor Chris Carter and Emily Downes. Dr Richard Smullens, Dr Mark Porter and Anthony O’Donohue provided industry support. Finally, I am forever grateful to my family for their love, support and especially patience over these sometimes challenging years. Their unyielding dedication has helped to see this thesis through to fruition.
ix
Abstract
The costs associated with feeds and feeding typically constitute the largest
proportion of operating expenses in the production of fish in intensive culture. Sub-
optimal feeds and inefficient feeding regimes result in direct economic losses through
food wastage and sub-optimal growth, deterioration of water quality and increased
environmental pressures from excessive waste production. The formulation of cost-
effective, nutritionally optimal diets are therefore imperative to maximising
profitability and reducing waste output on marine fish farms. Recent interest by
industry in New South Wales and South Australia has focused on mulloway culture;
however, little information exists on the protein and energy requirements for this
species. Prior to the commencement of this research there were no published data on
the requirements for digestible protein (DP) and digestible energy (DE) for mulloway
and, as a consequence, no specific diet formulations or feeding standards were
available.
Mathematical modelling in animal nutrition provides an extremely useful tool
in the development of practical feed evaluation systems (i.e. feeding standards and
practices) to describe and predict nutrient requirements, body composition and
growth of the animal. Factorial bioenergetics is the quantitative study of energy gains,
losses and transfers within the whole organism based on thermodynamic principles
and has been widely applied to animal nutrition and the development of feed
evaluation systems.
The general aim of this thesis was to establish a practical feed evaluation
system for mulloway based on the factorial approach. This was achieved by

x
conducting a series of interrelated studies which determined the requirements for DP
and DE for maintenance and growth and described aspects of metabolism relating to
the fasting and feeding physiology of this species. The following is a brief overview
of these studies.
A comparative study was undertaken to establish the routine metabolic rates
(RMR) for similar sized mulloway, a sedentary species, and yellowtail kingfish, a
highly active species, acclimated at one of several temperatures ranging from 10 – 35
oC. RMR increased linearly with increasing temperature (T) for both species. RMR
for mulloway was 5.78T - 29.0 mg O2 kg-0.8 h-1 and for yellowtail kingfish was
12.11T -39.40 mg O2 kg-0.8 h-1. The energetic cost of routine activity can be described
as a function of temperature for mulloway as 1.93T – 9.68 kJ kg-0.8 day-1 and for
yellowtail kingfish as 4.04T – 13.14 kJ kg-0.8 day-1. RMR for mulloway was least
thermally dependent at 28.5 oC and for yellowtail kingfish at 22.8oC. The results of
this study have direct implications with regard to the appropriate temperatures at
which to culture these species.
Specific dynamic action (SDA) is the energy expended on the physiological
processes associated with meal digestion and is strongly influenced by the
characteristics of the meal and the body weight (BW) and temperature of the
organism. The effects of temperature and body weight on the RMR and SDA
response in mulloway were assessed at 3 temperatures (14, 20 or 26 oC). RMR and
SDA were shown to represent significant energetic costs in the overall energy budget
of mulloway. Many of the SDA indices measured in this study were within the ranges
of those reported for other temperate marine fish; however, these values are not fixed
and are highly dependent on temperature, body size and feed intake. The effect of
body size on the mass-specific RMR (mg O2 kg-1 h-1) varied significantly depending

xi
on the temperature with a greater relative increase in the mass-specific RMR
demonstrated for smaller mulloway with increasing temperature. The gross RMR (mg
O2 fish-1 h-1) of mulloway can be described as function of temperature as: (0.0195T –
0.0454)BW(g)0.8 and the mass-specific RMR (mg O2 kg-1 h-1) can be described as:
(21.042T – 74.867)BW(g)-0.2. SDA duration occurred within 41-89 h and was
influenced by both temperature and body weight. The average proportion of energy
expended over the SDA period (SDA coefficient) ranged from approximately 7 – 13
% of the total DE intake while the proportion of total energy expended on SDA above
RMR ranged from approximately 16 to 27 %.
The utilization of DP and DE is dependant on the composition of the diet and
the efficiency with which tissue deposition (growth) occurs. A detailed understanding
of the relationships between nutrient intake, tissue deposition and body composition
is necessary to accurately determine feed requirements. The effects of body weight,
temperature and feed intake level on the utilization of DP and DE and the
requirements for maintenance in mulloway were investigated. Utilization efficiencies
for growth based on linear regression for DP (0.58) and DE (0.60) were found to be
independent of fish size, temperature and feed intake level. The partial utilization
efficiencies of DE for protein (kp) and lipid (kl) deposition, estimated using a factorial
multiple regression approach, were 0.49 and 0.75 respectively. Maintenance
requirements estimated using linear regression were independent of temperature for
DP (0.47g DP kg-0.7 day-1) while maintenance requirements for DE increased with
increasing temperature (44.2 or 49.6 kJ DE kg-0.8 day-1 at 20 or 26 oC respectively).
The interactive effects of DP and DE on the feed intake, growth and body
composition of mulloway were investigated using the dose-response method to
identify the optimal DP content and DP:DE ratio for the growth of mulloway. This

xii
was achieved by feeding mulloway diets containing one of four different DP levels
(250 - 550 g kg-1) at two DE levels (16 or 21 MJ kg-1). The results indicated that feed
intake was not governed solely by energy demands but was also dependant on the DP
content of the diet. Protein utilization did not improve with diets containing
decreasing protein and increasing lipid content indicating that mulloway have a
limited capacity to spare dietary protein. Optimal DP content was found to be 444-
491 g kg-1 depending on the DE content of the diet and the size of mulloway and is
within the range reported for other sciaenid species. The use of formulated diets with
28.6 g DP MJ DE-1 will achieve optimal growth and protein deposition for 70 – 275g
mulloway.
The final study consolidated the results of the previous experiments to
establish a feed evaluation system for mulloway using a factorial approach based on
the requirements for DP and DE. Assessments of the growth potential of mulloway
and the allometric relationships between body size and protein and energy
metabolism and protein and energy whole body composition were combined with
data previously established on the utilization efficiencies and maintenance
requirements for DP and DE. Factorial modeling of the data allowed estimations of
the decreasing requirement of the ratio of DP:DE for mulloway with increasing body
size through grow-out production up to 2 kg. Estimations using the factorial method
were found to be close to those estimated independently using the dose-response
method. From this information theoretical diet formulations and feeding regimes were
iteratively derived to match the predicted shifting requirements for DP and DE
dependant on body size and the grow-out stage of mulloway.
xiii
Table of Contents
Statement of Access ...................................................................................................... i
Statement of Sources Declaration .............................................................................. ii
Electronic Copy ........................................................................................................... iii
Declaration on Ethics .................................................................................................. iv
Statement on the Contribution of Others .................................................................. v
Publications Associated with this Thesis .................................................................. vi
Acknowledgements ................................................................................................... viii
Abstract .................................................................................................................... ix
List of Figures ............................................................................................................ xvi
List of Tables ............................................................................................................. xix
List of Abbreviations ................................................................................................ xxi
Chapter 1. General introduction ................................................................................ 1
1.1 A brief overview of global aquaculture production ...............................................................1 1.2 Aquaculture in Australia ........................................................................................................3 1.3 Mulloway (Argyrosomus japonicus, Sciaenidae) aquaculture in Australia ...........................7 1.4 Need for research ...................................................................................................................9 1.5 Digestibility and utilisation of feeds .................................................................................... 10 1.6 Bioenergetic approach to practical feed evaluation systems ................................................ 12 1.7 This thesis ............................................................................................................................ 14
Chapter 2. The routine metabolic rate of mulloway and yellowtail kingfish acclimated to six different temperatures1 ................................................................ 18
2.1 Abstract ................................................................................................................................ 18 2.2 Introduction ......................................................................................................................... 19 2.3 Materials and methods ......................................................................................................... 22
2.3.1 Respirometry validation ................................................................................................. 22 2.3.2 RMR experiment design and fish handling .................................................................... 23 2.3.3 MO2 ................................................................................................................................ 24 2.3.4 Data analyses ................................................................................................................. 25
2.4 Results ................................................................................................................................. 28 2.4.1 Respirometer validation ................................................................................................. 28 2.4.2 Metabolism ..................................................................................................................... 29
2.5 Discussion ............................................................................................................................ 33
Chapter 3. The effect of temperature and body weight on the routine metabolic rate and postprandial metabolic response in mulloway2 ....................................... 41
3.1 Abstract ................................................................................................................................ 41 3.2 Introduction ......................................................................................................................... 42 3.3 Materials & Methods ........................................................................................................... 44
3.3.1 Experiment design .......................................................................................................... 44 3.3.2 MO2 ................................................................................................................................ 45 3.3.3 RMR and SDA Parameters ............................................................................................ 46 3.3.4 Data analyses ................................................................................................................. 48
3.4 Results ................................................................................................................................. 49
xiv
3.4.1 Temperature and fish size interactions .......................................................................... 49 3.4.2 MO2SDA Curve fitting ...................................................................................................... 59
3.5 Discussion ............................................................................................................................ 61 3.5.1 Influence of mass and temperature on RMR .................................................................. 61 3.5.2 SDA response ................................................................................................................. 63 3.5.3 Conclusion ..................................................................................................................... 67
Chapter 4. Protein and energy utilization and the requirements for maintenance in juvenile mulloway3 ................................................................................................. 69
4.1 Abstract ................................................................................................................................ 69 4.2 Introduction ......................................................................................................................... 70 4.3 Materials and methods ......................................................................................................... 71
4.3.1 Experiment design .......................................................................................................... 71 4.3.2 Experiment system ......................................................................................................... 72 4.3.3 Feed and feeding ............................................................................................................ 73 4.3.4 Sample preparation and analyses .................................................................................. 73 4.3.5 Data analyses ................................................................................................................. 75
4.4 Results ................................................................................................................................. 77 4.4.1 Utilization efficiencies and maintenance requirements ................................................. 79 4.4.2 Effect of ration level and temperature on carcass composition ..................................... 86
4.5 Discussion ............................................................................................................................ 87
Chapter 5. The interactive effects of dietary protein and energy on feed intake, growth and protein utilization of juvenile mulloway4 ............................................ 93
5.1 Abstract ................................................................................................................................ 93 5.2 Introduction ......................................................................................................................... 94 5.3 Materials and methods ......................................................................................................... 96
5.3.1 Experiment design and system ....................................................................................... 96 5.3.2 Feeds and feeding .......................................................................................................... 97 5.3.3 Sample preparation and analyses .................................................................................. 97 5.3.4 Performance indices ...................................................................................................... 98 5.3.5 Data analyses ................................................................................................................. 99
5.4 Results ............................................................................................................................... 101 5.4.1 Diet and fish size interactions on feed intake, FE and PRE ......................................... 101 5.4.2 Effect of dietary DE and DP on whole body composition ............................................ 106 5.4.3 Dietary DP requirements ............................................................................................. 107
5.5 Discussion .......................................................................................................................... 110
Chapter 6. A factorial approach to diet formulation and feeding regimes for mulloway based on the requirements for protein and energy ............................. 115
6.1 Abstract .............................................................................................................................. 115 6.2 Introduction ....................................................................................................................... 115 6.3 Materials & Methods ......................................................................................................... 117
6.3.1 Growth data ................................................................................................................. 117 6.3.2 Body composition ......................................................................................................... 118 6.3.3 Dietary protein and energy utilization ......................................................................... 119 6.3.4 Metabolic body weight ................................................................................................. 119 6.3.5 Maintenance requirements ........................................................................................... 120 6.3.6 Data analyses ............................................................................................................... 121
6.4 Results ............................................................................................................................... 122 6.4.1 Growth model............................................................................................................... 122 6.4.2 Body composition ......................................................................................................... 123 6.4.3 Metabolic body weight ................................................................................................. 123 6.4.4 Protein and energy requirements ................................................................................. 125 6.4.5 Feed formulations and practical diet assignment ........................................................ 126
6.5 Discussion .......................................................................................................................... 130 6.5.1 Feed formulation & feed requirements ........................................................................ 130 6.5.2 Protein and energy composition .................................................................................. 131 6.5.3 Growth model............................................................................................................... 132
xv
6.5.4 Metabolic body weight ................................................................................................. 133 6.5.5 Conclusion ................................................................................................................... 134
Chapter 7. General discussion ................................................................................ 135
7.1 Methodological considerations .......................................................................................... 136 7.1.1 Factors influencing estimations of protein and energy requirements based on the factorial method: Individual parameter sensitivity .................................................................... 136 7.1.2 Estimating maintenance energy requirements ............................................................. 142
7.2 Bioenergetic application .................................................................................................... 144 7.3 Industry implications ......................................................................................................... 147 7.4 Mulloway feed evaluation system - future direction .......................................................... 149 7.5 Conclusions ....................................................................................................................... 150
Appendix 1. Pilot Study: The effect of stocking density and repeated handling on the growth of juvenile mulloway5 ........................................................................... 153
A1.1 Abstract .............................................................................................................................. 153 A1.2 Introduction ....................................................................................................................... 153 A1.3 Materials and Methods....................................................................................................... 154 A1.4 Results ............................................................................................................................... 157 A1.5 Discussion .......................................................................................................................... 160
Appendix 2 ................................................................................................................ 162
References ................................................................................................................. 165

xvi
List of Figures
Figure 1.1. Trends in world aquaculture production by major species group. NEI = Not elsewhere included. Source: FAO (2008) ....................................... 2
Figure 1.2. Trends in total aquaculture production and value in Australia. Source: O'Sullivan and Savage (2009)................................................................ 4
Figure 1.3. Australian aquaculture production by quantity 2006/07. “Other” includes aquaculture production not elsewhere specified due to confidentiality restrictions. In Victoria, this includes abalone, warm water finfish, ornamental fish, other shellfish, shrimps and aquatic worms. Data adapted from ABARE (2008). .......................................... 5
Figure 1.4. Mulloway, Argyrosomus japonicus (Temminck & Schlegel, 1843). ... 7
Figure 2.2. Linear relationship between temperature and the mass-specific RMR of mulloway (triangle) and yellowtail kingfish (circle). Data points and solid regression lines represent corrected data (mean±se; n = 3). Dashed regression lines representing uncorrected data also shown for comparison. .......................................................................................... 30
Figure 2.4. Relationship between mean Q10 (n = 3) and geometric mean temperature for mulloway (triangle) and yellowtail kingfish (circle). 32
Figure 3.1. Relationship between BW (g) and A. MO2rmr-g and B. MO2rmr-s at 14 (squares), 20 (triangles) and 26 oC (circles). Solid lines represent power functions with exponent (b) values fixed at 0.8 and -0.2 for graphs A and B respectively. Dashed lines represent power functions with unconstrained iteratively derived b. Refer to Table 3.3 for specific parameter values. .................................................................... 51
Figure 3.2. Temporal pattern of SDA measured as mean MO2 (mg O2 kg-1 h-1) (±se; n = 3) of XS, S and M size mulloway at 14 (squares), 20 (triangles) and 26 oC (circles). Horizontal dashed lines represent MO2rmr-s at each temperature and size treatment. Refer to Table 2 for MO2rmr-s values. Quadratic functions shown fitted for MO2sda-d. .......... 54
Figure 3.3. Allometric relationship between BW (g) and peak gross MO2 (mg fish-
1 h-1) (n = 9). ......................................................................................... 55
Figure 4.1. Effect of digestible protein intake (g kg-0.7 day-1) on PRE at 20 oC (dashed line) and 26o C (solid line). .................................................... 80
Figure 4.2. Effect of digestible energy intake (kJ kg-0.8 day-1) on ERE at 20 oC (dashed line) and 26 oC (solid line). .................................................... 82
Figure 4.3. Effect of digestible protein intake (g DP kg-0.7 day-1) on protein gain (g kg-0.7 day-1). .......................................................................................... 83
Figure 4.4. Effect of digestible energy intake (kJ kg-0.8 day-1) on energy gain (kJ kg-0.8 day-1). Dashed lines = 20 oC; Solid line = 26 oC ........................ 84
Figure 4.5. Partial retained energy as protein (PE; solid line) or lipid (LE; dashed line) as a function of increasing DE intake at 20 and 26 oC. ............... 86

xvii
Figure 5.1. First-order interaction (DE x DP and DP x size) on relative feed intake (RFI). Second-order interaction (DE x DP x size) on feeding efficiency (FE) and protein retention efficiency (PRE). Data points are means ± se (n = 3; n = 2 for large HE4). Solid circles = high energy diets (HE; 21 MJ kg-1); Open circles = low energy diets (LE; 16 MJ kg-1). Dietary DP level 1 – 4 = 255, 375, 435 or 555 g DP kg-1. Small ~70g; large ~200g ibw. Tukey-Kramer test on means within the DE x DP interaction term for each size class. Diets shown ranked by mean values from highest (top) to lowest (bottom). Means sharing lines are not significantly different (p>0.05). ................................................... 104
Figure 5.2. Effect of dietary DE on lipid, moisture, energy and protein composition of mulloway dependant on dietary DP content. Data are pooled means across size terms (± se; n = 6; n = 5 for HE4). Solid circles = high energy diets (HE; 21 MJ kg-1); Open circles = low energy diets (LE; 16 MJ kg-1). Dietary DP level 1 – 4 = 255, 375, 435 or 555 g DP kg-1. ................................................................................ 106
Figure 5.3. Effect of dietary DP and DE on PRE. Asymptote of quadratic functions represent required dietary DP for optimal PRE. (± se; n = 3; n = 2 for Large HE at 555 g DP kg-1). HE = 21 MJ kg-1; LE = 16 MJ kg-1. .................................................................................................... 108
Figure 5.4. Effect of dietary DP and DE on protein gain (g kg-0.7 day-1). (± se; n = 6; n = 5 for HE at 55.5 g DP 100g-1). HE = 21 MJ kg-1; LE = 16 MJ kg-1. .................................................................................................... 109
Figure 5.5. Effect of dietary DP:DE ratio (g DP MJ DE-1) on protein gain (g kg-0.7
day-1). (± se; n = 6; n = 5 for 26.5 g DP MJ DE-1; HE1 data for small mulloway removed from analyses). Maximum protein deposition at 28.6 g DP MJ DE-1. Dashed vertical lines represent 95 % confidence limits at 26.6 - 30.8 g DP MJ DE-1. HE = 21 MJ kg-1; LE = 16 MJ kg-1.
........................................................................................................... 110
Figure 6.1. Relationship between standard length (mm) and body weight (g) f mulloway. Weight measurements range from 12 – 1600 g. (r2 = 0.99; n = 3531). .............................................................................................. 118
Figure 6.2. Relationship between BW (g) and growth rate (g fish-1 day-1) of mulloway held at an average temperature of approximately 23 oC (solid line). Data points represent mean values of groups of fish (n = 44). Dashed lines represent estimations of growth rates at the lower and upper ranges of temperatures occurring during growth trials (18 – 30 oC) based on Eqn. (6.5). ................................................................ 121
Figure 6.3. Relationship between proximate body composition and live weight (g) (n = 45 groups). Diamonds = moisture; Circles = energy; Triangles = protein; Crosses = lipid; Squares = ash. ............................................. 122
Figure 6.4. Protein loss (g fish day-1) of mulloway after 2 or 4 weeks fasting at 14oC or 20oC (n = 12). ....................................................................... 124
Figure 6.5. Energy loss (g fish day-1) of mulloway after 2 or 4 weeks fasting at 14oC or 20oC (n = 12). ....................................................................... 125

xviii
Figure 6.6. Relationship between theoretical FCR and feed intake values (%BW) and BW for mulloway fed diets with three different DE contents (15, 17 or 19 MJ kg-1). Predicted FCR’s increase with increasing BW, feed intake as a proportion of BW decreases with increasing BW. Values based on theoretical feed intake at 26 oC with diets optimized for decreasing DP:DE demands with increasing BW. ............................. 128
Figure 6.7. Theoretical requirement for DP:DE ratio at 20 to 26oC. Breakpoints (dashed vertical lines) derived from piecewise analysis occur at 111, 582 and 1120 g. .................................................................................. 128
Figure 7.1. Energy or protein whole body content as a function of DE or DP intake for 40 g mulloway (IBW) held at 26 oC for 57 days (n = 12). Data adapted from Chapter 4. ............................................................ 140
Figure 7.2. Comparison of predicted body weight over time between mulloway, white grouper (Lupatsch and Kissil 2005) and barramundi (Lupatsch and Kissil 2003) growing from 1 g to 2 kg at 26 oC. ......................... 141
Figure 7.3. Comparison of maintenance energy requirements of unfed mulloway at 20 oC using the different methodologies presented in this thesis. Legend codes are reference to the specific studies and chapter numbers: RMR (2) = Eqn. (2.13) (Chapter 2); RMR (3) = derived from Eqn. (3.1) using the oxyenergetic coefficient of 13.59 kJ mg-1 O2 (Chapter 3); Feed utilisation = y-intercept of Eqn. (4.6) (Chapter 4); Fasting 20:2 and 20:4 power functions adapted from Table 6.1 when b = 0.8 (Chapter 6). ............................................................................... 143
Figure 7.4. Dietary energy partitioning schematic for fed mulloway based on the culture conditions presented in Chapter 3. Digestibility coefficient from Booth (unpublished data, 2008). SDA and maintenance (RMR) energetic values from Chapter 3. Non-faecal energy assumed to be ~3-9% (Chakraborty et al. 1995; Kaushik 1998). Recovered energy estimated by difference. ..................................................................... 146
Figure 7.5. Predicted growth rates of 1g mulloway to 2 kg at two different site locations in Australia. Growth rates calculated from Eqn. (6.6) based on 2005 – 07 daily sea surface temperatures (secondary y-axis) at Port Lincoln, SA (dotted lines) and Kurnell, NSW (solid lines). SST source: Bureau of Meteorology, Australia. ........................................ 148
Figure A1.1. Initial mean stocking weight (g) and mean weight of handled group over time (+/- se; n = 4). LD = 12, MD = 24 and HD = 48 fish aquaria-1. Tukey-Kramer test on means between densities shown for each sampling period. Means sharing letters are not significantly different (P >0.05). ........................................................................................... 158
Figure A2.1. Theoretical relationship between O2 concentration (mg/l) and % saturation at 10 – 35 oC. ..................................................................... 162
Figure A2.2. Re-saturation rate ............................................................................... 163
Figure A2.3. Re-aeration rate .................................................................................. 163
Figure A2.4. Re-aeration rate change ..................................................................... 164

xix
List of Tables
Table 1.1. Australian aquaculture production of finfish in 2006/07 ....................... 6
Table 1.2. Global sciaenid aquaculture production, 2007. ..................................... 9
Table 2.1. Parameter values used to populate Eqns. (2.1) and (2.2) describing the re-aeration rates of seawater as a function of temperature (10-35 oC) applicable to the system and conditions used in this study. ................. 28
Table 3.1. 2-way ANOVA on MO2rmr-s and MO2rmr-g for all sizes classes. ns = not significant at p<0.05, * = p<0.05, ** = p<0.01, *** = p<0.001 .......... 50
Table 3.2. Summary of RMR MO2 results (mean±se) for XS – XL size mulloway at 14, 20 and 26oC. ANOVA on final BW data analyzed within size class and were significant at p<0.05 but not p<0.01. Means sharing superscript letters are not significantly different (p>0.05) according to Tukey-Kramer test. .............................................................................. 52
Table 3.3. Parameters of the power function y = aMb describing the relationship between body mass and MO2rmr-g or MO2rmr-s for mulloway at each experiment temperature. Data shown for iteratively derived parameters and also for coefficient values when b fixed at 0.8 (MO2rmr-g) or -0.2 (MO2rmr-s). ............................................................................................ 53
Table 3.4. 2-way ANCOVA on MO2 SDA variables for XS, S and M size mulloway with RFI as a significant co-variate. ns = not significant at p<0.05, * = p<0.05, ** = p<0.01, *** = p<0.001. ............................... 55
Table 3.6. Summary of SDA MO2 results (mean±se) for XS, S and M size mulloway at 14, 20 and 26oC. All data analyzed by ANOVA except for MO2sda-p, MO2scope and MO2sda which were analyzed using ANCOVA (RFI as covariate). Means sharing superscript letters are not significantly different (p>0.05) according to Tukey-Kramer test........ 60
Table 4.1. Two-way ANOVA on performance indices and carcass composition (as received basis) for both small and large mulloway. ns = not significant at p<0.05, * = p<0.05, ** = p<0.01 ................................... 78
Table 4.2. Summary of performance indices and carcass composition of small and large mulloway held at 20oC or 26oC. Tukey-Kramer test on means between temperature treatments within each size class. Means sharing superscripts are not significantly different (p>0.05). .............. 81
Table 5.1. Nutrient and ingredient profile of experimental diets (as fed basis). . 101
Table 5.2. 3-way ANOVA on relative feed intake (RFI), feeding efficiency (FE) and protein retention efficiency (PRE). Size = small and large mulloway (ibw ~70g and 200g); Dietary DE level = 16 and 21 MJ kg-

xx
1; Dietary DP level 1 – 4 = 255, 375, 435 or 555 g DP kg-1. ns = not significant at p<0.05, * = p<0.05, ** = p<0.01. ................................ 102
Table 5.3. Summary of performance indices and carcass composition of mulloway. Fish size: Small ~70g ibw; Large ~200g ibw. ................. 105
Table 5.4. 2-way ANCOVA on protein, lipid and energy composition with final body weight (FBW) as the co-variate. Lipid data arcsine transformed. 2-way ANOVA on moisture and ash composition. ns = not significant at p<0.05, * = p<0.05, ** = p<0.01, ***= p<0.001. .......................... 107
Table 6.1. Parameters of the power function y = axb describing the relationship between body mass and protein (g fish-1 day-1) or energy loss (kJ fish-1 day-1) on starvation. ........................................................................... 123
Table 6.2. Summary of parameter values used to populate the factorial model. 126
Table 6.3. Energy and protein requirements for mulloway at 20 and 26oC. ....... 127
Table 6.4. Iteratively derived feed formulations and feeding regimes at 20 and 26 oC. Estimates derived from fixed DP:DE ratios over 4 growth stages; 10-100 g = 31.3 g DP MJ DE-1 , 100-500 g = 24.8 g DP MJ DE-1, 500-1100 g = 20.4 g DP MJ DE-1, 1100-2000 g = 20.4 g DP MJ DE-1. Suggested appropriate diet specifications and feeding regimes shaded in boxes. ............................................................................................. 129
Table 7.1. Parameter sensitivity analysis. Values represent % change in the predicted DP:DE values at 20 oC (Table 6.3) after altering individual model parameter values ±10%. Refer to Table 6.2 for original individual model parameter values. Parameters shown ranked in order of greatest to least influence on predicted DP:DE requirement based on the average (absolute) value over the fish weight range shown. .. 139
Table A1.1. Summary of initial and final data. Initial data are means ±SD. Final data are pooled mean values (±se; n = 8) for each density tested. Tukey-Kramer test on means between densities shown as superscripts. Means sharing superscripts are not significantly different (P >0.05).156
Table A1.2. Two-factor analysis of variance for survival, final weight, final length, condition (K), CV and FE. ns indicates not significant at P < 0.05, * significant at p < 0.05, ** significant at p < 0.01. ............................. 159

xxi
List of Abbreviations ABT Arrhenius breakpoint temperature
BW Body weight
BOD Biochemical oxygen demand
DE Digestible energy
DEm Maintenance digestible energy
DO Dissolved oxygen
DP Digestible protein
DP:DE Ratio of g DP MJ DE-1
ERE Energy retention efficiency
FCR Food conversion ratio
FE Feeding efficiency
GE Gross energy
GMBW Geometric mean body
weight
IBW Initial body weight
kl Partial energy efficiency for
lipid
kp Partial energy efficiency for
protein
LD Lipid deposition
LDO™
Luminescent dissolved oxygen
LE Lipid energy
MBW Metabolic body weight
MO2 Oxygen consumption
MO2rmr-g Gross RMR
MO2rmr-s Mass-specific RMR
MO2scope Post-prandial
metabolic scope
MO2sda Cumulative MO2 above
RMR over the SDA period
MO2sda-d SDA duration
MO2sda-p Peak post-prandial MO2
MO2sda-pd Time to peak post-
prandial MO2
NFE Nitrogen free extract
NSW New South Wales
OT Oxygen transfer
OTR Oxygen transfer rate
PD Protein deposition
PE Protein energy
PRE Protein retention efficiency
PSFI Port Stephens Fisheries
Institute
QLD Queensland
RE Retained energy
RFI Relative feed intake
RMR Routine metabolic rate
SA South Australia
SDA Specific dynamic action
SDAE SDA energy expenditure
SMR Standard metabolic rate
T Temperature
TE Total energy

1
Chapter 1
General Introduction
1.1 A brief overview of global aquaculture production
A total of 143.6 million tonnes of fish (marine fish, freshwater fish,
molluscs, crustaceans etc.) were produced or harvested by the aquaculture and
capture fishery industries in 2006 (FAO 2008). An estimated 110.4 million tonnes
of food-fish were consumed, an average of 16.7 kg per capita, with the remaining
33.2 million tonnes used for non-food purposes such as fishmeal and fish oil.
Almost half of all food-fish consumed are farm raised; 51.7 million tonnes worth
US$78.8 billion (FAO 2008). By far the largest single producer is China with a
reported 34.4 million tonnes, or 66.5% of global aquaculture production. Asia
(excluding China) and the Pacific (22.8 %), Europe (4.2 %) Latin America and the
Caribbean (3.0 %), Africa (1.5 %), North America (1.2 %) and the Near East (0.6
%) account for the remaining major global aquaculture producing regions by
quantity (FAO 2008). Of the total global aquaculture production, freshwater fish (54
%) make up the majority by species group followed by molluscs (29 %) crustaceans
(9 %), diadromous fish (6 %), marine fish (3 %) and other aquatic animals (1 %)
(FAO 2008).
The huge global demand for fish has made aquaculture the fastest growing

2
animal food production sector in the world with an average annual growth rate of
8.8 % worldwide since 1970 (Tacon et al. 2006; Figure 1.1). Population growth,
rising per capita incomes and urbanization are factors fueling the growing global
demand for fish (Brugere and Ridler 2004). Since the mid 1980’s capture fisheries
production has, depending on the source of information, either largely remained
static (FAO 2008) or has been steadily declining (Watson and Pauly 2001; Pauly
2008).
Figure 1.1. Trends in world aquaculture production by major species group. NEI = Not elsewhere included. Source: FAO (2008)
In 2007, 80% of the worlds natural fish stocks were estimated to be fully
exploited (52 %), overexploited (19 %), depleted (8 %), or recovering from a period
of depletion (1 %) (FAO 2008). This indicates that the maximum potential of
capture fisheries from the world’s oceans is limited to around 80 – 100 million
tonnes which was likely reached in the 1970’s or 1980’s (Garcia and Grainger 2005;
FAO 2008). While capture fisheries have reached their potential, increasing global
Year

3
demand for fishery products suggest a greater reliance on aquaculture to supply the
worlds demand for fish protein into the future (Brugere and Ridler 2004). Assuming
capture fisheries production remains constant, and an average per capita
consumption of 16.7 kg, it is estimated that an additional 80.5 million tonnes of fish
will have to be produced by aquaculture to meet the demand of a world population
of 8.3 billion by 2030 (Brugere and Ridler 2004; FAO 2008; UN 2008). If capture
fisheries are in decline (Watson and Pauly 2001; Garcia and Grainger 2005) and
average annual per capita consumption increases (Brugere and Ridler 2004), both
likely scenarios, then the demand on aquaculture production will be even greater.
1.2 Aquaculture in Australia
Aquaculture, as in the rest of the world, is Australia’s fastest growing
primary industry. Aquaculture production in Australia has grown by an average 6 %
p.a. since 1997/98 (Figure 1.2) with production totaling 62,000 tonnes worth
approximately AUS$800 (US$645) million in 2006/07 (O'Sullivan and Savage
2009). In a global context this contributes to approximately 0.12 % of the global
aquaculture production by quantity or 0.82 % by value. While aquaculture is
supplying almost half of the fish consumed in the world (FAO 2008), Australian
production in 2006/07, by comparison, accounted for only 1/4 of the total gross
Australian fisheries production of 240,000 tonnes (ABARE 2008; O'Sullivan and
Savage 2009) indicating the relative infancy of the industry and the current reliance
on capture fisheries in Australia.
4
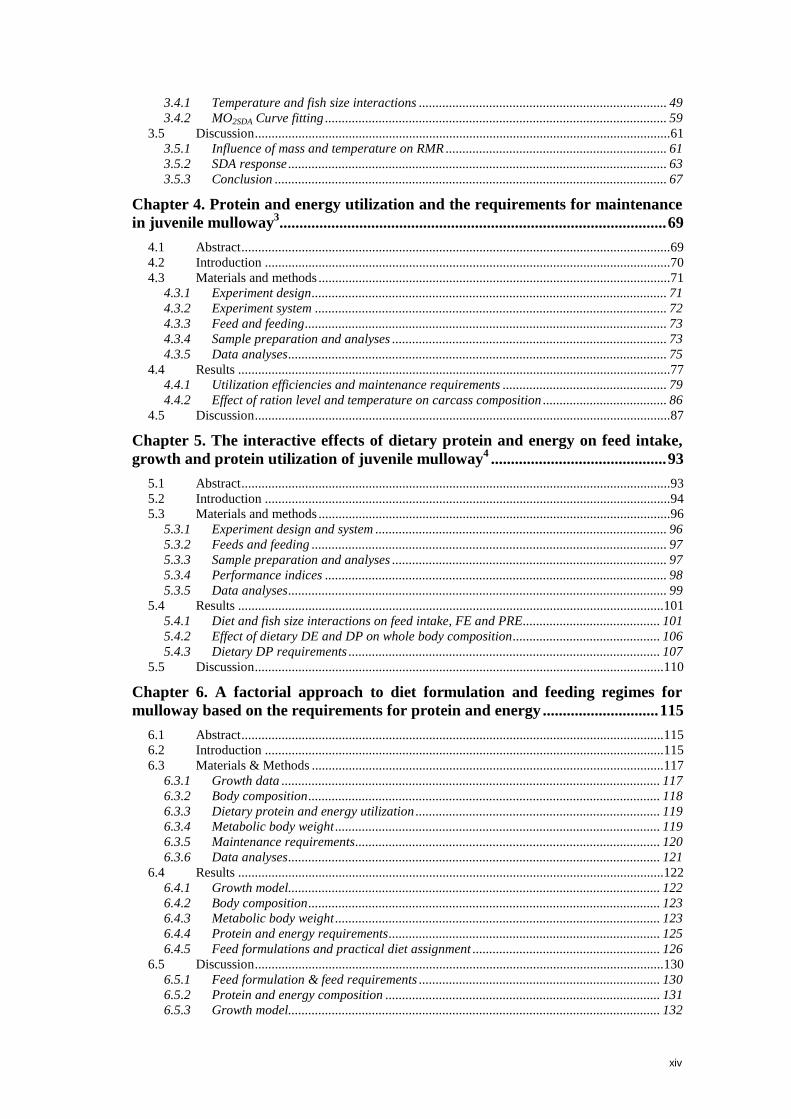
Figure 1.2. Trends in total aquaculture production and value in Australia. Source: O'Sullivan and Savage (2009).
Australia’s aquaculture sector expansion took place relatively recently in the
1990’s, until then the industry was dominated buy the cultivation of edible and pearl
oysters (FAO 1997). The expansion in the 1990’s was underpinned by innovation in
southern bluefin tuna farming, growth in existing industries (including pearling,
edible oyster, prawn and salmonid aquaculture) and significant development in
other new industries (such as barramundi, abalone, silver perch, mulloway and
yellowtail kingfish) (Gibson et al. 2005; Dundas-Smith and Huggan 2006). Finfish
are now the key aquaculture production group in Australia in terms of both volume
(62 %) and value (AUD$478.6 million) (Figure 1.3, Table 1.1). Southern bluefin
tuna (South Australia), Atlantic salmon (Tasmania) and barramundi (all mainland
states and Northern Territory) are the three main commercial finfish species
cultured on a large scale (Table 1.1). Between 2002 and 2007, the volume and value
of farmed salmonid sea-cage production in the state of Tasmania increased by
10,000 tonnes and AUD$154 million where now farmed salmonids have emerged

5
as the key production species, surpassing tuna as Australia’s most valuable species
group (ABARE 2008). Recent expansion of sea-cage production of yellowtail
kingfish and mulloway in South Australia has also seen increased growth in that
industry sector (ABARE 2008; O'Sullivan and Savage 2009).
Tuna 12.5%
Crustaceans6.0%
Barramundi4.3%
Other3.5%
Molluscs30.0%
Salmonids42.3%
Silver perch0.5%
Other finfish0.8%
Figure 1.3. Australian aquaculture production by quantity 2006/07. “Other” includes aquaculture production not elsewhere specified due to confidentiality restrictions. In Victoria, this includes abalone, warm water finfish, ornamental fish, other shellfish, shrimps and aquatic worms. Data adapted from ABARE (2008).

6
Table 1.1. Australian aquaculture production of finfish in 2006/07
Common name Scientific name
Production (tonnes)
Value (AUD$;000)
Atlantic salmon Salmo salar 22,703.8 $266,629.9 Southern bluefin tuna Thunnus maccoyii 7,588.0 $137,650.0 Barramundi Lates calcarifer 3,037.7 $26,881.0 Rainbow trout (f/w) Oncorhynchus mykiss 1,990.1 $12,951.3 Yellowtail kingfish Seriola lalandi 1,355.0 $11,178.8 Mulloway Argyrosomus japonicus 607.7 $4,877.0 Rainbow trout (s/w) Oncorhynchus mykiss 500.5 $3,903.3 Silver perch Bidyanus bidyanus 400.0 $4,253.1 Short finned eelsb Anguilla australis 183.6 $2,743.3 Murray coda Maccullochella peelii 99.2 $1,768.8 Brown trout Salmo trutta 78.0 $438.5 Barcoo grunter Scortum barcoo 51.2 $153.6 Golden perch Macquaria ambigua 7.3 $466.9 Long finned eelsb Anguilla reinhardtii 5.2 $54.5 Australian bass Macquaria novemaculeata 2.0 $384.1 Sleepy cod Oxyeleotris lineolata 1.0 $24.0 Chinook salmon Oncorhynchus tshawytscha 0.0 $18.0 Eel-tailed catfish Plotosus lineatus 0.0 $16.4 Trout cod Maccullochella macquariensis 0.0 $10.0 Seahorses 0.0 $48.0 Misc. marinec 0.0 $5.4 Native aquarium fish 0.0 $936.5 Exotic aquarium fish 0.0 $2,934.5
TOTAL 38,610.3 $478,326.9 aIncludes some data for Mary River cod and sleepy cod, no production for Eastern freshwater cod. bIn QLD and Vic. longfin eels are grouped with shortfin eels. cMay include sand whiting, tarwhine, snapper, black bream, Australian salmon, Australian herring, silver bream and scad. Data adapted from O'Sullivan and Savage (2009).
Five of Australia’s most valuable aquaculture species groups accounted for
almost 90 % of the total gross value of aquaculture production in 2006/07. These
were salmonids (AUD$283.9 million), pearl oysters (AUD$142.3 million), southern
bluefin tuna (AUD$137.6 million), edible oysters (AUD$86.5 million) and prawns
(AUD$47.3 million) (ABARE 2008). By comparison with global aquaculture
production predominated by the cultivation of freshwater finfish, approximately 95
% of Australia’s aquaculture is of marine species (ABARE 2008; FAO 2008).
7
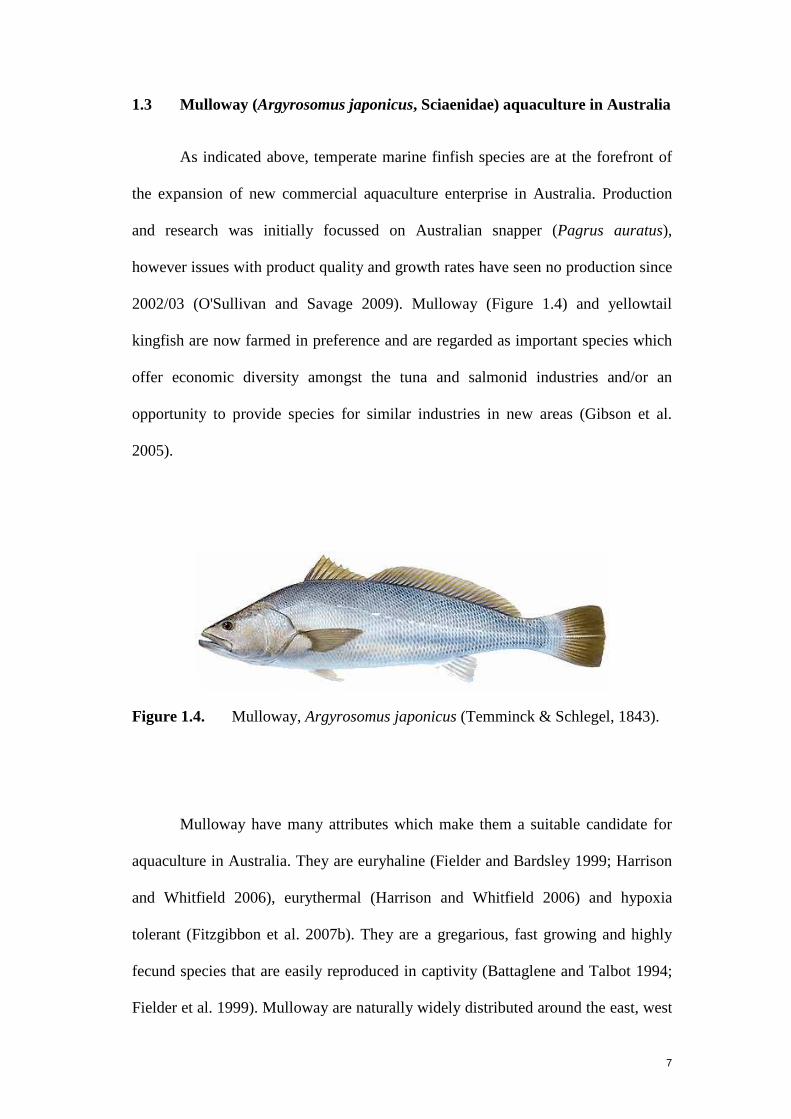
1.3 Mulloway (Argyrosomus japonicus, Sciaenidae) aquaculture in Australia
As indicated above, temperate marine finfish species are at the forefront of
the expansion of new commercial aquaculture enterprise in Australia. Production
and research was initially focussed on Australian snapper (Pagrus auratus),
however issues with product quality and growth rates have seen no production since
2002/03 (O'Sullivan and Savage 2009). Mulloway (Figure 1.4) and yellowtail
kingfish are now farmed in preference and are regarded as important species which
offer economic diversity amongst the tuna and salmonid industries and/or an
opportunity to provide species for similar industries in new areas (Gibson et al.
2005).
Figure 1.4. Mulloway, Argyrosomus japonicus (Temminck & Schlegel, 1843).
Mulloway have many attributes which make them a suitable candidate for
aquaculture in Australia. They are euryhaline (Fielder and Bardsley 1999; Harrison
and Whitfield 2006), eurythermal (Harrison and Whitfield 2006) and hypoxia
tolerant (Fitzgibbon et al. 2007b). They are a gregarious, fast growing and highly
fecund species that are easily reproduced in captivity (Battaglene and Talbot 1994;
Fielder et al. 1999). Mulloway are naturally widely distributed around the east, west
8
and southern seaboards of Australia (Kailola et al. 1993; Silberschneider and Gray
2008) and can be grown successfully in different culture systems including sea
cages, ponds and recirculating aquaculture systems (Quartararo 1996; Fielder et al.
1999; O'Sullivan and Ryan 2001; Doroudi et al. 2006).
Aquaculture of mulloway is relatively new in Australia, beginning in the
mid 1990’s (Gooley et al. 2000) after being successfully produced under hatchery
conditions in 1992 (Battaglene and Talbot 1994). Although the mulloway
aquaculture industry is in its relative infancy, there has been a steady increase in
production in recent years. A number of farms in NSW and SA are now producing
small commercial quantities with production of mulloway in 2006/07 of over 600
tonnes for a mainly domestic market valued at approximately AUD$4.9 million
(O'Sullivan and Savage 2009; Table 1.1). In a global context, production of
sciaenids in 2007 was over 115,000 tonnes valued at over USD$156 million. Over
95 % by volume and 80 % by value was produced by China; although China had the
lowest farm-gate price of approximately USD$1.18 / kg. In comparison, meagre
from Portugal fetched the highest prices of USD$15.60 / kg while Australian
mulloway fetched a median price of USD$6.36 / kg (Table 1.2). In terms of both
global production volume and value, Australia’s sciaenid production is third behind
China and the USA (FAO 2008; O'Sullivan and Savage 2009; Table 1.2).

9
Table 1.2. Global sciaenid aquaculture production, 2007.
Production Value Region Country Common name Scientific name (tonnes) (USD$;000) Africa Mauritius Red drum Sciaenops ocellatus 550 $3,167.0 Mayotte Red drum Sciaenops ocellatus 122 $959.8 Americas Mexico Freshwater drum Aplodinotus grunniens 70 $147.0 USA Red drum Sciaenops ocellatus 1,814 $9,596.1 Asia China Large yellow croaker Larimichthys croceus 61,844 $72,975.9 China Red drum Sciaenops ocellatus 49,291 $58,163.4 Israel Red drum Sciaenops ocellatus 400 $1,380.0 Saudi Arabia Croakers, drums nei* Sciaenidae 5 $25.0 Taiwan Croakers, drums nei* Sciaenidae 23 $173.6 Europe France Meagre Argyrosomus regius 282 $2,705.6 Italy Meagre Argyrosomus regius 192 $1,789.5 Portugal Meagre Argyrosomus regius 25 $389.9 Spain Meagre Argyrosomus regius 251 $1,004.0 Oceania Australia Mulloway Argyrosomus japonicus 607.7 $3,867.5
TOTAL 115,477 $156,344.3 Data adapted from FAO (http://www.fao.org/fishery/statistics/global-aquaculture-production/query/en). Original FAO data excluding mulloway production figures. Mulloway data adapted from O'Sullivan and Savage (2009) and AUD$0.793 (http://www.xe.com/; June 2009). *not elsewhere indicated
1.4 Need for research
The commercial viability of any aquaculture venture hinges on the
successful development and integration of brood-stock management, hatchery,
nursery and grow-out technologies and a good understanding of the basic nutritional
requirements of the species (Gibson et al. 2005). Marine fish farmers and feed
manufacturers alike need to implement management decisions based on biological
data obtained from rigorous experimental design to ensure economic performance
and environmental sustainability. One key area which currently restricts the
development of the mulloway industry in Australia is a lack of knowledge of the
nutritional requirements of the species. To date there is no published information on
the requirements for digestible protein (DP) and digestible energy (DE) for

10
mulloway and, as a consequence, no specific diet formulations or feeding standards
are available.
As a carnivorous species it is expected that mulloway will have a high
requirement for DP and this is reflected in the current practice by industry of
feeding commercial diets formulated for other carnivorous species such as
barramundi, Atlantic salmon or more generic ‘marine fish’ formulations. Growth
rates have been reasonable; however, these diets may not be optimal as it is not
uncommon for food conversion ratio’s (intake/gain) in excess of 1.5 to be reported.
Significant reduction of production costs can be achieved if feed formulations and
feeding strategies are optimised. Feed is the primary source of waste output from
aquaculture operations with phosphorus and nitrogen the major elements of
concern. Excessive waste outputs can significantly impact on the environment
which, in turn, has direct socio-economic ramifications and influences negative
public perception of the industry (Burbridge et al. 2001; Ridler et al. 2007).
Reduction of waste outputs from marine fish culture operations can be achieved by
optimising nutrient utilisation through better diet formulation and implementing
more efficient feeding strategies (Kaushik 1998; Cho and Bureau 2001).
1.5 Digestibility and utilisation of feeds
The nutritional value of a feed is not solely based on its chemical
composition but also on the amount of nutrients and energy that can be absorbed
and used; the digestibility being the difference between the amount of nutrient taken
in and that excreted as faeces (NRC 1993). Determining the digestibility of feeds
and ingredients is important as it indicates the availability of nutrients to the animal.

11
The daily requirements for maintenance and growth can then be described in terms
of DP and DE and diets can be formulated on a digestible rather than gross nutrient
basis (NRC 1993; Houlihan et al. 2001; Bureau et al. 2002).
It is important to note that digestibility is not a measure of nutrient
utilization but an indication of the potential availability of energy and nutrients
through the digestive process (NRC 1993; Bureau et al. 2002). The utilization of DP
and DE is dependant on the composition of the diet and the efficiency with which
tissue deposition (growth) occurs (van Milgen and Noblet 2003; Schroeder and
Titgemeyer 2008). Modern commercial aquaculture farming practices demand the
efficient conversion of feeds into the production of body tissue (usually protein
deposition) to maximise economic returns and environmental sustainability.
However, to achieve this, a detailed understanding of the relationships between
nutrient intake, tissue deposition and body composition is needed. Patterns of
protein deposition with increasing levels of DP intake can vary considerably
between species, diet and environmental conditions. Responses in fish can be linear
(Lupatsch et al. 2001a; Fournier et al. 2002; Lupatsch and Kissil 2005; Peres and
Oliva-Teles 2005) or curvilinear (Huisman et al. 1979; McGoogan and Gatlin 1998;
Watanabe et al. 2000b; Bureau et al. 2006) indicating that utilization efficiencies are
either constant or tend to plateau with increasing protein intake. Understanding how
growth is affected by the nutrient intake level is important in optimizing feeding
strategies for aquaculture species. A curvilinear response indicates that restrictive
feeding will optimise feeding efficiencies while supporting rapid growth, conversely
a linear response indicates that satiated feeding is required to achieve maximum
growth and feeding efficiencies. As the costs of aquafeeds represent the greatest
proportion of costs in fish production, getting the feeding strategy wrong can result

12
in significant loss of revenue through either excessive feed wastage and/or
undesirable body conditioning, or delayed production cycle turnover.
1.6 Bioenergetic approach to practical feed evaluation systems
Nutrient requirements in fish have traditionally been determined empirically
using a dose-response approach, typically with weight gain or nutrient retention
expressed as the response criteria and the relationship analysed using linear or non-
linear regression. Evaluating diets by testing all combinations of nutrient inclusion
levels against various response criteria and under various culture conditions will
undoubtedly yield the most accurate definitions; however, this approach is neither
cost effective nor practical to implement. Mathematical modelling in animal
nutrition provides an extremely useful tool in the development of practical feed
evaluation systems (i.e. feeding standards and practices) to describe and predict
nutrient requirements, body composition and growth of the animal (Cho 1992;
Dijkstra et al. 2007). Bioenergetics is the quantitative study of energy gains, losses
and transfers within the whole organism based on thermodynamic principles
(Jobling 1994; Haynie 2001; Bureau et al. 2002), and has been widely applied to
animal nutrition and the development of feed evaluation systems over the past
several decades (Brody 1945; Kleiber 1961; Cho et al. 1982; Bureau et al. 2002;
Dumas et al. 2008).
Traditional bioenergetic systems are factorial; i.e. total energy requirements
are calculated as the sum of energy required for maintenance, activity, growth,
reproduction etc. (Baldwin and Sainz 1995). The partitioning and quantification of
dietary energy is important in the study of nutritional energetics because it provides
13
a convenient platform to predict the energy balance of individuals based on body
weight, sex, activity, physiological state, environment, and amount and nutritive
value of the feed eaten (Baldwin and Bywater 1984). This information can then
form the basis for practical diet formulation and evaluation (Baldwin and Bywater
1984; Bureau et al. 2002). It is important to recognise that the factorial method is
empirical in form; models based on the digestion, metabolism and utilisation of
nutrients need to be considered in the context of relevant culture conditions to
accurately predict growth and feed requirements. Validation against independent
feeding trials will determine the predictive accuracy of the models and assess the
need for adjustment of the input data defining the model parameters.
It is recognised that the bioenergetic approach has its limitations; most
notably the presumption of additivity of functions (factors) without interaction
(Baldwin and Sainz 1995) and the fact that animals continue to deposit protein
while losing lipids when fed maintenance levels of DE (Bureau et al. 2002; van
Milgen and Noblet 2003; Sandberg et al. 2005a). There are indications that some
bioenergetic models have not been well evaluated over the ranges of conditions to
which they have been applied (Bajer et al. 2004), although this seems to indicate
issues with the application of the models rather than the principles and fundamental
concepts of bioenergetic theory. Bioenergetic models can therefore be regarded as
relatively inflexible in their adaptability (Bureau et al. 2002) which is, in part, an
artefact of the empirically derived nature of the sub-models. The adequacy of some
feed evaluation systems has also been questioned as they are devised to meet animal
requirements rather than predict animal response, which has seen a shift (back)
towards nutrient-based mechanistic models to meet modern animal production
demands (Dijkstra et al. 2007; Dumas et al. 2008). However, some mechanistic

14
models, while being theoretically correct, may be considered too complex for
implementation in practical feed evaluation systems (Bureau et al. 2002).
In spite of the limitations noted above, the factorial approach remains a very
useful and practical method in constructing feed evaluation systems. Several models
have been successfully developed to predict growth, feed requirements and feed
efficiencies in a number of fish species using these principles (Cho and Bureau
1998; Lupatsch et al. 1998; Lupatsch et al. 2001a; Lupatsch and Kissil 2005; Zhou
et al. 2005; Glencross 2008). Factorial models based on bioenergetic principles
which also integrate a nutrient-based approach have the greatest flexibility and can
be adapted to formulate feeds based on specific nutrient requirements (e.g. Lupatsch
et al. 1998) or predict waste outputs of inorganic compounds (e.g. Hua et al. 2008).
Furthermore, these types of “hybrid” models (sensu Dumas et al. 2008) can provide
greater and more relevant application in the context of commercial production when
calibrated using on-farm data (e.g. Bureau et al. 2003; Lupatsch et al. 2003a;
Glencross 2008).
1.7 This thesis
The work presented in this thesis forms part of the New South Wales
Department of Primary Industries (NSW DPI), Port Stephens Fisheries Institute
current research program “Feed Technology for Temperate Marine Fish Species”
FRDC Project No. 2004/220, funded by the Fisheries Research and Development
Corporation (FRDC) and the Aquafin Cooperative Research Centre (Aquafin CRC).
Chapters 2, 3, 4, 5 and Appendix 1 are unabridged versions of the manuscripts
15
published in international peer-reviewed journals which have been re-formatted for
this thesis.
The general aim of this thesis was to establish a practical feed evaluation
system for mulloway based on the factorial approach. This was achieved by
conducting a series of interrelated studies which determined the requirements for
DP and DE for maintenance and growth and described aspects of metabolism
relating to the fasting and feeding physiology of this species.
Mulloway have a strong shoaling instinct, particularly as juveniles, and are
easily startled in culture systems. Therefore, a pilot study (Appendix 1) was
initially carried out to identify appropriate stocking densities which would assist in
mitigating the potential for adverse density dependent behavioural effects in the
subsequent feeding and metabolic studies. Chapter 2 investigated the fasting
routine metabolic rates (RMR) of mulloway and yellowtail kingfish and provided
the opportunity to compare the metabolic responses of a sedentary (mulloway) and a
highly active species (yellowtail kingfish) over a broad range of temperatures. The
results of this experiment also provided insight into the appropriate temperature at
which to culture these species. Chapter 3 builds on the results established in
Chapter 2 by also testing the effect of body weight on the RMR and postprandial
metabolic response in mulloway over a range of temperatures. Chapter 4 further
investigates the feeding physiology of mulloway by describing responses of body
gain and composition to varying feed intake levels. DP and DE utilization
efficiencies and the requirements for maintenance were established based on the
patterns of protein and energy deposition as a function of DP and DE intake
respectively. The interactive effects of DP and DE on the feed intake, growth and
body composition of mulloway were investigated in Chapter 5 using a classic dose-

16
response approach. This study identified the optimal DP content and DP:DE ratio
for mulloway. The results in this study also served to validate estimations made
using the factorial method in the following chapter. Chapter 6 consolidates the
results of the previous experiment chapters to establish a feed evaluation system for
mulloway based on the requirements for DP and DE. A factorial approach was used
to estimate the requirements for DP and DE for mulloway throughout the
production cycle and diet formulations and feeding regimes were then iteratively
derived. The overall results from this thesis are discussed and the main conclusions
are presented in Chapter 7. Chapter 7 also presents a sensitivity analysis of the
individual parameters used to populate the mathematical sub-models which form the
framework of the factorial model.
The specific objectives of this thesis were to:
1. identify the effects of stocking density on the growth of mulloway
2. describe and compare the RMR of mulloway and yellowtail kingfish as a
function of temperature
3. describe the influence of body mass and temperature on the RMR and
specific dynamic action (SDA) of mulloway
4. determine i) the protein and energy utilization responses in mulloway to
increasing DE and DP intake, ii) the efficiencies of DP and DE utilization,
and iii) the DP and DE maintenance requirements of mulloway
5. i) describe the interactive effects of varying DP and DE content on feed
intake, growth, protein utilization and whole body composition of mulloway,
ii) determine the optimal DP content for mulloway and iii) to determine the
optimal DP:DE ratio for growth.

17
6. describe the requirements for DP and DE for mulloway throughout the
production cycle using the factorial method and to derive diet formulations
and feeding regimes based on the requirements for protein and energy.

18
Chapter 2
The Routine Metabolic Rate of Mulloway and Yellowtail Kingfish
Acclimated to Six Different Temperatures1
1The following chapter is published as:
Pirozzi, I., Booth, M.A., 2009. The routine metabolic rate of mulloway (Argyrosomus japonicus: Sciaenidae) and yellowtail kingfish (Seriola lalandi: Carangidae) acclimated to six different temperatures. Comp. Biochem. Physiol. A-Mol. Integr. Physiol. 152, 586-592.
2.1 Abstract
This study compared the mass-specific routine metabolic rate (RMR) of similar
sized mulloway (Argyrosomus japonicus), a sedentary species, and yellowtail
kingfish (Seriola lalandi), a highly active species, acclimated at one of several
temperatures ranging from 10 – 35 oC. Respirometry was carried out in an open-top
static system and RMR corrected for seawater-atmosphere O2 exchange using mass-
balance equations. For both species RMR increased linearly with increasing
temperature (T). RMR for mulloway was 5.78T - 29.0 mg O2 kg-0.8 h-1 and for
yellowtail kingfish was 12.11T -39.40 mg O2 kg-0.8 h-1. The factorial difference in
RMR between mulloway and yellowtail kingfish ranged from 2.8 to 2.2 depending
on temperature. The energetic cost of routine activity can be described as a function
of temperature for mulloway as 1.93T – 9.68 kJ kg-0.8 day-1 and for yellowtail
kingfish as 4.04T – 13.14 kJ kg-0.8 day-1. Over the full range of temperatures tested
Q10 values were approximately 2 for both species while Q10 responses at each
temperature increment varied considerably with mulloway and yellowtail kingfish
displaying thermosensitivities indicative of each species respective niche habitat.

19
RMR for mulloway was least thermally dependent at 28.5 oC and for yellowtail
kingfish at 22.8oC. Activation energies (Ea) calculated from Arrhenius plots were
not significantly different between mulloway (47.6 kJ mol-1) and yellowtail kingfish
(44.1 kJ mol-1).
2.2 Introduction
Mulloway (Argyrosomus japonicus) and yellowtail kingfish (Seriola
lalandi) are marine carnivores that are important food species and highly sort after
sport fish. They are both important aquaculture species in Australia and are cultured
in sea cage or on-shore recirculation systems. While both species sometimes
naturally co-occur each occupy distinct niche habitats. Mulloway are found in
estuarine, near-shore waters and surf zones (Griffiths 1996; Griffiths 1997;
Silberschneider and Gray 2008). Yellowtail kingfish are a schooling pelagic species
with a circumglobal distribution and are found in both near-shore and off-shore
waters (Kailola et al. 1993). In Australia both species are similarly distributed
around the eastern and southern seaboards although yellowtail kingfish are also
found in cooler temperate waters of the Bass Strait and Tasmania while mulloway
are also found in the warmer temperate waters to the North West Cape of Western
Australian (Kailola et al. 1993). Both species possess distinct physiological and
morphological characteristics adapted to exploit their respective niche
environments. Mulloway are a relatively sedentary species (Silberschneider and
Gray 2008) that are euryhaline (Fielder and Bardsley 1999; Harrison and Whitfield
2006), eurythermal (Harrison and Whitfield 2006), hypoxia tolerant (Fitzgibbon et
al. 2007b) and have a low aerobic capacity similar to rainbow trout and Atlantic cod

20
(Bushnell et al. 1984; Schurmann and Steffensen 1997; Fitzgibbon et al. 2007b). In
contrast, yellowtail kingfish are a high-performance high-energy-demand species
which share many of the specialized morphological adaptations of the tunas (Dewar
and Graham 1994; Clark and Seymour 2006) and have an aerobic metabolic scope
similar to that of other highly active teleost species such as salmon (Clark and
Seymour 2006).
Metabolism reflects the uptake, transformation and allocation of energy and
materials for maintenance, growth and reproduction; the rate at which this occurs
determines the pace of an organism’s life (Brown et al. 2004). Metabolic theory
links metabolic rate on a broad scale to the ecology of populations and ecosystem
processes (Brown et al. 2004; van der Meer 2006) while at the organismal level life
history traits such as development time (Finn et al. 2002; Gillooly et al. 2002),
mortality rate (Brown et al. 2004) and reproductive rate (Savage et al. 2004a) can
also be predicted (Brown et al. 2004). An individual’s metabolic rate is
predominately a function of its mass (Schmidt-Nielsen 1975; West et al. 2002) but
will also vary considerably depending on its activity level (Boisclair and Tang
1993), health (Barton 1997) and nutritional status (Jobling 1982). Temperature is
one of the most important extrinsic factors influencing metabolic rate in ectotherms,
directly governing the speed at which biochemical and physiological processes
proceed (Clarke and Johnston 1999; Hochachka and Somero 2002) as well as
having a direct influence on activity (Jobling 1982). The relationship between
temperature and metabolic rate is strongly linked to the temperature dependence of
enzymatic reactions (Hochachka and Somero 2002).
Respiration rate, measured in terms of oxygen consumption (MO2), is an
accurate proxy for metabolic rate (Withers 1992). Deriving an organism's metabolic

21
rate in this way is useful as it firstly provides a direct measure of the animals
requirement for oxygen, information which is critical for the culture of any aquatic
species and secondly, it allows indirect estimations of the requirements for energy
(Elliott and Davison 1975). Metabolic rates of mulloway and yellowtail kingfish
have been measured previously; however only at a single temperature for mulloway
(22 °C; Fitzgibbon et al. 2007b) and over a small temperature range for yellowtail
kingfish (20-25 °C; Clark and Seymour 2006). Those studies showed that the
standard metabolic rate (SMR) of mulloway and yellowtail kingfish, scaled for body
weight and temperature, were similar (Clark and Seymour 2006; Fitzgibbon et al.
2007b).
In this study, we examine the influence of a wide range of temperatures on
the routine metabolic rate (RMR) of mulloway and yellowtail kingfish where RMR
reflects the MO2 during routine activity and spontaneous movement of unfed, but
not starving fish (Fry 1957; Beamish 1964). The overall objectives were twofold;
firstly to validate an open-top respirometry system and secondly, to describe the
RMR of mulloway and yellowtail kingfish as a function of temperature. As
biogeographic patterns of distribution and abundance are closely linked to the
temperature-adaptive physiology of ectotherms (Hochachka and Somero 2002;
Somero 2005), we hypothesize that the RMR of mulloway and yellowtail kingfish
will closely reflect those characteristics noted above; i.e. relative to yellowtail
kingfish, mulloway will 1) have a lower RMR 2) show a reduced thermosensitivity
response to different acclimation temperatures and 3) exhibit a higher temperature
at which RMR is least thermally dependant.

22
2.3 Materials and methods
2.3.1 Respirometry validation
MO2 readings used to calculate the metabolic rates of mulloway and
yellowtail kingfish in this study were measured in an open-top system; i.e. the
surface water was exposed to the atmosphere. Therefore, O2 transfer coefficients at
each temperature treatment were established in a separate trial to account for
atmospheric transfer of O2 into seawater at sea level (1013 hPa). This was achieved
by depleting DO levels down to 60% saturation using nitrogen gas and measuring
the rate of increase to resaturation. Duplicate 200 l experiment tanks (dimensions:
top diameter = 78 cm; bottom diameter = 68 cm; height = 55 cm) were placed in the
sumps (fiberglass tanks 2.7 x 1.2 x 0.6 m) of each recirculation system (described
below) which acted as water baths maintaining constant temperatures. Inside tank
surfaces were scrubbed down and disinfected with sodium hypochlorite (NaOCl)
before the start of each temperature reaeration trial, rinsed and refilled with
seawater which had also been treated with NaOCl and neutralized with sodium
thiosulphate (Na2S2O3). A small submersible aquarium pump (flow rate
approximately 5 l min-1) was placed at the bottom of each 200 l tank and positioned
to create a small turbulent flow to mimic fish movement in the tanks; initial DO
readings taken at the near-surface, middle and bottom of tanks were virtually
identical indicating complete mixing. DO Readings for each temperature trial were
taken at intervals of approximately 0, 1, 6, 18 and then every 24 h up to10 d or until
resaturation was achieved.

23
2.3.2 RMR experiment design and fish handling
The mass-specific routine metabolic rate (RMR; mg O2 kg-0.8 h-1) was
established at 6 temperatures for mulloway (10, 15, 20, 25, 30 or 35 oC) and
yellowtail kingfish (10, 15, 20, 25, 30 or 32.5 oC). Fish were F1 juveniles of wild
caught broodstock held at the New South Wales Department of Primary Industries,
Port Stephens Fisheries Institute (PSFI).
Eight mulloway (181.8±4.4 g; mean±SD) or 5 yellowtail kingfish
(206.0±7.0 g) were stocked in triplicate groups into 200 l tanks for each of the 6
temperature treatments with each tank constituting an experimental unit. The
recirculation system supplying the tanks was split into two independent banks with
one bank designated as cool water (10 – 20 oC) while the other designated as warm
water (25 – 35 oC). Fish were initially stocked at ambient water temperature (23 oC)
then, depending on which system they were assigned, adjusted up or down to
specific temperature treatments in increments of 1oC day-1, which is in excess of the
1oC h-1 required for complete temperature acclimation in ectotherms (Mora and
Maya 2006) . Fish were held for one week at that temperature before MO2 readings
were taken using a Luminescent Dissolved Oxygen (LDO™) meter (model HQ30d-
LDO101-03; Hach Company, Loveland, CO, USA) which was calibrated at each
temperature treatment according to manufacturers instructions. The temperature for
each unit was controlled with a chiller and immersion heater operating in an
antagonistic mode which allowed precise temperature control of ±0.5 oC of the set
temperature. Constant water flow (360 l h-1) and air was supplied to all tanks when
MO2 was not being recorded. 100% medical grade O2 was injected into the main
water supply manifold for the high temperature treatments (30 and 35 oC). After fish
were initially stocked PVC tubes 300 mm long and 32 mm diameter perforated with
24
10 mm holes were positioned vertically down from the centre surface of each tank
to act as sleeves through which the LDO probe could be introduced discretely into
tanks without disturbing the fish. Black plastic sheets were also placed across the
front top half of tanks to prevent disturbance to fish from the presence of workers
taking MO2 readings.
A power failure occurred over night during the acclimatization period from
33 to 34 oC resulting in the loss of 37.5 % of the mulloway and 100% of the
yellowtail kingfish from the warm water system. Mortalities were likely due to low
DO levels. There was 100 % survival of both mulloway and yellowtail kingfish in
the corresponding cool water system (12 to 11 oC). Both species were restocked for
the warm water treatment group at ambient temperatures (26 oC) and re-acclimated
following the above protocols. No further mortalities occurred. Some yellowtail
kingfish were previously observed to regurgitate food at 33 oC; therefore it was
decided upon restocking to end MO2 readings at 32.5 oC for that species.
Water quality parameters were consistent between systems and pH (7.93 –
8.16), NH4+ (<0.1 mg l-1) and salinity (33.4 – 35.0 ppt) were monitored regularly.
All fish were fed a maintenance ration once daily of a commercial diet (Ridley
AquaFeed Pty. Ltd., Narangba, Qld. Australia; 45.5 % crude protein, 18.7 % crude
fat, 22.2 MJ kg-1 gross energy). All fish were fasted for 48 h prior to MO2 readings
to ensure MO2 readings were not confounded due to post-prandial effects (refer to
Chapter 3).
2.3.3 MO2
MO2 was established by measuring the decrease of DO in standing water

25
over approximately 1 hourly intervals. Measurements were repeated three times
over several hours for each replicate tank and the mean used to calculate RMR. For
all MO2 trials DO levels were at or near saturation at start readings and always
remained above 60 % after 1 h. After each end reading water flow was re-
established for approximately 1 h to flush tanks of metabolites and return DO to
saturated levels. Each temperature treatment group was independent and fish were
removed from the system and re-weighed after completion of MO2 readings for that
particular temperature and species group. Background biochemical oxygen demand
(BOD) was then determined for each replicate tank after fish were removed and
water re-saturated with O2.
2.3.4 Data analyses
2.3.4.1 Atmosphere-seawater oxygen transfer
Predicted rates of reaeration were derived by first establishing the
relationship between O2 saturation (%) and O2 concentration (mg l-1) at temperature
(T) according to the linear relationship of the coefficients when x and y-intercepts =
0 (r2=0.998) (Figure A2.1). Equivalent oxygen concentrations (mg l-1) could then be
established for Top (100 %) and Bottom (60 %) saturation levels at any temperature
(T) (Figure A2.2). O2 transfer (OT; mg l-1) (Figure A2.3) and O2 transfer rates
(OTR; mg l-1 h-1) (Figure A2.4), applicable to the system and conditions used in the
current study, can be described by the exponential associations:
OT = ))exp(1()BottomTop(Bottom tk ×−−×−+ (2.1)
26
Where Bottom = O2 concentration (mg l-1) at 60% saturation at temperature T; Top
= O2 concentration (mg l-1) at 100 % saturation at temperature T; k = rate constant; t
= time (h)
OTR = Bottom))exp(Bottom)-(Top +×−× tk (2.2)
Where Top = max. OTR (mg l-1 h-1) at temperature T when t = 0; Bottom = 0
(saturated; fixed); k = rate constant; t = time (h)
Rate constants were described as a function of temperature according to the
linear relationship of k (y-axis) and T (x-axis) for OT (when x and y-intercepts = 0;
r2 = 0.98) and also for OTR (y-intercept ≠ 0; r2 = 0.78). By solving for t in equation
1 at a known OT value (geometric mean of beginning and end reading) the OTR
could then be derived at any point of the O2 gradient between 60-100% saturation
and for any temperature between 10-35oC.
2.3.4.2 Metabolic indices
References to temperature (T) are in oC unless otherwise stated where
temperature is absolute temperature in oK. Mass-specific data are scaled using the
metabolic body weight exponent of 0.8 (Brett and Groves 1979). Once OTR and
background BOD were established the mass-specific RMR for each species at each
temperature could then be calculated as:
RMR (mg kg-0.8 h-1) = )OOO()n/BW/V( 2bod2otr2 +−× ∆ (2.3)

27
Where V = tank water volume (l); BW = mean body weight (kg-0.8); n = number of
fish tank-1; ∆O2 = net change in O2 concentration (mg l-1 h-1) inclusive of fish
respiration, atmospheric re-aeration and background BOD; O2otr = atmospheric OTR
(mg l-1 h-1); O2bod = background BOD rate (mg l-1 h-1)
Interspecific differences in the relationship between RMR and temperature
were analyzed using linear regression. ANCOVA was used to compare slopes and
elevations (Motulsky and Christopoulos 2003). Factorial difference was calculated
as RMRyellowtail kingfish / RMRmulloway. All results were regarded as significant at
p<0.05. Data are presented as mean ± standard error.
Kinetic function was indexed by the effects of temperature on the apparent
activation energy (Ea) of each species with Ea determined directly from the slope of
Arrhenius plots using the equation (Kotz and Treichel 1996):
RslopeE ×−=a (2.4)
Where slope = )/1(/ln ΚΔΔ RMR , K is absolute temperature (oK) and R is
the universal gas constant (8.3145 x 10⁻³ J mol-1 K-1). Slope discontinuities in
Arrhenius plots can indicate perturbations in the underlying rate process and are
identified at the Arrhenius breakpoint temperature (ABT) (Hochachka and Somero
2002). ABT’s were not detected for either species i.e. respiration rates did not fall at
high temperatures, however the temperature sensitivity of RMR was described by
applying nonlinear regression to temperature quotient (Q10) values plotted as a
function of the geometric mean temperature (oC) with the asymptote describing the

28
temperature which has the minimum influence on RMR with respect to a 10oC shift
in temperature. Q10 values were established at each temperature interval using the
equation:
Q10 = )/(1012
12)/( TTKK − (2.5)
Where K1 and K2 are the RMR values at temperatures T1 and T2 respectively.
Table 2.1. Parameter values used to populate Eqns. (2.1) and (2.2) describing the re-aeration rates of seawater as a function of temperature (10-35 oC) applicable to the system and conditions used in this study.
Parameter OT (mg l-1) OTR (mg l-1 h-1)
k 0.0014T 0098.00009.0 +T
Top 6963.3)0371.0exp(2377.8 +−× T 0.0036T
Bottom 2106.2)0369.0exp(9389.4 +−× T 0
2.4 Results
2.4.1 Respirometer validation
Table 2.1 describes the theoretical parameters applicable to the system and
conditions used in the current study to estimate reaeration rates in Eq. (2.1) and
(2.2).
Background BOD rates at low temperatures (10 and 15 oC) were typically
beyond the resolution limits of the LDO probe to detect a change (i.e. <0.01 mg l-1)
and were therefore assumed to equal that of the theoretical OTR applicable to that
temperature. Background BOD generally increased with increasing temperature
with BOD in yellowtail kingfish tanks tending to be higher in warmer water than

29
mulloway tanks (Figure 2.1). BOD slopes between species were significantly
different (p<0.05). Average (OTR adjusted) background BOD ranges were
approximately 0.005-0.030 (mgO2 l-1 h-1) depending on temperature and species
tank.
There was no significant differences found between the RMR of uncorrected
data when compared to values that were corrected for OTR and background BOD
(p>0.5; Figure 2.2). The proportion of ∆O2 attributed to fish respiration far exceed
that due to OTR and background BOD; ranging from the lowest at 97.1±0.1 % for
mulloway tanks at 35 oC to 99.9±0.1 % for yellowtail kingfish tanks at 10 oC.
0 10 20 30 400.00
0.01
0.02
0.03
0.04
Temperature oC
BO
D (
mg
l-1
h-1
)
Figure 2.1. Background BOD (mg l-1 h-1) in mulloway (M; triangle) and yellowtail kingfish (KF; circle) tanks adjusted for OTR (mean±se; n=3).
2.4.2 Metabolism
The following results are reported as corrected data. RMR of both mulloway
and yellowtail kingfish was shown to increase significantly with temperature
(Figure 2.2). RMR was significantly different (p<0001) between species at each
KF BOD = 0.0011T-0.006 (r2=0.82)
M BOD = 0.0008T-0.003 (r2=0.78)

30
temperature. RMR for mulloway ranged from 33.0±0.6 mg O2 kg-0.8 h-1 at 10oC to
180.2±11.7 mg O2 kg-0.8 h-1 at 35 oC while the RMR of yellowtail kingfish ranged
from 85.3±4.5 mg O2 kg-0.8 h-1 at 10 oC to 382.3±8.9 mg O2 kg-0.8 h-1 at 32.5 oC. The
relationship between temperature and RMR was linear for both species (Figure 2.2)
and can be described as:
RMRmulloway = 5.783T - 29.004 (r2 = 0.97) (2.6)
RMRyellowtail kingfish = 12.113T -39.402 (r2 = 0.95) (2.7)
0 10 20 30 400
100
200
300
400
Temperature oC
RM
R (
mg
O2
kg-0
.8 h
-1)
Figure 2.2. Linear relationship between temperature and the mass-specific RMR of mulloway (triangle) and yellowtail kingfish (circle). Data points and solid regression lines represent corrected data (mean±se; n = 3). Dashed regression lines representing uncorrected data also shown for comparison.
The factorial difference between RMR of mulloway and yellowtail kingfish
derived from Eq. (2.6) and (2.7) was not constant but decreased exponentially with
increasing temperature:
RMR factorial difference = 222.2)174.0exp(469.3 +−× T (r2 = 0.99) (2.8)

31
There was no significant difference between the slopes of Arrhenius plots
for mulloway and yellowtail kingfish (p>0.25; Figure 2.3). The Arrhenius
relationship can be described as:
lnRMRmulloway = -5.729(1/Kx103) + 23.876 (r2 = 0.97) (2.9)
lnRMRyellowtail kingfish = -5.320(1/Kx103) + 23.360 (r2 = 0.95) (2.10)
3.1 3.2 3.3 3.4 3.5 3.6 3.73
4
5
6
7
K-1 x 10³
ln R
MR
(mg
O2
kg-0
.8 h
-1)
Figure 2.3. Arrhenius plot of for mulloway (triangle) and yellowtail kingfish (circle) where K = absolute temperature.
Ea can be calculated as 47.6(±2.1) and 44.1(±2.8) kJ mol-1 for mulloway and
yellowtail kingfish respectively.
The lowest Q10 for mulloway (Q10 = 1.5) occurred between 25-30 oC and for
yellowtail kingfish (Q10 = 1.2) between 20-25 oC (Figure 2.4). Q10 values were
similar for both species over the entire temperature range (Q10 (10 – 35) = 2.0 for
mulloway and Q10 (10 – 32.5) = 1.9 for yellowtail kingfish). The relationship between
Q10 and temperature can be described as:

32
Q10mulloway = 5.797 - 0.297T + 0.005T2 (r2 = 0.99) (2.11)
Q10yellowtail kingfish = 7.805 - 0.5489T + 0.012T2 (r2 = 0.65) (2.12)
The asymptotes of equations 10 and 11 occurred at 28.5 and 22.8 oC for
mulloway and yellowtail kingfish respectively.
Using the oxyenergetic coefficient of 13.59 kJ mg-1 O2 (Elliott and Davison
1975) the daily energetic cost of post-absorptive routine activity can be described as
a function of temperature as:
mulloway (kJ kg-0.8 day-1) = 1.929T – 9.677 (r2=0.97) (2.13)
yellowtail kingfish (kJ kg-0.8 day-1) = 4.041T – 13.141 (r2=0.95) (2.14)
0 10 20 30 400
1
2
3
4
GM Temperature (oC)
Q10
Figure 2.4. Relationship between mean Q10 (n = 3) and geometric mean temperature for mulloway (triangle) and yellowtail kingfish (circle).

33
2.5 Discussion
By nature of the gaseous phase, respirometers designed to estimate
metabolism in air breathing terrestrial animals require air-tight chambers to account
for O2 and CO2 budgets (e.g. Misson 1974; Moors 1977). This study demonstrated
that the air-water interface in a static system provides a sufficient boundary layer to
establish reliable metabolic estimates and, although this boundary layer is
permeable, MO2 through fish respiration can easily be accounted for through simple
mass-balance equations. Re-aeration and background BOD rates were shown to
have a numerically small but statistically insignificant influence on the measured
RMR of mulloway and yellowtail kingfish. This was because the proportional
contribution of fish respiration to the change in DO concentration at all
temperatures far exceeded that due to re-aeration and background BOD. The
advantages of establishing MO2 in an open system such as the one used in this study
are many. MO2 of groups of fish is less likely to be confounded by elevated stress
which may occur with individually housed fish, particularly with gregarious species
such as mulloway. Acclimation periods can easily be of a sufficient duration to
ensure relatively normal stress levels. Logistically, the open-top system is much
more practical and cost effective than traditional respirometers and, as such, allows
for greater replication and experimental power. Contiguous measurements over
longer periods in a static system can be achieved by intermittent flow to avoid
hypoxic conditions (Forstner 1983; Kaufman et al. 1989).
RMR is a useful index of metabolic requirement as most fish maintain
routine swimming velocities. The RMR of similar size mulloway and yellowtail
kingfish was shown to be linearly dependant on water temperature while
comparisons between the species clearly demonstrated a greater demand for oxygen

34
by yellowtail kingfish; the RMR of both species being equivalent when yellowtail
kingfish are at temperatures approximately half that of mulloway. This difference
was made evident during the power failure at 33-34oC when 100% of the yellowtail
kingfish were lost while 62.5% of mulloway survived. The high oxygen demand of
yellowtail kingfish has clear implications for the aquaculture of this species. While
mulloway are known to be relatively hypoxia tolerant (Fitzgibbon et al. 2007b) it is
critical that high DO levels are maintained for yellowtail kingfish, preferably at
saturated levels.
During routine activity yellowtail kingfish will consume, depending on
temperature, approximately two to three times as much oxygen as mulloway and
will therefore require two to three times as much energy intake to fuel routine
metabolism. In the feeding study in Chapter 4, carried out using the same
recirculation system and experiment tanks as the current study, the daily
maintenance digestible energy (DE) requirements for mulloway were found to be
44.2 and 49.6 kJ DE kg-0.8 day-1 at 20 and 26oC respectively. These values are
higher than the energy requirements estimated from equation 13 (cf. 28.9 and 40.5
kJ kg-0.8 day-1 at 20 and 26 oC respectively). Maintenance energy requirements
derived from feeding studies in this way are inclusive of the increased energetic
costs associated with prandial metabolism including specific dynamic action (SDA)
as well as general feeding activity. Clearly the maintenance energy requirements of
fasted fish at routine swimming velocities compared to that of actively feeding fish
represent different levels within the metabolic scope of activity. This has important
implications for the construction of bioenergetic models used to make predictions of
energy requirements, which in turn provide the foundation for diet formulations and
feeding strategies for cultured fish (Bureau et al. 2002). A clear delineation between

35
the different levels of activity must be made to ensure the integrity of models
predicting “maintenance” energy requirements.
Fish have a lower metabolism and a correspondingly lower activity level at
colder temperatures (Jobling 1982; Fonds et al. 1992). While swimming velocities
were not recorded in this study, the stark contrast in activity exhibited by the two
species is likely to have contributed towards the significant differences seen in
overall MO2; mulloway activity was generally restricted to maintaining their
position at the bottom of the tank while yellowtail kingfish continued to swim
actively throughout the water column, although this activity was quite noticeably
reduced in cold temperatures. Normalized for temperature and size, the standard
metabolic rates (SMR) of mulloway and yellowtail kingfish have been shown to be
similar although the aerobic scope of yellowtail kingfish is almost 3 times that of
mulloway (Clark and Seymour 2006; Fitzgibbon et al. 2007b). The decrease in the
factorial difference in MO2 with increasing temperatures between mulloway and
yellowtail kingfish may give some insight into the thermoregulatory responses
between the two species. The relative difference between standard and routine
metabolism in some species has been shown to decrease with increasing
temperature (Hölker 2003) and this may be because cold temperatures are known to
enhance the oxidative capacity of skeletal muscle and other tissues (Guderley and
Johnston 1996).
The RMR of mulloway at 22 oC (98 mg kg-0.8 h-1), derived from Eq. (2.6), is
very close to the MO2 at the slowest swimming velocity recorded by Fitzgibbon et
al. (2007b) for mulloway at this temperature in normoxic conditions using a tunnel
respirometer. Fitzgibbon et al. (2007b) point out that MO2 of mulloway at the
slowest test velocity (7.5 cm s-1) was slightly higher than that observed at 15 cm s-1

36
(86 mg kg-0.8 h-1) and attribute this to the energetic cost associated with maintaining
stability at low velocities. Similar responses in MO2 as a function of low swimming
velocity have also been recorded for the European seabass (Dicentrarchus labrax)
(Chatelier et al. 2005) and Pacific bonito (Sarda chiliensi) (Sepulveda et al. 2003).
While estimations of RMR, by definition, include MO2 associated with spontaneous
activity (Fry 1957), estimates of SMR derived by extrapolating relative swimming
speed to 0 velocities can be influenced by the energetic cost of stability at low
swimming velocities (Magnuson 1973; Webb 2002) particularly in obligate ram-
ventilating species such as the tunas and sharks (Sepulveda et al. 2003; Sepulveda et
al. 2007).
While yellowtail kingfish are a high-energy-demand, high-performance
species that share similar morphological characteristics of the tunas (Clark and
Seymour 2006) the RMR of tuna species is much higher. Southern bluefin tuna
(Thunnus maccoyii), a species that are also cultured in Australia, have a RMR of
834 mg kg-0.8 h-1 at 19 oC (Fitzgibbon et al. 2008) which is more than four times that
of yellowtail kingfish and more than ten times than that of mulloway at the same
temperature (cf. 191 and 81 mg kg-0.8 h-1 for yellowtail kingfish and mulloway
respectively). The high metabolic rate of tunas is related in part to their elevated
endothermy and obligate ram-ventilating requirement (Sepulveda et al. 2003);
characteristics which are absent in other teleosts such as mulloway and yellowtail
kingfish.
From Eq. (2.6) the predicted RMR of mulloway at 26 oC (121 mg O2 kg-0.8
h-1) is slightly higher than that of the similarly sedentary barramundi (Lates
calcarifer) held between 26-32 oC (92 mg O2 kg-0.8 h-1) (data adapted from
Glencross and Felsing (2006) based on a 180 g fish). Barramundi are a catadromous

37
species that are also cultured in Australia, and while the study by Glencross and
Felsing (2006) was carried out on barramundi in freshwater, the energetic cost
associated with osmoregulation by euryhaline species such as mulloway in seawater
may not necessarily equate to a significant relative increase in MO2. The influence
of salinity on MO2, and therefore energy metabolism, varies considerably depending
on the species and rearing conditions (Claireaux and Lagardere 1999; Altinok and
Grizzle 2003; Wuenschel et al. 2005) as well as life history (Morgan and Iwama
1991) making generalizations very difficult and necessitating the establishment of
MO2 and salinity relationships for each species as required.
The thermosensitivity of RMR in yellowtail kingfish demonstrated a clear
parabolic response with the lowest Q10 occurring between 20-25 oC and the
asymptote at 22.8 oC. While not strictly stenotherms, the increased
thermosensitivity of RMR outside these ranges indicate that yellowtail kingfish
have a narrower temperature range for optimal metabolic function (compared to
mulloway) indicative of a temperate pelagic species. At all temperatures yellowtail
kingfish appeared to feed well, albeit noticeably less vigorously at 10 oC. As
mentioned previously, initially stocked yellowtail kingfish were observed to
sometimes regurgitate feed at 33 oC and although no ABT was detected, this
response may indicate that yellowtail kingfish were approaching their upper thermal
limit.
The Q10(20-25) value of 1.2 for yellowtail kingfish recorded in this study is
considerably lower than that reported by Clark and Seymour (2006) on the SMR of
the same species (Q10(20-25) = 4.5; BW = 2.1 kg). The short acclimation period,
although noted as ecologically relevant in their study, of 5 oC over 3 h (cf. 2-3 oC in
10 d this study) is likely the main reason for such discrepancy and highlights the

38
need for acclimation periods of adequate duration if acute temperature related
responses in MO2 are not desired. The thermosensitivity of RMR in mulloway
demonstrated a reverse J-curve response with the lowest Q10 occurring between 25-
30 oC and the asymptote at 28.5 oC. In contrast to yellowtail kingfish, the curve
relating to Q10 values between 20-35 oC was very shallow showing little difference
over this range indicating that mulloway have a much broader ranging thermal
tolerance on metabolic function, typical of eurythermal species inhabiting estuarine
and near-shore coastal habitats (Harrison and Whitfield 2006). The
thermosensitivity of RMR has implications for the aquaculture of both species
particularly in terms of seasonal temperature profiles at site locations for sea cage
operations. Temperatures consistently above or below those least thermally
dependent ranges may have negative impacts on productivity.
Ectotherms exhibit thermoregulatory behaviour by altering spatial and
temporal patterns of activity to maintain their body temperature within a narrow
“optimal” range (Beitinger and Fitzpatrick 1979; Hochachka and Somero 2002).
This is linked with the idea that final thermal preferenda and thermal physiology are
closely co-adapted and that thermal preferences coincide with temperatures that
maximize Darwinian fitness (Beitinger and Fitzpatrick 1979; Angilletta et al. 2006;
Martin and Huey 2008). Martin and Huey (2008) however proposed the concept of
“suboptimal is optimal” in ectotherms whereby the preferred temperature may be
lower than the physiologically optimal temperature. Their model predicts that
animals will select temperatures that are somewhat lower than the temperature at
which fitness is maximal (Martin and Huey 2008). Thermal studies on mulloway by
Bernatzeder and Britz (2007) demonstrated a final preferred temperature range of
25 – 26.4 oC while the predicted temperature in the current study at which the RMR

39
of mulloway was the least thermally dependent was somewhat higher at 28.5 oC.
The Martin and Huey model (2008) may apply in this case only if we consider 28.5
oC near the physiologically “optimal” temperature for mulloway. We may then
speculate that yellowtail kingfish will select temperatures slightly below 22.8 oC if
given a choice; however this remains to be tested. It should be remembered however
that the RMR values established in this study are of the routine activity of post-
absorptive juvenile fish and therefore exclude the influence of post-prandial effects
and specific dynamic action (SDA); thermal sensitivities may shift slightly
depending on physiological (and reproductive) states (Angilletta et al. 2002).
Indeed, studies on the thermal effects of post-prandial metabolic responses in
juvenile mulloway (Chapter 3) show a shift in Q10 values of approximately 0.2
when comparing the metabolic thermosensitivities between peak SDA MO2 and
RMR of 240 g fish. Furthermore a change in the direction of thermosensitivity
(Q10peakSDA- Q10RMR) was seen depending on the shift in temperature from -0.2
(Q10(14-20)) to +0.2 (Q10(20-26).
As the body temperature of ectotherms conforms to the temperature of their
immediate environment it is therefore reasonable to consider that their metabolism
also responds in the same way of simple chemical reactions. According to kinetic
theory chemical reactions only proceed once they have attained a minimum required
energy of activation (Ea). Generally, at around room temperature (25 oC) reaction
rates with an Ea of ~50 kJ mol-1 double for every 10oC rise in temperature (Kotz and
Treichel 1996). Over the range of temperatures tested in this study the Ea values of
mulloway (47.6 kJ mol-1) and yellowtail kingfish (44.1 kJ mol-1) were found to be
very close to this value and generally conform to the overall Q10 for most fish
species (Cameron 1989; Clarke and Johnston 1999). For similar reactions at a given

40
temperature the greater the energy barrier (i.e. the higher the Ea) the slower the
reaction rate (Kotz and Treichel 1996); we can therefore expect reaction rates within
mulloway to proceed at a similar rate as yellowtail kingfish. The difference in
routine activity between mulloway and yellowtail kingfish appeared to influence the
elevation but not the slope (Figure 2.4) indicating that Ea may be independent of
activity level. Similar differences between the elevation but not the slope of
Arrhenius plots can also be seen between the SMR and RMR of carp (Cyprinus
carpio) (Becker et al. 1992).
To conclude, re-aeration rates and BOD levels of seawater in the open-top
system used in this study were shown to have an insignificant influence on
estimations of RMR; even so, metabolic rates can be accurately quantified using
simple mass balance equations to account for minor influences not directly
associated with fish respiration. Comparable results to published data on the same
species using more traditional flow-through respirometers also lend confidence to
the system and methods used. The thermosensitivity response of RMR appeared
indicative of the temperature profiles where mulloway and yellowtail kingfish are
naturally found. This has direct implications for the aquaculture of the species
particularly with regard to appropriate site locations with exposure to optimal
temperature ranges; i.e. 20-25 oC for yellowtail kingfish and 25-30 oC for
mulloway, although mulloway should still perform well if temperatures remain
above 20 oC. The high oxygen demand of yellowtail kingfish necessitates the supply
of high levels of DO in any culture system for this species.

41
Chapter 3
The Effect of Temperature and Body Weight on the Routine
Metabolic Rate and Postprandial Metabolic Response in Mulloway 2
2The following chapter is published as:
Pirozzi, I., Booth, M.A., 2009. The effect of temperature and body weight on the routine metabolic rate and postprandial metabolic response in mulloway, Argyrosomus japonicus. Comp. Biochem. Physiol. A-Mol. Integr. Physiol. 154, 110-118
3.1 Abstract
Specific dynamic action (SDA) is the energy expended on the physiological
processes associated with meal digestion and is strongly influenced by the
characteristics of the meal and the body weight (BW) and temperature of the
organism. This study assessed the effects of temperature and body weight on the
routine metabolic rate (RMR) and postprandial metabolic response in mulloway,
Argyrosomus japonicus. RMR and SDA were established at 3 temperatures (14, 20
and 26 oC). 5 size classes of mulloway ranging from 60 g to 1.14 kg were used to
establish RMR with 3 of the 5 size classes (60, 120 and 240 g) used to establish
SDA. The effect of body size on the mass-specific RMR (mg O2 kg-1 h-1) varied
significantly depending on the temperature; there was a greater relative increase in
the mass-specific RMR for smaller mulloway with increasing temperature. No
statistical differences were found between the mass exponent (b) values at each
temperature when tested against H0: b = 0.8. The gross RMR of mulloway (mg O2
fish-1 h-1) can be described as function of temperature (T; 14-26 oC) as: (0.0195T –
42
0.0454)BW(g)0.8 and the mass-specific RMR (mg O2 kg-1 h-1) can be described as:
(21.042T – 74.867)BW(g)-0.2. Both SDA duration and time to peak SDA were
influenced by temperature and body weight; SDA duration occurred within 41-89 h
and peak time occurred within 17 – 38 h of feeding. The effect of body size on peak
metabolic rate varied significantly depending on temperature, generally increasing
with temperature and decreasing with increasing body size. Peak gross oxygen
consumption (MO2: mg O2 fish-1 h-1) scaled allometrically with BW. Temperature,
but not body size, significantly affected SDA scope, although the difference was
numerically small. There was a trend for MO2 above RMR over the SDA period to
increase with temperature; however, this was not statistically significant. The
average proportion of energy expended over the SDA period (SDA coefficient)
ranged from approximately 7 – 13 % of the total DE intake while the proportion of
total energy expended on SDA above RMR ranged from approximately 16 to 27 %.
3.2 Introduction
The obligatory increase in oxygen consumption (MO2) that occurs in
animals after feeding represents the energy expended on ingestion, digestion,
absorption and assimilation of a meal and is often termed specific dynamic action
(SDA) (Jobling 1981; Withers 1992). In ectotherms, an increase in temperature is
generally accompanied by an increase in routine and peak metabolic rates and a
decrease in the SDA duration (Robertson et al. 2002; Wang et al. 2003; Luo and Xie
2008). Body size also influences the SDA response and, in absolute terms, an
increase in body size will generally correspond to an increase in metabolic rate,
SDA duration and peak metabolism (Tandler and Beamish 1981; Boyce and Clarke
43
1997). The increased O2 demand associated with feeding has practical implications
for the management of intensively cultured aquatic animals. While dissolved O2
may be at normoxic levels for fish during routine activity, the increased O2 demand
associated with feeding may, depending on stocking densities, induce periods of
oxygen debt. If chronic hypoxic conditions occur, voluntary feed intake is reduced
(Glencross 2009) and production potential is then likely to be compromised.
The mechanical costs of processing food are considered to be negligible and
are in the order of 1 – 3 % of the energy expended on SDA (Cho and Slinger 1979;
Peck 1998) while in most animals, as much as 60-80 % of SDA results from post-
absorptive metabolism associated with the anabolic cost of protein and lipid
synthesis, protein turnover and growth (Wieser 1994; Willmer et al. 2000). The
magnitude and duration of the SDA response is greatly influenced by the
characteristics of the meal such as composition (Ross et al. 1992; Peres and Oliva-
Teles 2001; Fu et al. 2007), ration size (Secor and Diamond 1997; Fu et al. 2005)
and feeding frequency (Guinea and Fernandez 1997; de la Gandara et al. 2002). The
proportion of the energy expended during the SDA period above routine
metabolism can also vary depending on species (Fu et al. 2005; Fu et al. 2006).
The partitioning and quantification of dietary energy is important in the
study of nutritional energetics because it provides a convenient platform to predict
the energy balance of individuals based on body weight, sex, activity, physiological
state, environment, and amount and nutritive value of feed eaten (Baldwin and
Bywater 1984). This information can then form the basis for diet formulation and
evaluation (Bureau et al. 2002). Energy exchanges in biological systems can be
studied in terms of their biochemical thermodynamics or bioenergetics, which
involves the examination of energy gains, losses and transfers within the whole

44
organism (Jobling 1994; Haynie 2001). Energy budgets account for the energy
ingested (IE) and the energy used for metabolism (M), nitrogenous waste (UE),
fecal waste (FE) and production (P; somatic and non-somatic growth). This can be
expressed in the general form:
IE = M + UE + FE + P
M can be further partitioned as the sum of routine metabolic rate (RMR; basal
metabolism + metabolism associated with routine activity) + SDA.
The energetic requirements for RMR, maintenance and growth have been
established for mulloway (Chapter 2; 4); however, information on the allometric
relationships with temperature and metabolism are limited and there is currently no
information on the SDA response for this species. The objectives of this study were
to describe the influence of body mass and temperature on the RMR and SDA of
mulloway.
3.3 Materials & Methods
3.3.1 Experiment design
The influence of temperature on oxygen consumption (MO2) was tested
using five size classes of juvenile mulloway (mean initial body weight (g) ± SD;
60.4± 0.9, 122.2± 2.6, 240.5±3.6, 496.7± 2.5 or 1140.6± 1.6). Sizes classes are
referred to as XS, S, M, L or XL respectively. Fish were stocked in triplicate groups
for each of the 3 temperature treatments (14, 20 or 26 oC) into 200 l open-top tanks
at n = 22, 12, 8, 3 or 2 fish per tank for the XS, S, M, L and XL fish respectively.

45
Stocking densities were chosen to mitigate the potential for density dependent
behavioral effects (Appendix 1).
All fish (i.e. all temperature x size groups) were initially stocked into the
experiment system at ambient water temperature (16 oC) and then adjusted 1 oC day-
1 until the start temperature of 14 oC was reached. Fish were then held for two
weeks at that temperature to acclimate to the system before MO2 readings were
taken for the 14 oC treatment group. During acclimation all fish were fed a
maintenance ration once daily of a 6mm sinking commercial diet (Ridley AquaFeed
Pty. Ltd., Narangba, Qld. Australia; 45.5 % crude protein, 18.7 % crude fat, 22.2 MJ
kg-1 gross energy). The apparent digestibility coefficient for energy of the diet was
0.84 (Booth, unpublished data, 2008). Each tank was supplied with constant water
flow (6 l min-1) and air when MO2 was not being recorded. Tanks were exposed to
indirect natural lighting (photoperiod 11L:13D) and water quality parameters (pH
7.5-7.84; NH4+ <0.1 mg/L; salinity 30.6-33.0 ppt) were monitored regularly.
3.3.2 MO2
MO2 readings were established as per Chapter 2 . Fish were fasted for 96, 72
or 48 h depending on the temperature treatment (i.e. 14, 20 or 26 oC respectively)
prior to establishing routine metabolic rates (RMR). MO2 measurements for each
temperature were repeated three times over approximately 2 h intervals for each
replicate tank and the mean regarded as the RMR. After RMR was established fish
were fed the commercial diet slowly from 16:30 over approximately 1 h to slightly
in excess of apparent satiation. Any uneaten pellets remaining after the feeding
period were counted then siphoned from tanks. Total feed intake was then adjusted
46
accordingly using a predetermined individual pellet weight of 0.21± 0.02 g (mean ±
SD; n = 202). MO2 during the SDA period was monitored up to 72 h or until MO2
rates fell within the standard error of RMR levels. MO2 rates remained elevated
after 72 h for the mulloway at 14 oC however readings taken at day 6 post-feeding
showed that MO2 had returned to RMR levels. The L and XL size mulloway did
not feed well and were excluded from SDA analyses.
Fish that were assigned as the 14 oC treatment were re-weighed after MO2
readings were completed for that temperature and removed from the system.
Background biochemical oxygen demand (BOD) was determined for each replicate
tank after fish were removed and water had been re-saturated with O2. The
temperature was then adjusted up 1 oC day-1 until the next experiment temperature
(20 oC) was reached. The remaining fish in the system were acclimated for a further
week before MO2 was recorded. This protocol was again repeated for the final
temperature (26 oC). After MO2 measurements had been completed a sub-sample of
5 individual fish from each replicate tank were euthanized with an overdose of
benzocaine (ethyl-p-aminobenzoate) and dissected to determine the presence or
absence of feed remaining in the digestive tract. Fish from the 14 oC treatment were
sub-sampled on day 6 post-feeding.
3.3.3 RMR and SDA Parameters
Mass-specific MO2 was calculated as:
)OOO()n/BW/V( 2bod2otr2 +−× ∆

47
Where V = tank water volume (l); BW = mean body weight (kg); n = number of fish
tank-1; ∆O2 = net change in O2 concentration (mg l-1 h-1) inclusive of fish respiration,
atmospheric re-aeration and background BOD; O2otr = atmospheric oxygen transfer
rate (OTR; mg l-1 h-1); O2bod = background BOD rate (mg l-1 h-1). OTR was
calculated using seawater-atmosphere O2 transfer coefficients established in Chapter
2.
The following MO2 and SDA indices were calculated:
MO2rmr-g: Routine metabolic rate (RMR) expressed as gross MO2 (mg O2 fish-1 h-1)
defined as the metabolic rate associated with standard metabolism and
spontaneous swimming activity of post-absorptive fish fasted for 48 h – 96 h
(depending on temperature treatment)
MO2rmr-s: Mass-specific RMR (mg O2 kg-1 h-1)
MO2sda-d: SDA duration (h) defined as the time from initial feeding to the point
when MO2 rates returned to within the SE of MO2rmr-s. 14oC treatments were
estimated by fitting a quadratic function and deriving the x-intercept when y =
+SE of MO2rmr-s
MO2sda-p: Peak post-prandial MO2 derived as y-intercept of asymptote of quadratic
function fitted to MO2sda-d
MO2sda-pd: SDA duration from feeding to peak post-prandial MO2 derived as x-
intercept of asymptote of quadratic function fitted to MO2sda-d
MO2scope: Factorial scope calculated as MO2sda-p MO2rmr-s-1
MO2sda: The cumulative measurement of MO2 (mg O2 kg-1) above RMR over the
SDA period. Calculated as the area under the curve (AUC) (Motulsky and

48
Christopoulos 2003). 14oC treatment was estimated based on predicted
MO2sda-d.
SDA coefficient: Estimate of the proportion (%) of total digestible energy (DE)
intake from feed expended on SDA. Based on an oxyenergetic conversion
factor of 13.59 kJ mg O2-1 (Elliott and Davison 1975) applied to MO2sda.
SDAE: Proportion (%) of SDA energy expenditure above RMR
TE: Total metabolic expenditure (kJ kg-0.8) over SDA period (sum of SDA + RMR)
3.3.4 Data analyses
The effect of temperature on the MO2rmr-s and MO2rmr-g of the 5 different size
classes of mulloway (XS, S, M, L, XL) was tested with 2-way ANOVA
(temperature x size). SDA variables were compared between 3 sizes (XS, S, M)
using 2-way ANCOVA (temperature x size) with relative feed intake (RFI: g feed
BW kg-1) as the co-variate. Two-way ANOVA was used on SDA variables where
the covariate was not significant (MO2sda-d, MO2scope). RFI was also compared
between XS, S and M size mulloway using 2-way ANOVA. All data were normally
distributed according to skewness, kurtosis and omnibus normality tests (NCSS
2004, Kaysville, Utah). All variances were homogeneous according to modified
Levenes’ equal variance test. Tukey-Kramer test was used for a posteriori multiple
comparison of means on significant terms. Comparisons of individual model
parameters were made using the extra sum-of-squares F-test. Results of all
statistical tests were regarded as significant at p<0.05.

49
The effect of body weight on RMR at each temperature was described by the
allometric equation:
RMR = aBWb
Where a is the normalizing constant, BW is the body mass in g and b is the scaling
exponent describing the influence of mass on metabolism. Power functions were
iteratively derived using the non-linear least squares method in Graphpad Prism® v 4.0.
The SDA responses for XS, S and M size mulloway at each temperature
were fitted with a quadratic function in the form:
MO2SDA = a + bt + ct2
Where MO2SDA is the mass-specific MO2 (mg O2 kg-1 h-1) over the SDA period
expressed as function of time (t) in hours.
3.4 Results
3.4.1 Temperature and fish size interactions
3.4.1.1 RMR
The effect of body size on the MO2rmr-s of mulloway varied significantly
depending on the temperature (Table 3.1). There was a significantly greater relative
increase in MO2rmr-s for smaller mulloway with increasing temperature (Table 3.2).
Partitioning of the data demonstrated no significant interaction (ANOVA;
temperature x size; p>0.5) between MO2rmr-s at 20 and 26 oC while comparisons at
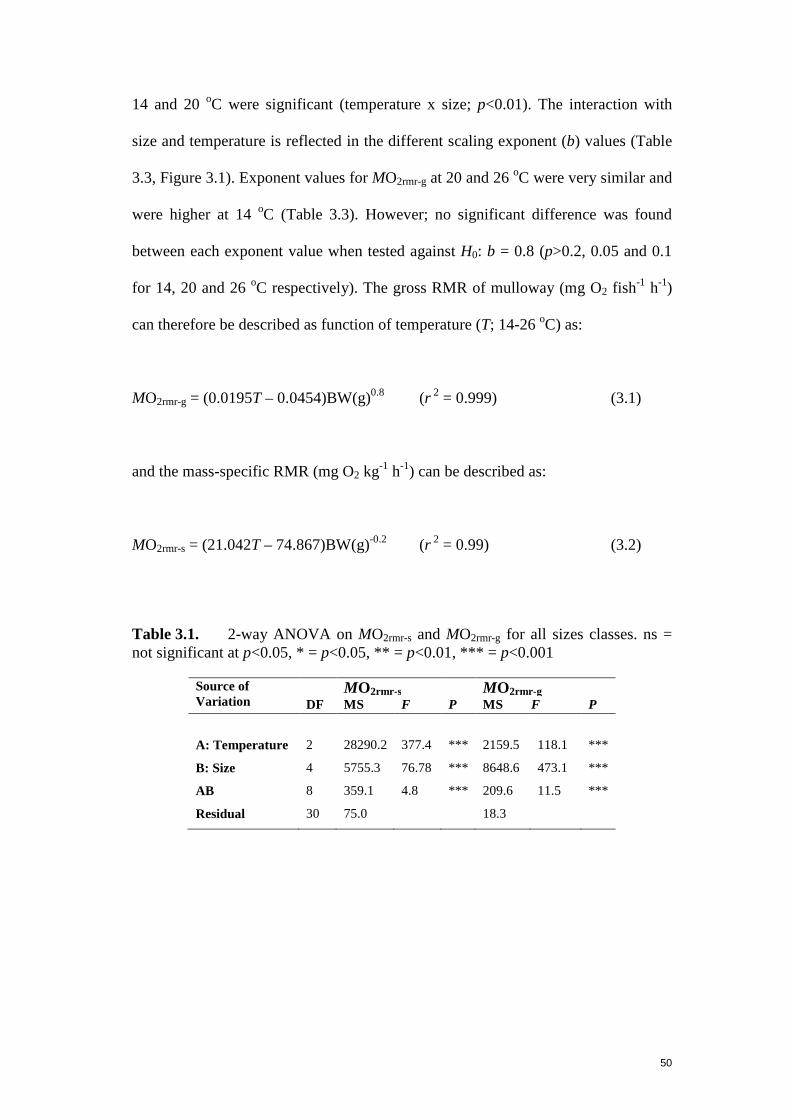
50
14 and 20 oC were significant (temperature x size; p<0.01). The interaction with
size and temperature is reflected in the different scaling exponent (b) values (Table
3.3, Figure 3.1). Exponent values for MO2rmr-g at 20 and 26 oC were very similar and
were higher at 14 oC (Table 3.3). However; no significant difference was found
between each exponent value when tested against H0: b = 0.8 (p>0.2, 0.05 and 0.1
for 14, 20 and 26 oC respectively). The gross RMR of mulloway (mg O2 fish-1 h-1)
can therefore be described as function of temperature (T; 14-26 oC) as:
MO2rmr-g = (0.0195T – 0.0454)BW(g)0.8 (r 2 = 0.999) (3.1)
and the mass-specific RMR (mg O2 kg-1 h-1) can be described as:
MO2rmr-s = (21.042T – 74.867)BW(g)-0.2 (r 2 = 0.99) (3.2)
Table 3.1. 2-way ANOVA on MO2rmr-s and MO2rmr-g for all sizes classes. ns = not significant at p<0.05, * = p<0.05, ** = p<0.01, *** = p<0.001
Source of Variation
MO2rmr -s MO2rmr -g DF MS F P MS F P
A: Temperature 2 28290.2 377.4 *** 2159.5 118.1 ***
B: Size 4 5755.3 76.78 *** 8648.6 473.1 ***
AB 8 359.1 4.8 *** 209.6 11.5 ***
Residual 30 75.0 18.3

51
0 250 500 750 1000 12500
25
50
75
100
125M
O2
(mg
O2
fish
-1 h
-1)
0 250 500 750 1000 12500
50
100
150
200
250
BW (g)
MO
2
(mg
O2
kg-1
h-1
)
A
B
Figure 3.1. Relationship between BW (g) and A. MO2rmr-g and B. MO2rmr-s at 14 (squares), 20 (triangles) and 26 oC (circles). Solid lines represent power functions with exponent (b) values fixed at 0.8 and -0.2 for graphs A and B respectively. Dashed lines represent power functions with unconstrained iteratively derived b. Refer to Table 3.3 for specific parameter values.

52
Table 3.2. Summary of RMR MO2 results (mean±se) for XS – XL size mulloway at 14, 20 and 26oC. ANOVA on final BW data analyzed within size class and were significant at p<0.05 but not p<0.01. Means sharing superscript letters are not significantly different (p>0.05) according to Tukey-Kramer test.
XS S M L XL
Variable 14oC 20oC 26oC 14oC 20oC 26oC 14oC 20oC 26oC 14oC 20oC 26oC 14oC 20oC 26oC BW (g) 61.6±0.3 60.4±2.1 60.9±0.6 123.5±2.4 119.2±3.3 120.9±2.0 248.8±3.0a 235.5±1.4b 245.7±3.6ab 478.6±6.4a 444.4±5.0b 439.2±9.5b 1134±45a 1011±18b 976±3b
MO2rmr-g (mg O2 fish-1 h-1)
5.6±0.1a 9.7±0.2ab 12.4±0.2ab 9.4±0.1ab 16.4±0.2abc 21.2±0.5bcd 17.7±0.5abc 28.2±2.0cde 37.1±1.3ef 31.4±3.0de 49.7±2.3f 67.1±3.4g 63.9±5.2g 83.3±4.8h 110.1±3.0i
MO2rmr-s
(mg O2 kg-1 h-1) 90.8±1.9bc 160.8±7.9ef 203.2±4.5g 75.8±2.0ab 138.1±3.2de 175.4±2.2f 71.1±2.7ab 119.9±9.0cd 151.0±3.6ef 65.6±5.7ab 111.9±5.8c 152.6±5.8ef 56.2±2.7a 82.3±3.4b 112.8±2.9cd

53
Table 3.3. Parameters of the power function y = aMb describing the relationship between body mass and MO2rmr-g or MO2rmr-s for mulloway at each experiment temperature. Data shown for iteratively derived parameters and also for coefficient values when b fixed at 0.8 (MO2rmr-g) or -0.2 (MO2rmr-s).
RMR variable
Temperature (oC)
Unconstrained b a±se
b±se
r 2
Constrained b a±se
r 2
MO2rmr-g 14 0.158±0.05 0.854±0.04
0.98 0.228±0.01 0.98
20 0.536±0.12 0.732±0.04 0.98 0.341±0.01 0.98
26 0.622±0.13 0.754±0.03 0.99 0.461±0.01 0.99
MO2rmr-s 14 174.2±22.4 -0.161±0.02 0.78 212.5±5.3 0.74
20 394.4±45.7 -0.218±0.02 0.89 360.4±7.3 0.88
26 440.6±45.6 -0.190±0.02 0.90 465±7.4 0.90
3.4.1.2 SDA
Figure 3.2 shows the SDA responses for XS, S and M size mulloway at 14,
20 and 26 oC. RFI was a significant covariate for MO2sda-p, MO2scope and MO2sda
(Table 3.4). No food was present in the digestive tract of any size mulloway at any
temperature at the conclusion of the study.
The effect of body size on MO2sda-p varied significantly depending on
temperature (Table 3.4). MO2sda-p generally increased with temperature and
decreased with increasing size (Table 3.5). The relationship between peak gross
MO2 (mg O2 fish-1 h-1) and BW was allometric (Figure 3.3) and can be described at
each temperature as:
14oC (mg O2 fish-1 h-1) = 0.144BW(g)0.938 (r 2 = 0.989) (3.3)
20oC (mg O2 fish-1 h-1) = 0.321BW(g)0.882 (r 2 = 0.998) (3.4)
26oC (mg O2 fish-1 h-1) = 0.692BW(g)0.799 (r 2 = 0.985) (3.5)

54
-12 0 12 24 36 48 60 72 840
100
200
300
400 XSM
O2
(mg
O2
kg-1
h-1
)
-12 0 12 24 36 48 60 72 840
100
200
300S
MO
2
(mg
O2
kg-1
h-1
)
-12 0 12 24 36 48 60 72 840
100
200
300 M
SDA duration (h)
MO
2
(mg
O2
kg-1
h-1
)
Figure 3.2. Temporal pattern of SDA measured as mean MO2 (mg O2 kg-1 h-1) (±se; n = 3) of XS, S and M size mulloway at 14 (squares), 20 (triangles) and 26 oC (circles). Horizontal dashed lines represent MO2rmr-s at each temperature and size treatment. Refer to Table 2 for MO2rmr-s values. Quadratic functions shown fitted for MO2sda-d.
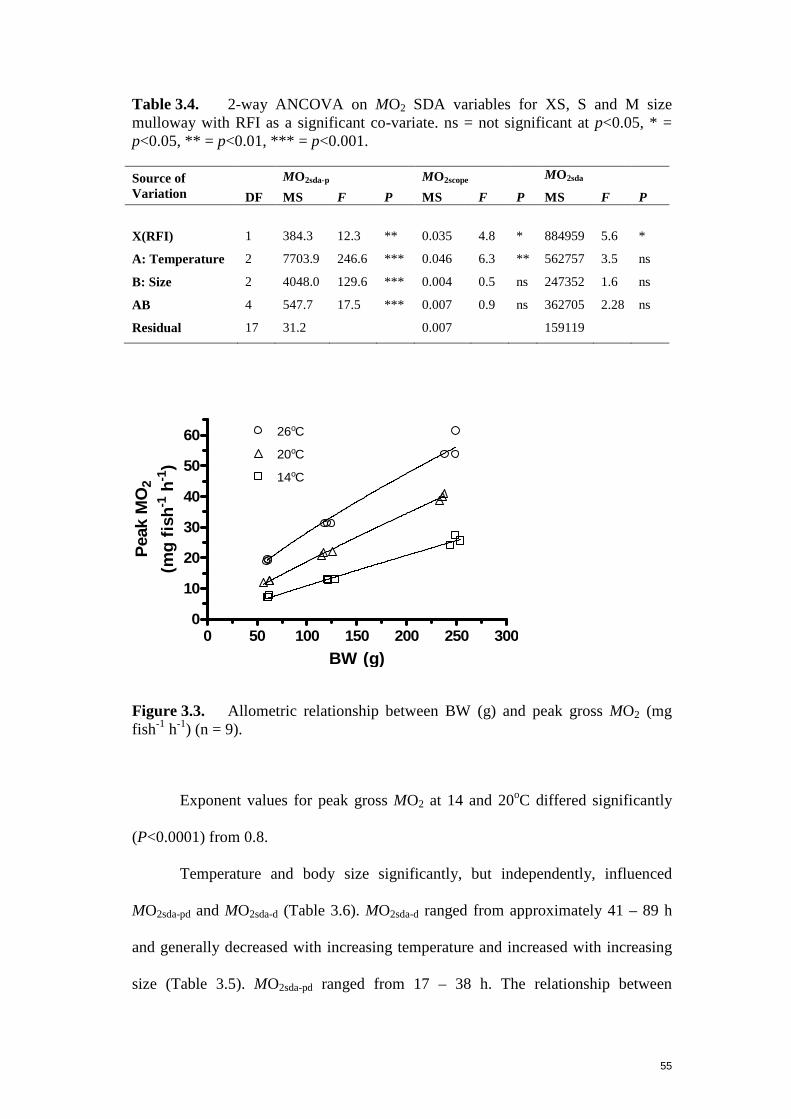
55
Table 3.4. 2-way ANCOVA on MO2 SDA variables for XS, S and M size mulloway with RFI as a significant co-variate. ns = not significant at p<0.05, * = p<0.05, ** = p<0.01, *** = p<0.001.
Source of Variation
MO2sda-p MO2scope MO2sda
DF MS F P MS F P MS F P
X(RFI) 1 384.3 12.3 ** 0.035 4.8
* 884959 5.6 *
A: Temperature 2 7703.9 246.6 *** 0.046 6.3 ** 562757 3.5 ns
B: Size 2 4048.0 129.6 *** 0.004 0.5 ns 247352 1.6 ns
AB 4 547.7 17.5 *** 0.007 0.9 ns 362705 2.28 ns
Residual 17 31.2 0.007 159119
0 50 100 150 200 250 3000
10
20
30
40
50
6020oC
14oC
26oC
BW (g)
Pea
kM
O2
(mg
fis
h-1
h-1
)
Figure 3.3. Allometric relationship between BW (g) and peak gross MO2 (mg fish-1 h-1) (n = 9).
Exponent values for peak gross MO2 at 14 and 20oC differed significantly
(P<0.0001) from 0.8.
Temperature and body size significantly, but independently, influenced
MO2sda-pd and MO2sda-d (Table 3.6). MO2sda-d ranged from approximately 41 – 89 h
and generally decreased with increasing temperature and increased with increasing
size (Table 3.5). MO2sda-pd ranged from 17 – 38 h. The relationship between

56
temperature and both MO2sda-pd and MO2sda-d was linear (Figure 3.4) with duration
decreasing with increasing temperature. There was no effect of temperature between
slopes (p>0.5) with regard to MO2sda-d however the y-intercepts differed
significantly (p<0.05). Therefore, when slope = -3.467 (r2 = 0.93), MO2sda-d = 128.4
(r2 = 0.96), 132.7 (r2 = 0.92) and 135.3 h (r2 = 0.91) at x = 0 for XS, S and M size
mulloway respectively.
10 15 20 25 3015
20
25
30
35
40
45
SD
A p
eak
dur
atio
n (
h)
10 15 20 25 30
20
40
60
80
100
Temperature oC
SD
A d
ura
tion
(h)
A
B
Figure 3.4. Linear relationship between temperature and A. MO2sda-pd and B. MO2sda-d (±se; n = 3) for XS (circles), S (triangles) and M (squares) size mulloway.

57
The relationship between temperature (T; 14-26 oC) and MO2sda-pd for XS, S
and M size mulloway can be described as:
XS = -1.185T + 48.36 (r2 = 0.94) (3.6)
S = -0.914T + 42.44 (r 2 = 0.87) (3.7)
M = -1.470T + 58.07 (r 2 = 0.94) (3.8)
Temperature, but not body size, significantly affected MO2scope (Table 3.4).
MO2scope demonstrated a small but statistically significant increase of, on average,
0.16 at 26 oC (MO2scope = 1.51) compared to both 14 and 20 oC (MO2scope = 1.37,
1.34 respectively) (Table 3.6).
There was a trend for MO2sda to increase with temperature (Table 3.5);
however, this was not significant (Table 3.4). MO2sda was, on average, 1812, 1967
and 2799 mg at 14, 20 and 26 oC respectively (Table 3.5). There was no obvious
trend indicating the relationship between MO2sda and size (Table 3.5).
Table 3.5. 2-way ANOVA on SDA variables for XS, S and M size mulloway with RFI as a non-significant covariate. Results of 2-way ANOVA for RFI also shown. ns = not significant at p<0.05, * = p<0.05, ** = p<0.01, *** = p<0.001.
Source of
Variation
MO2sda-pd
MO2sda-d
SDA coef
SDAE
RFI
DF MS F P MS F P MS F P MS F P MS F P
A: Temperature 2 459.6 118.5 *** 3920.6 134.7 *** 19.9 9.4 ** 146.9 8.9 *** 240.4 47.1 *** B: Size 2 55.0 14.2 *** 108.8 3.7 * 20.9 9.9 ** 33.0 2.0 ns 126.0 24.7 *** AB 4 9.6 2.5 Ns 8.5 0.3 ns 7.2 3.4 * 23.5 1.4 ns 18.0 3.5 * Residual 18 3.9 29.1 2.1 16.4
5.1
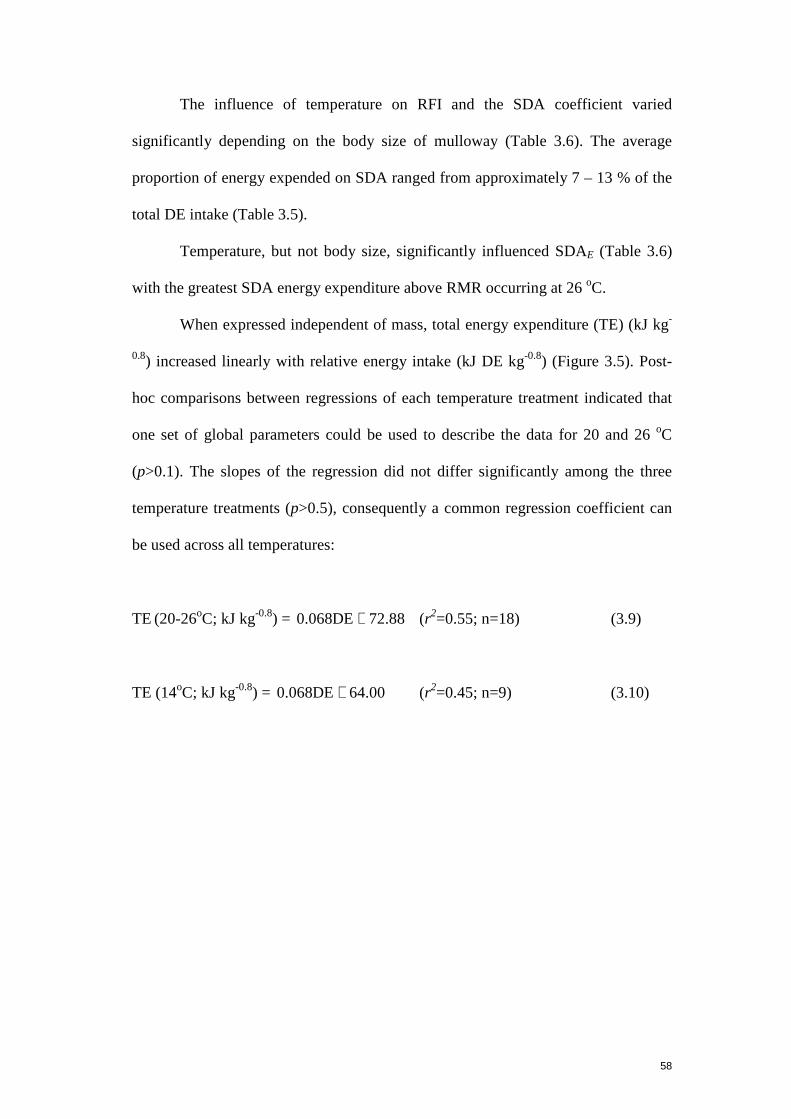
58
The influence of temperature on RFI and the SDA coefficient varied
significantly depending on the body size of mulloway (Table 3.6). The average
proportion of energy expended on SDA ranged from approximately 7 – 13 % of the
total DE intake (Table 3.5).
Temperature, but not body size, significantly influenced SDAE (Table 3.6)
with the greatest SDA energy expenditure above RMR occurring at 26 oC.
When expressed independent of mass, total energy expenditure (TE) (kJ kg-
0.8) increased linearly with relative energy intake (kJ DE kg-0.8) (Figure 3.5). Post-
hoc comparisons between regressions of each temperature treatment indicated that
one set of global parameters could be used to describe the data for 20 and 26 oC
(p>0.1). The slopes of the regression did not differ significantly among the three
temperature treatments (p>0.5), consequently a common regression coefficient can
be used across all temperatures:
TE (20-26oC; kJ kg-0.8) = 88.72DE068.0 + (r2=0.55; n=18) (3.9)
TE (14oC; kJ kg-0.8) = 00.64DE068.0 + (r2=0.45; n=9) (3.10)
59
3.4.2 MO2SDA Curve fitting
Quadratic equations over the MO2sda-d responses (Figure 3.2) are given
below. Estimates for the 14 oC treatment have poor coefficient of determination (r2)
values as estimates were based on data collected up to 72 h post feeding and before
the full SDA response was completed.
XS mulloway
MO2SDA (14 oC) = 105.9 + 0.75t - 0.012t2 (r2 = 0.26) (3.11)
MO2SDA (20 oC) = 176.1 + 2.11t - 0.041t2 (r2 = 0.57) (3.12)
MO2SDA (26 oC) = 241.5 + 8.12t - 0.227t2 (r2 = 0.68) (3.13)
S mulloway
MO2SDA (14 oC) = 96.0 + 0.54t - 0.009t2 (r2 = 0.18) (3.14)
MO2SDA (20 oC) = 158.5 + 1.72t -0.0341t2 (r2 = 0.59) (3.15)
MO2SDA (26 oC) = 214.0 + 4.75t - 0.129t2 (r2 = 0.70) (3.16)
M mulloway
MO2SDA (14 oC) = 84.9 + 0.96t -0.013t2 (r2 = 0.29) (3.17)
MO2SDA (20 oC) = 139.0 + 2.12t - 0.037t2 (r2 = 0.58) (3.18)
MO2SDA (26 oC) = 177.2 + 5.12t - 0.127t2 (r2 = 0.61) (3.19)

60
Table 3.6. Summary of SDA MO2 results (mean±se) for XS, S and M size mulloway at 14, 20 and 26oC. All data analyzed by ANOVA except for MO2sda-p, MO2scope and MO2sda which were analyzed using ANCOVA (RFI as covariate). Means sharing superscript letters are not significantly different (p>0.05) according to Tukey-Kramer test.
XS S M Variable 14oC 20oC 26oC 14oC 20oC 26oC 14oC 20oC 26oC RFI (g kg-1) 10.8±0.4a 19.9±1.8bc 24.5±0.4c 11.1±0.6a 16.8±1.3ab 23.3±0.4bc 21.3±1.2bc 24.8±2.0c 26.2±2.0c
MO2sda-p
(mg O2 kg-1) 117.7±2.6b 203.2±3.8e 313.5±3.0g 103.9±1.7b 180.5±3.3d 257.6±4.0f 102.7±3.5a 169.2±1.6c 229.0±8.8e
MO2sda-d (h) 78.8±3.0de 57.9±1.3bc 40.5±1.5a 86.2±5.6e 60.5±0.9c 43.6±0.3ab 88.9±5.9e 64.1±2.4cd 44.9±1.3ab
MO2sda-pd (h) 31.2±1.1d 25.7±0.9cd 17.0±0.4a 29.3±0.7cd 24.8±1.9bc 18.4±0.1a 37.7±1.8e 28.3±1.1cd 20.1±1.0ab
MO2scope (MO2sda-p MO2rmr -s
-1) 1.30±0.02ab 1.27±0.02a 1.54±0.03ab 1.37±0.03b 1.31±0.03ab 1.47±0.03ab 1.45±0.06ab 1.43±0.13ab 1.52±0.04ab
MO2sda (mg O2 kg-1) 1586±139ab 1756±227a 3371±200b 1827±65ab 1844±148ab 2555±173ab 2022±154a 2299±587a 2472±252a
SDAE (%) 18.1±1.0ab 15.9±2.2a 29.0±0.8b 22.0±1.5ab 18.1±1.3ab 25.0±1.4ab 24.5±2.8ab 22.8±5.2ab 26.6±1.4ab
SDA co-ef (%) 11.5±0.9abc 7.1±1.4a 10.7±0.5abc 12.8±0.6c 8.6±0.8ab 8.5±0.5ab 7.4±0.2ab 7.0±1.3a 7.3±0.4ab
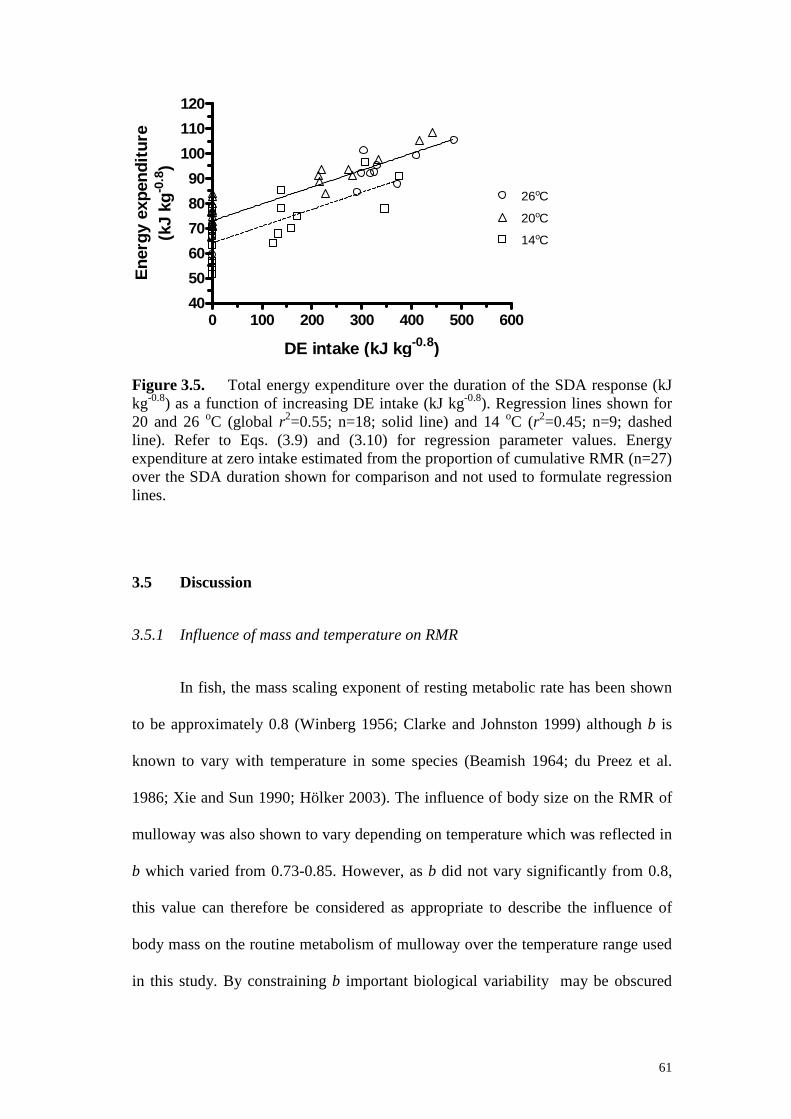
61
0 100 200 300 400 500 60040
50
60
70
80
90
100
110
120
20oC
26oC
14oC
DE intake (kJ kg-0.8)
En
erg
y ex
pen
dit
ure
(kJ
kg-0
.8)
Figure 3.5. Total energy expenditure over the duration of the SDA response (kJ kg-0.8) as a function of increasing DE intake (kJ kg-0.8). Regression lines shown for 20 and 26 oC (global r2=0.55; n=18; solid line) and 14 oC (r2=0.45; n=9; dashed line). Refer to Eqs. (3.9) and (3.10) for regression parameter values. Energy expenditure at zero intake estimated from the proportion of cumulative RMR (n=27) over the SDA duration shown for comparison and not used to formulate regression lines.
3.5 Discussion
3.5.1 Influence of mass and temperature on RMR
In fish, the mass scaling exponent of resting metabolic rate has been shown
to be approximately 0.8 (Winberg 1956; Clarke and Johnston 1999) although b is
known to vary with temperature in some species (Beamish 1964; du Preez et al.
1986; Xie and Sun 1990; Hölker 2003). The influence of body size on the RMR of
mulloway was also shown to vary depending on temperature which was reflected in
b which varied from 0.73-0.85. However, as b did not vary significantly from 0.8,
this value can therefore be considered as appropriate to describe the influence of
body mass on the routine metabolism of mulloway over the temperature range used
in this study. By constraining b important biological variability may be obscured

62
(Clarke and Johnston 1999), however, a then exclusively describes the influence of
temperature, and experimental conditions, on metabolic rate and the error associated
with a is considerably reduced (Table 3.3). Eqs. (3.1) and (3.2) provide predictions
of the routine metabolic demand for O2 by juvenile mulloway based on BW and
temperature (14 to 26 oC) and give estimations which are very close to those
published for this species using different size fish to those used in the current study
(Fitzgibbon et al. 2007b; Chapter 2).
It is important to consider where in the metabolic scope of activity
measurements are derived (i.e. from basal through to maximal metabolic rate). In
mammals b is positively correlated with increasing levels of metabolic activity
(Savage et al. 2004b; Weibel et al. 2004; White and Seymour 2005a) and similar
trends were observed with mulloway in the current study; across all temperatures b
increased with the increased metabolic activity of peak MO2 associated with SDA.
In mulloway the relationship between mass and metabolism appears to become less
allometric and more isometric (i.e. as b approaches 1) with increasing levels of
metabolic activity, particularly at lower temperatures. However, this relationship
requires further validation as the size range of mulloway used in the present study
may influence the value of b. The conditions in which data are derived and the size
ranges of animals used are known to effect exponent values (White and Seymour
2005b) emphasizing the importance of standardizing experimental procedures,
clearly defining the metabolic level being measured and, consequently, raising
caution when attempting to make inter or intraspecific comparisons across different
studies.

63
3.5.2 SDA response
3.5.2.1 SDA duration
The SDA responses in mulloway were typical of those exhibited by other
fish and ectothermic species: metabolic rate increased following ingestion of feed
and then gradually declined over a number of days with the duration of the SDA
and peak time response markedly affected by both temperature and body size
(Jobling and Davies 1980; Boyce and Clarke 1997; McCue 2006; Secor 2009). SDA
durations of approximately 40 to 90 h for mulloway fall within the ranges reported
for other temperate fish species (reviewed by McCue 2006) but are much lower than
some Antarctic species which are reported at 240-390 h at ~0 oC (Boyce and Clarke
1997). Gastric evacuation time is strongly correlated with SDA duration (Jobling
and Davies 1980) and this was indicated in mulloway at each temperature with the
absence of feed in the digestive tract of fish sub-sampled at the conclusion of MO2
readings. Although MO2 readings at 14 oC were ended at 72 h, and before the full
SDA duration was completed, the absence of feed combined with MO2 rates which
had returned to RMR levels at day 6 post-feeding lends support to our estimation of
approximately 80-90 h SDA duration at this temperature.
3.5.2.2 SDA factorial scope
While body size clearly influences the overall SDA duration, it has been
shown to have little effect on the post-prandial factorial scope in fish (Jobling and
Davies 1980; Johnston and Battram 1993) which was also confirmed with
mulloway in this study. Temperature is also considered not to have a large influence
on factorial scope (Jobling and Davies 1980; Johnston and Battram 1993) however

64
mulloway were shown to have a significantly greater factorial scope at 26 oC than at
14 or 20 oC. The largest difference between temperature treatments however,
although statistically significant, was on average 0.17. This tends to support the
conclusions of other studies that the influence of temperature on factorial scope is
quite small. It should be noted however, that factorial scope is a relative unit
expressed as a multiple of RMR levels and large differences can be seen in peak
MO2 between treatments when expressed in absolute terms (Peck 1998; Figure 3.2).
The factorial scope of mulloway demonstrated in the current study (1.3-1.5) is at the
low end compared to those for other fish species which can range from 1.4 – 4.1
(see review by McCue 2006) however; there are several contributing reasons for
this. Firstly, the magnitude of the SDA response is greatly affected by meal size
(Hamada and Maeda 1983; Boyce and Clarke 1997; Fu et al. 2005). In this study
mulloway ate approximately 2 % of their body weight which, although typical for
this species fed to satiation on the type of feed used in this study (Chapter 4), may
be considered small compared to other species such as southern catfish (Silurus
meridionalis) which have a correspondingly higher factorial scope of 4.1 when the
relative meal size is 24 % (Fu et al. 2005). Secondly, the factorial scope in the
current study is reported relative to RMR which will vary among species depending
on their normal resting or routine level of activity. Thirdly, factorial scope is
sometimes reported relative to standard or basal metabolic rates (e.g. Beamish 1974;
Chen et al. 2008) which will increase values. Lastly, our values for mulloway are
derived from the models fitted to the data and will therefore slightly underestimate
the maximal recorded values.
65
3.5.2.3 SDA coefficient and energy expenditure
At approximately 7-13 %, the average SDA coefficient for mulloway, i.e.
the energy devoted to the SDA response as proportion of the energetic content of a
meal, was within the range reported for most temperate fish species (6-23 %)
(Pandian and Vivekanandan 1985; McCue 2006). The SDA coefficient is known to
be influenced by body size (Beamish 1974), meal size (Carter and Brafield 1992; Fu
et al. 2006), meal type (Secor and Boehm 2006) and, in the case of mulloway, the
influence of body size on the SDA coefficient varied depending on temperature
which was likely due to the corresponding interaction between body size and
temperature on relative feed intake (Table 3.6). The influence of these variables on
the SDA coefficient therefore makes direct comparison amongst other studies very
difficult (Beaupre 2005; McCue 2006). Expressing total energy expenditure as a
function of DE intake independent of body weight (Figure 3.5) perhaps gives a
somewhat better insight into SDA energetics as it at least avoids the potential
confounding caused by the allometric relationships associated with body mass and
meal size inherent when making comparisons of coefficients derived from mass-
specific data (Beaupre 2005). When expressed this way total energy expenditure by
mulloway was shown to increase linearly with increasing DE intake. Temperature is
generally considered to have little influence on SDA expenditure (see reviews by
McCue 2006; Secor 2009) although temperature effects have been noted in some
fish species (Guinea and Fernandez 1997; Peck et al. 2003; Luo and Xie 2008).
Although values for MO2sda-p, MO2sda-pd and MO2sda-d all differed among
temperatures irrespective of the size class of mulloway, energy expenditure (kJ kg-
0.8) relative to intake (kJ kg-0.8) was shown to be very similar at 20 and 26 oC and
approximately only 9 kJ kg-0.8 less at 14 oC. The absolute difference among these

66
temperatures remained constant because the DE utilization efficiency was
approximately the same at all temperatures for any given quantity of feed (see also
Chapter 4). The difference in magnitude however will decrease exponentially with
increasing feed intake from approximately 12 % difference at zero intake to 8 %
difference at an intake of 500 kJ kg-0.8.
Mulloway are a eurythermal species typically found in warm-temperate to
sub-tropical estuaries and near-shore waters (Harrison and Whitfield 2006;
Silberschneider and Gray 2008) where temperatures of 20 or 26 oC are not
uncommon (Harrison 2004; Harrison and Whitfield 2006). If metabolic rates are
dependent on the temperature-sensitive properties of enzymes and cellular
components which in turn determine thermal optima (Hochachka and Somero
2002), the similar net response on energy expended due to SDA by mulloway at 20
and 26 oC may be indicative of the biochemical rate processes operating within a
thermal range suitable for normal metabolic function. In ectotherms there is a
negative correlation between peak SDA metabolism and the duration of the SDA
response which is dependant on temperature (McCue 2006). When peak SDA
increases there is a corresponding decrease in SDA duration; the resultant net
energy expenditure being similar (Wang et al. 2003; Secor et al. 2007; Luo and Xie
2008). This response was seen with mulloway and is typical of most temperature
performance curves recorded for ectotherms (Angilletta et al. 2002) and
demonstrates the trade off between the “specialist” (high narrow peak) and the
“generalist” (low broad peak) metabolic responses (see Huey and Hertz 1984;
Gilchrist 1995).
It is important to note that RMR represents the major proportion of the total
energy expended during the SDA period (Tables 3.6), the greatest proportion of

67
SDA above RMR occurred at 26 oC accounting for approximately 27 % of the total
energy expenditure and is likely to be related to the energetic cost incurred for
increased protein turnover and synthesis (Houlihan et al. 1988; Brown and Cameron
1991). This indicates a greater potential for growth at this temperature which has
been confirmed in other feeding studies with mulloway (Chapter 4). Although
mulloway are a relatively sedentary species, the above values demonstrate a
relatively high proportion of DE intake dedicated to maintaining routine metabolism
and, although comparable to values reported for some teleost species (Carter and
Brafield 1992; Xie et al. 1997; Owen 2001), indicates a moderate scope for growth
particularly when compared to the high-energy-demand species such as the
yellowtail (Seriola quinqueradiata) (Watanabe et al. 2000a) and southern bluefin
tuna (Thunnus maccoyii) (Fitzgibbon et al. 2007a).
3.5.3 Conclusion
RMR and SDA were shown to represent significant energetic costs in the
overall energy budget of mulloway. Many of the SDA indices measured in this
study were within the ranges of those reported for other temperate marine fish;
however, we have demonstrated that these values are not fixed and are highly
dependent on temperature, body size and feed intake. We have therefore presented
equations as a function of these variables which will allow greater accuracy in the
bioenergetic modeling of metabolic expenditure for this species.
If the greatest proportion of SDA energy is channeled towards the
biochemical processes that contribute to growth (Wieser 1994; Willmer et al. 2000),
it would then appear that the growth rate potential of mulloway may be limited at 14

68
and 20oC (compared to 26 oC). The gathering body of information on the
temperature responses of various metabolic, growth and preference parameters
measured for mulloway thus far indicate that a temperature of approximately 26±2
oC to be optimal for growth and metabolic function (Bernatzeder and Britz 2007;
Collett et al. 2008; Chapter 2, 4). It is not known what the SDA response in
mulloway is at temperatures above 26 oC; however, there are indications the SDA
coefficient may be reduced in some ectotherms at elevated temperatures (Cui and
Wootton 1988; Toledo et al. 2003).
69
Chapter 4
Protein and Energy Utilization and the Requirements for
Maintenance in Juvenile Mulloway3
3The following chapter is published as:
Pirozzi, I., Booth, M.A., Allan, G.L., In press. Protein and energy utilization and the requirements for maintenance in juvenile mulloway (Argyrosomus japonicus). Fish Physiol. Biochem. doi: 10.1007/s10695-10008-19296-10690.
4.1 Abstract
This study described the digestible protein (DP) and digestible energy (DE)
utilization in juvenile mulloway and determined the requirements for maintenance.
This was achieved by feeding triplicate groups of fish weighing 40 or 129 g held at
two temperatures (20 oC or 26 oC) a commercial diet (21.4 g DP MJ DE-1) at four
different ration levels ranging from 0.25% initial body weight to apparent satiation
over 8 weeks. Weight gain and protein and energy retention increased linearly with
increasing feed intake. However, energy retention efficiency (ERE) and protein
retention efficiency (PRE) responses were curvilinear with optimal values,
depending on fish size, approaching or occurring at satiated feeding levels.
Maximum predicted PRE was affected by body size but not temperature; PRE
values were 0.50 and 0.50 for small mulloway and 0.41 and 0.43 for large mulloway
at 20 oC and 26 oC respectively. ERE demonstrated a similar response; with values
of 0.42 and 0.43 for small and 0.32 and 0.34 for large mulloway at 20 oC and 26 oC
respectively. Utilization efficiencies for growth based on linear regression for DP

70
(0.58) and DE (0.60) were independent of fish size and temperature. The partial
utilization efficiencies of DE for protein (kp) and lipid (kl) deposition estimated
using a factorial multiple regression approach were 0.49 and 0.75 respectively.
Maintenance requirements estimated using linear regression were independent of
temperature for DP (0.47g DP kg-0.7 day-1) while maintenance requirements for DE
increased with increasing temperature (44.2 to 49.6 kJ DE kg-0.8 day-1). Relative
feed intake was greatest for small mulloway fed to satiation at 26 oC and this
corresponded to a greater increase in growth. Large mulloway fed to satiation ate
significantly more at 26 oC but did not perform better than the corresponding
satiated group held at 20 oC. Mulloway should be fed to satiation to maximize
growth potential if diets contain 21.4 g DP MJ DE-1.
4.2 Introduction
The utilization of digestible protein (DP) and digestible energy (DE) by
growing animals is dependant on the composition of the diet and the efficiency with
which deposition occurs (van Milgen and Noblet 2003; Schroeder and Titgemeyer
2008). In fish, patterns of protein deposition with increasing levels of DP intake
vary considerably between species, diet and experimental conditions and responses
have been described as linear (Lupatsch et al. 2001a; Fournier et al. 2002; Lupatsch
and Kissil 2005; Peres and Oliva-Teles 2005) or curvilinear (Huisman et al. 1979;
McGoogan and Gatlin 1998; Watanabe et al. 2000b; Bureau et al. 2006). These
responses indicate that the utilization efficiencies are either constant or tend to
plateau with increasing protein intake. Unfortunately, such variations emphasize the
need to determine nutrient retention profiles and utilization efficiencies of growing
71
fish on a species by species basis. Understanding how nutrients are utilized is an
essential step towards developing bioenergetic models that predict growth
responses, feeding requirements and nutrient losses to the environment (Bureau et
al. 2002).
The concept of maintenance requirements is one that may be considered as
paradoxical with regard to growing animals but it is a concept that has proved useful
for animal nutritionists because it allows the partitioning of production and
maintenance costs based on the assumption that the two are additive (van Milgen et
al. 2000; Bureau et al. 2002). Maintenance DE requirements for fish have been
shown to range from 32 – 77 kJ DE kg-0.8 day-1 (Watanabe et al. 2000a; Lupatsch
and Kissil 2005) and vary depending on temperature, species and fish size.
Published maintenance requirement values for DP are less common in the literature
but values of 0.45 - 0.96 g DP kg-0.7 day-1 have been recorded (Lupatsch et al. 1998;
Lupatsch and Kissil 2003; Peres and Oliva-Teles 2005; Glencross 2008).
The objectives of this study were to determine i) the protein and energy
utilization responses to increasing DE and DP intake, ii) the efficiencies of DP and
DE utilization, and iii) the maintenance requirements of juvenile mulloway. This
was achieved using two size classes of mulloway (40 or 129 g) at two temperatures
(20 oC or 26 oC).
4.3 Materials and methods
4.3.1 Experiment design
The protein and energy utilization of mulloway was tested by feeding four
different ration levels ranging from 0.25 % of initial body weight (ibw) using a

72
commercial diet (Ridley AquaFeed Pty. Ltd., Narangba, Qld. Australia) to two size
treatments (small or large; ibw (mean±SD) = 40.2±5.7 g and 129.3±17.2 g) at two
temperatures (20 or 26 oC). The experiment was run over 8 weeks using fish
produced at the New South Wales Department of Primary Industries, Port Stephens
Fisheries Institute (PSFI). Fish were stocked into 200 l white opaque tapered
cylindrical tanks (Dimensions: Top diameter = 78 cm; Bottom diameter = 68 cm;
Height = 55 cm) at 40 small or 12 large fish tank-1. Mulloway are a gregarious
species and stocking densities were chosen to optimize growth potential (Appendix
1). Each size and ration treatment were randomly assigned to triplicate tanks within
each temperature treatment with each tank constituting an experimental unit.
4.3.2 Experiment system
The experiment system consisted of two separate 1700 l recirculating bio-
filtration units each supplying 24 x 200 l replicate tanks (each unit total volume ≈
6500 l). The temperature for each unit was controlled with a chiller and immersion
heater in an antagonistic mode which allowed precise temperature control of ±0.5
oC of the set temperature. All fish were initially stocked at 23 oC and the
temperature adjusted 1 oC day-1 until the experiment temperatures were reached.
Flow to each tank was approximately 4 l min-1 and orientated to create a weak
centripetal current which allowed the retention of feed pellets in the tank while
removing faeces via a central upright 32 mm diameter pvc overflow pipe which was
fixed approximately 1 cm off the bottom of each tank. Black plastic sheets were
placed around each tank and across the top front half to minimise disturbance. All
tanks were exposed to indirect natural light (photoperiod 13L:11D). Ammonium
73
(NH4+) (<0.1 mg l-1), dissolved oxygen (>5.0 mg l-1), pH (7.5 - 7.8) and salinity (30
- 34 ppt) were monitored regularly throughout the duration of the experiment.
4.3.3 Feed and feeding
Proximate composition of the diet was (g kg-1): 961 dry matter; 90 ash; 455
crude protein; 187 fat and 22.2 MJ kg-1 gross energy. The apparent digestibility co-
efficient for protein was 0.88 and energy was 0.84 (Booth, unpublished data 2008).
Fish were fed 6 mm extruded sinking pellets from once up to four times
daily depending on ration size to improve the likelihood of all fish obtaining pellets
in the lower ration treatments or to maximize voluntary daily feed intake in the
higher ration treatments. Any uneaten pellets were counted then siphoned from
tanks approximately 45 min after initial feeding. Total daily feed intake was
adjusted accordingly (predetermined individual pellet weight mean±SD = 0.21±0.02
g; n = 202). The commercial feed used in this study had excellent water stability and
it was assumed nutrient losses through leaching were insignificant.
4.3.4 Sample preparation and analyses
Fish were fasted for 48 h prior to sampling for carcass composition. Initial
representative samples of 10 fish of each size class were collected before the start of the
experiment and frozen (-20 oC). At the conclusion of the feeding trial all fish were
euthanized with an overdose of benzocaine (ethyl-p-aminobenzoate), weighed and
stored frozen for compositional analyses. Compositional changes in energy, lipid, ash
and moisture were estimated by comparing the initial fish carcass samples with those

74
from the feeding trial. Estimates of initial whole body protein were based on the
compositional value of 191.4 g kg-1. This value was derived in a separate study
(Chapter 6) to establish the compositional profile of mulloway where several hundred
fish were sampled in groups representing size classes ranging from 2 – 2100 g (n = 3 –
100 fish per group depending on size). Using this value was necessary because of a data
transcription error with the original initial values for protein composition. All other
initial compositional constituents appeared to be true representations of the initial
carcass composition. Assuming a fixed initial whole body protein composition is valid
as the proportional relationship between body protein and body weight in fish is known
to be relatively constant (Shearer 1994; Lupatsch et al. 1998; Dumas et al. 2007).
Whole carcass composition was determined by placing the weighed fish into 5 l
glass beakers, covering with aluminum foil and then autoclaving for 99 min at 121 oC.
After cooling to room temperature any changes in weight were accounted for and
assumed to be changes in moisture content. The samples were then homogenised in situ
with a hand blender and a sub-sample taken for dry matter determination. A portion of
the remaining homogenate was then transferred to plates and oven dried at
approximately 80 oC. The desiccated samples were then finely ground in a laboratory
blender and analysed in accordance with AOAC (2005). Protein was calculated from
total nitrogen based on N x 6.25 using the Dumas method. Dry matter was calculated
gravimetrically after oven drying at 105 oC. Ash was calculated gravimetrically. Gross
energy was determined by adiabatic bomb calorimetry. Fat was measured
gravimetrically after chloroform-methanol extraction.
The following performance indices were calculated for each treatment
group:

75
Daily weight gain (g fish-1 day-1) = Final body weight (fbw) – ibw / number of days
Daily protein gain (g fish-1 day-1) = Final carcass protein content – 0.1914 x initial
sample bw / number of days
Daily energy gain (kJ fish-1 day-1) = Final carcass energy content – initial carcass
energy content / number of days
Feeding Efficiency (FE) = Weight gain / Total feed intake
Protein Retention Efficiency (PRE) = Protein gain / Total DP intake
Energy Retention Efficiency (ERE) = Energy gain / Total DE intake
Data are also expressed as geometric mean body weights (GMBW) and
scaled using the metabolic body weight exponent value of 0.7 for protein retention
data and 0.8 for energy retention data (after Brett and Groves 1979; Lupatsch et al.
1998).
4.3.5 Data analyses
The effects of varying feed ration (fixed; 4 levels) at different temperatures
(fixed; 2 levels) on performance indices and compositional data were tested with 2-
way ANOVA for each size class (fbw was not a significant co-variant for analyses
of compositional data). Formal comparisons using ANOVA were not made between
76
sizes as ration levels were not orthogonal. Normality of the data was checked with
skewness, kurtosis and omnibus normality tests. Assumptions of homogeneity of
variances were tested using modified Levenes’ equal variance test. Tukey-Kramer
test was used for a posteriori multiple comparison of means on significant terms.
All results were regarded as significant at p<0.05. Data were normally distributed
for all performance indices for large fish at both temperatures. Data were non-
normally distributed for FE, PRE and ERE for small fish at 20 oC and for FE and
PRE for small fish at 26 oC; these data could not be normalized. ANOVA was still
performed and due regard should be given to subsequent interpretations of the
results. All performance indices and carcass composition data variances were
homogenous (Levene’s; p>0.05).
Nonlinear regression was applied to PRE data where the asymptote of the
quadratic function was considered as the optimal daily dietary DP intake giving the
maximum predicted PRE value (Shearer 2000).
Daily maintenance requirements for dietary protein and energy at 20 and 26
oC were estimated using linear regression of daily intake and gain where the x-
intercept describes the daily requirement for maintenance, the slope of regression
describes the utilization efficiency and the reciprocal of the slope describes the
nutrient cost of production.
Partial energy efficiencies for protein and lipid deposition were further
investigated using the factorial method based on Kielanowski (1965) where DE
intake can be partitioned as:
DE intake (kJ kg-b day-1) = DEm + PD/kp + LD/kl

77
Where DEm = daily maintenance energy requirement (kJ DE kg-b day-1); PD =
energy retained as protein (kJ day-1); kp = partial energy efficiency for protein
deposition; LD = energy retained as lipid (kJ day-1); kl = partial energy efficiency
for lipid deposition. The metabolic weight exponent (b) was estimated
simultaneously with the above parameters which gave values of 0.817(±0.05) and
0.784(±0.07) at 20 and 26 oC respectively. These values were statistically
indistinguishable from the common inter-specific exponent value of 0.8 applied to
energy metabolism of teleost fishes (Clarke and Johnston 1999). A fixed exponent
value of 0.8 was therefore used in the model to estimate parameters DEm, kp and kl.
Least squares regression method assumes normally distributed residuals therefore
robust multiple regression was used which minimizes the influence of outliers on
coefficient estimates (Montgomery and Peck 1992).
The heat of combustion values for protein and lipid required to determine
PD and LD (above) were also derived using robust multiple regression however
with the y-intercept term removed from the regression model:
RE (kJ) = a x PD + c x LD
Where RE = retained energy (kJ); a = protein heat of combustion (kJ g-1); c = lipid
heat of combustion (kJ g-1); PD = protein deposition (g); LD = lipid deposition (g)
4.4 Results
Survival at the end of the experiment was 100 %. The effect of ration on
weight, protein and energy gain in small mulloway varied significantly depending

78
on temperature (Table 4.1). Weight, protein and energy gain were significantly
higher at the highest ration level at 26oC for small mulloway (Table 4.2). Ration
level but not temperature affected the weight, protein and energy gain of large
mulloway (Table 4.1). Large mulloway fed to satiation at 26 oC also demonstrated
higher gain but this was significantly different from the satiated treatment at 20 oC
only for protein retention (Table 4.2). Relative feed intake (RFI) was significantly
greater at the satiated level for small mulloway at 26 oC (p<0.05) with 6.1±0.2 g kg-
0.7 day-1 consumed compared to 5.1±0.1 g kg-0.7 day-1 at 20 oC. RFI was also
significantly greater for large mulloway at 26oC (p<0.05) with 5.4±0.1 g kg-0.7 day-1
consumed compared to 4.4±0.2 g kg-0.7 day-1 at 20 oC.
Table 4.1. Two-way ANOVA on performance indices and carcass composition (as received basis) for both small and large mulloway. ns = not significant at p<0.05, * = p<0.05, ** = p<0.01
Source of Variation
Variable Small Large Temp. Ration Interaction Temp. Ration Interaction Performance Indices Weight gain ns ** ** ns ** ns Protein gain ns ** ** ns ** ns Energy gain ns ** ** ns ** ns FE ** ** ** * ** ns PRE ns ** ns ns ** ** ERE ns ** ns ns ** ns Carcass Composition Protein ** ns ns ** ** ns Lipid ns ** ** ns ** ** Moisture ** ** ns ** ** ns Ash ** ** ** ** ** ns Energy ns ** ns ns ** ns

79
4.4.1 Utilization efficiencies and maintenance requirements
The effect of ration on FE varied significantly depending on temperature for
small mulloway while both ration and temperature significantly, but independently,
affected FE for large mulloway (Table 4.1). PRE was significantly influenced by
ration but not temperature in small mulloway while the influence of ration on PRE
in large mulloway was dependent on temperature (Table 4.1). The interaction
occurred because of the relatively better PRE value at 26 oC compared to 20 oC
when large mulloway were fed the lowest ration level (Table 4.2). ERE in small and
large mulloway was significantly influenced by ration but not temperature (Table
4.1).
PRE in mulloway demonstrated a curvilinear response to increasing DP
intake. Temperature had little effect on the maximum predicted PRE provided that
DP intake was increased with increasing temperature (Figure 4.1). Body size,
however, did influence PRE (Table 4.2) with the maximum predicted PRE for small
mulloway 0.50 and 0.50 and large mulloway 0.41 and 0.43 at 20 oC and 26 oC
respectively. The daily protein intake to achieve maximum predicted PRE was 1.7
and 2.0 g DP kg-0.7 day-1 at 20 oC and 26 oC respectively (Figure 4.1). The
relationship between digestible protein intake (g DP kg-0.7 day-1) and PRE can be
described as:
PRE (20 oC) = -0.542 + 1.162DP - 0.337DP2 (r2 = 0.89, n = 24) (4.1)
PRE (26 oC) = -0.418 + 0.887DP + -0.222DP2 (r2 = 0.87, n = 24) (4.2)

80
0.5 1.0 1.5 2.0 2.5 3.0
-0.4
-0.2
0.0
0.2
0.4
0.620oC Small
20oC Large
26oC Small
26oC Large
DP Intake (g kg-0.7 day-1)
PR
E
Figure 4.1. Effect of digestible protein intake (g kg-0.7 day-1) on PRE at 20 oC (dashed line) and 26o C (solid line).
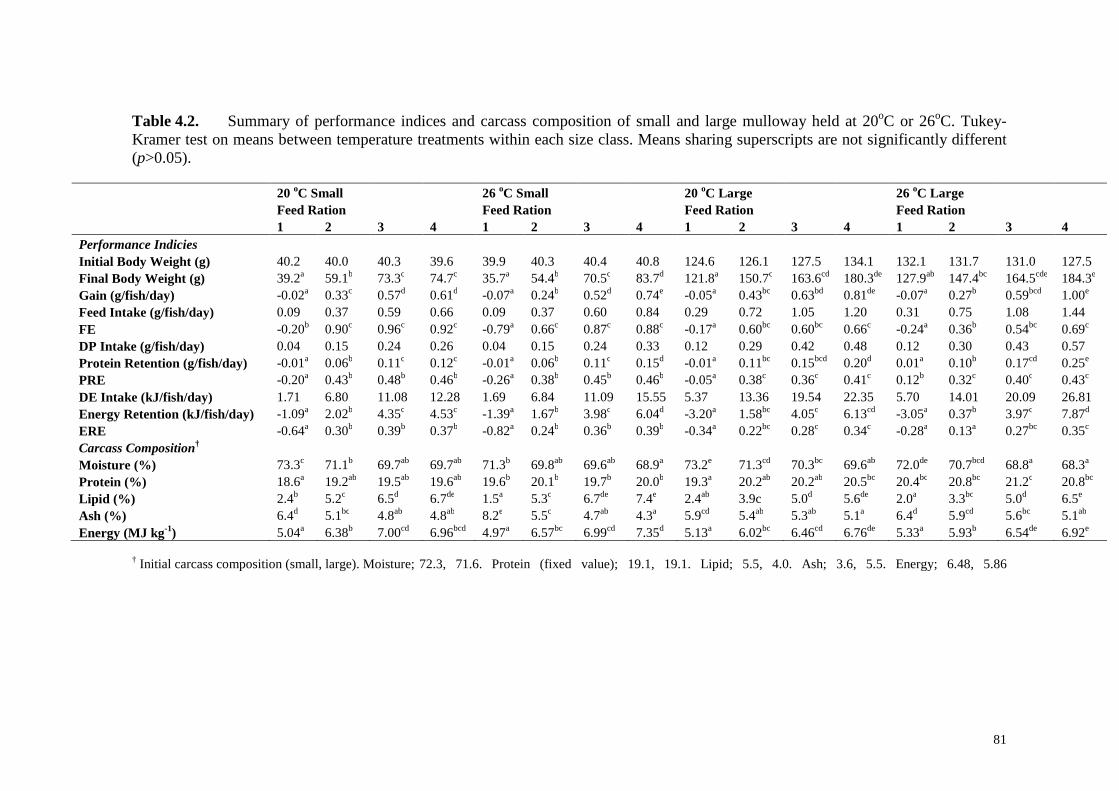
81
Table 4.2. Summary of performance indices and carcass composition of small and large mulloway held at 20oC or 26oC. Tukey-Kramer test on means between temperature treatments within each size class. Means sharing superscripts are not significantly different (p>0.05).
20 oC Small 26 oC Small 20 oC Large 26 oC Large Feed Ration Feed Ration Feed Ration Feed Ration 1 2 3 4 1 2 3 4 1 2 3 4 1 2 3 4 Performance Indicies Initial Body Weight (g) 40.2 40.0 40.3 39.6 39.9 40.3 40.4 40.8 124.6 126.1 127.5 134.1 132.1 131.7 131.0 127.5 Final Body Weight (g) 39.2a 59.1b 73.3c 74.7c 35.7a 54.4b 70.5c 83.7d 121.8a 150.7c 163.6cd 180.3de 127.9ab 147.4bc 164.5cde 184.3e Gain (g/fish/day) -0.02a 0.33c 0.57d 0.61d -0.07a 0.24b 0.52d 0.74e -0.05a 0.43bc 0.63bd 0.81de -0.07a 0.27b 0.59bcd 1.00e
Feed Intake (g/fish/day) 0.09 0.37 0.59 0.66 0.09 0.37 0.60 0.84 0.29 0.72 1.05 1.20 0.31 0.75 1.08 1.44 FE -0.20b 0.90c 0.96c 0.92c -0.79a 0.66c 0.87c 0.88c -0.17a 0.60bc 0.60bc 0.66c -0.24a 0.36b 0.54bc 0.69c
DP Intake (g/fish/day) 0.04 0.15 0.24 0.26 0.04 0.15 0.24 0.33 0.12 0.29 0.42 0.48 0.12 0.30 0.43 0.57 Protein Retention (g/fish/day) -0.01a 0.06b 0.11c 0.12c -0.01a 0.06b 0.11c 0.15d -0.01a 0.11bc 0.15bcd 0.20d 0.01a 0.10b 0.17cd 0.25e
PRE -0.20a 0.43b 0.48b 0.46b -0.26a 0.38b 0.45b 0.46b -0.05a 0.38c 0.36c 0.41c 0.12b 0.32c 0.40c 0.43c
DE Intake (kJ/fish/day) 1.71 6.80 11.08 12.28 1.69 6.84 11.09 15.55 5.37 13.36 19.54 22.35 5.70 14.01 20.09 26.81 Energy Retention (kJ/fish/day) -1.09a 2.02b 4.35c 4.53c -1.39a 1.67b 3.98c 6.04d -3.20a 1.58bc 4.05c 6.13cd -3.05a 0.37b 3.97c 7.87d
ERE -0.64a 0.30b 0.39b 0.37b -0.82a 0.24b 0.36b 0.39b -0.34a 0.22bc 0.28c 0.34c -0.28a 0.13a 0.27bc 0.35c
Carcass Composition† Moisture (%) 73.3c 71.1b 69.7ab 69.7ab 71.3b 69.8ab 69.6ab 68.9a 73.2e 71.3cd 70.3bc 69.6ab 72.0de 70.7bcd 68.8a 68.3a
Protein (%) 18.6a 19.2ab 19.5ab 19.6ab 19.6b 20.1b 19.7b 20.0b 19.3a 20.2ab 20.2ab 20.5bc 20.4bc 20.8bc 21.2c 20.8bc
Lipid (%) 2.4b 5.2c 6.5d 6.7de 1.5a 5.3c 6.7de 7.4e 2.4ab 3.9c 5.0d 5.6de 2.0a 3.3bc 5.0d 6.5e
Ash (%) 6.4d 5.1bc 4.8ab 4.8ab 8.2e 5.5c 4.7ab 4.3a 5.9cd 5.4ab 5.3ab 5.1a 6.4d 5.9cd 5.6bc 5.1ab
Energy (MJ kg-1) 5.04a 6.38b 7.00cd 6.96bcd 4.97a 6.57bc 6.99cd 7.35d 5.13a 6.02bc 6.46cd 6.76de 5.33a 5.93b 6.54de 6.92e
† Initial carcass composition (small, large). Moisture; 72.3, 71.6. Protein (fixed value); 19.1, 19.1. Lipid; 5.5, 4.0. Ash; 3.6, 5.5. Energy; 6.48, 5.86

82
Energy retention efficiency demonstrated a similar curvilinear response
(Figure 4.2) with increasing DE intake and body weight greatly influencing the
efficiency values (Table 4.2). Temperature did not affect the maximum predicted
ERE values with 0.42, 0.44 and 0.32, 0.34 for small and large mulloway at 20 oC
and 26 oC respectively. The relationship between digestible energy intake (kJ DE
kg-0.8 day-1) and ERE can be described as:
ERE (20 oC) = -1.121 + 0.025DE - 0.0001DE2 (r2 = 0.94, n = 24) (4.3)
ERE (26 oC) = -1.128 + 0.028DE - 0.0001DE2 (r2 = 0.97, n = 24) (4.4)
The daily energy intake (kJ DE kg-0.8 day-1) to achieve a maximum predicted ERE
was 107 kJ DE kg-0.8 day-1 at 20oC and 125 kJ DE kg-0.8
day-1 at 26oC (Figure 4.2).
25 50 75 100 125 150 175
-1.00
-0.75
-0.50
-0.25
0.00
0.25
0.50
Small 20oC
Small 26oC
Large 26oC
Large 20oC
DE Intake (kJ kg-0.8 day-1)
ER
E
Figure 4.2. Effect of digestible energy intake (kJ kg-0.8 day-1) on ERE at 20 oC (dashed line) and 26 oC (solid line).
There was no temperature (p>0.5) or size effect (p>0.1) between the slopes
of regression when considering the relationship between protein intake (g DP kg-0.7
day-1) and protein gain (g kg-0.7 day-1) (Figure 4.3). A pooled value of 0.58±0.02

83
describes the utilization efficiency of protein for mulloway at 20 – 26 oC. The
relationship between protein gain (g kg-0.7 day-1) and DP intake (g kg-0.7 day-1) was
linear and can be described as:
Protein gain = 0.581DP - 0.272 (r2 = 0.97, n = 48) (4.5)
The corresponding cost of DP per unit of protein gain was 1.72 g g-1.
Temperature did not have a significant effect on maintenance requirements for
protein with the greatest difference of <0.1 g fish-1 (Figure 4.3). Estimates of
maintenance protein requirements for mulloway held at 20 – 26 oC are 0.47 g DP
kg-0.7 day-1.
0.5 1.0 1.5 2.0 2.5 3.0
-0.5
0.0
0.5
1.0
1.5Small 20oC
Large 20oC
Large 26oC
Small 26oC
DP Intake (g kg-0.7 day-1)
Pro
tein
gai
n(g
kg
-0.7
day
-1)
Figure 4.3. Effect of digestible protein intake (g DP kg-0.7 day-1) on protein gain (g kg-0.7 day-1).
There was no temperature (p>0.1) or size effect (p>0.5) between the slopes
of regression when considering the relationship between energy intake (kJ DE kg-0.8
day-1) and energy gain (kJ DE kg-0.8 day-1) (Figure 4.4). A pooled value of
0.60±0.01 describes the utilization efficiency of energy for mulloway at 20 – 26 oC.

84
The corresponding cost of DE per unit of energy gain is 1.66 kJ kJ-1. The
relationship between energy intake (kJ kg-0.8 day-1) and energy gain (kJ kg-0.8 day-1)
was linear and can be described as:
Energy gain (20 oC) = 0.604DE - 26.689 (r2 = 0.98, n = 24) (4.6)
Energy gain (26 oC) = 0.591DE – 29.302 (r2 = 0.98, n = 24) (4.7)
25 50 75 100 125 150 175
-30
-10
10
30
50
70Small 20oC
Large 20oC
Small 26oC
Large 26oC
DE Intake (kJ kg-0.8 day-1)
En
erg
y G
ain
(kJ
kg-0
.8 d
ay-1
)
Figure 4.4. Effect of digestible energy intake (kJ kg-0.8 day-1) on energy gain (kJ kg-0.8 day-1). Dashed lines = 20 oC; Solid line = 26 oC
The maintenance requirements for energy (kJ DE kg-0.8 day-1) varied
significantly depending on temperature (p<0.005) (Figure 4.4). Estimates of
maintenance energy requirements were 44.2 and 49.6 kJ DE kg-0.8 day-1 at 20 oC and
26 oC respectively.
Heat of combustion values derived using robust multiple regression analysis
were 22.9 and 37.0 kJ g-1 for protein and lipid respectively. Partial energy
efficiencies estimated using the factorial method were kp = 0.49±0.09 and kl =
0.75±0.19. Therefore, based on kp, kl and the heat of combustion values for protein

85
and lipid the energetic cost to mulloway to deposit 1 g of protein is 46.73 kJ and 1 g
of lipid is 50.0 kJ.
DEm was estimated at 43.0±3.8 kJ kg-0.8 day-1 using the factorial method and
compared well with estimates of 46.60±1.21 kJ DE kg-0.8 at zero energy gain (x-
intercept) derived using linear regression of combined temperature and size data
(Figure 4.4).
Figure 4.5 shows the response of energy gain as a function of DE intake
partitioned between protein energy (PE) and lipid energy (LE) where LE is
calculated as the difference between total energy gain and PE gain and assumes no
other contributing non-protein energy. There was no significant difference found
between the slopes (p>0.1) when comparing PE and LE. There was no significant
difference found when comparing the slopes (p>0.1) and y-intercepts (p>0.1)
between PE deposition at 20 oC or 26 oC. A common linear regression can describe
the relationship between PE deposition (kJ kg-0.8 day-1) and DE intake (kJ kg-0.8 day-
1) at these temperatures:
PE gain = 0.288DE – 8.213 (r2 = 0.98, n = 48) (4.8)
There was no temperature effect between slopes (p>0.5) with regard to LE
deposition however the y-intercepts differed significantly (p<0.0001). The
relationship between LE deposition (kJ kg-0.8 day-1) and DE intake (kJ kg-0.8 day-1)
can be described as:
LE gain (20 oC) = 0.304DE -17.960 (r2 = 0.97, n = 24) (4.9)
LE gain (26 oC) = 0.310DE - 21.280 (r2 = 0.98, n = 24) (4.10)
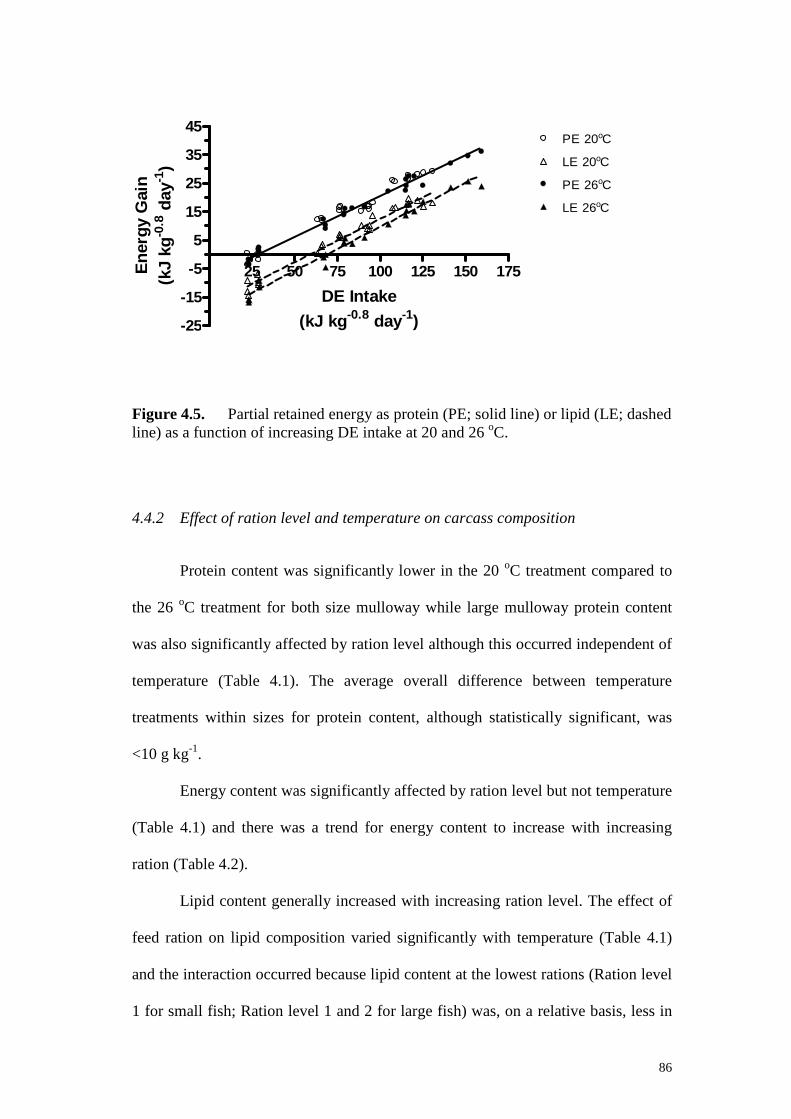
86
25 50 75 100 125 150 175
-25
-15
-5
5
15
25
35
45
LE 20oC
LE 26oC
PE 20oC
PE 26oC
DE Intake
(kJ kg-0.8 day-1)
En
erg
y G
ain
(kJ
kg-0
.8 d
ay-1
)
Figure 4.5. Partial retained energy as protein (PE; solid line) or lipid (LE; dashed line) as a function of increasing DE intake at 20 and 26 oC.
4.4.2 Effect of ration level and temperature on carcass composition
Protein content was significantly lower in the 20 oC treatment compared to
the 26 oC treatment for both size mulloway while large mulloway protein content
was also significantly affected by ration level although this occurred independent of
temperature (Table 4.1). The average overall difference between temperature
treatments within sizes for protein content, although statistically significant, was
<10 g kg-1.
Energy content was significantly affected by ration level but not temperature
(Table 4.1) and there was a trend for energy content to increase with increasing
ration (Table 4.2).
Lipid content generally increased with increasing ration level. The effect of
feed ration on lipid composition varied significantly with temperature (Table 4.1)
and the interaction occurred because lipid content at the lowest rations (Ration level
1 for small fish; Ration level 1 and 2 for large fish) was, on a relative basis, less in

87
the 26 oC treatment compared to the 20 oC treatment while at the higher ration
levels the opposite occurred; lipid content was greater in the 26oC treatment (Table
4.2).
Ash content in small mulloway demonstrated a similar, but opposite,
response to lipid content (Table 4.2). Ash content in large mulloway tended to be
higher at 26 oC and decrease with increasing ration level (Table 4.2).
Both temperature and ration level significantly, but independently, affected
moisture content in small and large mulloway (Table 4.1).
4.5 Discussion
Understanding how growth is affected by the ration level of a particular diet
is important in optimizing feeding strategies for aquaculture species. A curvilinear
response dictates that feeding restricted rations will maximize feeding efficiencies
while reducing waste outputs and increasing overall cost effectiveness. Conversely
a linear response determines feeding to satiation to achieve optimal growth and
feeding efficiencies. Growth and protein deposition in mulloway demonstrated a
linear response (Figure 4.3) while optimal retention efficiencies, depending on size,
approached or were at satiated intake levels (Figure 4.1). The largest difference in
PRE between the predicted optimal and satiated DP intake level occurred with small
mulloway at 26oC with a difference of only 0.07 g DP fish-1 day-1. The commercial
diet used in this study, which is also commonly used by farmers in Australia, should
therefore be fed to satiation to maximize growth potential and feeding efficiencies
in mulloway.
At 0.60, the energy utilization efficiency of mulloway is within the range

88
reported for other fish species (0.4 - 0.7; see Bureau et al. 2006). No significant
differences were found between the energy utilization efficiencies of the two size
classes of mulloway or temperatures used in this study. These observations have
been similarly demonstrated for European seabass (Dicentrarchus labrax)
(Lupatsch et al. 2001a), Asian seabass (also known as barramundi, Lates calcarifer)
(Lupatsch and Kissil 2003) and rainbow trout (Oncorhynchus mykiss) (Azevedo et
al. 1998). However, it may be that the ranges between the sizes and temperatures
studied were not sufficient to observe a shift in utilization efficiencies. Glencross
(2008) demonstrated an improvement in the energy utilization efficiencies for
growth with increasing size of barramundi of 0.61 for 15 g fish to 0.76 for 410 g
fish although the regression model appeared heavily influenced by the data set from
the satiated group of small fish in that study. This marked difference in the
utilization efficiency of dietary energy with size has important implications in
bioenergetic modelling and feed formulations for the species and warrants further
investigation.
The protein utilization efficiency of mulloway was 0.58 and independent of
temperature and size. Similar values and temperature effects have been
demonstrated with European seabass (0.52; 20-26 oC) (Lupatsch et al. 2001a),
barramundi (0.49-0.51; 21-30 oC) (Lupatsch and Kissil 2003; Glencross 2008) and
white grouper (Epinephelus aeneus) (0.54; 22-27 oC) (Lupatsch and Kissil 2005).
Peres and Oliva-Teles (2005) demonstrated a protein utilization efficiency of 0.64
for European seabass which is higher than that reported by Lupatsch et al. (2001a).
Differences in protein utilization efficiencies can, in part, be accounted for by the
amino acid composition of the diet (Sandberg et al. 2005b).
The partial energy retention efficiency of PE in mulloway (kp = 0.49) was
89
similar to and falls within the SEM ranges of kp values recorded for other
carnivorous fish species such as gilthead seabream (Sparus aurata) (0.53),
European seabass (0.53), white grouper (0.56) (Lupatsch et al. 2003b) and rainbow
trout (0.53) (Azevedo et al. 2005).
kl values for mulloway (0.75) are directly comparable to gilthead seabream
(0.76) (Lupatsch et al. 2003b) but are lower than those recorded for European
seabass (0.91) and white grouper (0.91) (Lupatsch et al. 2003b) although kl for
mulloway is still within the lower SEM range of these two species. Lupatsch et al.
(2003b) suggested that PE was also used in lipid deposition at higher PE intake
levels in gilthead seabream hence the lower kl value for that species and supported
this argument by demonstrating the non-linear response of PE deposition with
increasing PE intake. However, the relationship between PE deposition and PE
intake in mulloway was linear (r2 = 0.98). kl values of approximately 0.9 can be
expected if dietary lipid is the base nutrient for body lipid synthesis (Emmans 1994;
van Milgen et al. 2001; Lupatsch et al. 2003b) however, if lipids are also
synthesised from dietary energy supplied by carbohydrates then a reduction in kl
may be seen. The commercial diet used in this study contained 268 g kg-1 nitrogen–
free extract (NFE = 100 – (protein + lipid + ash) suggesting that non-lipid dietary
energy was available for lipid synthesis and may, in part, explain the relatively
lower kl value.
The proportional rate of deposition of protein:lipid remained relatively
constant with increasing DE intake for mulloway with LE deposited at a slightly
numerically greater rate (p>0.1) than PE (Figure 4.5). This is in contrast to rainbow
trout which show a clear decrease in protein:lipid deposition with increasing DE
intake (Rodehutscord and Pfeffer 1999; Bureau et al. 2006). The difference between
90
the partial energy utilization efficiencies of protein and lipid in mulloway may not
be of a sufficient magnitude to demonstrate a clear protein sparing effect if dietary
lipid levels were to be increased. This was demonstrated in Chapter 5 where
mulloway fed increasing levels of DP at either one of two fixed DE levels (16 or 21
MJ kg-1) showed no obvious protein sparing effect.
Values for maintenance energy requirements ranged from 44.2 to 49.6 kJ
DE kg-0.8 day-1 depending on temperature and fall within the maintenance DE values
common to other fish species (40 – 60 kJ DE kg-0.8 day-1; Bureau et al. 2002).
Protein requirements for maintenance for mulloway were 0.47 g DP kg-0.7 and were
found to be independent of temperature. Similar protein maintenance requirements
~0.45 g DP kg-0.7 day-1 (Lupatsch and Kissil 2003; Glencross 2008) and temperature
effects (Lupatsch and Kissil 2003) have also been demonstrated in barramundi.
Feeding at maintenance energy level does not necessarily imply that a
constant body weight is maintained. Pigs have been shown to maintain zero energy
retention while depositing protein and gaining body weight at the expense of body
lipid (Ledividich et al. 1980). In the current study the y-intercept for PE (Eq. 4.8)
was much larger than for LE (Eqs. 4.9, 4.10) therefore a DE intake at or slightly
above maintenance level will yield positive protein deposition in mulloway without
lipid gain. This has been demonstrated in yellowtail (Seriola quinqueradiata)
(Watanabe et al. 2000b), European seabass (Peres and Oliva-Teles 2005) and
rainbow trout (Bureau et al. 2006) fed at or near maintenance rations. These
observations support the principle that weight gain in growing animals is driven by
protein deposition (van Milgen et al. 2000; Bureau et al. 2002). The separation
between LE deposition (Figure 4.5) accounts for the different requirements for total
energy at different temperatures (Figure 4.4) and indicates that lipids rather than

91
protein are mobilised as an energy source to meet the increased maintenance energy
demands imposed at higher temperatures. This allows the growing animal to
continue to deposit protein at a rate predetermined by its genetic potential.
The improved growth rates in small mulloway can be directly attributed to a
proportional increase of feed intake at the satiated level. However, large mulloway fed
to satiation ate significantly more at 26 oC than 20 oC but did not demonstrate
significantly better growth. This discrepancy may be attributed to the relatively greater
costs for maintenance imposed on large mulloway at the higher temperature and may
also indicate a shift in the DP:DE requirements for larger fish. Brett (1971) and Kellogg
and Gift (1983) suggest that the final temperature preference exhibited by fish coincides
with the temperature required to optimize biochemical and physiological processes. In a
temperature preference experiment Bernatzeder and Britz (2007) determined 25 oC to
26.4 oC as the preferred temperature for 20g mulloway. The improved protein and
energy retention of mulloway fed to satiation at 26 oC in the current study tends to
support those findings, particularly for small mulloway. However, at satiated levels the
maximum retention efficiencies for protein and energy did not vary between
temperatures. Below these levels there was a trend for the retention efficiencies of
dietary energy to be greater at 20 oC (Figure 4.2) which is likely to be related to the
reduced maintenance energy requirements at that temperature. This suggests that
improved growth rates can occur at 26 oC provided that dietary intake is optimized.
The effect of ration on whole-body composition was however independent
of temperature except for lipid (small and large mulloway) and ash (small
mulloway) (Table 4.1). Lipid content is known to vary directly depending on intake
levels (Shearer 1994) and as lipid levels changed in mulloway a corresponding
change in ash and moisture was also observed. This can be attributed to a
proportional shift between bone and muscle mass with increasing feed intake.

92
Whole-body protein content is considered to remain constant and independent of
feed intake and temperature (Shearer 1994); however, protein content in mulloway
was shown to vary significantly with temperature (small and large fish) and ration
(large fish). The overall difference in protein content between significant treatment
levels was, however, quite small at <10 g kg-1on average. It can therefore be
concluded that while feed intake and temperature have a statistically observable
effect on the protein composition of mulloway, protein levels do indeed remain
fairly well conserved. This result also supports the use of a constant value for the
initial fish protein composition (191.4 g kg-1) which, when compared across all
combined size, temperature and ration treatment values, differed by <10 g kg-1.
To summarize, the utilization efficiencies of DE (0.60) and DP (0.58) for
growth in mulloway were shown to be constant and independent of fish size, ration
level or temperature used in this study. The partial utilization efficiencies of DE for
protein (kp) and lipid (kl) deposition were 0.49 and 0.75 respectively. Maintenance
requirements for protein (0.47 g DP kg-0.7 day-1) were influenced by body size but
were independent of temperature while maintenance requirements for energy
increased with increasing temperature (44.21 to 49.59 kJ DE kg-0.8 day-1) and were
also influenced by body size. Mulloway should be fed to satiation to maximize growth
potential if diets contain 21.4 g DP MJ DE-1.

93
Chapter 5
The Interactive Effects of Dietary Protein and Energy on Feed
Intake, Growth and Protein Utilization of Juvenile Mulloway4
4The following chapter is published as:
Pirozzi, I., Booth, M.A., Allan, G.L., In press. The interactive effects of dietary protein and energy on feed intake, growth and protein utilization of juvenile mulloway (Argyrosomus japonicus). Aquac. Nutr. doi: 10.1111/j.1365-2095.2007.00641.x
5.1 Abstract
The objectives of this study were to describe the interactive effects of varying
digestible protein (DP) and digestible energy (DE) content on the feed intake,
growth, protein utilization and whole body composition of juvenile mulloway
(Argyrosomus japonicus) and to determine the optimal DP:DE ratio for growth.
This was achieved by feeding mulloway diets containing one of four different DP
levels (250 - 550 g kg-1) at two DE levels (16 or 21 MJ kg-1). Juvenile mulloway
were stocked at each of two different sizes (70 or 200 g) in triplicate groups for each
dietary treatment and fed twice daily to apparent satiation over 58 days. The results
indicated that feed intake was not governed solely by energy demands but was also
dependant on the DP content of the diet. Protein utilization did not improve with
diets containing decreasing protein and increasing lipid content indicating that
mulloway have a limited capacity to spare dietary protein. Optimal DP content was
found to be 444-491 g kg-1 depending on the DE content of the diet and the size of
mulloway and is within the range reported for other sciaenid species. The use of

94
formulated diets with 28.6 g DP MJ DE-1 will achieve optimal growth and protein
deposition for 70 – 275g mulloway.
5.2 Introduction
Mulloway, Argyrosomus japonicus (Pisces: Sciaenidae), are a euryhaline,
gregarious, fast growing and highly fecund species that are easily reproduced in
captivity. Mulloway have a wide distribution covering the east, western and
southern seaboards of Australia (Silberschneider and Gray 2008) and can be grown
successfully in different culture systems including sea cages, ponds and
recirculating aquaculture systems (Quartararo 1996; Fielder et al. 1999; O'Sullivan
and Ryan 2001; Doroudi et al. 2006). Aquaculture of mulloway is relatively new in
Australia beginning in the mid 1990’s (Gooley et al. 2000). As such the industry is
in its relative infancy although there has been a steady increase in production in
recent years. Production of mulloway in Australia for 2004/05 was 558.4 t
(O'Sullivan et al. 2007), up from 6.8 t in 1997/98 (O'Sullivan and Roberts 2000).
Development of the industry is currently restricted by a lack of knowledge of the
nutritional requirements of mulloway. To date there is no published information on
the requirements for digestible protein (DP) and digestible energy (DE) for
mulloway and, as a consequence, no specific diet formulations are available. As a
carnivorous species it is expected that mulloway will have a high requirement for
DP and this is reflected in the current practice by industry of feeding mulloway
commercial diets formulated for other carnivorous species such as barramundi
(Lates calcarifer) or more generic ‘marine fish’ formulations.
Aquaculture feeds are formulated to maximize nutrient retention and

95
minimize nutrient loss. This strategy is driven by both economic and environmental
considerations. Nutrient utilization efficiencies have been shown to be influenced
by many different factors such as species effects (Refstie et al. 2000; Azevedo et al.
2004), fish size (Einen and Roem 1997; Azevedo et al. 2004), temperature
(Bendiksen et al. 2003; Moreira et al. 2008) and the DP:DE ratio of the diet
(Lupatsch et al. 2001b; Booth et al. 2007). Considerable advances have been made
in improving protein retention in Atlantic salmon (Salmo salar) by increasing the
energy content of the diet with lipid levels sometimes in excess of 30% (e.g. Einen
and Roem 1997; Hemre and Sandnes 2008). The improved efficiencies are a result
of the sparing of dietary protein from catabolism for energy by incorporating
sufficient non-protein dietary energy from lipid or carbohydrate. There are,
however, many examples of carnivorous marine fish such as grouper (Epinephelus
coioides) (Luo et al. 2005), cobia (Rachycentron canadum) (Chou et al. 2001) and
the large yellow croaker (Pseudosciaena crocea) (Duan et al. 2001) that show a
much lower tolerance to elevated levels of dietary lipid thereby limiting potential
protein sparing effects. Diets formulated with excess energy may also promote
excessive lipid deposition (Shearer 1994) and reduce feed intake (Marais and Kissil
1979). Supplying formulated feeds with the optimal DP:DE content appropriate to
a particular species, size and culture conditions is therefore crucial in maximizing
nutrient retention.
The objectives of this study are to i) describe the interactive effects of
varying DP and DE content on feed intake, growth, protein utilization and whole
body composition of juvenile mulloway, ii) determine the optimal DP content for
juvenile mulloway fed fishmeal based diets and iii) to determine the optimal DP:DE
ratio for growth.

96
5.3 Materials and methods
5.3.1 Experiment design and system
The effects of varying the DP and DE content on growth and protein
retention efficiency of mulloway was tested by feeding fish one of eight different
diets formulated with a DP:DE ratio ranging from approximately 12 - 35 g DP MJ-1
to each of two size treatments from different cohorts stocked at 10 (large; initial
body weight (ibw mean±SD) = 199.5±11.6 g) or 20 (small; ibw = 68.7±8.5 g) fish
tank-1. There was no significant difference between initial weights within size
treatments (p>0.5). The experiment was run over 58 days using fish produced at the
New South Wales Department of Primary Industries, Port Stephens Fisheries
Institute (PSFI). The experimental system consisted of two integrated 1700 l
recirculating bio-filtration units supplying 48 x 200 l replicate tanks (total volume ≈
13000 l). The temperature was held at 26±0.5oC which is known to promote good
growth rates in mulloway (Chapter 4) and is within the preferred temperature range
for this species (Bernatzeder and Britz 2007). Flow to each tank was approximately
4 l min-1 and orientated to create a weak centripetal current which allowed the
retention of feed pellets in the tank while removing feces via a central upright
32mm diameter pvc overflow pipe which was fixed approximately 1cm off the
bottom of each tank. Black plastic sheets were placed around each tank and across
the top front half to minimise disturbance. Each size and feed treatment were
randomly assigned to triplicate tanks with each tank constituting an experimental
unit. All tanks were exposed to indirect natural light (photoperiod 12L:12D).
Ammonium (NH4+) (<0.1 mg l-1), dissolved oxygen (>5.0 mg l-1), pH (7.5 - 7.9) and

97
salinity (28 - 33 ppt) were monitored regularly throughout the duration of the
experiment.
5.3.2 Feeds and feeding
Feeds were formulated using the linear method in Winfeed 2.8 (Winfeed Ltd.,
Cambrdige, UK). Each diet was formulated with either a low DE (16 MJ kg-1) (LE) or
high DE (21 MJ kg-1) (HE) content. Digestibility coefficients of the ingredients were
identified in a previous study by Booth (unpublished data, 2008). Dry ingredients were
mixed in a Hobart mixer (Troy Proprietary Ltd, Ohio, USA) to make the four base
diets. Each summit/diluent pair was then blended to give four different DP levels while
maintaining the respective DE content giving eight diets in total (Table 5.1). The dry
ingredients were then combined with distilled water before being pelleted through a
mincer (Barnco Australia Proprietary Ltd, Leichhardt, NSW, Australia) with a 10 mm
diameter die and cut to 6mm lengths. Pellets were dried in convection drier at < 35 °C
for about 6 h. Fish were fed to apparent satiation twice daily and any uneaten pellets
were counted then siphoned from tanks approximately 45 min after initial feeding.
Total daily feed intake was then adjusted to account for uneaten feed using the
average weight derived from a sub-sample of feed pellets (n = 150 pellets for each
diet) (Table 5.1). Fish were fasted for 48 h prior to final sampling.
5.3.3 Sample preparation and analyses
Initial representative samples of 10 fish of each size class were collected
before the start of the experiment, euthanized with an overdose of benzocaine
(ethyl-p-aminobenzoate) and frozen (-20 oC). At the conclusion of the feeding trial
all fish were euthanized, weighed and stored frozen for compositional analyses.
98
Compositional changes were estimated by comparing the initial fish samples with
those from the feeding trial. All values and subsequent reference to the nutrient and
energy composition of mulloway in this study are based on whole body
composition. Whole body composition was determined by placing the weighed fish
into 5 l glass beakers, covering with aluminum foil and then autoclaving for 99 min
at 121 oC. After cooling to room temperature any changes in weight were accounted
for and assumed to be changes in moisture content. The samples were then
homogenised in situ with a hand blender and a sample taken for dry matter
determination. A portion of the remaining homogenate was then transferred to
plates and oven dried at approximately 80 oC. The desiccated samples were then
finely ground in a laboratory blender and analysed in accordance with AOAC
(2005). Protein was calculated from total nitrogen based on N x 6.25 using the
Dumas method. Dry matter was calculated gravimetrically after oven drying at 105
oC. Ash was calculated gravimetrically after incineration at 550 oC for 2 h. Gross
energy was determined by adiabatic bomb calorimetry. Lipid was measured
gravimetrically after chloroform-methanol extraction.
5.3.4 Performance indices
Mass-specific data are expressed as the geometric mean of initial and final
body weights of fish (GMBW) and scaled using the metabolic body weight
exponent values of 0.7 for protein retention data and 0.8 for energy retention data
(after Brett and Groves 1979; Lupatsch et al. 1998). The following performance
indices were calculated for each treatment group:
99
Daily weight gain (g fish-1 day-1) = Final body weight – initial body weight /
number of days
Daily protein gain (g fish-1 day-1) = Final whole body protein content – initial whole
body protein content / number of days
Daily energy gain (kJ fish-1 day-1) = Final whole body energy content – initial whole
body energy content / number of days
Daily lipid gain (g fish-1 day-1) = Final whole body lipid content – initial whole
body lipid content / number of days
Feeding Efficiency (FE) = Weight gain / Total feed intake
Protein Retention Efficiency (PRE) = Protein gain / Total protein intake
Relative Feed Intake (RFI) (g kg-0.7 day-1) = Total feed intake / (GMBW/1000)0.7 /
number of days
5.3.5 Data analyses
The effects of varying DE content (fixed; 2 levels), DP content (fixed; 4
levels) and mulloway size (fixed; 2 levels) on RFI, FE and PRE were tested using a
3-way ANOVA. Size directly influences the nutrient and energy composition of fish
(Shearer, 1994); therefore data were pooled across the size term and the effects of
diet on whole body composition tested as a 2-way ANCOVA with final body

100
weight (fbw) as the co-variate. Normality of the data were checked with skewness,
kurtosis and omnibus normality tests. Assumptions of homogeneity of variances
were tested using modified Levenes’ equal variance test. Tukey-Kramer test was
used for a posteriori multiple comparison of means on significant terms. All results
were regarded as significant at p<0.05 except for the compositional analyses where
α was set at 0.01 as differences between means of <0.5 % were detected when α =
0.05. All analyses were carried out using untransformed data unless otherwise
stated.
Data for PRE were non-normally distributed due to a single outlier for small
mulloway fed the HE1 diet (PRE = -0.49). PRE variances were homogeneous. PRE
data could not be normalized; however, ANOVA results were significant regardless
of the inclusion of the outlier or not. ANOVA data are given inclusive of the outlier
and due consideration should therefore be given to interpretations of the subsequent
multiple comparison tests.
Water flow and air failed to one tank during the experiment resulting in the
loss of all fish in that tank (large fish; HE4 diet). Survival in all the remaining tanks
was 100 %. Statistical analysis was completed with the mean of the remaining set
substituted and degrees of freedom adjusted accordingly (Underwood 1997).
Nonlinear regression was applied to the PRE values to determine the DP
requirements of mulloway for each energy level. The asymptote of the quadratic
function was considered as the optimal DP content giving the maximum PRE value.
Correlations (r) were determined between performance indices (FE and
PRE) and dietary nutrients (protein, lipid and starch). Protein gain (g kg-0.7 day-1)
was also correlated with the DP:DE of the diets.
The optimal DP:DE ratio for protein gain (g kg-0.7 day-1) was predicted using

101
a biphasic linear model based on Koops and Grossman (1993) where protein gain (g
kg-0.7 day-1) was described as:
A – BSln(1 + exp(C-x)/s)
Where A = asymptote (second phase); B = linear slope (first phase); S = transition
smoothness (0.5); C = transition point.
Table 5.1. Nutrient and ingredient profile of experimental diets (as fed basis).
Low Energy Diet High Energy Diet LE1 LE2 LE3 LE4 HE1 HE2 HE3 HE4 Diet Ingredient (g kg-1) Fish Meal 344 405 435 496 191 311 372 492 Fish Oil 167 104 73 10 304 236 201 133 Blood Meal 10 103 150 243 10 66 94 150 Bovine Meal 10 10 10 10 150 138 132 120 Pregel Starch 200 152 128 80 200 152 128 80 Vit. PreMix 5 5 5 5 5 5 5 5 Diatomaceous Earth 264 221 199 156 141 92 68 20 Pellet weight (g) 0.27 0.29 0.3 0.29 0.3 0.29 0.28 0.28 Nutrient Composition DM (g kg-1) 951 949 947 945 949 946 944 941 Protein (g kg-1) 266 397 462 592 263 393 458 588 Fat (g kg-1) 196 142 115 61 331 27 248 193 Ash (g kg-1) 307 274 258 225 172 140 125 93 GE (MJ/Kg) 17.12 17.30 17.44 17.65 22.50 22.54 22.58 22.66 DP (g kg-1) 257 376 436 555 251 373 434 555 DE (MJ/Kg) 15.92 15.82 15.77 15.67 20.95 20.96 20.96 20.97 DP:DE (g/MJ) 16.1 23.8 27.6 35.4 12.0 17.8 20.7 26.5
5.4 Results
5.4.1 Diet and fish size interactions on feed intake, FE and PRE
The effects of varying DE and DP content on RFI (g kg-0.7) were not
dependant on the size of mulloway (i.e. there was no second-order interaction)

102
(Table 5.2) however; the effect of DE on RFI (g kg-0.7) varied significantly
depending on the DP content of the diet. The influence of DE as well as DP on RFI
also varied significantly depending on the size of mulloway (Table 5.2; Figure 5.1).
Table 5.2. 3-way ANOVA on relative feed intake (RFI), feeding efficiency (FE) and protein retention efficiency (PRE). Size = small and large mulloway (ibw ~70g and 200g); Dietary DE level = 16 and 21 MJ kg-1; Dietary DP level 1 – 4 = 255, 375, 435 or 555 g DP kg-1. ns = not significant at p<0.05, * = p<0.05, ** = p<0.01.
RFI FE PRE Source of Variation DF MS F P MS F P MS F P A: Size 1 34.33 816.30 ** 0.02 6.25 * 0.01 7.79 ** B: DE Level 1 26.77 636.56 ** 0.13 42.14 ** 0.16 98.14 ** AB 1 0.39 9.22 ** 0.08 27.81 ** 0.06 36.84 ** C: DP Level 3 0.53 12.72 ** 1.09 363.89 ** 0.23 141.15 ** AC 3 0.16 3.73 ** 0.07 24.83 ** 0.04 21.38 ** BC 3 2.43 57.87 ** 0.18 59.92 ** 0.10 59.72 ** ABC 3 0.05 1.28 ns 0.02 6.03 ** 0.02 12.64 ** Residual 31 0.04 0.00 0.00
Relative feed intake (g kg-0.7) was higher for the LE diets than the HE diets
for both fish sizes and the DE x DP interaction occurred because significantly more
of the LE1 diet was consumed. The DP x size interaction occurred because, in
relative terms, small mulloway consumed less of the HE1 and HE2 diets. Large
mulloway consumed a proportionally greater amount of the LE diet over the HE
diet hence the DE x size interaction.
The effect of dietary DE on total FE and PRE varied significantly with DP
content and these interactions were different for each size class (Table 5.2; Figure
5.1). The highest FE values (mean±se) were 0.93±0.05 and 0.75±0.02 for small and
large mulloway respectively fed the HE4 diets (Table 5.3; Figure 5.1). FE generally
improved with increasing DP content with the HE diet but began to plateau from the
LE2 and LE3 diets for small and large mulloway respectively.

103
The highest PRE values (mean ±se) were 0.32±0.01 and 0.35±0.02 for small
and large mulloway fed diets LE2 and LE3 respectively. PRE began to plateau from
DP level 2 regardless of the DE content (Table 5.3; Figure 5.1). The second-order
interaction for both FE and PRE occurred because of a relative improvement in
efficiencies for the HE2 diet by large mulloway (Figure 5.1).
Correlation responses to dietary protein (r = 0.86 and 0.87; p < 0.001) and
dietary starch (r = -0.84 and -0.84; p<0.001) with respect to FE were found to be
virtually identical between small and large mulloway respectively. Dietary protein
(r = 0.66 and 0.65; p<0.001) and dietary starch (r = -0.62 and -0.62; p<0.001) were
also correlated with PRE and virtually identical between the small and large
mulloway (Figure 5.2). Dietary lipid (r = -0.73; p<0.001 and -0.60; p<0.01) also
demonstrated a negative correlation with FE for both small and large mulloway as
did PRE (r = -0.62; p<0.001 and -0.60; p<0.01). The HE1 diet was found to have a
large influence on the correlation coefficients with respect to dietary lipid which
could be expected at a crude lipid inclusion level of 33 %. With this dietary
treatment level removed clear differences were found between the size classes. FE
and PRE were negatively correlated with dietary lipid for small mulloway (r = -
0.48, p<0.05 and -0.62; p<0.001); however, there was no significant correlation
with large mulloway (r = -0.17, p>0.1; -0.04, p>0.5).
Protein gain (g kg-0.7 day-1) was highly correlated with the DP:DE ratio of
the diet (r = 0.84; p<0.001).
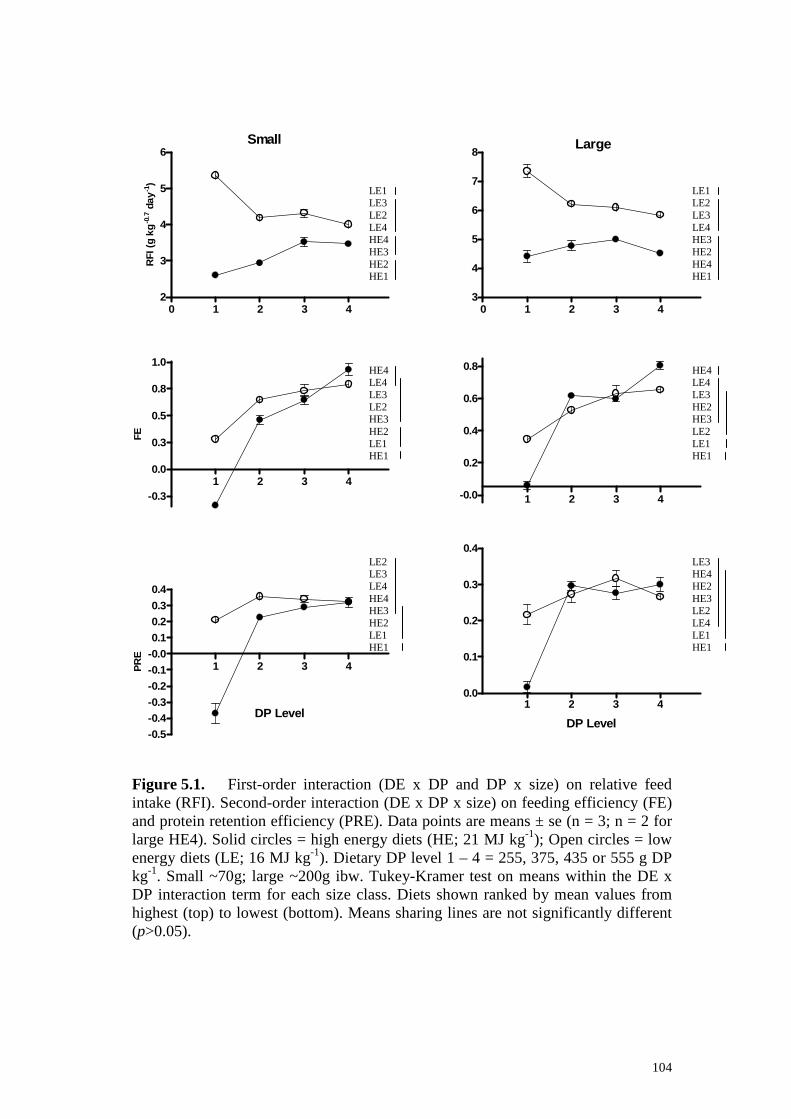
104
1 2 3 4-0.3
0.0
0.3
0.5
0.8
1.0
FE
1 2 3 4-0.0
0.2
0.4
0.6
0.8
1 2 3 4
-0.5-0.4-0.3-0.2-0.1-0.00.10.20.3
0.4
DP Level
PR
ESmall
1 2 3 40.0
0.1
0.2
0.3
0.4
DP Level
Large
0 1 2 3 42
3
4
5
6R
FI (
g kg
-0.7
day
-1)
0 1 2 3 43
4
5
6
7
8
Figure 5.1. First-order interaction (DE x DP and DP x size) on relative feed intake (RFI). Second-order interaction (DE x DP x size) on feeding efficiency (FE) and protein retention efficiency (PRE). Data points are means ± se (n = 3; n = 2 for large HE4). Solid circles = high energy diets (HE; 21 MJ kg-1); Open circles = low energy diets (LE; 16 MJ kg-1). Dietary DP level 1 – 4 = 255, 375, 435 or 555 g DP kg-1. Small ~70g; large ~200g ibw. Tukey-Kramer test on means within the DE x DP interaction term for each size class. Diets shown ranked by mean values from highest (top) to lowest (bottom). Means sharing lines are not significantly different (p>0.05).
LE1 LE2 LE3 LE4 HE3 HE2 HE4 HE1
LE2 LE3 LE4 HE4 HE3 HE2 LE1 HE1
HE4 LE4 LE3 HE2 HE3 LE2 LE1 HE1
HE4 LE4 LE3 LE2 HE3 HE2 LE1 HE1
LE3 HE4 HE2 HE3 LE2 LE4 LE1 HE1
LE1 LE3 LE2 LE4 HE4 HE3 HE2 HE1

105
Table 5.3. Summary of performance indices and carcass composition of mulloway. Fish size: Small ~70g ibw; Large ~200g ibw.
Diet Performance Indices Carcass Composition5
Fish Size Treatment1
Harvest Weight
Weight2 Gain
Protein2 Gain
Energy3 Gain
Lipid 2 Gain
Feed2 Intake RFI 4 FE PRE Moisture Protein Lipid Ash Energy
Small Initial - - - - - - - - - 692 184 79 48 7.25 LE1 82.42 0.25 0.05 1.97 0.02 0.87 5.36 0.28 0.21 683 185 82 51 7.40 LE2 96.56 0.47 0.10 2.71 0.02 0.72 4.18 0.65 0.35 699 190 66 49 6.82 LE3 98.83 0.55 0.11 2.57 0.00 0.75 4.32 0.73 0.34 709 190 54 50 6.43 LE4 100.73 0.56 0.13 1.90 -0.02 0.70 4.01 0.79 0.32 719 198 40 47 6.03 HE1 65.30 -0.13 -0.04 -1.84 -0.02 0.40 2.60 -0.33 -0.37 706 173 67 57 6.48 HE2 82.68 0.22 0.04 1.69 0.03 0.48 2.94 0.46 0.23 684 184 84 52 7.32 HE3 88.50 0.38 0.07 2.60 0.03 0.58 3.52 0.65 0.29 692 186 76 49 7.16 HE4 100.19 0.56 0.11 2.93 0.01 0.60 3.46 0.93 0.32 706 186 60 51 6.57 Large Initial - - - - - - - - - 720 190 34 61 5.59 LE1 245.05 0.76 0.14 11.06 0.19 2.56 7.34 0.30 0.22 688 190 73 50 7.20 LE2 263.67 1.06 0.23 9.92 0.11 2.23 6.21 0.47 0.27 702 197 51 52 6.48 LE3 272.30 1.28 0.31 11.32 0.11 2.19 6.09 0.58 0.32 701 204 48 51 6.48 LE4 274.99 1.28 0.32 8.30 0.02 2.11 5.83 0.61 0.27 714 205 29 53 5.83 HE1 199.70 0.01 0.01 1.87 0.04 1.43 4.41 0.01 0.02 713 192 46 55 6.13 HE2 251.32 0.94 0.18 12.25 0.20 1.66 4.76 0.57 0.30 687 192 72 52 7.20 HE3 256.02 0.97 0.21 11.64 0.16 1.76 4.99 0.55 0.28 691 196 64 51 7.00 HE4 267.47 1.21 0.27 10.94 0.11 1.61 4.51 0.75 0.30 701 198 49 54 6.50
1 Refer to Table 1 for diet composition 2 (g fish-1 day-1) 4 Relative feed intake (g kg-0.7 day-1) 3 (kJ fish-1 day-1) 5 as received g kg-1 or MJ kg-1 (energy)

106
0 1 2 3 430
40
50
60
70
80
90
Dietary DP Level
Lipi
d (g
kg
-1)
0 1 2 3 4670
680
690
700
710
720
730
Dietary DP Level
Mo
istu
re (
g k
g-1
)
0 1 2 3 45
6
7
8
Dietary DP Level
Ene
rgy
(MJ
kg-1
)
0 1 2 3 4170
180
190
200
210
Dietary DP Level
Pro
tein
(g
kg
-1)
Figure 5.2. Effect of dietary DE on lipid, moisture, energy and protein composition of mulloway dependant on dietary DP content. Data are pooled means across size terms (± se; n = 6; n = 5 for HE4). Solid circles = high energy diets (HE; 21 MJ kg-1); Open circles = low energy diets (LE; 16 MJ kg-1). Dietary DP level 1 – 4 = 255, 375, 435 or 555 g DP kg-1.
5.4.2 Effect of dietary DE and DP on whole body composition
The effect of DE content on the moisture, lipid and energy composition of
mulloway varied significantly with DP content (Table 5.4; Figure 5.2). The
interaction occurred because of the relative low lipid and energy content and high
moisture composition for mulloway fed the HE1 diet (Figure 5.2). The effect of DE
on protein composition was independent of the DP content. However, both DP and
DE were found to effect the protein composition of mulloway (Table 5.4). There was
a trend for protein composition to be greater for mulloway fed LE diets and to
increase with increasing DP although protein composition tended to plateau from the
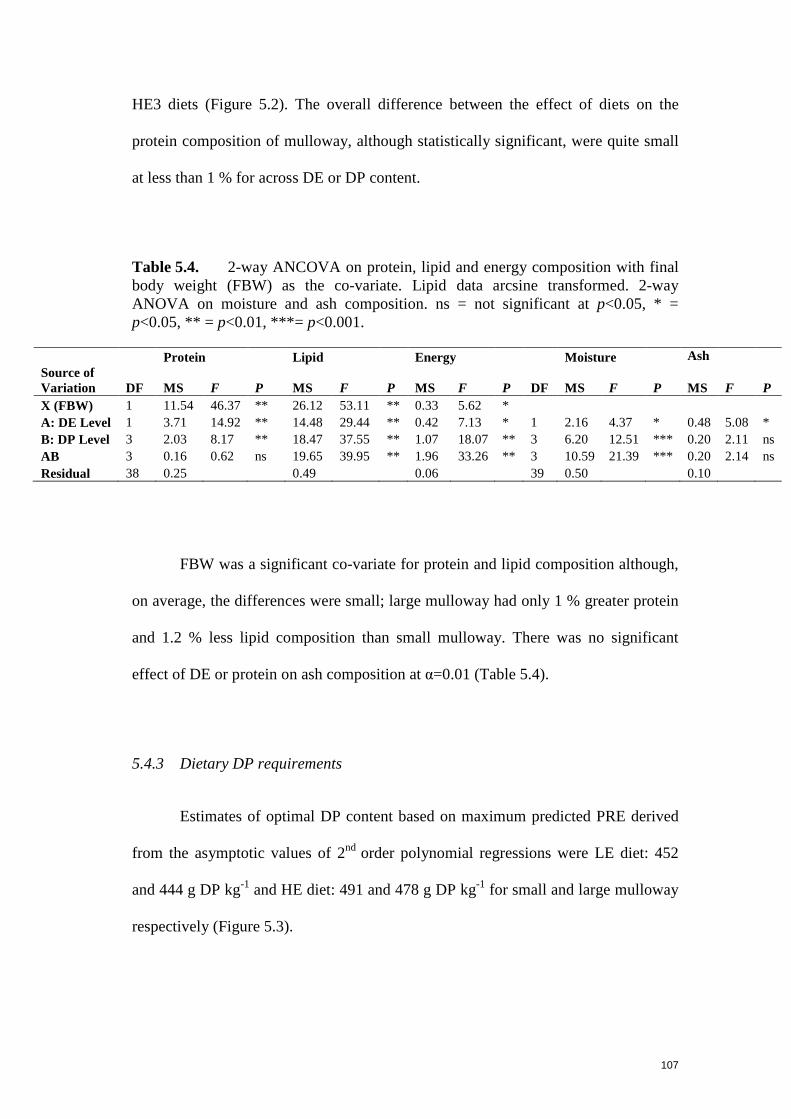
107
HE3 diets (Figure 5.2). The overall difference between the effect of diets on the
protein composition of mulloway, although statistically significant, were quite small
at less than 1 % for across DE or DP content.
Table 5.4. 2-way ANCOVA on protein, lipid and energy composition with final body weight (FBW) as the co-variate. Lipid data arcsine transformed. 2-way ANOVA on moisture and ash composition. ns = not significant at p<0.05, * = p<0.05, ** = p<0.01, ***= p<0.001.
Protein Lipid Energy Moisture Ash Source of Variation DF MS F P MS F P MS F P DF MS F P MS F P X (FBW) 1 11.54 46.37 ** 26.12 53.11 ** 0.33 5.62 *
A: DE Level 1 3.71 14.92 ** 14.48 29.44 ** 0.42 7.13 * 1 2.16 4.37 * 0.48 5.08 * B: DP Level 3 2.03 8.17 ** 18.47 37.55 ** 1.07 18.07 ** 3 6.20 12.51 *** 0.20 2.11 ns AB 3 0.16 0.62 ns 19.65 39.95 ** 1.96 33.26 ** 3 10.59 21.39 *** 0.20 2.14 ns Residual 38 0.25 0.49 0.06 39 0.50 0.10
FBW was a significant co-variate for protein and lipid composition although,
on average, the differences were small; large mulloway had only 1 % greater protein
and 1.2 % less lipid composition than small mulloway. There was no significant
effect of DE or protein on ash composition at α=0.01 (Table 5.4).
5.4.3 Dietary DP requirements
Estimates of optimal DP content based on maximum predicted PRE derived
from the asymptotic values of 2nd order polynomial regressions were LE diet: 452
and 444 g DP kg-1 and HE diet: 491 and 478 g DP kg-1 for small and large mulloway
respectively (Figure 5.3).
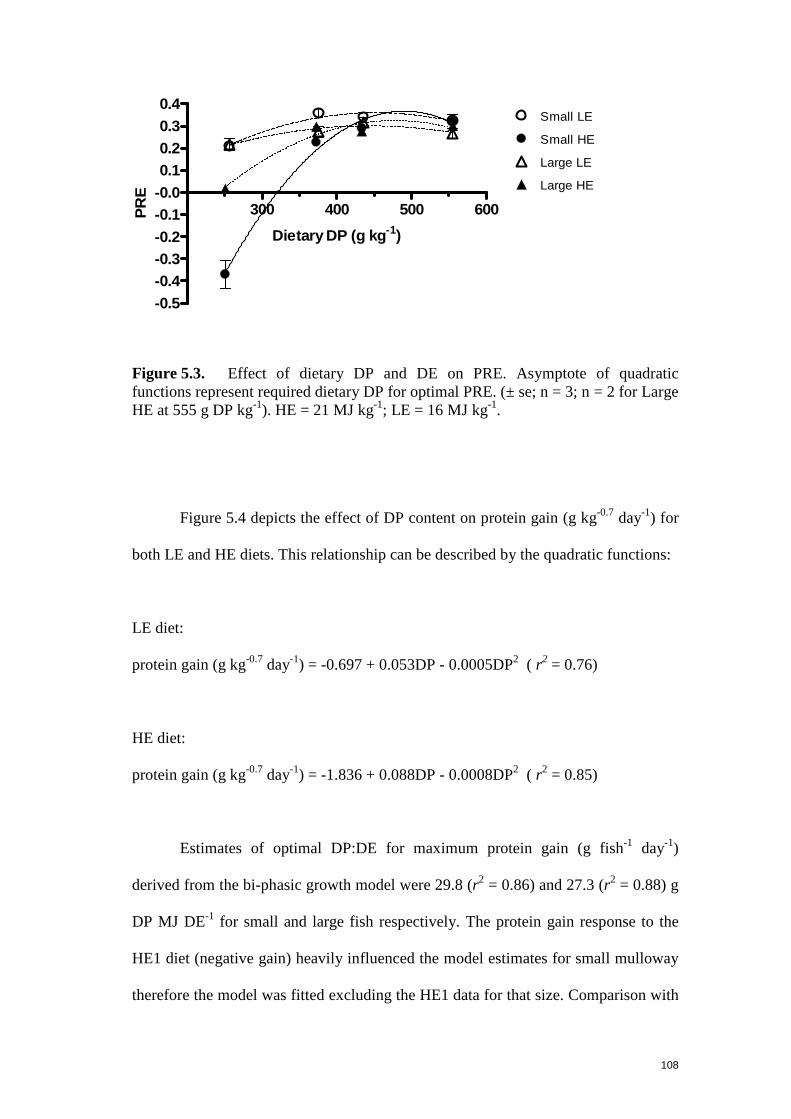
108
300 400 500 600
-0.5-0.4-0.3-0.2-0.1-0.00.10.20.30.4
Small LE
Small HE
Large LE
Large HE
Dietary DP (g kg-1)
PR
E
Figure 5.3. Effect of dietary DP and DE on PRE. Asymptote of quadratic functions represent required dietary DP for optimal PRE. (± se; n = 3; n = 2 for Large HE at 555 g DP kg-1). HE = 21 MJ kg-1; LE = 16 MJ kg-1.
Figure 5.4 depicts the effect of DP content on protein gain (g kg-0.7 day-1) for
both LE and HE diets. This relationship can be described by the quadratic functions:
LE diet:
protein gain (g kg-0.7 day-1) = -0.697 + 0.053DP - 0.0005DP2 ( r2 = 0.76)
HE diet:
protein gain (g kg-0.7 day-1) = -1.836 + 0.088DP - 0.0008DP2 ( r2 = 0.85)
Estimates of optimal DP:DE for maximum protein gain (g fish-1 day-1)
derived from the bi-phasic growth model were 29.8 (r2 = 0.86) and 27.3 (r2 = 0.88) g
DP MJ DE-1 for small and large fish respectively. The protein gain response to the
HE1 diet (negative gain) heavily influenced the model estimates for small mulloway
therefore the model was fitted excluding the HE1 data for that size. Comparison with

109
estimates of optimal DP:DE derived from the asymptotes of quadratic functions
fitted to the PRE response (HE1 data removed for small mulloway) were 29.4 (r2 =
0.74) and 27.2 (r2 = 0.78) for small and large mulloway respectively; these results are
very similar to the estimates derived using the above bi-phasic growth model with
protein gain (g fish-1 da y-1) as the dependent variable.
300 400 500 600-0.2
0.0
0.2
0.4
0.6
0.8
1.0
LE
HE
Dietary DP (g kg-1)
Pro
tein
gai
n(g
kg
-0.7
day
-1)
Figure 5.4. Effect of dietary DP and DE on protein gain (g kg-0.7 day-1). (± se; n = 6; n = 5 for HE at 55.5 g DP 100g-1). HE = 21 MJ kg-1; LE = 16 MJ kg-1.
Ranges for DP:DE based on 95 % CI of the fitted bi-phasic growth model
overlapped for the different size classes (small, 26.6 - 33.1; large, 23.8 - 30.8 g DP
MJ DE-1) suggesting that a common DP:DE ratio of 28.6 g DP MJ DE-1 would be
suitable for formulating practical diets for mulloway of at least 70 g to approximately
275 g BW (Figure 5.5).
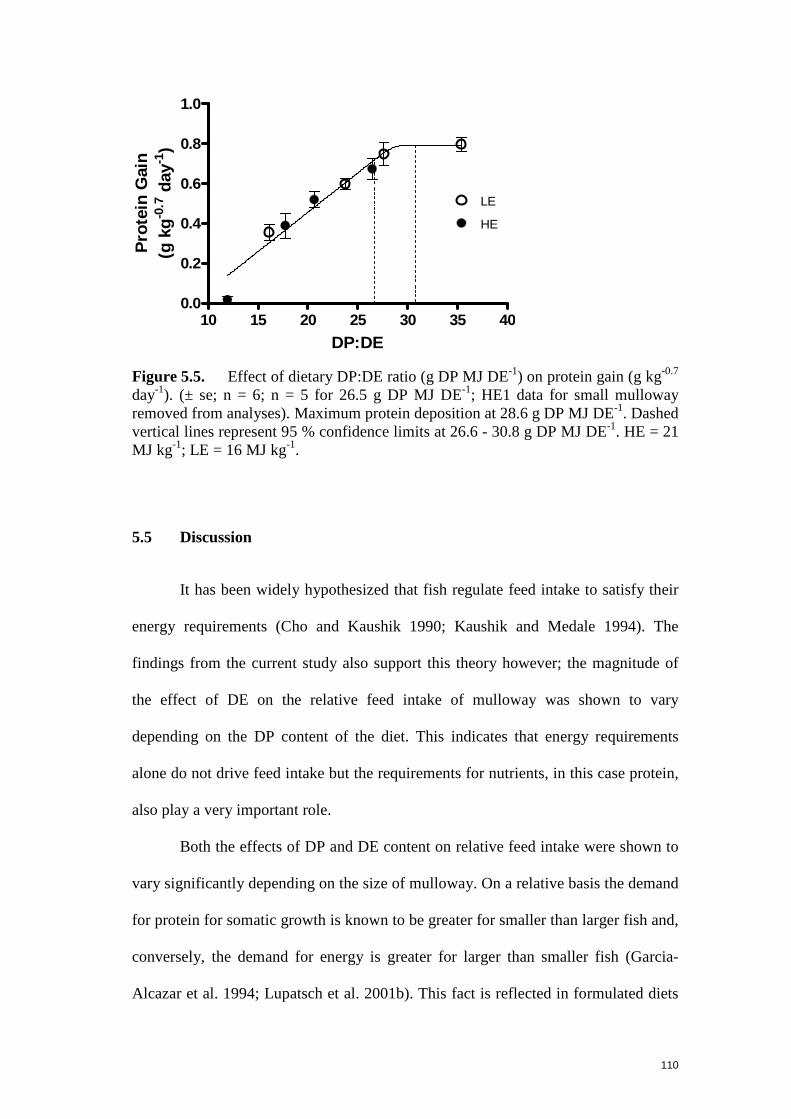
110
10 15 20 25 30 35 400.0
0.2
0.4
0.6
0.8
1.0
LE
HE
DP:DE
Pro
tein
Gai
n(g
kg
-0.7
day
-1)
Figure 5.5. Effect of dietary DP:DE ratio (g DP MJ DE-1) on protein gain (g kg-0.7
day-1). (± se; n = 6; n = 5 for 26.5 g DP MJ DE-1; HE1 data for small mulloway removed from analyses). Maximum protein deposition at 28.6 g DP MJ DE-1. Dashed vertical lines represent 95 % confidence limits at 26.6 - 30.8 g DP MJ DE-1. HE = 21 MJ kg-1; LE = 16 MJ kg-1.
5.5 Discussion
It has been widely hypothesized that fish regulate feed intake to satisfy their
energy requirements (Cho and Kaushik 1990; Kaushik and Medale 1994). The
findings from the current study also support this theory however; the magnitude of
the effect of DE on the relative feed intake of mulloway was shown to vary
depending on the DP content of the diet. This indicates that energy requirements
alone do not drive feed intake but the requirements for nutrients, in this case protein,
also play a very important role.
Both the effects of DP and DE content on relative feed intake were shown to
vary significantly depending on the size of mulloway. On a relative basis the demand
for protein for somatic growth is known to be greater for smaller than larger fish and,
conversely, the demand for energy is greater for larger than smaller fish (Garcia-
Alcazar et al. 1994; Lupatsch et al. 2001b). This fact is reflected in formulated diets

111
which provide greater DP:DE content for smaller, rapidly growing fish. Large
mulloway in this study consumed relatively more LE diet (compared to HE diet) than
small fish presumably to meet a greater demand for metabolic energy. However, the
greater overall relative feed intake demonstrated by large mulloway was likely
compensatory as indicated by the initial body composition (Xie et al. 2001)
If fish also consume feed to satisfy their nutrient requirements then it would
be expected that, on a relative basis, smaller fish would consume more of a low
protein diet than larger fish to meet those metabolic demands for protein. However,
the DP x size interaction occurred because, on a relative basis, small mulloway ate
significantly less of the HE low protein diets (HE1 and HE2) compared to the higher
protein diets (HE3 and HE4) than large mulloway. Indeed, small fish consuming the
HE1 diet were the only group to lose weight while the corresponding feed intake for
large fish was approximately equivalent to maintenance level. This response may
have occurred because high energy diets can sometimes suppress appetite (Marais
and Kissil 1979) and may indicate a shift in taste preference between size classes
(Kasumyan and Doving 2003); although this remains to be tested in mulloway. In
real terms however, the difference between the amounts of HE1 and HE2 diets
compared to HE3 and HE4 diets consumed by small mulloway was, on average, only
0.73 g kg-0.7 and would not have been significant at α.= 0.01. The different responses
between small and large mulloway to diets with high DE and low DP may indicate a
subtle shift in the protein:energy demands between the two sizes and highlights the
importance of the correct DP:DE ratio in formulated feeds.
The effect of DE on the moisture, lipid and energy composition of mulloway
was shown to vary depending on the DP content of the diet. The general trend was
for lipid composition to decrease with increasing dietary protein. The exception

112
occurred with the HE1 diet and this is concomitant with reduced feed intake at this
level. Similar results have been demonstrated with silver perch (Bidyanus bidyanus)
which show a significant linear decrease in whole body lipid composition when fed
17 MJ DE kg-1 diets with increasing DP content of 173-424 g kg-1; however, at 129 g
DP kg-1 silver perch also show a significant relative reduction in whole body lipid
composition (Allan and Booth 2004). Protein composition was shown to be affected
by DE and DP content with a greater protein composition with increasing DP and
decreasing DE content. A similar trend for the effect of DE on the protein
composition has been reported for the cuneate drum, Nibea miichthioides (Wang et
al. 2006b); however, the influence of DP in their study, while significant, was
unclear. This is possibly due to the limited range of DP (360 – 400 g kg-1) used in
their diets.
Mulloway in this study were found to have DP requirement of 444 – 491 g
kg-1 depending on the size of the fish and the dietary energy level. These values are
similar to those reported for other sciaenid species such as the giant and Atlantic
croakers (450 g CP kg-1; Davis and Arnold 1997; Lee et al. 2001), the large yellow
croaker (470 g CP kg-1; Duan et al. 2001) the cuneate drum (≥400 g DP kg-1; Wang
et al. 2006b) and red drum (350 - 440 g DP kg-1; Daniels and Robinson 1986;
McGoogan and Gatlin 1998).
The use of dietary protein can potentially be maximized for growth if
adequate amounts of non-protein energy can be supplied to satisfy metabolic
demands for energy. This protein sparing effect has been demonstrated in some fish
species (e.g. Erfanullah and Jafri 1995; Company et al. 1999; Lee et al. 2002;
Azevedo et al. 2004) but not others (e.g. Peres and Oliva-Teles 1999; De Pedro et al.
2001; Regost et al. 2001; Azevedo et al. 2004). PRE values did not significantly

113
improve with diets containing decreasing protein and increasing lipid content; this
occurred irrespective of the energy content of the diet and indicates that mulloway
have a limited capacity to spare dietary protein. This effect has similarly been
demonstrated in other sciaenid species (Duan et al. 2001).
Carnivorous fish are known to efficiently catabolize dietary proteins as an
energy source (Gatlin III 1995); however, whether catabolism of dietary protein by
mulloway for energy is performed preferentially over non-protein energy sources
(i.e. lipids) is unclear although the lack of a positive correlation between dietary lipid
for both FE and PRE indicates this may be likely. Rasmussen et al. (2000) and
Azevedo et al. (2004) did not observe a significant correlation between PRE and
lipid intake in rainbow trout while at the same time demonstrating a significant
correlation between protein intake and PRE indicating an absence of a protein
sparing effect of non-protein energy nutrients. Further research is required to
establish the energy utilization potential of non-protein energy sources as they
pertain to mulloway.
The correct proportion of dietary DP to DE is not only important to maximize
growth but imbalances have economic and environmental consequences. Diets
containing excessive protein will generally be less cost effective and produce
excessive nitrogenous waste (Kaushik 1998). Diets with excessive lipid content will
increase lipid deposition to the visceral cavity, liver and some muscle tissue of fish
(e.g. Nanton et al. 2007) although this may be desirable in some aquaculture species
such as those consumed as sashimi (Chou et al. 2001). Protein deposition in
mulloway was found to be highly correlated with the DP:DE ratio of the diet with
28.6 g DP MJ DE-1 considered appropriate for 70 – 275 g mulloway.

114
While the experimental design used in this study was sensitive enough to
discriminate subtle differences between the DP and DE requirements of 70 and 200 g
(ibw) fish; it is important to keep in perspective that mulloway can grow up to 75 kg
and 1.8 m in length (Griffiths and Heemstra 1995). Both the sizes used in this study
therefore represent rapidly growing juveniles with a high demand for dietary protein;
444 - 491 g kg-1 DP depending on the fish size and energy content of the diet. Protein
utilization did not improve with diets containing decreasing protein and increasing
lipid content indicating that protein sparing in mulloway may be limited and
underscores the importance of supplying adequate amounts of dietary protein.
Protein deposition in juvenile mulloway from 70 – 275 g can be optimized with diets
containing 28.6 g DP MJ DE-1.

115
Chapter 6
A Factorial Approach to Diet Formulation and Feeding Regimes for
Mulloway Based on the Requirements for Protein and Energy
6.1 Abstract
This study builds upon the information established in the previous chapters to
develop a factorial model to predict protein and energy requirements for mulloway
throughout the production range. Assessments of the growth potential of mulloway
and the allometric relationships between body size and protein and energy
metabolism and protein and energy whole body composition were combined with
previously established data on the utilization efficiencies and maintenance
requirements for DP and DE. Factorial modelling of the data allowed estimations of
the decreasing requirement of the ratio of DP:DE for mulloway with increasing body
size up to 2 kg. From this information diet formulations and feeding regimes were
then iteratively derived applicable for the different dietary needs dependant on body
size.
6.2 Introduction
The factorial modelling method for defining nutrient requirements in fish has
seen significant advances made in recent years with the work on non-salmonid
marine fish by Lupatsch et al. (1998), Lupatsch et al. (2001a) and Lupatsch and
Kissil (2005) and work on salmonids by Cho and Bureau (1998) and Azevedo et al.

116
(2005). The premise behind the factorial method being that the requirements for
protein and energy can be partitioned into production and maintenance costs based
on the assumption that the two are additive. This can expressed as:
Total nutrient requirement = a x BW(kg)b + c x Growth (6.1)
where a = maintenance requirement; b = weight exponent; c = utilisation coefficient
The advantage of this method over the more traditional empirical based dose
response methods such as that used in Chapter 5 is that it can be used to describe DP
and DE requirements for growing fish throughout the production cycle and
estimations are not necessarily restricted to within the size range of the test species.
Key to achieving this however are establishing the utilization efficiencies and
maintenance requirements for DP and DE (achieved in Chapter 4), an assessment of
the protein and energy composition as a function of fish size, establishing the growth
potential under a given set of culture conditions and describing the allometric
relationship between body size and protein and energy metabolism.
The main objectives of this study were twofold; firstly, to use the factorial
method to describe the requirements for DP and DE for mulloway up to 2 kg and
then, secondly, to iteratively derive diet formulations and feeding regimes based on
the requirements for protein and energy. Several assumptions relating to Eqn. (6.1)
with respect to temperature and fish size effects on the utilization efficiencies (c) and
maintenance requirements (a) of DP and DE in mulloway were tested in Chapter 4.
In this study the influence of methodology on deriving the value of the metabolic
weight exponent (b) is also tested.
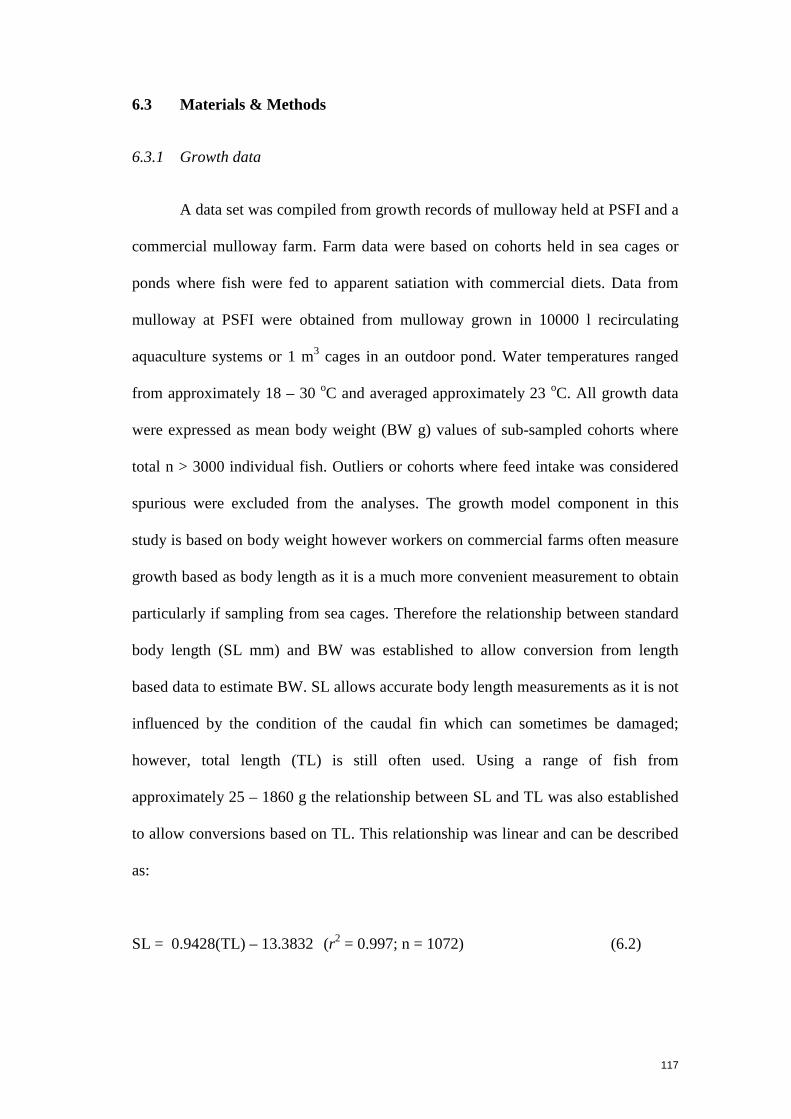
117
6.3 Materials & Methods
6.3.1 Growth data
A data set was compiled from growth records of mulloway held at PSFI and a
commercial mulloway farm. Farm data were based on cohorts held in sea cages or
ponds where fish were fed to apparent satiation with commercial diets. Data from
mulloway at PSFI were obtained from mulloway grown in 10000 l recirculating
aquaculture systems or 1 m3 cages in an outdoor pond. Water temperatures ranged
from approximately 18 – 30 oC and averaged approximately 23 oC. All growth data
were expressed as mean body weight (BW g) values of sub-sampled cohorts where
total n > 3000 individual fish. Outliers or cohorts where feed intake was considered
spurious were excluded from the analyses. The growth model component in this
study is based on body weight however workers on commercial farms often measure
growth based as body length as it is a much more convenient measurement to obtain
particularly if sampling from sea cages. Therefore the relationship between standard
body length (SL mm) and BW was established to allow conversion from length
based data to estimate BW. SL allows accurate body length measurements as it is not
influenced by the condition of the caudal fin which can sometimes be damaged;
however, total length (TL) is still often used. Using a range of fish from
approximately 25 – 1860 g the relationship between SL and TL was also established
to allow conversions based on TL. This relationship was linear and can be described
as:
SL = 0.9428(TL) – 13.3832 (r2 = 0.997; n = 1072) (6.2)

118
The relationship between SL and BW was allometric (Figure 6.1) and can be
described as:
BW = 6.163x10⁻⁵(SL)2.758 (r2 = 0.99; n = 3531) (6.3)
0 100 200 300 400 500 600
0
250
500
750
1000
1250
1500
1750
Standard length (mm)
Wei
gh
t (g
)
Figure 6.1. Relationship between standard length (mm) and body weight (g) of mulloway. Weight measurements range from 12 – 1600 g. (r2 = 0.99; n = 3531).
6.3.2 Body composition
The proportional content of energy, lipid and moisture to the BW of fish are
not constant throughout the growing phase and composition also varies between
species (Shearer 1994; Lupatsch et al. 2003b). The relationship between the
proximate composition and body weight of mulloway was determined using groups
of equal size fish ranging from 2 – 2100 g (n = 3 to 100 fish depending on size).
Samples were prepared for proximate analysis as per Chapter 4.

119
6.3.3 Dietary protein and energy utilization
The dietary protein and energy utilization efficiencies for mulloway used to
populate the factorial model in this study were established in Chapter 4. Based on the
slopes of regression, utilization efficiencies for DP and DE were 0.58 and 0.60
respectively. The respective corresponding cost per unit of protein or energy
deposition is 1.72 g DP g-1 and 1.67 kJ DE kJ-1.
6.3.4 Metabolic body weight
The effect of body weight on metabolic rate (M) can be described by the
general allometric equation:
M = aBWb (6.4)
Where a is the normalizing constant, BW is the body mass in g and b is the scaling
exponent describing the influence of mass on metabolism. The metabolic weight
exponent for routine metabolism (RMR) of mulloway based on oxygen consumption
was established in Chapter 3 and found to be 0.8. An alternative method is the
comparative carcass analysis of energy loss on starvation. This method also has the
advantage of allowing the metabolic weight loss of any body tissue such as protein to
be established if required. To test if fasting duration and temperature effected the
allometric relationship between daily protein and energy loss on starvation 3 size
classes of mulloway (S, M or L; initial BW approximately 25, 90 and 645 g
respectively) were fasted at two durations (2 or 4 weeks) at two temperatures (14 or
20oC). Treatments are referred to as 14:2, 14:4, 20:2 and 20:4 denoting each

120
respective temperature and fasting duration group. Fish were stocked into replicate
200 l tanks (n = 4) at 45, 25 or 6 fish tank-1 for S, M, or L fish respectively for each
temperature and fasting duration treatment. A description of the system and
temperature acclimation protocols can be found in Chapter 2. Stocking densities
were chosen to approximate those established as appropriate for mulloway in
Appendix 1. A representative initial sample of each size class (n = 10 for S and M
fish or n = 5 for L fish) were euthanized at the beginning of the study and stored
frozen until the completion of the fasting trial. At the conclusion of each fasting
treatment, fish were euthanized, weighed and also stored frozen until preparation for
carcass analyses. All samples for proximate whole carcass analyses were prepared as
per Chapter 4. Compositional changes in protein and energy were estimated by
comparing the initial fish carcass samples with those from the fasting trial.
6.3.5 Maintenance requirements
The daily maintenance requirements for energy and protein were established
in Chapter 4. Maintenance requirements for energy varied depending on temperature
and were 44.2 and 49.60 kJ DE kg-0.8 day-1 at 20 and 26 oC respectively. Routine
metabolic rate (RMR) (Chapters 2 & 3) and peak MO2 after feeding (Chapter 3) were
both shown to increase linearly with temperature; therefore, a linear relationship with
maintenance energy requirement (kJ DE kg-0.8 day-1) and temperature was also
assumed which can be expressed as 26.28+0.897T (when T = 20 to 26oC).
The daily maintenance requirement for protein was found to be independent
of the temperatures used in Chapter 4 and was estimated at 0.47 g DP kg-0.7 day-1

121
6.3.6 Data analyses
Allometric relationships were iteratively derived using the non-linear least
squares method in Graphpad Prism V4 (GraphPad Software, San Diego, CA, USA).
All data are based on the mean of tanks or experimental units. Comparisons of
individual model parameters were made using the extra sum-of-squares F-test.
Statistical significance was regarded at P < 0.05.
Piecewise linear analysis was used to determine breakpoints describing key
changes in the relationship between BW and the requirement for the ratio of DP:DE
using NCSS (2004, Kaysville, Utah).
0 250 500 750 1000 1250 15000.0
2.5
5.0
7.5
10.0
BW (g)
Gro
wth
(g
fis
h-1
day
-1)
Figure 6.2. Relationship between BW (g) and growth rate (g fish-1 day-1) of mulloway held at an average temperature of approximately 23 oC (solid line). Data points represent mean values of groups of fish (n = 44). Dashed lines represent estimations of growth rates at the lower and upper ranges of temperatures occurring during growth trials (18 – 30 oC) based on Eqn. (6.5).

122
6.4 Results
6.4.1 Growth model
Figure 6.2 shows the allometric relationship between growth rate and BW of
mulloway held at an average temperature of 23.6 oC (SD±2.5 oC). This can be
expressed as a function of temperature (T) within the range sampled (~18 to 30 oC):
Gain (g fish-1 day-1) = 0.03344 ×BW(g)0.5699 ×exp(0.0451×T)
(r2 = 0.77; n = 44) (6.5)
Eqn. (6.5) can be expressed in terms of predicted BW based on initial weight (BW0)
after time (t) in days as:
BW = (BW00.4301 + 0.0144× exp0.0451xT × t)2.3248 (6.6)
0 500 1000 1500 2000 25000
20
40
60
80
0
2
4
6
8
10
12
14
BW (g)
Co
mp
osi
tio
n (
g 1
00g
-1) E
nerg
y con
tent (kJ g
-1)
Figure 6.3. Relationship between proximate body composition and live weight (g) (n = 45 groups). Diamonds = moisture; Circles = energy; Triangles = protein; Crosses = lipid; Squares = ash.

123
6.4.2 Body composition
The whole body composition of mulloway (n = 45 groups) can be seen in
Figure 6.3 Average whole body protein (19.13 g 100 g-1) and ash (5.2 g 100 g-1)
content remained relatively constant independent of fish BW while energy, lipid and
moisture demonstrated an allometric response:
Energy (kJ g-1) = 4.492×BW(g)0.0729 (r2 = 0.75) (6.7)
Lipid (g 100 g-1) = 2.063×BW(g) 0.1838 (r2 = 0.53) (6.8)
Moisture (g 100 g-1) = 77.80×BW(g)-0.02 (r2 = 0.73) (6.9)
6.4.3 Metabolic body weight
The coefficient and metabolic weight exponent values for protein and energy
loss on starvation can be seen in Table 6.1. The relationship between daily protein
loss and geometric mean body weight at different temperatures and fasting durations
can be seen in Figures 6.4 and 6.5.
Table 6.1. Parameters of the power function y = axb describing the relationship between body mass and protein (g fish-1 day-1) or energy loss (kJ fish-1 day-1) on starvation.
Temperature & Fasting Duration (oC:weeks)
Protein loss
a(±se)
b(±se)
r2
Energy loss
a(±se)
b(±se)
r2
14:2 0.0004(±0.0003) 0.992(±0.13) 0.90 0.0565(±0.018) 0.836(±0.05) 0.99
14:4 0.0017(±0.002) 0.782(±0.19) 0.84 0.1066(±0.089) 0.778(±0.13) 0.92
20:2 0.0026(±0.003) 0.805(±0.21) 0.84 0.1661(±0.050) 0.768(±0.05) 0.99
20:4 0.0050(±0.002) 0.683(±0.05) 0.98 0.2415(±0.099) 0.687±(0.06) 0.97

124
6.4.3.1 Protein loss
Exponent values for protein loss ranged from 0.683 for the 20:4 group to
0.992 for the 14:2 group. However, when comparing b values amongst treatments a
global value of 0.764 could be used to describe b for all data sets (F = 0.30; P >0.5).
When comparing against H0: b = 0.7 only the 14:2 group differed significantly (F =
7.88; P < 0.05). No statistical difference was found when comparing b of all fasted
treatments against H0: b = 0.8.
0 100 200 300 400 500 600 700 8000.0
0.2
0.4
0.6
0.8
1.0
14oC 2wks
14oC 4wks
20oC 2wks
20oC 4wks
BW (g)
Pro
tein
loss
(g f
ish
-1 d
ay-1
)
Figure 6.4. Protein loss (g fish day-1) of mulloway after 2 or 4 weeks fasting at 14oC or 20oC (n = 12).
6.4.3.2 Energy loss
Exponent values for energy loss ranged from 0.687 for the 20:4 group to
0.836 for the 14:2 group. A global value of 0.748 could be used to describe b for data
sets (F = 0.50; P >0.5). No statistical difference was found when comparing b of all
fasted treatments against H0: b = 0.8

125
0 100 200 300 400 500 600 7000
5
10
15
20
25
30
14oC 2wks
20oC 2wks
20oC 4wks
14oC 4wks
BW (g)
En
erg
y lo
ss(k
J fi
sh-1
day
-1)
Figure 6.5. Energy loss (g fish day-1) of mulloway after 2 or 4 weeks fasting at 14oC or 20oC (n = 12).
6.4.4 Protein and energy requirements
A summary of the parameters used to populate the factorial model are
presented in Table 6.2. From Eqn. (6.1) the total requirement can be described for
dietary protein as:
DP requirement (g fish-1 day-1) = 0.47×BW(kg)0.7 + 1.72×protein gain (6.10)
and for dietary energy as:
DE requirement (kJ fish-1 day-1)
= (26.28+0.897T)×BW(kg)0.8 + 1.67×energy gain (6.11)
From Eqns. (6.10) and (6.11) the total daily protein and energy requirements
can then be calculated for the production range of mulloway (Table 6.3).

126
Table 6.2. Summary of parameter values used to populate the factorial model.
Term Equation / value Growth rate (g fish-1 day-1) 0.03344BW0.5699×exp(0.0451×T) Whole body composition (energy) (kJ/g) 4.492BW0.07288 Whole body composition (protein) (g/kg) 191.27 Utilization efficiency (energy) 0.60 Utilization efficiency (protein) 0.58 Maintenance requirement DE (kJ kg-0.8 day-1) 26.28+0.897T Maintenance requirement DP (g kg-0.7 day-1) 0.47
6.4.5 Feed formulations and practical diet assignment
Based on the protein and energy requirements calculated in Table 6.3 the
theoretical feed intake and feed conversion ratio’s (FCR’S) can then be predicted for
feeds with a pre specified energy content for any size mulloway up to 2 kg (Figure
6.6). Figure 6.6 is based on the “ideal” DP:DE requirement at each body weight
which in practice would require many different diets with a DP:DE content to reflect
this shifting requirement. Piecewise analyses identified significant changes in DP:DE
requirement at 111, 582 and 1120 g (Figure 6.7). Practical feed formulations based
on 3 growth stages, each with a fixed DP:DE content, can be seen in Table 6.4.

127
Table 6.3. Energy and protein requirements for mulloway at 20 and 26oC.
Live weight g 10 50 100 200 500 800 1100 2000 MBW (kg -0.8)a 0.03 0.09 0.16 0.28 0.57 0.84 1.08 1.74 Temperature MBW (kg -0.7)a 0.04 0.12 0.20 0.32 0.62 0.86 1.07 1.62 20 oC Growth (g fish-1 day-1)b 0.31 0.77 1.14 1.69 2.85 3.72 4.46 6.27 DE Maintenance (kJ fish-1 day-1)c 1.11 4.02 7.00 12.19 25.38 36.96 47.69 76.93 Energy gain (kJ fish-1 day-1)d 1.63 4.58 7.15 11.16 20.11 27.20 33.38 49.02 DE growth (kJ fish-1 day-1)e 2.71 7.63 11.91 18.60 33.51 45.33 55.63 81.70 DE total (kJ fish-1 day-1)f 3.82 11.65 18.91 30.79 58.89 82.30 103.32 158.63 %DE for maintenance 29.04 34.52 37.02 39.60 43.09 44.91 46.16 48.50 DP Maintenance (g fish-1 day-1)g 0.02 0.06 0.09 0.15 0.29 0.40 0.50 0.76 Protein gain (g fish-1 day-1)h 0.06 0.15 0.22 0.32 0.54 0.71 0.85 1.20 DP growth (g fish-1 day-1)i 0.10 0.25 0.38 0.56 0.94 1.23 1.47 2.07 DP total (g fish-1 day-1)j 0.12 0.31 0.47 0.71 1.23 1.63 1.97 2.83 %DP for maintenance 15.58 18.53 19.93 21.41 23.49 24.60 25.38 26.88 DP:DE (g DP MJ DE-1)k
31.30 26.62 24.77 23.01 20.83 19.77 19.08 17.83 26 oC Growth (g fish-1 day-1)b 0.40 1.00 1.49 2.21 3.73 4.88 5.85 8.22 DE Maintenance (kJ fish-1 day-1)c 1.25 4.51 7.86 13.68 28.48 41.47 53.51 86.32 Energy gain (kJ fish-1 day-1)d 2.13 6.00 9.37 14.63 26.36 35.66 43.76 64.26 DE growth (kJ fish-1 day-1)e 3.55 10.00 15.62 24.38 43.93 59.43 72.93 107.10 DE total (kJ fish-1 day-1)f 4.80 14.51 23.47 38.06 72.41 100.90 126.44 193.42 %DE for maintenance 25.95 31.09 33.48 35.95 39.33 41.10 42.32 44.63 DP Maintenance (g fish-1 day-1)g 0.02 0.06 0.09 0.15 0.29 0.40 0.50 0.76 Protein gain (g fish-1 day-1)h 0.08 0.19 0.29 0.42 0.71 0.93 1.12 1.57 DP growth (g fish-1 day-1)i 0.13 0.33 0.49 0.73 1.23 1.61 1.93 2.71 DP total (g fish-1 day-1)j 0.15 0.39 0.59 0.88 1.52 2.01 2.43 3.47 %DP for maintenance 12.34 14.79 15.96 17.21 18.97 19.93 20.60 21.90 DP:DE (g DP MJ DE-1)k
31.46 26.78 24.93 23.16 20.97 19.91 19.21 17.95 aLive weight scaled using exponents of 0.8 or 0.7 for energy and protein respectively gDP maintenance = 0.47 x MBW bDaily weight gain derived from growth model Eqn. (6.5) hProtein gain = Growth x 0.191 cDE maintenance = 26.28+0.897T x MBW iDP growth = Protein gain / 0.58 dEnergy gain = Growth x 4.492BW0.07288 jDP total = DP Maintenance + DP Growth eDE growth = Energy gain / 0.60 kDP:DE = (DP total / DE total) x 1000 fDE total = DE Maintenance + DE Growth
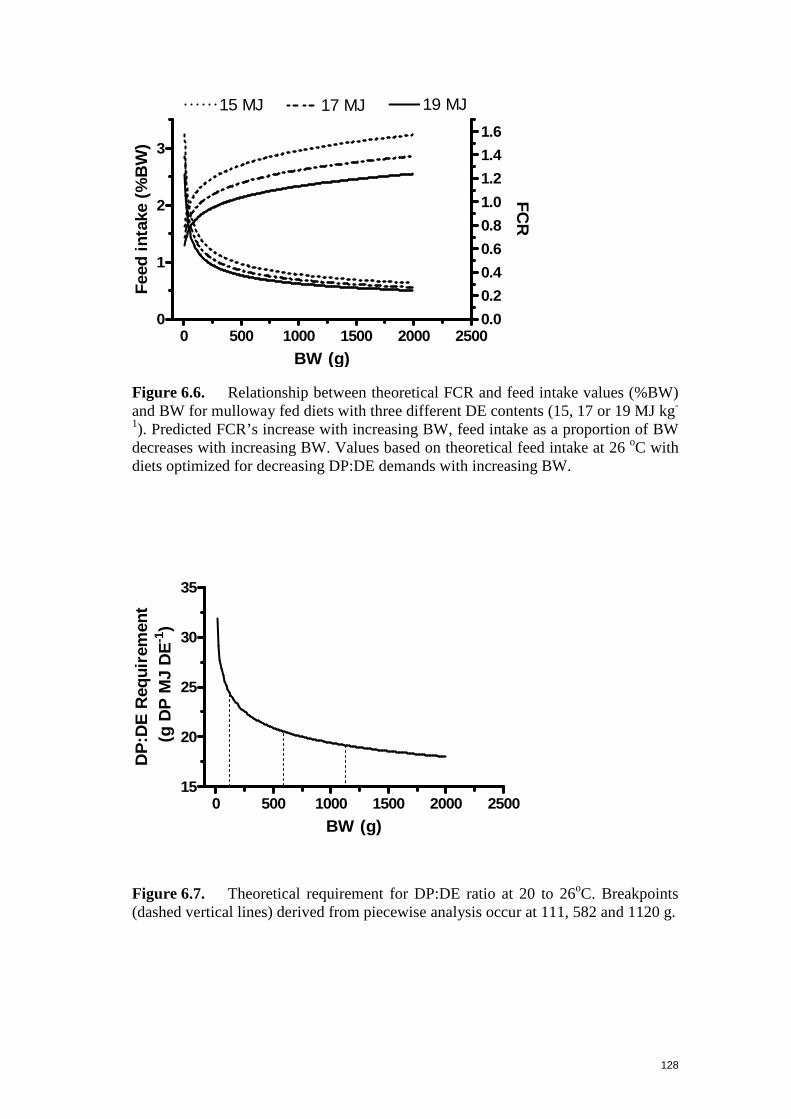
128
0 500 1000 1500 2000 25000
1
2
3
19 MJ17 MJ
0.0
0.2
0.4
0.6
0.8
1.0
1.2
1.4
1.6
15 MJ
BW (g)
Fee
d i
nta
ke (
%B
W)
FC
R
Figure 6.6. Relationship between theoretical FCR and feed intake values (%BW) and BW for mulloway fed diets with three different DE contents (15, 17 or 19 MJ kg-
1). Predicted FCR’s increase with increasing BW, feed intake as a proportion of BW decreases with increasing BW. Values based on theoretical feed intake at 26 oC with diets optimized for decreasing DP:DE demands with increasing BW.
0 500 1000 1500 2000 250015
20
25
30
35
BW (g)
DP
:DE
Req
uir
emen
t (
g D
P M
J D
E-1
)
Figure 6.7. Theoretical requirement for DP:DE ratio at 20 to 26oC. Breakpoints (dashed vertical lines) derived from piecewise analysis occur at 111, 582 and 1120 g.

129
Table 6.4. Iteratively derived feed formulations and feeding regimes at 20 and 26 oC. Estimates derived from fixed DP:DE ratios over 4 growth stages; 10-100 g = 31.3 g DP MJ DE-1 , 100-500 g = 24.8 g DP MJ DE-1, 500-1100 g = 20.8 g DP MJ DE-1, 1100-2000 g = 19.1 g DP MJ DE-1. Suggested appropriate diet specifications and feeding regimes shaded in boxes.
Live weight (g) 10 50 100 200 500 800 1100 2000 DE content 15.0 MJ kg-1 DP content (g kg-1)a 469.5 469.5 371.5 371.5 312.4 312.4 286.2 286.2 20 oC
Intake (g fish-1 day-1)b 0.25 0.78 1.26 2.05 3.93 5.49 6.89 10.58 Intake (%BW day -1) 2.55 1.55 1.26 1.03 0.79 0.69 0.63 0.53 Expected FCRc 0.83 1.01 1.11 1.22 1.38 1.47 1.54 1.69 26 oC Intake (g fish-1 day-1)b 0.32 0.97 1.56 2.54 4.83 6.73 8.43 12.89 Intake (%BW day -1) 3.20 1.94 1.56 1.27 0.97 0.84 0.77 0.64 Expected FCRc 0.80 0.96 1.05 1.15 1.29 1.38 1.44 1.57 DE content 17.0 MJ kg-1 DP content (g kg-1)a 532.1 532.1 421.0 421.0 354.1 354.1 324.3 324.3 20 oC Intake (g fish-1 day-1)b 0.22 0.69 1.11 1.81 3.46 4.84 6.08 9.33 Intake (%BW day -1) 2.25 1.37 1.11 0.91 0.69 0.61 0.55 0.47 Expected FCRc 0.73 0.89 0.98 1.07 1.22 1.30 1.36 1.49 26 oC
Intake (g fish-1 day-1)b 0.28 0.85 1.38 2.24 4.26 5.94 7.44 11.38 Intake (%BW day -1) 2.82 1.71 1.38 1.12 0.85 0.74 0.68 0.57 Expected FCRc 0.70 0.85 0.93 1.01 1.14 1.22 1.27 1.38 DE content 19.0 MJ kg-1 DP content (g kg-1)a 594.7 594.7 470.6 470.6 395.7 395.7 362.5 362.5 20 oC Intake (g fish-1 day-1)b 0.20 0.61 1.00 1.62 3.10 4.33 5.44 8.35 Intake (%BW day -1) 2.01 1.23 1.00 0.81 0.62 0.54 0.49 0.42 Expected FCRc 0.66 0.80 0.88 0.96 1.09 1.16 1.22 1.33 26 oC Intake (g fish-1 day-1)b 0.25 0.76 1.24 2.00 3.81 5.31 6.65 10.18 Intake (%BW day -1) 2.53 1.53 1.24 1.00 0.76 0.66 0.60 0.51 Expected FCRc 0.63 0.76 0.83 0.91 1.02 1.09 1.14 1.24
aDP content = Fixed DP:DE (values noted in Table 6.4 caption) x DE content bIntake = DE total (from Table 6.3) / DE content cExpected FCR = Intake / Growth (from Table 6.3)

130
6.5 Discussion
6.5.1 Feed formulation & feed requirements
This study applied a factorial approach to quantifying protein and energy
requirements using those parameters established in the previous chapters relating to
protein and energy utilization efficiencies and protein and energy requirements for
maintenance combined with whole body compositional and growth data to formulate
practical diets and feeding regimes for mulloway. Estimates of 26.7 and 24.4 g DP MJ
DE-1 for a 70 and 200 g fish respectively at 26 oC using the current factorial modelling
method fall close to those ranges established using the empirical dose response method
in Chapter 5. Comparison of DP:DE values between these two independent studies,
which used different methodologies to arrive at similar values, appear to mutually
validate the estimations of protein and energy requirements in mulloway.
The current practice of feeding mulloway feeds formulated for barramundi or
more generic “marine fish” formulations may not be ideal particularly for fish <500 g if
growth rates are to be maximized. This is because some commercial feeds can typically
contain 21.4 g DP MJ DE-1 (e.g. Chapter 4) which, when considering Table 6.3, may
not provide an adequate proportion of DP:DE for rapidly growing smaller fish
particularly if fish were fed restrictively (see Chapters 4 and 5).
The assignment of different diets with appropriate DP:DE content at key growth
stages throughout the production cycle will assist in maximizing growth potential in
mulloway. Piecewise polynomial analysis (Figure 6.7) specified key growth stages
although, for practical purposes, we can consider 100, 500 and 1100 g to represent
appropriate BW indicators at which point to change diets for mulloway. At each
successive designated growth stage the DP:DE content will decrease as indicated in

131
Table 6.3. Although demand for DE increases with increasing BW there may, however,
be little scope to supplement diets with non-protein energy sources as mulloway have
been shown to have a limited capacity to spare dietary protein (Chapter 5). The
potential for mulloway to utilize non-fishmeal based protein sources and non-protein
based energy sources requires further investigation.
As the requirement for DP:DE decreases with increasing fish size so to does the
maximum capacity for voluntary relative feed intake. Diets in Table 6.4 are presented at
three different energetic contents to accommodate feeding smaller fish a low energy 15
MJ diet and larger fish with higher energy 19 MJ diets. This is necessary firstly
because, on a relative basis, smaller fish consume more feed than larger fish and issues
of inadequate nutrient intake may occur in larger fish unable to ingest adequate feed
volumes to meet their nutrient requirements. Secondly, to maintain an appropriate
DP:DE content high energy diets require a proportionately high protein content and this
may be impractical to make particularly with, for example, 19 MJ diets containing 595
g DP kg-1 as indicated in Table 6.4.
6.5.2 Protein and energy composition
The DP:DE requirements derived using the factorial method (Table 6.3) show
mulloway to have a relatively high requirement for dietary protein not dissimilar to that
established for white grouper (Epinephelus aeneus) (Lupatsch and Kissil 2005) and
barramundi (Glencross 2008) although greater than that required by gilthead seabream
(Lupatsch et al. 2003c) and European sea bass (Lupatsch et al. 2001a). While protein
composition tends to remain fairly constant between fish species energy composition
can vary considerably and can also vary with body weight. The reason for the above
132
differences seen in DP:DE requirements between species is largely due to the different
requirements for energy. It would therefore appear prudent to calibrate compositional
estimations of mulloway with more fish samples >500 g as these may be
underrepresented in this study (Figure 6.3). This will assist in refining the energy model
presented in Eqn. (6.7).
6.5.3 Growth model
The growth model presented in Eqn. (6.5) is based on the growth assessment of
several cohorts of fish representing the growth potential for mulloway over a range of
temperatures. Care was taken to exclude cohorts performing poorly where feed intake
was dubious and any outliers were also removed from the data set to ensure that the
model represented the growth potential of mulloway under the given culture conditions.
However, as indicated above, the diets fed to mulloway, also currently used by industry,
may not provide an optimal DP:DE content particularly for smaller fish <300 g. Growth
assessments using diets formulated according to Table 6.4 will allow further refinement
of the growth model. Although estimations in Table 6.3 fall close to the 95 %
confidence interval range of DP:DE requirements estimated in Chapter 5, increasing the
value of the coefficient in Eqn. (6.5) will in turn increase estimations in the relative
demand for dietary protein (Eqn. (6.10)) pushing estimates even closer to those values
established in Chapter 5. It should also be noted that the growth model presented is
relevant for temperatures ranging from ~18 – 30 oC and care should be taken when
extrapolating outside these ranges.
The growth model also provides a useful management tool to ascertain if
general husbandry and feeding practices are of an adequate standard by comparing

133
actual vs. predicted growth rates. Growth rates found to be well below those predicted
in Eqn. (6.5) could indicate problems associated with feed intake such as the quality
and/or quantity of feed offered, poor water quality, inappropriate stocking densities (see
Appendix 1) or any number of other issues which can potentially retard growth.
6.5.4 Metabolic body weight
Body size and temperature are two of the fundamental determinants of
metabolic rate in living organisms (Clarke and Johnston 1999; Willmer et al. 2000;
Gillooly et al. 2001). The magnitude with which body mass (BW) influences
metabolism (M) is reflected in the value of the mass scaling exponent (b) in the general
form shown in Eqn. (6.4). In animals, b is generally <1 therefore the proportionality
between body mass and metabolic rate of different size animals is not constant and the
mass-specific metabolic rate tends to decrease with increasing body mass. To accurately
model protein and energy requirements throughout the production cycle metabolic rate
must be expressed as a proportion of the metabolic body weight; however, this study
demonstrated that the value of b will also vary depending on methodology. While this
study determined protein and energy loss on starvation in mulloway using a replicated
fully orthogonal design, the error associated with each treatment resulted in acceptance
of the null hypothesis. Methodology, data transformation, sample size and animal size
range are all known to influence the value of the allometric exponent (White and
Seymour 2005b; Hui and Jackson 2007; Packard and Boardman 2009) making
estimations of the “true” exponent value difficult. Hui and Jackson (2007) demonstrated
that large sample sizes are necessary (up to 61 % of population size) to obtain reliable
estimates of the allometric scaling exponent and reduce the likelihood of Type II error.

134
When sample sizes are small, they argue as is the case with most studies, erroneous
acceptance of a false null hypothesis can occur. A value of 0.8 describing the metabolic
weight loss of energy determined in the current study supports those for energy
metabolism established in Chapters 3 and 4 and the common inter-specific exponent
value applied to the energy metabolism of teleost fishes (Clarke and Johnston 1999). A
value of 0.7 describing the metabolic weight loss of protein was used which also allows
comparison with published data on other fish species (Lupatsch et al. 2001a; Lupatsch
et al. 2003c; Lupatsch and Kissil 2005; Glencross 2008) and is close to the 2/3 rather
than 3/4 power scaling of basal metabolic rate seen across different phyla (White and
Seymour 2003; Kozlowski and Konarzewski 2004; McKechnie and Wolf 2004). The
allometric relationship seen between BW and SL (solving for SL in Eqn. (6.3); b =
0.341) is also very close to 1-b = 0.333 power scaling used to describe the thermal-unit
growth co-efficient based on BW or length derived data (Iwama and Tautz 1981; Cho
1992).
6.5.5 Conclusion
The data presented in this chapter will assist in the formulation of appropriate
diets and feeding regimes to optimize the growth performance of mulloway in intensive
aquaculture throughout the production cycle to 2 kg BW. While estimations for DP and
DE in this study were found to be close to those established in Chapter 5 further growth
studies are required to validate those diets and feeding regimes prescribed in Table 6.4.

135
Chapter 7
General Discussion
Prior to the commencement of this research there were no published data on the
requirements for digestible protein (DP) and digestible energy (DE) for mulloway and,
as a consequence, no specific diet formulations or feeding standards were available. To
address this, a comprehensive series of studies quantifying the requirements for DP and
DE for maintenance and growth and the description of mulloway metabolism relating to
aspects of fasting and feeding physiology were undertaken. The results from these
studies were consolidated in Chapter 6 using a factorial modelling approach to produce
theoretical diet formulations and feeding tables applicable for mulloway throughout the
grow-out stage up to 2 kg body weight. This research has contributed towards
addressing several problems currently faced by marine fish farmers and aquafeed
manufacturers in Australia with regard to appropriate diet specifications and feed
management practices for mulloway.
The following discussion firstly addresses some of the influences of
methodology on establishing the requirements of DP and DE for maintenance and
growth obtained in the previous chapters. Particularly insightful is a sensitivity analysis
of the parameters used to populate the factorial model. The application of bioenergetic
principles to the varying planes of nutrition as they pertain to mulloway is then
discussed and an energy flow schematic is presented. The implications for industry are
136
then addressed in terms of the current feeding and culture strategies being used by
industry in light of the findings of this thesis. Future research directions are considered
including the further development of the feed evaluation system for mulloway. The
general discussion then concludes with a brief overview of the major findings of this
thesis.
7.1 Methodological considerations
7.1.1 Factors influencing estimations of protein and energy requirements based on
the factorial method: Individual parameter sensitivity
Individual parameter sensitivity analyses is a simple method to test the response
of the factorial model (Chapter 6) to small perturbations of individual parameter values
to identify which of the sub-model parameters have the greatest influence on the
predicted output, i.e. the predicted ratio of DP:DE. The change in model output relative
to the models response for a nominal set of parameter values can be calculated as:
nna
nna
PPP
RRRS
/)(
/)(
−−
=
Where S is the single parameter sensitivity, Ra and Rn are the models response to altered
and nominal parameter values respectively, and Pa and Pn are the altered and nominal
parameters respectively (Haefner 2005). Altered parameter values were calculated as
±10% of nominal values from Table 6.2. This method tests the influence of individual
parameters and does not consider the potential multiplicative effect of the simultaneous
change in two or more parameter values. The following discussion relates to parameter

137
sensitivity at 20 oC although stochastic variables such as temperature can, depending on
the output criteria, influence parameter sensitivity (e.g. Zhou et al. 2005). This
temperature was chosen as it was the common temperature used throughout this thesis
and is close to the average annual temperature experienced at mulloway sea cage
operations in Botany Bay, NSW (see Fig. 7.5).
The sensitivity analyses results presented in Table 7.1 are insightful as they
demonstrate, on several levels, the dynamic effect that small adjustments in individual
parameter values have on the overall estimates for DP:DE. Several generalisations can
be made. Firstly, the factorial model is fairly robust as there is very little compounding
of output values with adjustments of individual model parameter values, i.e. with only
minor exception, the magnitude of change in the output value was always less than the
magnitude of change of the input value over the size range tested. Secondly, because
the output is a ratio, an increase or decrease in any individual parameter value will
directly change the output value to reflect the influence of that parameter relative to the
requirement for DP. For example, an increase in protein utilisation efficiency will
decrease the requirement for DP while an increase in energy utilisation efficiency will
increase the requirement for DP. Thirdly, the magnitude of change of the absolute
output value will generally differ depending on the direction of parameter change. The
exception to this is the whole body protein constant where the magnitude of change in
absolute terms is equal regardless of the direction of parameter change. Lastly, the
relationship of any individual parameter influence on the magnitude of change for a
given body weight on the output value is allometric.
From Table 7.1 it can be seen that the individual parameters which have the
greatest influence on the predicted requirement for DP:DE for mulloway up to 2 kg are
the protein and energy utilisation coefficients and the whole body composition

138
coefficients for protein and energy while the growth model exponent value becomes
increasingly influential for fish >200 g. The accuracy of the utilization coefficients can
be assumed with some confidence as these were determined from controlled
experiments (Chapter 4) and were also found to be consistent with published values for
other fish species (Azevedo et al. 1998; Lupatsch et al. 2003b). The whole body
composition for protein is known to remain fairly constant in fish (Shearer 1994) and
was shown to be consistent across all the relevant studies in this thesis (Chapters 4, 5 &
6). However, unlike protein composition, relative whole body energy composition will
vary with body size (Figure 6.3) necessitating a comparatively large sample size to
accurately determine whole body energy composition over the desired size range.
Feeding history also strongly influences whole body energy composition making
previous DE intake an important consideration when attempting to establish energy
compositional profiles representative of a “normally” feeding population. This also has
implications for compositional analyses when comparing initial and treatment samples
(Chapters 4, 5). The influence of intake on whole body protein and energy composition
is clearly demonstrated in Figure 7.1.

139
Table 7.1. Parameter sensitivity analysis. Values represent % change in the predicted DP:DE values at 20 oC (Table 6.3) after altering individual model parameter values ±10%. Refer to Table 6.2 for original individual model parameter values. Parameters shown ranked in order of greatest to least influence on predicted DP:DE requirement based on the average (absolute) value over the fish weight range shown.
Live fish body weight (g) Altered value Parameter 10 50 100 200 500 800 1100 2000 Average +10% Whole body composition constant (protein) 8.4 8.1 8.0 7.9 7.7 7.5 7.5 7.3 7.8 Utilisation efficiency coefficient (protein) -7.9 -7.6 -7.5 -7.4 -7.2 -7.1 -7.0 -6.9 -7.3 Growth weight exponent 1.7 3.4 4.3 5.3 6.7 7.5 8.1 9.2 5.8 Utilisation efficiency coefficient (energy) 6.9 6.3 6.1 5.8 5.5 5.3 5.1 4.9 5.7 Whole body composition coefficient (energy) -6.6 -6.1 -5.9 -5.7 -5.4 -5.2 -5.1 -4.9 -5.6 Metabolic weight exponent (energy) 9.8 7.9 6.6 5.0 2.4 0.8 -0.4 -2.7 4.5 Maintenance constant (energy) -2.8 -3.3 -3.6 -3.8 -4.1 -4.3 -4.4 -4.6 -3.9 Maintenance constant (protein) 1.7 2.1 2.2 2.4 2.6 2.7 2.8 3.0 2.4 Whole body composition exponent (energy) -1.2 -1.9 -2.1 -2.3 -2.6 -2.7 -2.7 -2.8 -2.3 Metabolic weight exponent (protein) -4.3 -3.5 -3.0 -2.3 -1.1 -0.4 0.2 1.3 -2.0 Growth coefficient 1.3 1.5 1.6 1.7 1.9 1.9 2.0 2.1 1.7 Growth temperature exponent 1.2 1.4 1.5 1.6 1.8 1.8 1.9 1.9 1.6 -10% Utilisation efficiency coefficient (protein) 9.7 9.4 9.2 9.1 8.8 8.7 8.6 8.4 9.0 Whole body composition constant (protein) -8.4 -8.1 -8.0 -7.9 -7.7 -7.5 -7.5 -7.3 -7.8 Whole body composition coefficient (energy) 7.6 7.0 6.7 6.4 6.0 5.8 5.7 5.4 6.3 Utilisation efficiency coefficient (energy) -7.3 -6.8 -6.5 -6.3 -5.9 -5.8 -5.6 -5.4 -6.2 Growth weight exponent -1.8 -3.7 -4.6 -5.6 -7.0 -7.8 -8.3 -9.3 -6.0 Metabolic weight exponent (energy) -11.5 -8.5 -7.0 -5.2 -2.4 -0.8 0.4 2.7 -4.8 Maintenance constant (energy) 3.0 3.6 3.8 4.1 4.5 4.7 4.8 5.1 4.2 Metabolic weight exponent (protein) 5.9 4.3 3.5 2.6 1.2 0.4 -0.2 -1.3 2.4 Whole body composition exponent (energy) 1.2 1.9 2.1 2.3 2.6 2.7 2.8 2.9 2.3 Maintenance constant (protein) -1.6 -1.9 -2.0 -2.2 -2.4 -2.5 -2.6 -2.8 -2.3 Growth coefficient -1.4 -1.7 -1.8 -1.9 -2.1 -2.1 -2.2 -2.3 -2.0 Growth temperature exponent -1.2 -1.5 -1.6 -1.7 -1.8 -1.8 -1.9 -2.0 -1.7 Note: Ranked average values are for illustrative purposes and will obviously change depending on nominated body weight and range.

140
0 5 10 15 20
2
4
6
8
DE intake (kJ fish-1 day-1)
En
erg
y co
nte
nt
(kJ
g-1
)
0.0 0.1 0.2 0.3 0.410
15
20
25
30
DP intake (g fish-1 day-1)
Pro
tein
co
nte
nt
(g 1
00 g
-1)
Figure 7.1. Energy or protein whole body content as a function of DE or DP intake for 40 g mulloway (IBW) held at 26 oC for 57 days (n = 12). Data adapted from Chapter 4.
y = 0.326x + 1.36 (r2 = 0.99)
y = 0.165x + 19.89 (r2 = 0.002)

141
As indicated above, model parameters which respond allometrically with
body weight require a substantial data set over which reliable predictions can be
made. This is particularly the case when considering sub-models which have more
than one independent variable such as the growth model presented in Chapter 6. In
this case, integrating a temperature function requires an increase in the quantity of
growth data by an order of magnitude representing the different levels of growth as
a function of both body weight and temperature. The growth model for mulloway
can therefore be further calibrated with the collation of more data over the desired
production size and temperature ranges. While there are few published data on the
growth rates of mulloway to compare with, particularly for fish exceeding 200 g,
the model in its current form indicates a similar growth trajectory to that of
barramundi and white grouper when reared at the same temperature (Figure 7.2).
0 100 200 300 400 500 6000
500
1000
1500
2000
2500
mulloway
white grouper
barramundi
Days
BW
(g
)
Figure 7.2. Comparison of predicted body weight over time between mulloway, white grouper (Lupatsch and Kissil 2005) and barramundi (Lupatsch and Kissil 2003) growing from 1 g to 2 kg at 26 oC.

142
7.1.2 Estimating maintenance energy requirements
Values derived from RMR (Chapters 2 & 3), Eqns. (4.6) and (4.7) (Chapter
4) and energy loss on starvation for 4 weeks (Chapter 6) all gave similar estimates
for the maintenance energy requirements for unfed mulloway (Figure 7.3). Figure
7.3 also shows that estimates derived from mulloway fasted for 2 weeks will, on
average, be approximately 20% higher compared to those estimated using the other
three methods at 20 oC. A cascade of physiological and behavioural responses
occurs from the onset of starvation in animals which are dependant upon several
factors including the duration of food deprivation (Wang et al. 2006a). The onset of
food deprivation may initially promote the animal to search more actively for food
inturn increasing stress levels leading to an increase in energy expenditure in the
short term phase of starvation. This initial phase is then generally followed by the
animal becoming more quiescent and down regulating metabolism leading to a
relative reduction of energy expenditure over the longer term (Wang et al. 2006a).
The starvation method can be used to accurately determine maintenance energy
requirements in mulloway; however, 2 weeks starvation at 20 oC may not be a
sufficient length of time and 4 weeks duration appears to be more appropriate at this
temperature.
SDA and the utilisation efficiency of a diet for production are often
discussed in reciprocal terms (Bureau et al. 2002) and can be regarded as two sides
of the same coin. From Eqns. (4.6) and (4.7) SDA represents approximately 40% of
the total maintenance requirements for mulloway. Using this data as a proportion of
the requirements for maintenance estimated in Table 6.2 the theoretical SDA
coefficient can be calculated as approximately 12 to 16% of DE intake depending
on temperature (20 – 26 oC) and fish size (60 – 240 g) which is within the range

143
reported for most temperate fish species (6-23%) (Pandian and Vivekanandan 1985;
McCue 2006) and not too dissimilar to the SDA coefficients (7 – 11%) derived
empirically in Chapter 3 based on the oxyenergetic equivalent of MO2 rates at
similar temperatures and fish sizes.
0 250 500 750 1000 12500
10
20
30
40
Feed utilisation (4)
Fasting 20:2 (6)
RMR (2)
RMR (3)
Fasting 20:4 (6)
BW (g)
Mai
nte
nan
ce e
ner
gy
req
uir
emen
t(k
J fi
sh-1
day
-1)
Figure 7.3. Comparison of maintenance energy requirements of unfed mulloway at 20 oC using the different methodologies presented in this thesis. Legend codes are reference to the specific studies and chapter numbers: RMR (2) = Eqn. (2.13) (Chapter 2); RMR (3) = derived from Eqn. (3.1) using the oxyenergetic coefficient of 13.59 kJ mg-1 O2 (Chapter 3); Feed utilisation = y-intercept of Eqn. (4.6) (Chapter 4); Fasting 20:2 and 20:4 power functions adapted from Table 6.1 when b = 0.8 (Chapter 6).
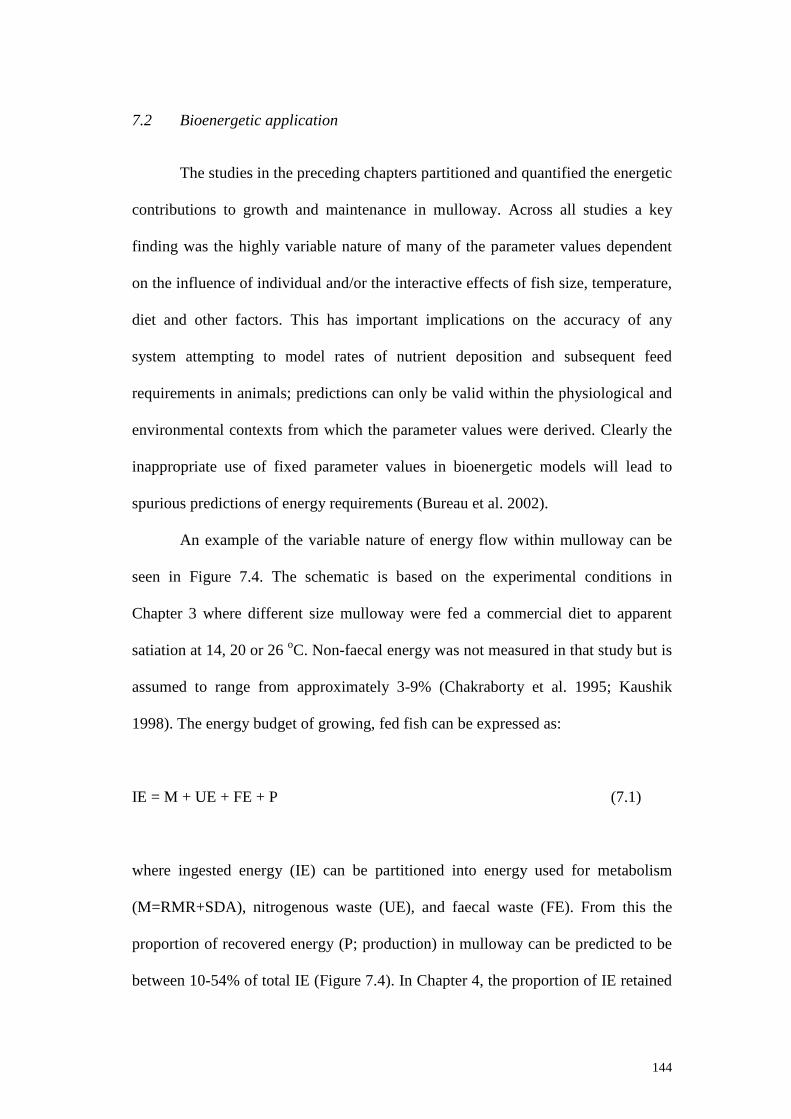
144
7.2 Bioenergetic application
The studies in the preceding chapters partitioned and quantified the energetic
contributions to growth and maintenance in mulloway. Across all studies a key
finding was the highly variable nature of many of the parameter values dependent
on the influence of individual and/or the interactive effects of fish size, temperature,
diet and other factors. This has important implications on the accuracy of any
system attempting to model rates of nutrient deposition and subsequent feed
requirements in animals; predictions can only be valid within the physiological and
environmental contexts from which the parameter values were derived. Clearly the
inappropriate use of fixed parameter values in bioenergetic models will lead to
spurious predictions of energy requirements (Bureau et al. 2002).
An example of the variable nature of energy flow within mulloway can be
seen in Figure 7.4. The schematic is based on the experimental conditions in
Chapter 3 where different size mulloway were fed a commercial diet to apparent
satiation at 14, 20 or 26 oC. Non-faecal energy was not measured in that study but is
assumed to range from approximately 3-9% (Chakraborty et al. 1995; Kaushik
1998). The energy budget of growing, fed fish can be expressed as:
IE = M + UE + FE + P (7.1)
where ingested energy (IE) can be partitioned into energy used for metabolism
(M=RMR+SDA), nitrogenous waste (UE), and faecal waste (FE). From this the
proportion of recovered energy (P; production) in mulloway can be predicted to be
between 10-54% of total IE (Figure 7.4). In Chapter 4, the proportion of IE retained
145
as P in mulloway which were fed to apparent satiation with the same commercial
diet at 20 and 26 oC fell within this range (P = ~30-40%; measured directly).
Energy budgets of mulloway fed below maintenance levels (Chapters 4 and
5) must take into account the catabolism of body tissue (i.e. loss of weight) as an
energy source and can be derived using a modification of Eq. (7.1):
IE - P = M + UE + FE (7.2)
Similarly, unfed fish will also catabolize body tissue although the parameter
M in this case will exclude any SDA effect:
-P = M + UE + FE (7.3)
Some authors exclude FE from Eq. (7.3) (e.g. Carter and Brafield 1991);
however, mulloway were observed to excrete faecal-like matter throughout the
starvation periods noted in Chapter 6. This may partly explain differences seen in
predicted vs. measured values for P estimates in some species resulting in energy
budgets of unfed fish being somewhat less accurate than those of fed fish (e.g.
Carter and Brafield 1991; Chakraborty et al. 1995). As P, M and UE can be
measured directly in Eq. (7.3); FE in unfed fish can then be estimated by difference
with reasonable accuracy. However, this remains to be validated for mulloway.
146
Figure 7.4. Dietary energy partitioning schematic for fed mulloway based on the culture conditions presented in Chapter 3. Digestibility coefficient from Booth (unpublished data, 2008). SDA and maintenance (RMR) energetic values from Chapter 3. Non-faecal energy assumed to be ~3-9% (Chakraborty et al. 1995; Kaushik 1998). Recovered energy estimated by difference.
Recovered Energy 10-54%
Gross Energy 100%
Digestible Energy 84%
Metabolizable Energy 75- 81%
Net Energy 62-74%
Faecal Energy 16%
Non-Faecal Energy 3-9%
SDA coefficient 7-11%
Maintenance 20-52%
147
7.3 Industry implications
The influence of nutritional and environmental factors and their interactions
on the growth of mulloway reported in this thesis have direct implications for the
mulloway aquaculture industry. Chapter 2 also provided information describing the
thermosensitivities of yellowtail kingfish and mulloway which have implications
with regard to the appropriate thermal range with which to culture these species and
also highlighted the critical importance of maintaining high DO levels for yellowtail
kingfish.
While mulloway are a eurythermal species, a temperature of around 26 oC is
likely to be the most suitable to optimise growth. Currently many commercial sites
in Australia are located where mean annual water temperatures are below 20oC. At
these established sites growth rates may be improved by the use of more efficient
feeds and improved feeding regimes, as indicated above and in the preceding
chapters. However, if optimised diets and feeding regimes are used in combination
with grow out at sites or facilities at or near optimal temperatures then the time to
market will be significantly reduced. The impact of temperature on growth rates and
subsequent time to market is clearly illustrated in Figure 7.5. From Eqn. (6.6), the
difference between the time taken for mulloway (BW0 = 1 g) to reach 2 kg when
exposed to different temperature profiles at Port Lincoln, SA compared to Kurnell,
NSW will be approximately 100 days. It should be noted that, apart from
temperature, Figure 7.5 assumes the same set of rearing conditions, water quality,
diet and feeding regimes.

148
0 100 200 300 400 500 600 700 8000
500
1000
1500
2000
2500
0
5
10
15
20
25
30
35
Days
BW
(g
)
Tem
peratu
reoC
Figure 7.5. Predicted growth rates of 1g mulloway to 2 kg at two different site locations in Australia. Growth rates calculated from Eqn. (6.6) based on 2005 – 07 daily sea surface temperatures (secondary y-axis) at Port Lincoln, SA (dotted lines) and Kurnell, NSW (solid lines). SST source: Bureau of Meteorology, Australia.
As indicated in Chapters 5 and 6, some commercial feeds currently being
used for mulloway may not provide an adequate proportion of DP:DE particularly
for rapidly growing fish <300 g. Aquafeeds currently marketed for marine fish in
Australia and generally containing approximately 20 g DP MJ DE-1 may be suitable
for mulloway > 500 g however, as clearly illustrated in Figure 5.5, mulloway <200
g fed these diets will show a reduced rate of protein accretion (g kgBW-0.7 day-1) of
approximately 40% when compared to those fed diets with 28.6 g DP MJ DE-1
(Chapter 5).
Dietary protein, particularly in the form of fishmeal, is usually the main
driver of aquafeed ingredient costs. Therefore diets formulated as suggested in
Table 6.3 will be more expensive than some of the less nutrient dense diets
currently available. However, a diet which is optimised to match the nutritional
requirements of a species will promote faster growth and improved feed conversion
ratios. The cost of feeds also represents the major expense associated with running

149
aquaculture farms; therefore the economic returns on a reduced time to market and
improved FCR’s need to be carefully considered when making decisions about the
most appropriate feeds and feeding regimes to use. A low cost feed does not
necessarily mean that it will be cost effective.
More efficient feeds, i.e. feeds that are better utilised, combined with better
feeding practices will also help mitigate environmental impacts in sea cage
operations by reducing excess excretion and feed wastage. This is particularly
important in oligotrophic environments where excessive nutrient loading from
intensive aquaculture may, for example, cause a shift in the diversity and abundance
of algal assemblages in near-shore natural systems inturn impacting on local faunal
communities (Mannino and Sara 2008).
7.4 Mulloway feed evaluation system - future direction
The factorial model applied to the development of feed formulations and
feeding strategies for mulloway in Chapter 6 was derived from a series of laboratory
based empirical studies and growth data obtained under both farm and laboratory
culture conditions. Although estimates for DP and DE requirements using the
factorial method in Chapter 6 were similar to those derived independently in
Chapter 5, engendering confidence in the results of both studies, the suggested feed
formulations and strategies presented in Chapter 6 are theoretical and remain to be
tested under commercial culture conditions. Successful validation through a series
of feeding trials performed under commercial culture conditions will assist in the
decision by the mulloway aquaculture industry in Australia to adopt the suggested
feed formulations and feeding strategies.

150
The factorial method used to define the requirements for DP and DE of
mulloway in this thesis is based predominantly on the work originally described by
Lupatsch et al. (1998). The theoretical framework of this method is highly adaptive
and could be applied to describe the requirements for other nutrients such as lipids
or individual amino acids. Optimization of feed formulations and feeding strategies
could also be achieved using alternative feed ingredients to the fishmeal based diets
used in the current study (see section 7.4.2 below). The growth model, which
underpins the factorial approach, can be integrated with other stochastic functions
such as salinity or dissolved oxygen etc. to better predict growth targets under
specific culture conditions. This is particularly pertinent to estuarine sea-cage
operations which experience large tidal and/or seasonal fluctuations in the
physicochemical profile of water quality parameters.
The use of more efficient feeds and feeding practices will invariably reduce
the amount of nutrient output on fish farms; however, accurate estimations of
nutrient loading are a necessary requirement in the legislation of modern
commercial aquaculture farms in Australia and other parts of the world. This is also
the case with regard to complying with environment protection policies for new
farm proposals. Application of the factorial method to estimate waste output has
been achieved for some species (Lupatsch and Kissil 1998; Lupatsch et al. 2003a;
Hua et al. 2008) and could readily be applied to mulloway.
7.5 Conclusions
The studies presented in this thesis have contributed directly to our
understanding of the nutritional energetics and the fundamental requirements for

151
digestible protein and digestible energy in mulloway. These studies provide the
knowledge foundation from which future nutritional studies and diet development
research can be built upon for this species. The fasting metabolism of yellowtail
kingfish was also described with implications relating to the optimal temperature for
routine metabolic function for this species.
Overview of the major conclusions in this thesis:
• The majority of parameter values for establishing bioenergetic budgets
for mulloway are not fixed and are highly variable dependent on body
size, temperature, diet and nutritional plane
• Mulloway have a broader temperature range for optimal routine
metabolic function compared to yellowtail kingfish. RMR for mulloway
and yellowtail kingfish are least thermally dependant at 28.5oC and at
22.8oC respectively
• The magnitude of the effect of temperature on the mass-specific RMR of
mulloway will vary depending on body size
• Both SDA duration and time to peak SDA are influenced by temperature
and body weight of mulloway. SDA duration will occur 41-89 h and
peak SDA will occur within 17 – 38 h of feeding at temperatures 14 – 26
oC
• A temperature of approximately 26±2 oC appears to be optimal for the
growth and metabolic function of mulloway
• Utilization efficiencies for DP and DE in mulloway are independent of
fish size, ration level or temperature

152
• Maintenance requirements for DP are influenced by body size of
mulloway but not temperature while maintenance requirements for DE
increase with increasing temperature and are also influenced by body
size
• Mulloway were shown to have a limited capacity to spare dietary protein
• Adoption of diet formulations and feeding strategies described in this
thesis will facilitate an improvement in the nutritional management of
mulloway

153
Appendix 1
Pilot Study: The Effect of Stocking Density and Repeated Handling
on the Growth of Juvenile Mulloway5
5The following Appendix is published as:
Pirozzi, I., Booth, M.A., Pankhurst, P.M., 2009. The effect of stocking density and repeated handling on the growth of juvenile mulloway, Argyrosomus japonicus (Temminck & Schlegel 1843). Aquac. Int. 17, 199-205.
A1.1 Abstract
The effect of stocking density on the growth of mulloway, was tested with 17 g fish
stocked at 4.08, 8.16 or 16.32 kg m-3 in 50 L aquaria. Weight checks were carried
out every two weeks to track performance. Each density treatment was also
compared to a non-handled control group to establish if handling during weight
checks influenced the growth of mulloway. Mulloway performed poorly at the
lowest density and, under the current experimental conditions, growth did not
appear to be negatively affected by regular handling.
A1.2 Introduction
Stocking density is one of the most important biotic factors influencing
growth and feed intake of fish in culture (Kestemont and Baras 2001) directly
modifying feeding behaviour (Boujard et al. 2002), social interactions (Barcellos et
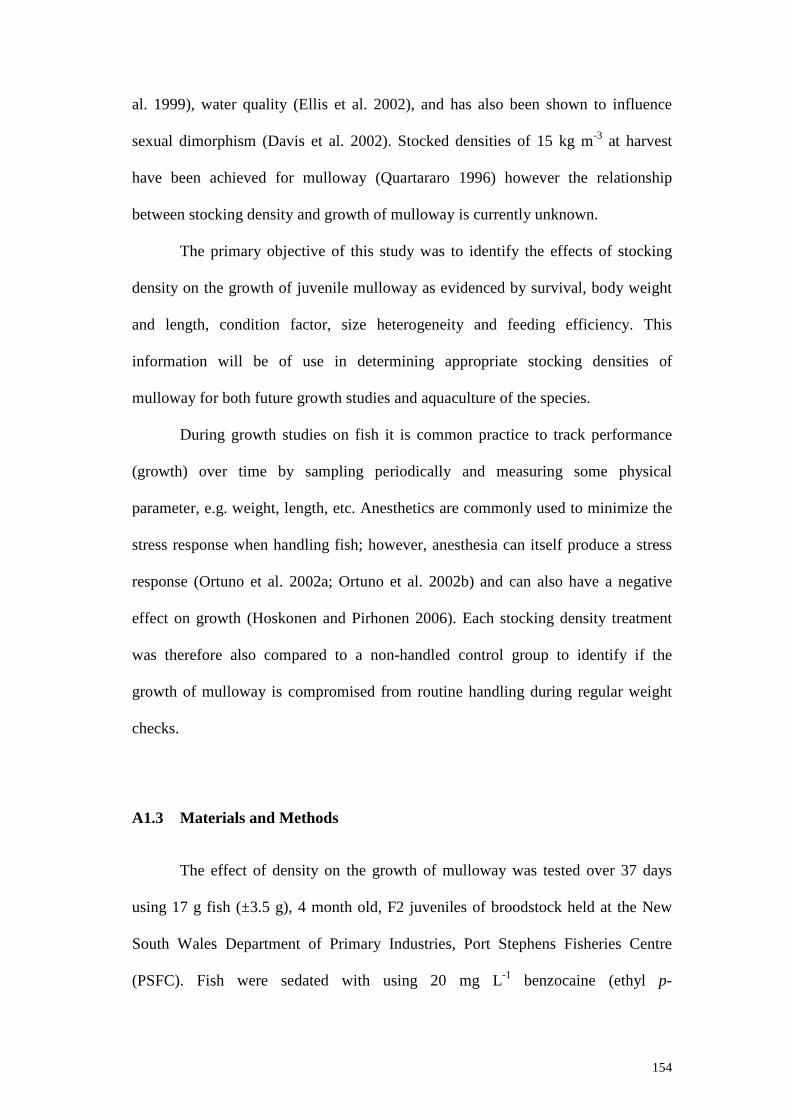
154
al. 1999), water quality (Ellis et al. 2002), and has also been shown to influence
sexual dimorphism (Davis et al. 2002). Stocked densities of 15 kg m-3 at harvest
have been achieved for mulloway (Quartararo 1996) however the relationship
between stocking density and growth of mulloway is currently unknown.
The primary objective of this study was to identify the effects of stocking
density on the growth of juvenile mulloway as evidenced by survival, body weight
and length, condition factor, size heterogeneity and feeding efficiency. This
information will be of use in determining appropriate stocking densities of
mulloway for both future growth studies and aquaculture of the species.
During growth studies on fish it is common practice to track performance
(growth) over time by sampling periodically and measuring some physical
parameter, e.g. weight, length, etc. Anesthetics are commonly used to minimize the
stress response when handling fish; however, anesthesia can itself produce a stress
response (Ortuno et al. 2002a; Ortuno et al. 2002b) and can also have a negative
effect on growth (Hoskonen and Pirhonen 2006). Each stocking density treatment
was therefore also compared to a non-handled control group to identify if the
growth of mulloway is compromised from routine handling during regular weight
checks.
A1.3 Materials and Methods
The effect of density on the growth of mulloway was tested over 37 days
using 17 g fish (±3.5 g), 4 month old, F2 juveniles of broodstock held at the New
South Wales Department of Primary Industries, Port Stephens Fisheries Centre
(PSFC). Fish were sedated with using 20 mg L-1 benzocaine (ethyl p-

155
aminobenzoate) and stocked into 50 L aquaria at one of three stocking densities:
4.08, 8.16 or 16.32 kg m-3 (12, 24 or 48 fish aquaria-1), nominally low (LD),
medium (MD) and high (HD) densities respectively. There were four replicate
aquaria for each density treatment. The control (non-handled) group consisted of an
additional four replicate aquaria for each of the three stocking densities. Once
stocked, the control fish were not handled until the completion of the experiment. In
this experiment the combined effects of anesthesia and handling cannot be separated
and therefore the terms ‘handling’ or ‘handled’ are used to denote both.
The experiment system consisted of 24 x 50 L replicate acrylic aquaria
integrated via a semi-recirculating bio-filtration unit. A moderate flow-through rate
allowed twice daily renewal of water to the system. Flow to each aquarium was
approximately 2 L min-1 ensuring similar water quality between all treatment
aquaria. Ranges and means (±SD) for water quality parameters were: temperature (o
C) 19.6 – 22.5, 20.8 (0.9); NH4+ (mg/L) 0.1 – 0.8, 0.4 (0.1); DO (mg/L) 5.3 – 7.2,
6.1 (0.3); pH 7.8 – 8.3, 8.0 (0.1); salinity (ppt) 26.0 – 32.3, 29.4 (1.4). Black plastic
sheets were placed between each aquarium and across the front to minimize
disturbance. All aquaria were exposed to 12L:12D photoperiod using fluorescent
lighting (<1 µE m-2 s-1 at aquaria surface).
Analysis of variance of initial weights (F2,21 = 3.35; P >0.05) and initial CV
(F2,21 = 0.76; P >0.1) demonstrated no significant difference between treatments. An
additional 100 individuals were also measured for weight and total length (LT) for
initial condition factor (K) comparison. Refer to Table 1 for summary of initial data.
Weight checks were carried out every two weeks on the handled treatment
group. To ensure that handling protocols during weight checks remained consistent
between all density treatments, fish in the highest density were sampled first and the

156
exposure time to handling and benzocaine per aquarium noted. This time (approx.
15 min.) was then applied to the remaining densities and also to subsequent weight
checks.
Fish were fed by hand twice daily (08:30 and 15:00) to apparent satiation
with a commercial barramundi (Lates calcarifer) diet (Ridley AquaFeed Pty. Ltd.,
Narangba, Qld. Australia; reported nutrient composition: 50% crude protein, 12%
crude fat, 2.5% fibre, 18 MJ kg-1 gross energy) which was reground and repelleted
(3mm) to sink.
Table A1.1. Summary of initial and final data. Initial data are means ±SD. Final data are pooled mean values (±se; n = 8) for each density tested. Tukey-Kramer test on means between densities shown as superscripts. Means sharing superscripts are not significantly different (P >0.05).
Aquaria were inspected daily and any mortalities were replaced with similar
size fish in order to maintain treatment densities. Replacement fish were fin clipped
(left pectoral) for ease of identification and were not used in the final analyses; all
data were derived from the tank means of the remaining original fish. Faeces and
feed debris were siphoned from tanks daily. Shoaling and feeding behaviour and
responses to routine aquaria maintenance were observed daily; however, these were
not quantified.
Treatment Survival (%)
Weight (g)
Length (mm)
Condition (K)
CV (%) FE
Initial Final LD
-
92.8 (3.3)
16.5 (1.9) 23.8 (0.7)a
117 (2.9) 131 (0.7)a
1.04 (0.06) 1.03 (0.02)
11.2 (1.4) 24.5 (2.3)
-
0.45 (0.04)a
MD
88.0 (2.5)
28.7 (0.8)b
139 (0.9)b
1.05 (0.01)
28.5 (1.9)
0.84 (0.03)b
HD
85.7 (1.9)
27.5 (0.7)b
138 (0.9)b
1.03 (0.01)
26.9 (1.2)
0.90 (0.04)b

157
Co-efficient of variation (CV) of weight (%), Condition factor (K) and
feeding efficiency (FE) were calculated as:
CV = s.x̄ -1 x 100
K = [W / LT 3] x 100
Where: W = wet weight (g) and LT = total length (cm)
FE = wet weight gain (g) / total feed intake (g)
A 2-way ANOVA was used to determine density and handling effects on the
dependent variables: survival (%), final weight (Wf), final length (Lf), FE, CV and
K. Cochran’s C test was used to test homogeneity of variances. Tukey-Kramer test
was used for a posteriori multiple comparison of means on significant terms.
Probability of Type I error was set at α = 0.05 for all analyses.
A1.4 Results
There was no significant interaction or handling main effect between
densities for all variables (survival (%), Wf, Lf, K, CV, FE) (Table A1.2). The
handling term was therefore removed and all subsequent analyses performed as a
single factor ANOVA on pooled data.
Mean individual weights were significantly different between density
treatments from the first weight check two weeks after initial stocking (F2,9 = 6.35;
P <0.02) (Figure A1.1). At week two MD fish were larger than LD fish but not
158
significantly different from the HD fish. By week four both the MD and HD fish
were larger than the LD fish (F2,9 = 8.05; P <0.01) (Figure A1.1). The effect of
stocking density was also significant on final weight (F2,21 = 12.35; P <0.001) and
final length (F2,21 = 20.48; P <0.001) with MD and HD fish larger than LD fish
(Table A1.1). Stocking densities (±SD; n = 8) at the conclusion of the experiment
were 5.7(0.5), 13.8(1.1) and 26.4(1.9) kg m-3 for LD, MD and HD respectively.
Total overall survival was 88 %. There was a trend for greater survival with
decreasing density; however, this was not statistically significant (F2,21 = 1.87; P
>0.1) (Table A1.1).
Final FE was significantly poorer for the LD treatment than MD and HD
treatments (Table A1.1). CV increased from initial stocking (Table A1.1); however
there was no significant difference between final density treatments (F2,21 = 1.07; P
>0.2; Table A1.1).
10
12.5
15
17.5
20
22.5
25
27.5
30
Initial Week 2 Week 4 Final
Sampling Period
Wei
gh
t (g
)
LD
MD
HD
Figure A1.1. Initial mean stocking weight (g) and mean weight of handled group over time (+/- se; n = 4). LD = 12, MD = 24 and HD = 48 fish aquaria-1. Tukey-Kramer test on means between densities shown for each sampling period. Means sharing letters are not significantly different (P >0.05).
A B B
A B B
A B AB

159
Initial and final condition co-efficients were similar (Table A1.1). Stocking density
did not have a significant effect on final K (F2,21 = 0.72; P >0.5). Heterogeneity of
variances could not be removed from final K data; however, ANOVA was still
performed. The result is valid as heterogeneous data increases the chance of Type I
error (Underwood 1997) and, in this case, there were no significant differences.
There was no agonistic behaviour observed during feedings or at other times
in any of the aquaria. LD fish appeared to be quite timid for the first two weeks;
often staying in the back corner of aquaria huddled together and taking longer to
approach food. In contrast, MD and HD fish were evenly dispersed throughout
aquaria. Fish did not appear to be disturbed by daily siphoning of aquaria. Lights
switching on and off startled the fish causing them to swim rapidly for several
seconds and collide with the aquaria surfaces; however, normal behaviour appeared
to resume quite quickly after each event.
Table A1.2. Two-factor analysis of variance for survival, final weight, final length, condition (K), CV and FE. ns indicates not significant at P < 0.05, * significant at p < 0.05, ** significant at p < 0.01.
Survival (%) Weightf Lengthf Condition
(K) CV FE
Term DF MS F P MS F P MS F P MS F P MS F P MS F P A. Handled v Control 1 3.99 0.07 ns 1.39 0.31 ns 12.14 2.07 ns 0.00 0.05 ns 1.43 0.05 ns 0.01 0.60 ns
B. Density 2 105.06 1.79 ns 51.99 11.55 ** 118.39 20.17 ** 0.001 0.67 ns 30.13 1.08 ns 0.47 40.42 **
AB 2 61.65 1.05 ns 2.99 0.66 ns 1.79 0.30 ns 0.001 0.71 ns 43.39 1.55 ns 0.01 0.85 ns Residual 18 58.56 4.50 5.87 0.001 27.99
160
A1.5 Discussion
The results indicate an appropriate initial (~17g fish) lower stocking
threshold for mulloway of above 4.08 kg m-3 while growth between MD and HD
were similar suggesting an initial stocking density in excess of 16.32 kg m-3 may be
achievable. While the direct extrapolation of MD or HD stocking densities used in
this experiment to commercial scale culture or different size classes of mulloway
may not be appropriate it is important to note that this study demonstrated the
significant negative effect of low stocking density on the growth of mulloway after
only two weeks.
Under the current experiment conditions mulloway were not negatively
affected by regular handling. Negative growth responses to anesthesia may be
anesthetic specific (e.g. Hoskonen and Pirhonen 2006) and in this case mulloway
appear to be able to tolerate regular weight checks using benzocaine. It should be
noted however that exposure to a repeated stressor can potentially reduce the ability
of fish to respond to an additional acute stressor (Barton 2002). It is unclear to what
extent, if any, that the daily switching on and off of lights (repeated stressor)
masked the additional effect of handling (acute stressor) on the growth of mulloway
in this experiment. Growth of MD mulloway in this experiment were however
comparable to those of juvenile mulloway in intensive culture using 10000 l tanks
(~0.35g day-1) (Booth, Allan and Losordo, unpub. data, 2002).
LD fish fed erratically; reluctant to feed when food was introduced into the
aquaria then darting over to pellets often stirring them up. MD and HD fish in
contrast fed well from the experiment outset. The FE value of the LD treatment
should be regarded with some caution as the erratic feeding behaviour of the LD
fish made accurate quantification of feed intake difficult. However; the low FE

161
value for this group does provide an indication of the overall inefficient feeding
behaviour of mulloway at low densities.
Qualitative observations during the present study did not identify any
obvious agonistic behaviour among any of the density treatments while the
similarity of growth heterogeneity between the density treatments reinforced this
observation. This implies a moderate social hierarchy independent of the stocking
densities used in this experiment (Brett 1979). This also occurred despite the
introduction of replacement fish to maintain density compliments.
One of the primary functions of shoaling behaviour in fish is predator
avoidance (Pitcher 1986) and the size of the shoal has been shown to directly
influence the behaviour of individuals (Magurran and Pitcher 1983). Magurran
(1986) proposed that as a fish shoal increases in size, “corporate vigilance” for
predators decreases. This relationship is not unique to fish and has been documented
extensively in many animal behavioral studies such as birds (Pulliam 1973), wild
boar (Quenette and Gerard 1992) and rabbits (Roberts 1988). The results and
observations from this study indicate that a lower threshold of stocking density may
also apply to mulloway; we hypothesize that, at a certain density, there forms a
social cohesiveness which encourages a reduction in corporate vigilance and a
change to normal feeding and behaviour. Below this threshold mulloway may
become increasingly skittish and vigilant for (perceived) predators, increasing
general activity and inefficient feeding behaviour. Growth and feeding studies
combined with quantifiable behavioral data would test this hypothesis.
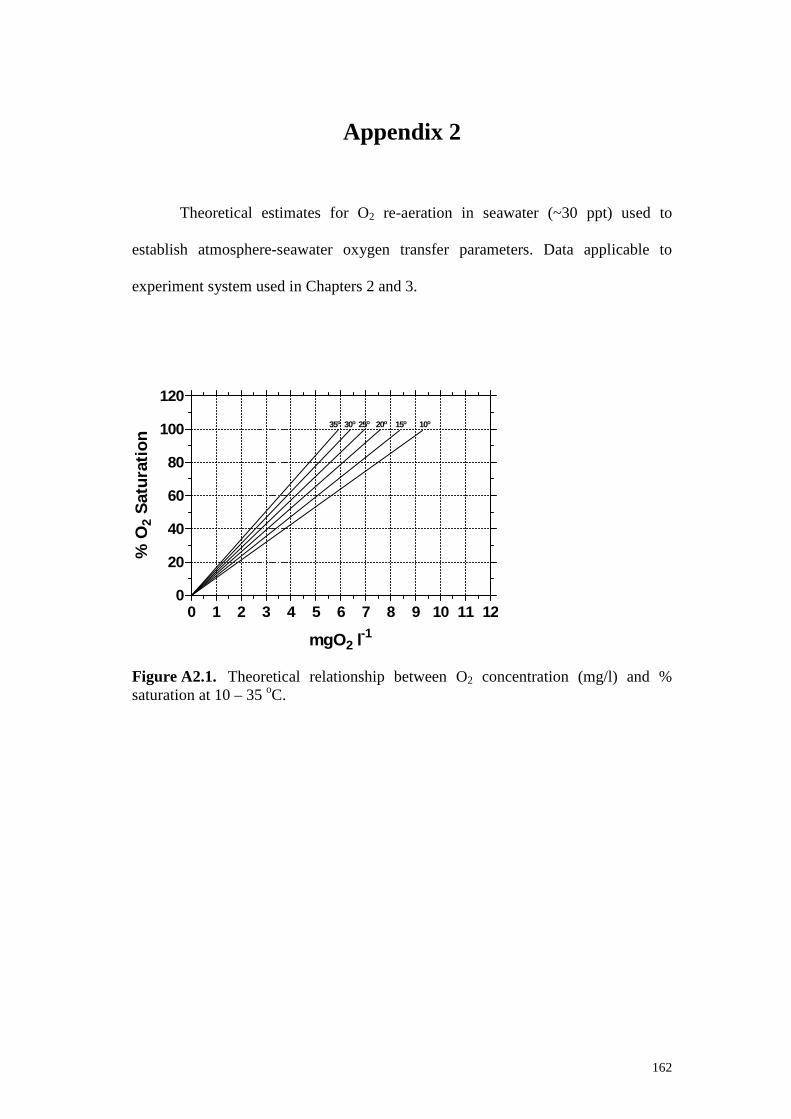
162
Appendix 2
Theoretical estimates for O2 re-aeration in seawater (~30 ppt) used to
establish atmosphere-seawater oxygen transfer parameters. Data applicable to
experiment system used in Chapters 2 and 3.
0 1 2 3 4 5 6 7 8 9 10 11 120
20
40
60
80
100
120
10o15o20o25o30o35o
mgO2 l-1
% O
2 S
atu
rati
on
Figure A2.1. Theoretical relationship between O2 concentration (mg/l) and % saturation at 10 – 35 oC.

163
0 48 96 144 192 240 288 336 384 43250
60
70
80
90
100
110
10oC
15oC
20oC
25oC
30oC
35oC
Time (h)
% S
atu
rati
on
Figure A2.2. Re-saturation rate
0 24 48 72 96 120 144 168 192 216 2400123456789
1010oC
15oC
20oC
25oC30oC35oC
Time (h)
mg
O2
l-1
Figure A2.3. Re-aeration rate

164
0 24 48 72 96 120 144 168 192 216 2400.00
0.02
0.04
0.06
0.08
0.10
0.12
0.14
10oC
15oC
20oC
30oC
35oC
25oC
Time (h)
mg
O2
l-1 h
-1
Figure A2.4. Re-aeration rate change

165
References
ABARE, 2008. Australian fisheries statistics 2007. In: Australian Bureau of
Agricultural and Resource Economics, Canberra, ACT, p. 86
Ai, Q.H., Mai, K.S., Tan, B.P., Xu, W., Duan, Q.Y., Ma, H.M., Zhang, L., 2006.
Replacement of fish meal by meat and bone meal in diets for large yellow
croaker, Pseudosciaena crocea. Aquaculture 260, 255-263.
Allan, G.L., Booth, M.A., 2004. The effects of dietary digestible protein and
digestible energy content on protein retention efficiency of juvenile silver
perch Bidyanus bidyanus (Mitchell). Aquacult. Res. 35, 970-980.
Altinok, I., Grizzle, J.M., 2003. Effects of low salinities on oxygen consumption of
selected euryhaline and stenohaline freshwater fish. J. World Aquacult. Soc.
34, 113-117.
Angilletta, M.J., Bennett, A.F., Guderley, H., Navas, C.A., Seebacher, F., Wilson,
R.S., 2006. Coadaptation: A unifying principle in evolutionary thermal
biology. Physiol. Biochem. Zool. 79, 282-294.
Angilletta, M.J., Niewiarowski, P.H., Navas, C.A., 2002. The evolution of thermal
physiology in ectotherms. J. Therm. Biol. 27, 249-268.
Association of the Official Analytical Chemists, 2005. Official methods of analysis
of the AOAC International. AOAC International, Gaithersburg, MD, USA.
Azevedo, P.A., Cho, C.Y., Leeson, S., Bureau, D.P., 1998. Effects of feeding level
and water temperature on growth, nutrient and energy utilization and waste
outputs of rainbow trout (Oncorhynchus mykiss). Aquat. Living Resour. 11,
227-238.
Azevedo, P.A., Leeson, S., Cho, C.Y., Bureau, D.P., 2004. Growth, nitrogen and
energy utilization of juveniles from four salmonid species: diet, species and
size effects. Aquaculture 234, 393-414.
Azevedo, P.A., van Milgen, J., Leeson, S., Bureau, D.P., 2005. Comparing
efficiency of metabolizable energy utilization by rainbow trout
(Oncorhynchus mykiss) and Atlantic salmon (Salmo salar) using factorial
and multivariate approaches. J. Anim. Sci. 83, 842-851.
Bajer, P.G., Whitledge, G.W., Hayward, R.S., 2004. Widespread consumption-
dependent systematic error in fish bioenergetics models and its implications.
Can. J. Fish. Aquat. Sci. 61, 2158-2167.
Baldwin, R.L., Bywater, A.C., 1984. Nutritional energetics of animals Annu. Rev.
Nutr. 4, 101-114.
Baldwin, R.L., Sainz, R.D., 1995. Energy partitioning and modeling in animal
nutrition. Annu. Rev. Nutr. 15, 191-211.

166
Barcellos, L.J.G., Nicolaiewsky, S., de Souza, S.M.G., Lulhier, F., 1999. The effects
of stocking density and social interaction on acute stress response in Nile
tilapia Oreochromis niloticus (L.) fingerlings. Aquac. Res. 30, 887-892.
Barton, B.A., 1997. Stress in finfish: past, present and future - a historical
perspective. In: Iwama, G.K., Pickering, A.D., Sumpter, J.P., Schreck, C.B.
(Eds.), Fish stress and health in aquaculture, Cambridge University Press,
Cambridge, U.K., pp. 1-34
Barton, B.A., 2002. Stress in fishes: A diversity of responses with particular
reference to changes in circulating corticosteroids. Integr. Comp. Biol. 42,
517-525.
Battaglene, S.C., Talbot, R.B., 1994. Hormone induction and larval rearing of
mulloway, Argyrosomus hololepidotus (Pisces, Sciaenidae). Aquaculture
126, 73-81.
Beamish, F.W.H., 1964. Respiration of fishes with special emphasis on standard
oxygen consumption. II. Influence of weight and temperature on respiration
of several species. Can. J. Zool. 42, 177-194.
Beamish, F.W.H., 1974. Apparent specific dynamic action of largemouth bass,
Micropterus salmoides. Journal of the Fisheries Research Board of Canada
31, 1763-1769.
Beaupre, S.J., 2005. Ratio representations of specific dynamic action (mass-specific
SDA and SDA coefficient) do not standardize for body mass and meal size.
Physiol. Biochem. Zool. 78, 126-131.
Becker, K., Meyerburgdorff, K., Focken, U., 1992. Temperature induced metabolic
costs in carp, Cyprinus carpio L., during warm and cold acclimatization.
Journal of Applied Ichthyology-Zeitschrift Fur Angewandte Ichthyologie 8,
10-20.
Beitinger, T.L., Fitzpatrick, L.C., 1979. Physiological and ecological correlates of
preferred temperature in fish. Am. Zool. 19, 319-329.
Bendiksen, E.A., Berg, O.K., Jobling, M., Arnesen, A.M., Masoval, K., 2003.
Digestibility, growth and nutrient utilisation of Atlantic salmon parr (Salmo
salar L.) in relation to temperature, feed fat content and oil source.
Aquaculture 224, 283-299.
Bernatzeder, A., Britz, P.J., 2007. Temperature preference of juvenile dusky kob
Argyrosomus japonicus (Pisces : Sciaenidae). Afr. J. Mar. Sci. 29, 539-543.
Boisclair, D., Tang, M., 1993. Empirical analysis of the influence of swimming
pattern on the net energetic cost of swimming in fishes. J. Fish Biol. 42, 169-
183.
Booth, M.A., Allan, G.L., Anderson, A.J., 2007. Investigation of the nutritional

167
requirements of Australian snapper Pagrus auratus (Bloch & Schneider,
1801): effects of digestible energy content on utilization of digestible
protein. Aquacult. Res. 38, 429-440.
Boujard, T., Labbe, L., Auperin, B., 2002. Feeding behaviour, energy expenditure
and growth of rainbow trout in relation to stocking density and food
accessibility. Aquac. Res. 33, 1233-1242.
Boyce, S.J., Clarke, A., 1997. Effect of body size and ration on specific dynamic
action in the Antarctic plunderfish, Harpagifer antarcticus Nybelin 1947.
Physiol. Zool. 70, 679-690.
Brett, J.R., 1971. Energetic responses of salmon to temperature. A study of some
thermal relations in the physiology and freshwater ecology of sockeye
salmon (Oncorhynchus nerka). Am. Zool. 11, 99-113.
Brett, J.R., 1979. Environmental factors and growth. In: Hoar, W.S., Randall, D.J.,
Brett, J.R. (Eds.), Fish Physiology, Volume VIII Bioenergetics and Growth,
vol. 8. Academic Press, pp. 599-675
Brett, J.R., Groves, T.D.D., 1979. Physiological energetics. In: Hoar, W.S., Randall,
D.J. (Eds.), Fish Physiology: Bioenergetics and Growth, vol. VIII. Academic
Press, New York, pp. 279-344
Brody, S., 1945. Bioenergetics and growth: with special reference to the efficiency
complex in domestic animals. Reinhold, New York.
Brown, C.R., Cameron, J.N., 1991. The relationship between specific dynamic
action (SDA) and protein-synthesis rates in the channel catfish. Physiol.
Zool. 64, 298-309.
Brown, J.H., Gillooly, J.F., Allen, A.P., Savage, V.M., West, G.B., 2004. Toward a
metabolic theory of ecology. Ecology 85, 1771-1789.
Brugere, C., Ridler, N., 2004. Global aquaculture outlook in the next decades: an
analysis of national aquaculture production forecasts to 2030. FAO Fisheries
Circular. No. 1001. Rome, FAO.
Burbridge, P., Hendrick, V., Roth, E., Rosenthal, H., 2001. Social and economic
policy issues relevant to marine aquaculture. J. Appl. Ichthyol./Z. Angew.
Ichtyol. 17, 194-206.
Bureau, D.P., Gunther, S.J., Cho, C.Y., 2003. Chemical composition and
preliminary theoretical estimates of waste outputs of rainbow trout reared in
commercial cage culture operations in Ontario. N. Am. J. Aqualcult. 65, 33-
38.
Bureau, D.P., Hua, K., Cho, C.Y., 2006. Effect of feeding level on growth and
nutrient deposition in rainbow trout (Oncorhynchus mykiss Walbaum)
growing from 150 to 600g. Aquacult. Res. 37, 1090-1098.

168
Bureau, D.P., Kaushik, S.J., Cho, C.Y., 2002. Bioenergetics. In: Halver, J.E., Hardy,
R.W. (Eds.), Fish Nutrition, Elsevier Science, USA, pp. 1–59
Bushnell, P.G., Steffensen, J.F., Johansen, K., 1984. Oxygen consumption and
swimming performance in hypoxia acclimated rainbow trout Salmo
gairdneri. J. Exp. Biol. 113, 225-235.
Cameron, J.N., 1989. The respiratory physiology of animals. Oxford University
Press, New York.
Carter, C.G., Brafield, A.E., 1991. The bioenergetics of grass carp,
Ctenopharyngodon idella (Val.): energy allocation at different planes of
nutrition. . J. Fish Biol. 39, 873-887.
Carter, C.G., Brafield, A.E., 1992. The relationship between specific dynamic
action and growth in grass carp, Ctenopharyngodon idella (Val.). J. Fish
Biol. 40, 895-907.
Carter, C.G., Hauler, R.C., 2000. Fish meal replacement by plant meals in extruded
feeds for Atlantic salmon, Salmo salar L. Aquaculture 185, 299-311.
Chakraborty, S.C., Ross, L.G., Ross, B., 1995. Energy budget and metabolism in
common carp, Cyprinus carpio L., fed on different dietary protein levels and
at different ration levels. Aquac. Nutr. 1, 179-187.
Chatelier, A., McKenzie, D., Claireaux, G., 2005. Effects of changes in water
salinity upon exercise and cardiac performance in the European seabass
(Dicentrarchus labrax). Mar. Biol. 147, 855-862.
Chen, W.K., Liu, K.M., Liao, Y.Y., 2008. Bioenergetics of juvenile whitespotted
bamboo shark Chiloscyllium plagiosum [Anonymous (Bennett)]. J. Fish
Biol. 72, 1245-1258.
Cho, C.Y., 1992. Feeding systems for rainbow-trout and other salmonids with
reference to current estimates of energy and protein-requirements.
Aquaculture 100, 107-123.
Cho, C.Y., Bureau, D.P., 1998. Development of bioenergetic models and the Fish-
PrFEQ software to estimate production, feeding ration and waste output in
aquaculture. Aquat. Living Resour. 11, 199-210.
Cho, C.Y., Bureau, D.P., 2001. A review of diet formulation strategies and feeding
systems to reduce excretory and feed wastes in aquaculture. Aquac. Res. 32,
349-360.
Cho, C.Y., Kaushik, S.J., 1990. Nutritional energetics in fish: energy and protein
utilization in rainbow trout (Salmo gairdneri). World Rev. Nutr. Diet. 61,
132-172.
Cho, C.Y., Slinger, S.J., 1979. Apparent digestibility measurement in feedstuffs for
rainbow trout. In: Halver, J.E., Tiews, K. (Eds.), Proc. World Symp. Finfish

169
Nutr. Fishfeed Technol., vol. 2. Heenemann Verlagsgesellschaft, Berlin,
GFR, Hamburg, GFR, pp. 239-247
Cho, C.Y., Slinger, S.J., Bayley, H.S., 1982. Bioenergetics of salmonid fishes:
energy intake, expenditure and productivity. Comp. Biochem. Physiol.1982.
vol. 73B, no. 1, pp. 25-41.
Chou, R.L., Su, M.S., Chen, H.Y., 2001. Optimal dietary protein and lipid levels for
juvenile cobia (Rachycentron canadum). Aquaculture 193, 81-89.
Claireaux, G., Lagardere, J.P., 1999. Influence of temperature, oxygen and salinity
on the metabolism of the European sea bass. J. Sea Res. 42, 157-168.
Clark, T.D., Seymour, R.S., 2006. Cardiorespiratory physiology and swimming
energetics of a high-energy-demand teleost, the yellowtail kingfish (Seriola
lalandi). J. Exp. Biol. 209, 3940-3951.
Clarke, A., Johnston, N.M., 1999. Scaling of metabolic rate with body mass and
temperature in teleost fish. J. Anim. Ecol. 68, 893-905.
Collett, P.D., Vine, N.G., Kaiser, H., Baxter, J., 2008. Determination of the optimal
water temperature for the culture of juvenile dusky kob Argyrosomus
japonicus Temminck and Schlegel 1843. Aquac. Res. 39, 979-985.
Company, R., Calduch-Giner, J.A., Kaushi, S., Perez-Sanchez, J., 1999. Growth
performance and adiposity in gilthead sea bream (Sparus aurata): risks and
benefits of high energy diets. Aquaculture 171, 279-292.
Cui, Y., Wootton, R.J., 1988. The metabolic rate of the minnow Phoxinus phoxinus
L. Pisces Cyprinidae in relation to ration body size and temperature. Funct.
Ecol. 2, 157-162.
Daniels, W.H., Robinson, E.H., 1986. Protein and energy requirements of juvenile
red drum (Sciaenops ocellatus). Aquaculture 53, 243-252.
Davis, C.R., Okihiro, M.S., Hinton, D.E., 2002. Effects of husbandry practices,
gender, and normal physiological variation on growth and reproduction of
Japanese medaka, Oryzias latipes. Aquatic Toxicology 60, 185-201.
Davis, D.A., Arnold, C.R., 1997. Response of Atlantic croaker fingerlings to
practical diet formulations with varying protein and energy content. J. World
Aquacult. Soc. 28, 241-248.
de la Gandara, F., Garcia-Gomez, A., Jover, M., 2002. Effect of feeding frequency
on the daily oxygen consumption rhythms in young Mediterranean
yellowtails (Seriola dumerili). Aquacultural Engineering 26, 27-39.
De Pedro, N., Guijarro, A.I., Delgado, M.J., Lopez-Patino, M.A., Pinillos, M.L.,
Alonso-Bedate, M., 2001. Influence of dietary composition on growth and
energy reserves in tench (Tinca tinca). J. Appl. Ichthyol. 17, 25-29.
Dewar, H., Graham, J.B., 1994. Studies of tropical tuna swimming performance in a

170
large water tunnel. 1. Energetics. J. Exp. Biol. 192, 13-31.
Dijkstra, J., Kebreab, E., Mills, J.A.N., Pellikaan, W.F., Lopez, S., Bannink, A.,
France, J., 2007. Predicting the profile of nutrients available for absorption:
from nutrient requirement to animal response and environmental impact.
Animal 1, 99-111.
Doroudi, M.S., Fielder, D.S., Allan, G.L., Webster, G.K., 2006. Combined effects
of salinity and potassium concentration on juvenile mulloway (Argyrosomus
japonicus, Temminck and Schlegel) in inland saline groundwater. Aquacult.
Res. 37, 1034-1039.
du Preez, H.H., McLachlan, A., Marais, J.F.K., 1986. Oxygen consumption of a
shallow water teleost, the spotted grunter, Pomadasys commersonni
(Lacepede, 1802). Comp. Biochem. Physiol., A 84A, 61-70.
Duan, Q.Y., Mai, K.S., Zhong, H.Y., Si, L.G., Wang, X.Q., 2001. Studies on the
nutrition of the large yellow croaker, Pseudosciaena crocea R. I: growth
response to graded levels of dietary protein and lipid. Aquacult. Res. 32, 46-
52.
Dumas, A., de Lange, C.F.M., France, J., Bureau, D.P., 2007. Quantitative
description of body composition and rates of nutrient deposition in rainbow
trout (Oncorhynchus mykiss). Aquaculture 273, 165-181.
Dumas, A., Dijkstra, J., France, J., 2008. Mathematical modelling in animal
nutrition: a centenary review. Journal of Agricultural Science 146, 123-142.
Dundas-Smith, P., Huggan, C., 2006. An overview of the Australian seafood
industry. In:
Einen, O., Roem, A., 1997. Dietary protein/energy ratios for Atlantic salmon in
relation to fish size: growth, feed utilization and slaughter quality. Aquacult.
Nutr. 3, 115-126.
Elliott, J.M., Davison, W., 1975. Energy equivalents of oxygen-consumption in
animal energetics. Oecologia 19, 195-201.
Ellis, T., North, B., Scott, A.P., Bromage, N.R., Porter, M., Gadd, D., 2002. The
relationships between stocking density and welfare in farmed rainbow trout.
J. Fish Biol. 61, 493-531.
Emmans, G.C., 1994. Effective energy - a concept of energy-utilization applied
across species. Br. J. Nutr. 71, 801-821.
Erfanullah, Jafri, A.K., 1995. Protein-sparing effect of dietary carbohydrate in diets
for fingerling Labeo rohita. Aquaculture 136, 331-339.
FAO, 1997. Review of the state of world aquaculture. In: FAO, Rome, p. 163
FAO, 2008. The state of the world fisheries and aquaculture (SOFIA). In:
Department, F.F.a.A. (Ed.) Rome, p. 176
171
Fielder, D.S., Bardsley, W., 1999. A preliminary study on the effects of salinity on
growth and survival of mulloway Argyrosomus japonicus larvae and
juveniles. J. World Aquacult. Soc. 30, 380-387.
Fielder, D.S., Bardsley, W.J., Allan, G.L., 1999. Enhancement of mulloway
(Argyrosomus japonicus) in intermittently opening lagoons. In: N.S.W. Fish.
Final Rep. Ser., vol. 14. New South Wales Fisheries, Sydney,
Finn, R.N., Ronnestad, I., van der Meeren, T., Fyhn, H.J., 2002. Fuel and metabolic
scaling during the early life stages of Atlantic cod Gadus morhua. Mar.
Ecol. Prog. Ser. 243, 217-234.
Fitzgibbon, Q.P., Baudinette, R.V., Musgrove, R.J., Seymour, R.S., 2008. Routine
metabolic rate of southern bluefin tuna (Thunnus maccoyii). Comp.
Biochem. Physiol. A-Mol. Integr. Physiol. 150, 231-238.
Fitzgibbon, Q.P., Seymour, R.S., Ellis, D., Buchanan, J., 2007a. The energetic
consequence of specific dynamic action in southern bluefin tuna Thunnus
maccoyii. J. Exp. Biol. 210, 290-298.
Fitzgibbon, Q.P., Strawbridge, A., Seymour, R.S., 2007b. Metabolic scope,
swimming performance and the effects of hypoxia in the mulloway,
Argyrosomus japonicus (Pisces: Sciaenidae). Aquaculture 270, 358-368.
Fonds, M., Cronie, R., Vethaak, A.D., Vanderpuyl, P., 1992. Metabolism, food-
consumption and growth of plaice (Pleuronectes platessa) and flounder
(Platichthys flesus) in relation to fish size and temperature. Neth. J. Sea Res.
29, 127-143.
Forstner, H., 1983. An automated multiple-chamber intermittent-flow respirometer.
In: Gnaiger, E., Forstner, H. (Eds.), Polarographic Oxygen Sensors: Aquatic
and Physiological Applications, Springer, Berlin, pp. 111–126
Fournier, V., Gouillou-Coustans, M.F., Metailler, R., Vachot, C., Guedes, M.J.,
Tulli, F., Oliva-Teles, A., Tibaldi, E., Kaushik, S.J., 2002. Protein and
arginine requirements for maintenance and nitrogen gain in four teleosts. Br.
J. Nutr. 87, 459-469.
Fry, F.E.J., 1957. The aquatic respiration of fish. In: Brown, M.E. (Ed.) The
physiology of fishes, vol. I. Academic Press, New York, pp. 1-63
Fu, S.J., Cao, Z.D., Peng, J.L., 2006. Effect of meal size on postprandial metabolic
response in Chinese catfish (Silurus asotus Linnaeus). J. Comp. Physiol. B-
Biochem. Syst. Environ. Physiol. 176, 489-495.
Fu, S.J., Cao, Z.D., Peng, J.L., 2007. Effect of purified macronutrients on specific
dynamic action in carnivorous southern catfish. Aquac. Nutr. 13, 216-221.
Fu, S.J., Xie, X.J., Cao, Z.D., 2005. Effect of meal size on postprandial metabolic
response in southern catfish (Silurus meridionalis). Comp. Biochem.

172
Physiol. A-Mol. Integr. Physiol. 140, 445-451.
Garcia-Alcazar, A., Abellan, E., Dehesa, M.R.L., Arizcun, M., Delgado, J., Ortega,
A., 1994. Pre-growout and growout results for sea bream (Sparus aurata L.)
and sea bass (Dicentrarchus labrax L.) with different fat/proteins ratios. Bol.
Inst. Esp. Oceanogr. 10, 191-201.
Garcia, S.M., Grainger, R.J.R., 2005. Gloom and doom? The future of marine
capture fisheries. Philos. Trans. R. Soc. B-Biol. Sci. 360, 21-46.
Gatlin III, D.M., 1995. Review of red drum nutrition. In: Chhorn, L., Sessa, D.
(Eds.), Nutrition and utilization technology in aquaculture, AOCS Press,
USA,
Gibson, T.S., Allan, G.L., File, G., Mullen, J.D., Scott-Orr, H., 2005. Priorities and
Principles for Investment in Aquaculture Research. In: NSW Department of
Primary Industries, Orange, p. 109
Gilchrist, G.W., 1995. Specialists and generalists in changing environments. 1.
Fitness landscapes of thermal sensitivity. Am. Nat. 146, 252-270.
Gillooly, J.F., Brown, J.H., West, G.B., Savage, V.M., Charnov, E.L., 2001. Effects
of size and temperature on metabolic rate. Science 293, 2248-2251.
Gillooly, J.F., Charnov, E.L., West, G.B., Savage, V.M., Brown, J.H., 2002. Effects
of size and temperature on developmental time. Nature 417, 70-73.
Glencross, B., 2008. A factorial growth and feed utilization model for barramundi,
Lates calcarifer based on Australian production conditions. Aquacult. Nutr.
14, 360-373.
Glencross, B.D., 2009. Reduced water oxygen levels affect maximal feed intake,
but not protein or energy utilization efficiency of rainbow trout
(Oncorhynchus mykiss). Aquac. Nutr. 15, 1-8.
Glencross, B.D., Felsing, M., 2006. Influence of fish size and water temperature on
the metabolic demand for oxygen by barramundi, Lates calcarifer (Bloch),
in freshwater. Aquac. Res. 37, 1055-1062.
Gooley, G.J., De Silva, S.S., Hone, P.W., McKinnon, L.J., Ingram, B.A., 2000.
Cage Aquaculture in Australia: A Developed Country Perspective with
Reference to Integrated Aquaculture Development Within Inland Waters. In:
Liao, C.I., Lin, K.C. (Eds.), Cage aquaculture in Asia: Proc. First Internat.
Symp. on Cage Aquaculture in Asia, Asian Fisheries Society, Manila and
World Aquaculture Society - Southeast Asian Chapter, Bangkok, pp. 21–37
Griffiths, M.H., 1996. Life history of the dusky kob Argyrosomus japonicus
(Sciaenidae) off the east coast of South Africa. South Afr. J. Mar. Sci.-Suid-
Afr. Tydsk. Seewetens. 17, 135-154.
Griffiths, M.H., 1997. Feeding ecology of South African Argyrosomus japonicus

173
(Pisces : Sciaenidae), with emphasis on the Eastern Cape surf zone. South
Afr. J. Mar. Sci.-Suid-Afr. Tydsk. Seewetens. 18, 249-264.
Griffiths, M.H., Heemstra, P.C., 1995. A contribution to the taxonomy of the marine
fish genus Argyrosomus (Perciformes: Sciaenidae), with descriptions of two
new species from southern Africa. Ichthyol. Bull. 65, 1-40.
Guderley, H., Johnston, I.A., 1996. Plasticity of fish muscle mitochondria with
thermal acclimation. J. Exp. Biol. 199, 1311-1317.
Guinea, J., Fernandez, F., 1997. Effect of feeding frequency, feeding level and
temperature on energy metabolism in Sparus aurata. Aquaculture 148, 125-
142.
Haefner, J.W., 2005. Modeling biological systems: principles and applications.
Springer Science, New York.
Hamada, A., Maeda, W., 1983. Oxygen uptake due to specific dynamic action of the
carp, Cyprinus carpio. Jap. J. Limnol./Rikusuizatsu. 44, 225-239.
Harrison, T.D., 2004. Physico-chemical characteristics of South African estuaries in
relation to the zoogeography of the region. Estuar. Coast. Shelf Sci. 61, 73-
87.
Harrison, T.D., Whitfield, A.K., 2006. Temperature and salinity as primary
determinants influencing the biogeography of fishes in South African
estuaries. Estuar. Coast. Shelf Sci. 66, 335-345.
Haynie, D.T., 2001. Biological Thermodynamics. Cambridge University Press.
Hemre, G.I., Sandnes, K., 2008. Seasonal adjusted diets to Atlantic salmon (Salmo
salar): Evaluations of a novel feed based on heat-coagulated fish mince, fed
throughout 1 year in sea: Feed utilisation, retention of nutrients and health
parameters. Aquaculture 274, 166-174.
Hochachka, P.W., Somero, G.N., 2002. Biochemical Adaptation: Mechanism and
Process in Physiological Evolution. Oxford University Press, USA.
Hölker, F., 2003. The metabolic rate of roach in relation to body size and
temperature. J. Fish Biol. 62, 565-579.
Hoskonen, P., Pirhonen, J., 2006. Effects of repeated handling, with or without
anaesthesia, on feed intake and growth in juvenile rainbow trout,
Oncorhynchus mykiss (Walbaum). Aquac. Res. 37, 409-415.
Houlihan, D., Boujard, T., Jobling, M., 2001. Food intake in fish. Blackwell Science
Pty Ltd, Victoria, Australia.
Houlihan, D.F., Hall, S.J., Gray, C., Noble, B.S., 1988. Growth-rates and protein-
turnover in Atlantic cod, Gadus morhua. Can. J. Fish. Aquat. Sci. 45, 951-
964.
Hua, K., de Lange, C.F.M., Niimi, A.J., Cole, G., Moccia, R.D., Fan, M.Z., Bureau,

174
D.P., 2008. A factorial model to predict phosphorus waste output of rainbow
trout (Oncorhynchus mykiss). Aquac. Res. 39, 1059-1068.
Huey, R.B., Hertz, P.E., 1984. Is a jack-of-all-temperatures a master of none?
Evolution 38, 441-444.
Hui, D.F., Jackson, R.B., 2007. Uncertainty in allometric exponent estimation: A
case study in scaling metabolic rate with body mass. J. Theor. Biol. 249,
168-177.
Huisman, E.A., Klein Breteler, J.G.P., Vismans, M.M., Kanis, E., 1979. Retention
of energy, protein, fat and ash in growing carp (Cyprinus carpio L.) under
different feeding and temperature regimes. In: Halver, J.E., Tiews, K. (Eds.),
World Symposium on Finfish Nutrition and Fishfeed Technology, vol. 1.
Heenemann Verlagsgesellschaft, Berlin (GFR), Hamburg (GFR), pp. 175-
188
Iwama, G.K., Tautz, A.F., 1981. A simple growth model for salmonids in
hatcheries. Can. J. Fish. Aquat. Sci. 38, 649-656.
Jobling, M., 1981. The influences of feeding on the metabolic rate of fishes: a short
review. J. Fish Biol. 18, 385-400.
Jobling, M., 1982. A study of some factors affecting rates of oxygen-consumption
of plaice, Pleuronectes platessa L. J. Fish Biol. 20, 501-516.
Jobling, M., 1994. Fish bioenergetics. Chapman & Hall, London. UK.
Jobling, M., Davies, P.S., 1980. Effects of feeding on metabolic-rate, and the
specific dynamic action in plaice, Pleuronectes platessa L. J. Fish Biol. 16,
629-638.
Johnston, I.A., Battram, J., 1993. Feeding energetics and metabolism in demersal
fish species from antarctic, temperate and tropical environments. Mar. Biol.
115, 7-14.
Kailola, P.J., Williams, M.J., Stewart, R.C., Reichelt, R.E., McNee, A., Grieve, C.,
1993. Australian Fisheries Resources. Bureau of Resource Sciences,
Department of Primary Industries and Energy, and the Fisheries Research
and Development Corporation, Canberra, Australia.
Kasumyan, A.O., Doving, K.B., 2003. Taste preferences in fishes. Fish and
Fisheries 4, 289-347.
Kaufman, R., Forstner, H., Wieser, W., 1989. Respirometry: methods and
approaches. In: Bridges, C.R., Butler, P.J. (Eds.), Techniques in
Comparative Respiratory and Physiology, Cambridge University Press,
Cambridge, pp. 51–76
Kaushik, S.J., 1998. Nutritional bioenergetics and estimation of waste production in
non-salmonids. Aquat. Living Resour. 11, 211-217.

175
Kaushik, S.J., Coves, D., Dutto, G., Blanc, D., 2004. Almost total replacement of
fish meal by plant protein sources in the diet of a marine teleost, the
European sea bass, Dicentrarchus labrax. Aquaculture 230, 391-404.
Kaushik, S.J., Medale, F., 1994. Energy-requirements, utilization and dietary supply
to salmonids. Aquaculture 124, 81-97.
Kellogg, R.L., Gift, J.J., 1983. Relationship between optimum temperatures for
growth and preferred temperatures for the young of four fish species Trans.
Am. Fish. Soc. 112, 424-430.
Kestemont, P., Baras, E., 2001. Environmental factors and feed intake: mechanisms
and interactions. In: Houlihan, D., Boujard, T., Jobling, M. (Eds.), Food
Intake in Fish, Blackwell Science, Oxford, UK, pp. 131-156
Kielanowski, J., 1965. Estimates of the energy cost of protein deposition in growing
animals. In: Blaxter, K.L. (Ed.) 3rd Symp. Energy Metabol., Academic
Press, London, U.K., Troon, Scotland, pp. 13–20
Kleiber, M., 1961. The Fire of life: an introduction to animal energetics. Wiley,
New York.
Koops, W.J., Grossman, M., 1993. Multiphasic allometry. Growth Development
and Aging 57, 183-192.
Kotz, J.C., Treichel, P., 1996. Chemistry & Chemical Reactivity. Saunders College
Publishing, Fort Worth.
Kozlowski, J., Konarzewski, M., 2004. Is West, Brown and Enquist's model of
allometric scaling mathematically correct and biologically relevant? Funct.
Ecol. 18, 283-289.
Ledividich, J., Vermorel, M., Noblet, J., Bouvier, J.C., Aumaitre, A., 1980. Effects
of environmental-temperature on heat-production, energy retention, protein
and fat gain in early weaned piglets. Br. J. Nutr. 44, 313-323.
Lee, H.Y.M., Cho, K.C., Lee, J.E., Yang, S.G., 2001. Dietary protein requirement of
juvenile giant croaker, Nibea japonica Temminck & Schlegel. Aquacult.
Res. 32, 112-118.
Lee, S.M., Jeon, I.G., Lee, J.Y., 2002. Effects of digestible protein and lipid levels
in practical diets on growth, protein utilization and body composition of
juvenile rockfish (Sebastes schlegeli). Aquaculture 211, 227-239.
Luo, Y.P., Xie, X.J., 2008. Effects of temperature on the specific dynamic action of
the southern catfish, Silurus meridionalis. Comp. Biochem. Physiol. A-Mol.
Integr. Physiol. 149, 150-156.
Luo, Z., Liu, Y.J., Mai, K.S., Tian, L.X., Liu, D.H., Tan, X.Y., Lin, H.Z., 2005.
Effect of dietary lipid level on growth performance, feed utilization and
body composition of grouper Epinephelus coioides juveniles fed

176
isonitrogenous diets in floating netcages. Aquacult. Int. 13, 257-269.
Lupatsch, I., Katz, T., Angel, D.L., 2003a. Assessment of the removal efficiency of
fish farm effluents by grey mullets: a nutritional approach. Aquac. Res. 34,
1367-1377.
Lupatsch, I., Kissil, G.W., 1998. Predicting aquaculture waste from gilthead
seabream (Sparus aurata) culture using a nutritional approach. Aquat.
Living Resour. 11, 265-268.
Lupatsch, I., Kissil, G.W., 2003. Effect of water temperature on energy and protein
requirements for maintenance and growth of Asian sea bass Lates calcarifer
In: World Aquaculture Society Meeting, World Aquaculture Society,
Salvador, Brazil, p. 430
Lupatsch, I., Kissil, G.W., 2005. Feed formulations based on energy and protein
demands in white grouper (Epinephelus aeneus). Aquaculture 248, 83-95.
Lupatsch, I., Kissil, G.W., Sklan, D., 2001a. Optimization of feeding regimes for
European sea bass Dicentrarchus labrax: a factorial approach. Aquaculture
202, 289-302.
Lupatsch, I., Kissil, G.W., Sklan, D., 2003b. Comparison of energy and protein
efficiency among three fish species gilthead sea bream (Sparus aurata),
European sea bass (Dicentrarchus labrax) and white grouper (Epinephelus
aeneus): energy expenditure for protein and lipid deposition. Aquaculture
225, 175-189.
Lupatsch, I., Kissil, G.W., Sklan, D., 2003c. Defining energy and protein
requirements of gilthead seabream (Sparus aurata) to optimize feeds and
feeding regimes. Israeli Journal of Aquaculture-Bamidgeh 55, 243-257.
Lupatsch, I., Kissil, G.W., Sklan, D., Pfeffer, E., 1998. Energy and protein
requirements for maintenance and growth in gilthead seabream (Sparus
aurata L.). Aquacult. Nutr. 4, 165-173.
Lupatsch, I., Kissil, G.W., Sklan, D., Pfeffer, E., 2001b. Effects of varying dietary
protein and energy supply on growth, body composition and protein
utilization in gilthead seabream (Sparus aurata L.). Aquacult. Nutr. 7, 71-
80.
Magnuson, J.J., 1973. Comparative study of adaptations for continuous swimming
and hydrostatic equilibrium of scombroid and xiphoid fishes. Fish. Bull. 71,
337-356.
Magurran, A.E., 1986. Individual differences in fish behaviour. In: The behaviour
of teleost fishes, Croom Helm, London & Sydney, pp. 338-365
Magurran, A.E., Pitcher, T.J., 1983. Foraging, timidity and shoal size in minnows
and goldfish. Behav. Ecol. Sociobiol. 12, 147-152.

177
Mannino, A.M., Sara, G., 2008. Effects of fish-farm biodeposition on periphyton
assemblages on artificial substrates in the southern Tyrrhenian Sea (Gulf of
Castellammare, Sicily). Aquatic Ecology 42, 575-581.
Marais, J.F.K., Kissil, G.W., 1979. Influence of energy-level on the feed-intake,
growth, food conversion and body-composition of Sparus-aurata.
Aquaculture 17, 203-219.
Martin, T.L., Huey, R.B., 2008. Why "Suboptimal" is optimal: Jensen's inequality
and ectotherm thermal preferences. Am. Nat. 171, E102-E118.
McCue, M.D., 2006. Specific dynamic action: A century of investigation. Comp.
Biochem. Physiol. A-Mol. Integr. Physiol. 144, 381-394.
McGoogan, B.B., Gatlin, D.M., 1998. Metabolic requirements of red drum,
Sciaenops ocellatus, for protein and energy based on weight gain and body
composition. J. Nutr. 128, 123-129.
McKechnie, A.E., Wolf, B.O., 2004. The allometry of avian basal metabolic rate:
good predictions need good data. Physiol. Biochem. Zool. 77, 502-521.
Misson, B.H., 1974. Open circuit respirometer for metabolic studies on domestic
fowl - establishment of standard operating-conditions. Br. Poult. Sci. 15,
287-297.
Montgomery, D.C., Peck, E.A., 1992. Introduction to linear regression analysis.
Wiley, New York.
Moors, P.J., 1977. Closed-circuit respirometer for measuring average daily
metabolic-rate of small mammals. Oikos 28, 304-308.
Mora, C., Maya, M.F., 2006. Effect of the rate of temperature increase of the
dynamic method on the heat tolerance of fishes. J. Therm. Biol. 31, 337-341.
Moreira, I.S., Peres, H., Couto, A., Enes, P., Oliva-Teles, A., 2008. Temperature
and dietary carbohydrate level effects on performance and metabolic
utilisation of diets in European sea bass (Dicentrarchus labrax) juveniles.
Aquaculture 274, 153-160.
Morgan, J.D., Iwama, G.K., 1991. Effects of salinity on growth, metabolism, and
ion regulation in juvenile rainbow and steelhead trout (Oncorhynchus
mykiss) and fall chinook salmon (Oncorhynchus tshawytscha). Can. J. Fish.
Aquat. Sci. 48, 2083-2094.
Motulsky, H., Christopoulos, A., 2003. Fitting models to biological data using linear
and non-linear regression. A practical guide to curve fitting. Graphpad
Software Inc., San Diego, CA.
Nanton, D.A., Vegusdal, A., Rora, A.M.B., Ruyter, B., Baeverfjord, G., Torstensen,
B.E., 2007. Muscle lipid storage pattern, composition, and adipocyte
distribution in different parts of Atlantic salmon (Salmo salar) fed fish oil

178
and vegetable oil. Aquaculture 265, 230-243.
Naylor, R.L., Goldburg, R.J., Primavera, J.H., Kautsky, N., Beveridge, M.C.M.,
Clay, J., Folke, C., Lubchenco, J., Mooney, H., Troell, M., 2000. Effect of
aquaculture on world fish supplies. Nature 405, 1017-1024.
NRC, 1993. Nutrient Requirements of Fish. National Academy Press, Washington,
D.C.
O'Sullivan, D., Roberts, N., 2000. Status of Australian Aquaculture in 1997 ⁄ 98.
Austasia Aquacult. Trade Directory 2000.
O'Sullivan, D., Ryan, M., 2001. Mulloway trials suggest opportunities for brackish
water ponds. Austasia Aquacult. April ⁄ May, 22-26.
O'Sullivan, D., Savage, J., 2009. Status of Australian Aquaculture in 2006⁄2007. In:
Austasia Aquaculture Trade Directory 2009, Turtle Press, Hobart, Tasmania,
pp. 6-25
O'Sullivan, D., Savage, J., Fay, A., 2007. Status of Australian Aquaculture in
2004⁄2005. Austasia Aquacult. Trade Directory 2007.
Ortuno, J., Esteban, M.A., Meseguer, J., 2002a. Effects of four anaesthetics on the
innate immune response of gilthead seabream (Sparus aurata L.). Fish
Shellfish Immunol. 12, 49-59.
Ortuno, J., Esteban, M.A., Meseguer, J., 2002b. Effects of phenoxyethanol on the
innate immune system of gilthead seabream (Sparus aurata L.) exposed to
crowding stress. Veterinary Immunology and Immunopathology 89, PII
S0165-2427(0102)00183-00186.
Owen, S.F., 2001. Meeting energy budgets by modulation of behaviour and
physiology in the eel (Anguilla anguilla L.). Comp. Biochem. Physiol. A-
Mol. Integr. Physiol. 128, 631-644.
Packard, G., Boardman, T., 2009. A comparison of methods for fitting allometric
equations to field metabolic rates of animals. J. Comp. Physiol. B-Biochem.
Syst. Environ. Physiol. 179, 175-182.
Pandian, T.J., Vivekanandan, E., 1985. Energetics of feeding and digestion. In:
Tytler, P., Calow, P. (Eds.), Fish Energetics: New Perspectives, Croom
Helm, London; Sydney pp. 99-124
Pauly, D., 2008. Global fisheries: a brief review. Journal of Biological Research-
Thessaloniki 9, 3-9.
Pauly, D., Christensen, V., Guenette, S., Pitcher, T.J., Sumaila, U.R., Walters, C.J.,
Watson, R., Zeller, D., 2002. Towards sustainability in world fisheries.
Nature 418, 689-695.
Peck, L.A., 1998. Feeding metabolism and metabolic scope in Antarctic marine
ectotherms. In: Portner, H.O., Plagle, R. (Eds.), Cold Ocean Physiology,

179
Cambridge University Press, pp. 365-390
Peck, M.A., Buckley, L.J., Bengtson, D.A., 2003. Energy losses due to routine and
feeding metabolism in young-of-the-year juvenile Atlantic cod (Gadus
morhua). Can. J. Fish. Aquat. Sci. 60, 929-937.
Peres, H., Oliva-Teles, A., 1999. Effect of dietary lipid level on growth performance
and feed utilization by European sea bass juveniles (Dicentrarchus labrax).
Aquaculture 179, 325-334.
Peres, H., Oliva-Teles, A., 2001. Effect of dietary protein and lipid level on
metabolic utilization of diets by European sea bass (Dicentrarchus labrax)
juveniles. Fish Physiol. Biochem. 25, 269-275.
Peres, H., Oliva-Teles, A., 2005. The effect of dietary protein replacement by
crystalline amino acid on growth and nitrogen utilization of turbot
Scophthalmus maximus juveniles. Aquaculture 250, 755-764.
Pitcher, T.J., 1986. Functions of shoaling behaviour in teleosts. In: The behaviour of
teleost fishes, Croom Helm, London & Sydney, pp. 294-337
Pulliam, H.R., 1973. On the advantages of flocking. J. Theor. Biol. 38, 419-422.
Quartararo, N., 1996. Grow-Out of snapper and mulloway in sea cages. In:
Quaratararo, N. (Ed.) Marine Finfish Farming Workshop, New South Wales
Fisheries, Cronulla, NSW, pp. 37-70
Quenette, P.Y., Gerard, J.F., 1992. From individual to collective vigilance in wild
boar (Sus scrofa). Can. J. Zool.-Rev. Can. Zool. 70, 1632-1635.
Rasmussen, R.S., Ostenfeld, T.H., McLean, E., 2000. Growth and feed utilisation of
rainbow trout subjected to changes in feed lipid concentrations. Aquac. Int.
8, 531-542.
Refstie, S., Korsoen, O.J., Storebakken, T., Baeverfjord, G., Lein, I., Roem, A.J.,
2000. Differing nutritional responses to dietary soybean meal in rainbow
trout (Oncorhynchus mykiss) and Atlantic salmon (Salmo salar).
Aquaculture 190, 49-63.
Regost, C., Arzel, J., Cardinal, M., Robin, J., Laroche, M., Kaushik, S.J., 2001.
Dietary lipid level, hepatic lipogenesis and flesh quality in turbot (Psetta
maxima). Aquaculture 193, 291-309.
Regost, C., Arzel, J., Cardinal, M., Rosenlund, G., Kaushik, S.J., 2003. Total
replacement of fish oil by soybean or linseed oil with a return to fish oil in
turbot (Psetta maxima). 2. Flesh quality properties. Aquaculture 220, 737-
747.
Ridler, N., Wowchuk, M., Robinson, B., Barrington, K., Chopin, T., Robinson, S.,
Page, F., Reid, G., Szemerda, M., Sewuster, J., Boyne-Travis, S., 2007.
Integrated multi-trophic aquaculture (imta): A potential strategic choice for
180
farmers. Aquacult. Econ. Manage. 11, 99-110.
Roberts, S.C., 1988. Social influences on vigilance in rabbits. Anim. Behav. 36,
905-913.
Robertson, R.F., Meagor, J., Taylor, E.W., 2002. Specific dynamic action in the
shore crab, Carcinus maenas (L.), in relation to acclimation temperature and
to the onset of the emersion response. Physiol. Biochem. Zool. 75, 350-359.
Rodehutscord, M., Pfeffer, E., 1999. Maintenance requirement for digestible energy
and efficiency of utilisation of digestible energy for retention in rainbow
trout, Oncorhynchus mykiss. Aquaculture 179, 95-107.
Ross, L.G., McKinney, R.W., Cardwell, S.K., Fullarton, J.G., Roberts, S.E.J., Ross,
B., 1992. The effects of dietary-protein content, lipid-content and ration
level on oxygen-consumption and specific dynamic action in Oreochromis
niloticus L. Comp. Biochem. Physiol. A-Physiol. 103, 573-578.
Sandberg, F.B., Emmans, G.C., Kyriazakis, I., 2005a. Partitioning of limiting
protein and energy in the growing pig: description of the problem, possible
rules and their qualitative evaluation. Br. J. Nutr. 93, 205-212.
Sandberg, F.B., Emmans, G.C., Kyriazakis, I., 2005b. Partitioning of limiting
protein and energy in the growing pig: testing quantitative rules against
experimental data. Br. J. Nutr. 93, 213-224.
Savage, V.M., Gillooly, J.F., Brown, J.H., West, G.B., Charnov, E.L., 2004a.
Effects of body size and temperature on population growth. Am. Nat. 163,
429-441.
Savage, V.M., Gillooly, J.F., Woodruff, W.H., West, G.B., Allen, A.P., Enquist,
B.J., Brown, J.H., 2004b. The predominance of quarter-power scaling in
biology. Funct. Ecol. 18, 257-282.
Schmidt-Nielsen, K., 1975. Scaling in biology: the consequences of size. J. Exp.
Zool. 194, 287 - 308.
Schroeder, G.F., Titgemeyer, E.C., 2008. Interaction between protein and energy
supply on protein utilization in growing cattle: A review. Livest. Sci. 114, 1-
10.
Schurmann, H., Steffensen, J.F., 1997. Effects of temperature, hypoxia and activity
on the metabolism of juvenile Atlantic cod. J. Fish Biol. 50, 1166-1180.
Secor, S., 2009. Specific dynamic action: a review of the postprandial metabolic
response. Journal of Comparative Physiology B: Biochemical, Systemic, and
Environmental Physiology 179, 1-56.
Secor, S.M., Boehm, M., 2006. Specific dynamic action of ambystomatid
salamanders and the effects of meal size, meal type, and body temperature.
Physiol. Biochem. Zool. 79, 720-735.

181
Secor, S.M., Diamond, J., 1997. Determinants of the postfeeding metabolic
response of Burmese pythons, Python molurus. Physiol Zool 70, 202 - 212.
Secor, S.M., Wooten, J.A., Cox, C.L., 2007. Effects of meal size, meal type, and
body temperature on the specific dynamic action of anurans. J. Comp.
Physiol., B 177, 165-182.
Sepulveda, C.A., Dickson, K.A., Graham, J.B., 2003. Swimming performance
studies on the eastern Pacific bonito Sarda chiliensis, a close relative of the
tunas (family Scombridae) I. Energetics. J. Exp. Biol. 206, 2739-2748.
Sepulveda, C.A., Graham, J.B., Bernal, D., 2007. Aerobic metabolic rates of
swimming juvenile mako sharks, Isurus oxyrinchus. Mar. Biol. 152, 1087-
1094.
Shearer, K.D., 1994. Factors affecting the proximate composition of cultured fishes
with emphasis on salmonids. Aquaculture 119, 63-88.
Shearer, K.D., 2000. Experimental design, statistical analysis and modelling of
dietary nutrient requirement studies for fish: a critical review. Aquac. Nutr.
6, 91-102.
Silberschneider, V., Gray, C.A., 2008. Synopsis of biological, fisheries and
aquaculture-related information on mulloway Argyrosomus japonicus
(Pisces : Sciaenidae), with particular reference to Australia. J. Appl.
Ichthyol./Z. Angew. Ichtyol. 24, 7-17.
Somero, G.N., 2005. Linking biogeography to physiology: Evolutionary and
acclimatory adjustments of thermal limits. Frontiers Zool. 2, [np].
Tacon, A., Metian, M., 2008. Global overview on the use of fish meal and fish oil in
industrially compounded aquafeeds: Trends and future prospects.
Aquaculture and Fisheries Management 285, 146-158.
Tacon, A.G.J., Hasan, M.R., Subasinghe, R.P., 2006. Use of fishery resources as
feed inputs for aquaculture development: trends and policy implication. In:
FAO Fisheries Circular, vol. No.1018. Rome, FAO, p. 99
Tandler, A., Beamish, F.W.H., 1981. Apparent specific dynamic action (sda), fish
weight and level of caloric-intake in largemouth bass, Micropterus
salmoides Lacepede. Aquaculture 23, 231-242.
Tidwell, J.H., Allan, G.L., 2001. Fish as food: aquaculture's contribution -
Ecological and economic impacts and contributions of fish farming and
capture fisheries. Embo Reports 2, 958-963.
Tilman, D., Fargione, J., Wolff, B., D'Antonio, C., Dobson, A., Howarth, R.,
Schindler, D., Schlesinger, W.H., Simberloff, D., Swackhamer, D., 2001.
Forecasting agriculturally driven global environmental change. Science 292,
281-284.

182
Toledo, L.F., Abe, A.S., Andrade, D.V., 2003. Temperature and meal size effects on
the postprandial metabolism and energetics in a boid snake. Physiol.
Biochem. Zool. 76, 240-246.
UN, 2008. World population prospects: the 2008 revision. In: vol. 2009. Population
Division of the Department of Economic and Social Affairs of the United
Nations Secretariat,
Underwood, A., 1997. Experiments in ecology: Their logical design and
interpretation using analysis of variance. Cambridge University Press, UK.
van der Meer, J., 2006. Metabolic theories in ecology. Trends Ecol. Evol. 21, 136-
140.
van Milgen, J., Noblet, J., 2003. Partitioning of energy intake to heat, protein, and
fat in growing pigs. J. Anim Sci. 81, E86-93.
van Milgen, J., Noblet, J., Dubois, S., 2001. Energetic efficiency of starch, protein
and lipid utilization in growing pigs. J. Nutr. 131, 1309-1318.
van Milgen, J., Quiniou, N., Noblet, J., 2000. Modelling the relation between energy
intake and protein and lipid deposition in growing pigs. Anim. Sci. 71, 119-
130.
Wang, T., Hung, C.C.Y., Randall, D.J., 2006a. The comparative physiology of food
deprivation: From feast to famine. Annu. Rev. Physiol. 68, 223-251.
Wang, T., Zaar, M., Arvedsen, S., Vedel-Smith, C., Overgaard, J., 2003. Effects of
temperature on the metabolic response to feeding in Python molurus. Comp.
Biochem. Physiol. A-Mol. Integr. Physiol. 519-527.
Wang, Y., Guo, J.L., Li, K., Bureau, D.P., 2006b. Effects of dietary protein and
energy levels on growth, feed utilization and body composition of cuneate
drum (Nibea miichthioides). Aquaculture 252, 421-428.
Watanabe, K., Hara, Y., Ura, K., Yada, T., Kiron, V., Satoh, S., Watanabe, T.,
2000a. Energy and protein requirements for maximum growth and
maintenance of bodyweight of yellowtail. Fish. Sci. 66, 884-893.
Watanabe, K., Ura, K., Yada, T., Kiron, V., Satoh, S., Watanabe, T., 2000b. Energy
and protein requirements of yellowtail for maximum growth and
maintenance of body weight. Fish. Sci. 66, 1053-1061.
Watson, R., Pauly, D., 2001. Systematic distortions in world fisheries catch trends.
Nature 414, 534-536.
Webb, P.W., 2002. Control of posture, depth, and swimming trajectories of fishes.
Integr. Comp. Biol. 42, 94-101.
Weibel, E.R., Bacigalupe, L.D., Schmitt, B., Hoppeler, H., 2004. Allometric scaling
of maximal metabolic rate in mammals: muscle aerobic capacity as
determinant factor. Respir Physiol Neurobiol 140, 115 - 132.
183
West, G.B., Woodruff, W.H., Brown, J.H., 2002. Allometric scaling of metabolic
rate from molecules and mitochondria to cells and mammals. Proc. Natl.
Acad. Sci. USA 99, 2473 - 2478.
White, C.R., Seymour, R.S., 2003. Mammalian basal metabolic rate is proportional
to body mass2/3. Proc Natl Acad Sci USA 100, 4046 - 4049.
White, C.R., Seymour, R.S., 2005a. Allometric scaling of mammalian metabolism.
J. Exp. Biol. 208, 1611-1619.
White, C.R., Seymour, R.S., 2005b. Sample size and mass range effects on the
allometric exponent of basal metabolic rate. Comp. Biochem. Physiol. A-
Mol. Integr. Physiol. 142, 74-78.
Wieser, W., 1994. Cost of growth in cells and organisms - general rules and
comparative aspects. Biol. Rev. Camb. Philos. Soc. 69, 1-33.
Williams, K.C., McMeniman, N., Barlow, C., Anderson, A.J., 1998. Fish meal
replacement in aquaculture feeds for barramundi. In: Final Report for project
93/120-04. Fisheries Research and Development Corporation., Canberra,
Australia, p. 91
Willmer, P., Stone, G., Johnston, I.A., 2000. Environmental Physiology of Animals.
Wiley-Blackwell.
Winberg, G.G., 1956. Rate of metabolism and food requirements of fishes. Fish.
Res. Board Can. Transl. Ser. 194, 1-253.
Withers, P.C., 1992. Comparative animal physiology. Brooks/Cole Thompson
Learning, Pacific Grove, California, USA.
Wuenschel, M.J., Jugovich, A.R., Hare, J.A., 2005. Metabolic response of juvenile
gray snapper (Lutjanus griseus) to temperature and salinity: Physiological
cost of different environments. J. Exp. Mar. Biol. Ecol. 321, 145-154.
Xie, S., Zhu, X., Cui, Y., Wootton, R.J., Lei, W., Yang, Y., 2001. Compensatory
growth in the gibel carp following feed deprivation: temporal patterns in
growth, nutrient deposition, feed intake and body composition. J. Fish Biol.
58, 999-1009.
Xie, S.Q., Cui, Y.B., Yang, Y.X., Liu, J.K., 1997. Energy budget of Nile tilapia
(Oreochromis niloticus) in relation to ration size. Aquaculture 154, 57-68.
Xie, X., Sun, R., 1990. The bioenergetics of Southern catfish (Silurus meridionalis
Chen). I. Resting metabolic rate as a function of bodyweight and
temperature. Physiol. Zool. 63, 1181-1195.
Zhou, Z.G., Xie, S.Q., Lei, W., Zhu, X.M., Yang, Y.X., 2005. A bioenergetic model
to estimate feed requirement of gibel carp, Carassius auratus gibelio.
Aquaculture 248, 287-297.