piramid - bureau of safety and environmental piramid a quantitative risk-based approach to integrity...
TRANSCRIPT

PIRAMID
A Quantitative Risk-based Approach toIntegrity Maintenance Planning
and Design Optimization forOffshore Pipelines
Mark StephensC-FER Technologies Inc.
Edmonton, Canada
advantage technology
createsC-FERTechnologies Inc.
Background to the PIRAMID Project
l A Multi-year Joint Industry Program
l Sponsorsl BC Gas Utilityl Enbridge Inc. (Interprovincial)l Foothills Pipe Linesl Kinder Morgan (KN Energy)l Southern California Gasl TransCanada Pipelinesl Gas Research Institutel Canadian Geological Surveyl U.S. Minerals Management Service

advantage technology
createsC-FERTechnologies Inc.
Program Goal
Develop Models and Software to:
l Make optimal maintenance decisionsl Ensure acceptable risk levelsl At the lowest possible cost
l Explain rationale behind decisionsl Internally within companyl Externally to regulators and the public

advantage technology
createsC-FERTechnologies Inc.
Issues To Be Addressed
l What is the operating risk associated withthe pipeline in its present state
l What effect would each candidate maintenancestrategy have on the operating risk
l What is the lowest cost maintenance optionthat meets acceptable safety & environmentalconstraints

advantage technology
createsC-FERTechnologies Inc.
PIRAMID Functions
Divide system into segments
Rank segments according to risk level
Determine optimal strategy for targeted segment
Implement optimal actions in order of refined ranking
Repeat for eachtargeted segment
MaintenanceOptimization
RiskRanking
The PIRAMIDThe PIRAMIDFunctionsFunctions

advantage technology
createsC-FERTechnologies Inc.
Risk Ranking
For each Segment in System
Identify Hazards
EstimateTotal Operating Risk
Rep
eat
for
All
Haz
ard
s
EstimateProbability of Failure
EstimateConsequences of Failure

advantage technology
createsC-FERTechnologies Inc.
Maintenance Optimization
For each Targeted Segment
Identify IntegrityMaintenance Options
Estimate Effect of Maintenance Strategyon the Probability of Failure
Calculate Risk reduction
Select Optimal IntegrityMaintenance Strategy
Rep
eat
for
All
Op
tio
ns

advantage technology
createsC-FERTechnologies Inc.
PIRAMID Features
l Quantitative approachl Extensive use of engineering modelsl Calculates total risk
l financiall safetyl environmental
l Validated by real pipeline data

advantage technology
createsC-FERTechnologies Inc.
Probability Estimation Approaches
Information Analysis FailureProbabilities
Conditiondata
ReliabilityModels
Failure rates Adjustmentfactors
FailureProbabilities
General
Adjusted historical failure rate method
Structural reliability method
FailureProbabilities

advantage technology
createsC-FERTechnologies Inc.
Adjusted Historical Failure Rate Method
ijlkllijkl AFMFRfbRf ==
Failure rate forsection, mode and cause
1. Baseline failurerate per cause
3. Adjustment factorfor section and cause
2. Relative failureprobability per mode

advantage technology
createsC-FERTechnologies Inc.
Other
External Corrosion
Mechanical damage
Ground movement
Environmental cracking
Fabrication defects
Internal Corrosion
Baseline Failure Rates by Cause

advantage technology
createsC-FERTechnologies Inc.
Failure Rates by Mode
Failure Caus e Mode Factorsmall leak large leak rupture
Metal Lo s sCorro s ion
??? ??? ???
MechanicalDamage
??? ??? ???
GroundMovement
??? ??? ???
Cracks ??? ??? ???
OtherCaus e s
??? ??? ???

advantage technology
createsC-FERTechnologies Inc.
Probability Adjustment Factors
( ) CCCTCPSC FFFFTtAfAF ,, =
Adjustmentfactor
Operatingtemperature
Wall thickness
Line age
Soil corrosivityfactor
Cathodic protectionfactor
Coating typefactor
Coating conditionfactor
E.g. - for External Corrosion
advantage technology
createsC-FERTechnologies Inc.
Adjusted Failure Rates - Summary
l Simple models utilizing
l Statistical data
l Engineering analysis
l Judgment
l Suitable for segment ranking

advantage technology
createsC-FERTechnologies Inc.
Structural Reliability Approach
Load or ResistanceMean
ResistanceMean Load
Resistance DistributionLoad Distribution
Overlap Leadingto Failure Probability

advantage technology
createsC-FERTechnologies Inc.
Application to External Corrosion
Outer Diameter
(D)
Wall Thickness
(t)Hoop
Stress (S)
Corroded Length (L)
Maximum Corroded Depth (d)
Failure rate / km = No. Defects per km x Failure probability per defect

advantage technology
createsC-FERTechnologies Inc.
Failure Probability per Defect
Data on pipeproperties and
dimensions
Maximumoperatingpressure
InspectionData
Measurementuncertainties
Corrosion modeland test results
Data fromrepetitive
inspections
Failure probabilityas a
function of time
Model results
Test results
xxxx
xx
x
xx
x
x
modeluncertainties
Flaw depth (mm)
Prob. density
corrosioncharacteristics
Prob. density
Growth Rate (mm/yr)
corrosiongrowth rates
Yield stress (MPa)
Frequency
pipeproperties
advantage technology
createsC-FERTechnologies Inc.
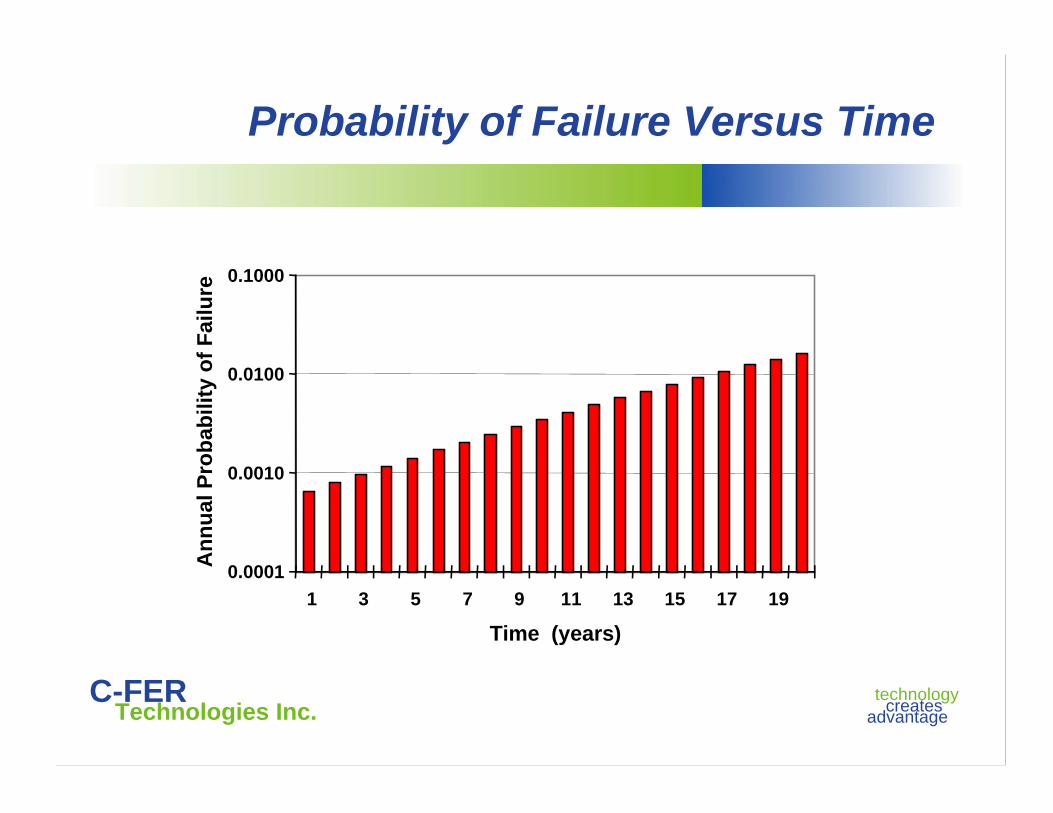
Probability of Failure Versus Time
0.0001
0.0010
0.0100
0.1000
1 3 5 7 9 11 13 15 17 19
Time (years)
An
nu
al P
rob
abili
ty o
f F
ailu
re

advantage technology
createsC-FERTechnologies Inc.
Effect of Maintenance
l Mitigation philosophyl Find and eliminate defects before they reach critical size
l Maintenance optionsl Inspection and repairl Hydro-testing
l Maintenance impactl Reduce number of defects per unit line lengthl Shift defect size distribution toward smaller values

advantage technology
createsC-FERTechnologies Inc.
Quantifying Effect of Maintenance
Size oforiginal defects
Size ofundetected defects
Size ofdetected defects
Measured size ofdetected defects
Inspectiondetection power
Size of remainingdetected defects
Inspection sizingaccuracy
Repaircriterion
Size of allremaining defects

advantage technology
createsC-FERTechnologies Inc.
Modified Defect Size Distributions
0
0.2
0.4
0.6
0.8
1
0 1 2 3 4 5 6
Defect Depth (mm)
Pro
bab
ility
Den
sity
Detected1.25 MAOP1.5 MAOP

advantage technology
createsC-FERTechnologies Inc.
Effect on Probability
0.0001
0.0010
0.0100
0.1000
1 3 5 7 9 11 13 15 17 19
Time to Next Inspection (years)
An
nu
al P
rob
abili
ty o
f F
ailu
re p
er k
m
No repair1.25 MAOP1.5 MAOP

advantage technology
createsC-FERTechnologies Inc.
Application to Mechanical Damage
Outer Diameter
(D)
Wall Thickness
(t)Yield Stress (S)
Impact Energy (E)
Failure probability = (No. line hits) x (Failure probability per hit)

advantage technology
createsC-FERTechnologies Inc.
Probability of Failure Given Hit
Yield stress (MPa)
Frequency
Model results
Test results
xxxx
xx
x
xx
x
x
Data on steelproperties and
pipe dimensions
Puncture modeland
test results
Data onequipment
size and weight
Failure probabilitygiven hit
modeluncertainties
pipeproperties
Load (kN)
Frequency
outsideforce

advantage technology
createsC-FERTechnologies Inc.
Frequency of Line Hits
Fault Tree Model(inductive logic)
Basic event probabilities(a function of line attributes)
Pipeline hitby
dragged object
Seabedcontact with
dragged object
Failure ofon-bottomprotection
Vesselactivity on
sea surface
Draggedobject
deployed
Seabeddisturbance
exceedscover depth
Failure ofmechanicalprotection
Pipeline hitby
dragged object
Seabedcontact with
dragged object
Failure ofon-bottomprotection
Vesselactivity onsea surface
Draggedobject
deployedover
alignment
Seabeddisturbance
exceedscover depth
Failure ofmechanicalprotection
Similar fault tree forvessel hull grounding
Top event

advantage technology
createsC-FERTechnologies Inc.
Effect of Maintenance
l Mitigation philosophyl Prevent potential line hits
l Example prevention optionsl Enhance awareness of pipeline locationl Modify cover depth inspection frequencyl Increase pipeline burial depthl Introduce mechanical protection
l Prevention Impactl Modify fault tree basic event probabilitiesl Reduce hit probability

advantage technology
createsC-FERTechnologies Inc.
Effect on Failure Probability
An
nu
al p
rob
abili
ty o
f fa
ilure
per
km
Statusquo
Increased cover depthinspection frequency
advantage technology
createsC-FERTechnologies Inc.
Structural Reliability Approach - Summary
l Calculate failure probability from
l Structural behaviour models
l Line and ROW information
l Defect information (corrosion / SCC/ cracks / dent-gouges)
l External forces (ground movement / mechanical damage)
l Suitable for maintenance optimization

advantage technology
createsC-FERTechnologies Inc.
Consequence Estimation Approach
Category Measure
Financial impact DollarsPublic safety impact Number of people at riskEnvironmental impact Effective residual spill volume
Consequence measures

advantage technology
createsC-FERTechnologies Inc.
Consequences of Pipeline Failure
Failure
Hazard Models
Damage Thresholds
Human Impact Thresholds
Effective Shoreline Impact
Volume
Number of People at Risk
Spill Decay &Clean-up Models
Line RepairCost
Lost ProductCost
Service InterruptCost
Financial Cost
ShorelineImpact Model
OffshoreDamage
Cost

advantage technology
createsC-FERTechnologies Inc.
Consequence Analysis
Release
Immediate ignition
ignition
Delayed ignition
No ignition
Explosion
No explosion
Fire ball / Jet fire
Vapour cloudexplosion
Vapour cloudfire
Toxicvapour cloud
No immediate
Step 1 - Use event tree analysis (logic model) to estimate relativelikelihood of all conceivable release hazards
Consequences of Acute Release Hazards

advantage technology
createsC-FERTechnologies Inc.
Consequence Analysis
Jet FireJet FireToxic VapourToxic VapourCloudCloud
Immediate Ignition
NoIgnition
VapourVapourCloud FireCloud Fire
Vapour CloudVapour CloudExplosionExplosion
DelayedIgnition
Step 2 - Use hazard characterization models to estimate size of affected areas
Consequence of Acute Release Hazards
Step 3 - Estimate offshore damage cost(no. involved structures & vessels x property value)
Estimate number of people at risk(no. involved structures & vessels x crew size)

advantage technology
createsC-FERTechnologies Inc.
Consequence Analysis
Long-term Consequences of Product Release Hazard
SpillVolume
ShoreImpactVolume
Spill TrajectoryModel
ShorelineSensitivity Model
Spill DecayModel
OffshoreClean-up Model
ShorelineClean-up Model
Step 1 Step 2 Step 3
Step 4 - Assess clean-up costsEstimate degree of natural resource damage
SpillSpillVolumeVolume
ImpactImpactVolumeVolume
EffectiveEffectiveImpactImpactVolumeVolume

advantage technology
createsC-FERTechnologies Inc.
Spill Trajectory Model
D
C
B
A
3
1 2
4
A B C D
1
2
3
4
Shoreline
Lau
nch
Zo
ne
Trajectory Analysis Results
Probability of Impact: 0 to 1
Time to Impact:
days
#
Shoreline
Pipeline
Spill Trajectory Analysis

advantage technology
createsC-FERTechnologies Inc.
Software

advantage technology
createsC-FERTechnologies Inc.
PIRAMID Structure
SegmentRanking
RiskEvaluation
DecisionAnalysis
Pipeline Definition and SegmentationScenarioDefinition
Risk Estimation
ConsequenceEstimation
ProbabilityEstimation
Adjusted FailureRate Models
StructuralReliability Models

advantage technology
createsC-FERTechnologies Inc.
Segment Ranking Chart

advantage technology
createsC-FERTechnologies Inc.
Segment Ranking Table

advantage technology
createsC-FERTechnologies Inc.
Risk Variations Along a Segment

advantage technology
createsC-FERTechnologies Inc.
Failure Rate Versus Time

advantage technology
createsC-FERTechnologies Inc.
Decision Analysis - Utility Chart

advantage technology
createsC-FERTechnologies Inc.
Summary
l Comprehensive user-friendly approach forrisk-based integrity maintenance planning
l Quantitative and objective methodologyl Historical incident datal Analytical models for
l pipeline failure predictionl release hazard characterization
l Pipeline condition data
l Benefitsl Generates line-specific risk estimatesl Quantifies the impact of maintenance actionsl Identifies minimum cost solutions