pipelayview from 4d nav tightly integrates with orcina’s...
TRANSCRIPT
12808 Queensbury Lane, E521, Houston, TX, 77024 +1 832 516 6888 www.4dnav.com
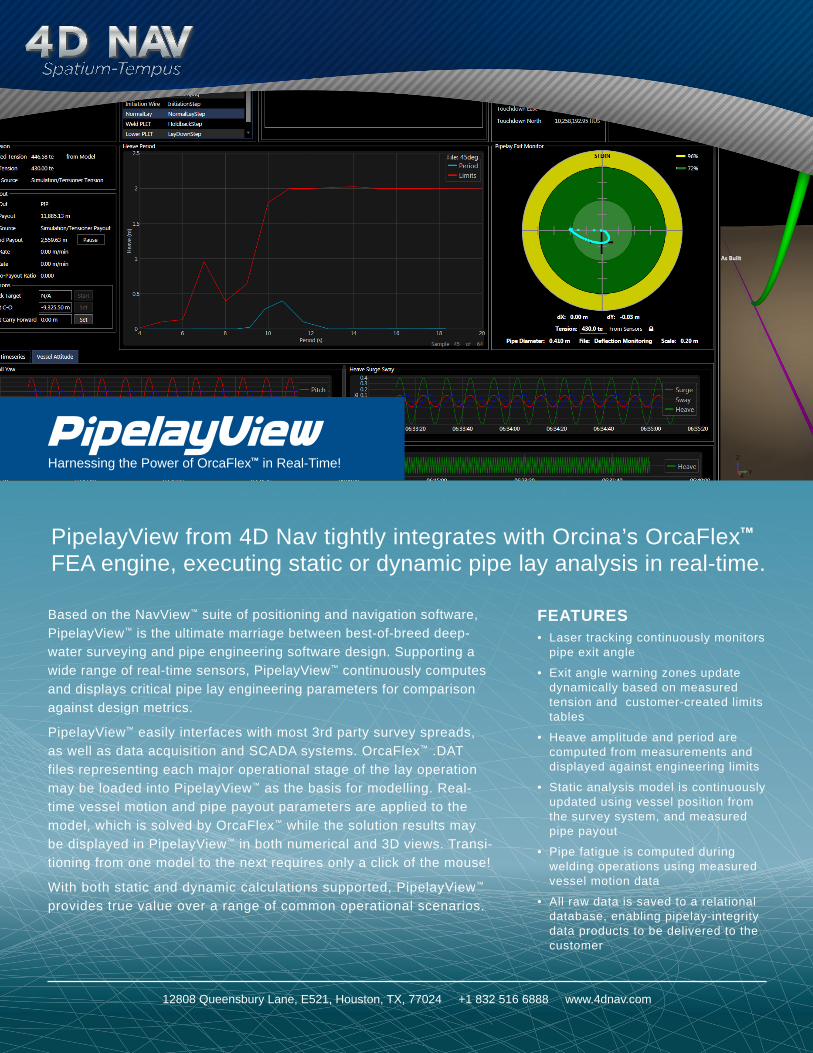
PipelayView from 4D Nav tightly integrates with Orcina’s OrcaFlex™ FEA engine, executing static or dynamic pipe lay analysis in real-time.
Based on the NavView™ suite of positioning and navigation software, PipelayView™ is the ultimate marriage between best-of-breed deep- water surveying and pipe engineering software design. Supporting a wide range of real-time sensors, PipelayView™ continuously computes and displays critical pipe lay engineering parameters for comparison against design metrics.
PipelayView™ easily interfaces with most 3rd party survey spreads, as well as data acquisition and SCADA systems. OrcaFlex™ .DAT files representing each major operational stage of the lay operation may be loaded into PipelayView™ as the basis for modelling. Real-time vessel motion and pipe payout parameters are applied to the model, which is solved by OrcaFlex™ while the solution results may be displayed in PipelayView™ in both numerical and 3D views. Transi-tioning from one model to the next requires only a click of the mouse!
With both static and dynamic calculations supported, PipelayView™ provides true value over a range of common operational scenarios.
FEATURES• Laser tracking continuously monitors
pipe exit angle
• Exit angle warning zones update dynamically based on measured tension and customer-created limits tables
• Heave amplitude and period are computed from measurements and displayed against engineering limits
• Static analysis model is continuously updated using vessel position from the survey system, and measured pipe payout
• Pipe fatigue is computed during welding operations using measured vessel motion data
• All raw data is saved to a relational database, enabling pipelay-integrity data products to be delivered to the customer
Harnessing the Power of OrcaFlex™ in Real-Time!

The Pipelay Exit Monitor System (PEMS) presents an easily-understood bull’s-eye graph displaying the current pipe center as it exits the tensioner with respect to an ideal center. The raw source data for the PEMS is a real-time laser device that continuously scans the pipe cross-section at a location below the tensioner or the HOM. Operations supervisors benefit from the simplicity of the graphics presentation, which assists them at keeping the pipe exit angle within design tolerances throughout the lay. All data is recorded and tagged with a precise timestamp, and can be exported to a simple CSV formatted file allowing custom data products to be easily created.
Heave measured using a survey-grade sensor provides data to a heave FFT (Fast-Fourier Transform) calculation. The resulting spectrum is converted to period and plotted against the heave limits graph created by the pipe lay engineers. This presents pipe lay supervisors and engineers with a simple graphical tool for assessing the effects of sea state against operations using measured heave. This technique removes the inaccuracies associated with using historical sea-state tables, and provides the confidence needed to continue operations to the limits of the safety design.
Measured tension can be read from sensors and compared to the OrcaF-lex™ computed tension continuously throughout the pipe lay operations. This provides confidence that the operation is executing within design parameters.
Payout may be monitored to ensure the vessel-to-payout rate ratio is kept within the design window. Known payout counter errors or offsets may be adjusted by entering a C-O correction to ensure that accurate values are sent to the OrcaFlex™ engine for static or dynamic analysis.
Additional payout corrections may be applied to accommodate situations where pipe may be cut out, or the payout sensors reset.
All measured parameters are stored in a relational database and can be easi-ly recovered for post-lay analysis.
PipelayView™ works with OrcaFlex™ to compute dynamic analysis during welding or similar operations, updating the damage-per-hour and the cumulative damage values approximately once each minute.
On each static analysis cycle the model results are updated with estimates of pipe-on-bottom, pipe-in-water-column and other valuable parameters. These are all saved to the relational database.
Pipeline touchdown is calculated by OrcaFlex™ which allows a layback esti-mate to be computed on every cycle.
Timeseries charts present an ongoing visual reference for signals such as heave, pitch and roll, surge and sway, measured versus calculated tension, and vessel rate versus payout rate.
12808 Queensbury Lane, E521, Houston, TX, 77024 +1 832 516 6888 www.4dnav.com