pipe-soil interaction mechanism during pipeline … · mental studies such as full scale and/or ......
TRANSCRIPT
1 INTRODUCTION Pipeline Upheaval Buckling (UHB) refers to the global buckling tendency of buried pipelines in the vertical or near-vertical direction. UHB is particular-ly relevant to thick-walled high pressure / high tem-perature (HP/HT) pipelines and must be considered in design. Design against UHB in offshore engineer-ing practice is often conducted in dedicated Finite Element Analysis (FEA) packages with the pipe modelled as one-dimensional beam elements and the surrounding soil medium modelled as non-linear springs. These soil springs are usually simplified as bi-linear or tri-linear (DNV-RP-F110, 2007), and characterised by two key parameters (Wang et al., 2012): Maximum available soil resistance, Rmax; and Mobilization distance, δf, which is the required
upward movement of the pipe to achieve Rmax Prediction method for Rmax in cohesionless soils
has attracted much research effort in the past (Tra-utmann et al., 1985; Schaminée et al., 1990; Dickin, 1994; White et al., 2001; Bransby et al., 2001). The majority of published researches involve experi-mental studies such as full scale and/or geotechnical centrifuge testing. Finite element analysis is not rou-tinely used (White et al., 2008) possibly due to the difficulty of devising realistic input parameters to describe soil dilantancy and plastic flow associated with large deformation in the soil medium. In com-parison, research on δf has only recently picked up pace, and possible disagreement between tabulated values in design codes and latest experimental data have already been reported (Wang et al., 2010; Wang et al., 2012).
At their roots, both Rmax and δf represent salient moments during the entire pipe-soil interaction mechanism throughout the UHB event. This paper aims to illustrate such mechanisms obtained using Particle Image Velocimetry (PIV) and photogram-metry (White et al., 2003) during full-scale plane-strain vertical pipe pull-out experiments that simu-late the UHB event.
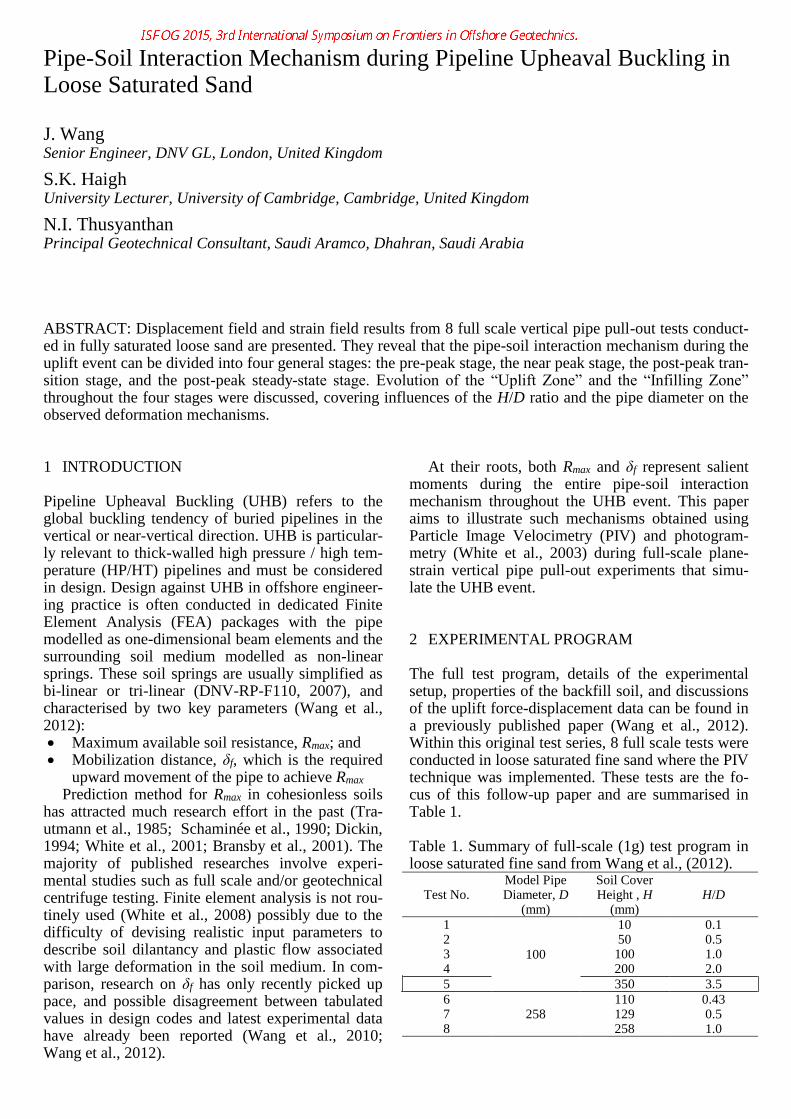
2 EXPERIMENTAL PROGRAM The full test program, details of the experimental setup, properties of the backfill soil, and discussions of the uplift force-displacement data can be found in a previously published paper (Wang et al., 2012). Within this original test series, 8 full scale tests were conducted in loose saturated fine sand where the PIV technique was implemented. These tests are the fo-cus of this follow-up paper and are summarised in Table 1.
Table 1. Summary of full-scale (1g) test program in loose saturated fine sand from Wang et al., (2012).
Test No. Model Pipe Diameter, D
(mm)
Soil Cover Height , H
(mm) H/D
1
100
10 0.1 2 50 0.5 3 100 1.0 4 200 2.0
5 350 3.5
6 258
110 0.43 7 129 0.5 8 258 1.0
Pipe-Soil Interaction Mechanism during Pipeline Upheaval Buckling in Loose Saturated Sand
J. Wang Senior Engineer, DNV GL, London, United Kingdom
S.K. Haigh University Lecturer, University of Cambridge, Cambridge, United Kingdom
N.I. Thusyanthan Principal Geotechnical Consultant, Saudi Aramco, Dhahran, Saudi Arabia
ABSTRACT: Displacement field and strain field results from 8 full scale vertical pipe pull-out tests conduct-ed in fully saturated loose sand are presented. They reveal that the pipe-soil interaction mechanism during the uplift event can be divided into four general stages: the pre-peak stage, the near peak stage, the post-peak tran-sition stage, and the post-peak steady-state stage. Evolution of the “Uplift Zone” and the “Infilling Zone” throughout the four stages were discussed, covering influences of the H/D ratio and the pipe diameter on the observed deformation mechanisms.

3 OBSERVED DEFORMATION MECHANISMS
3.1 Overview
Figure 1. Displacement field in Test 3 at δ = 10 mm, axes are in pixels and vectors are magnified by 3 times for better illustration As a typical example, Figure 1 shows the displace-ment field around the model pipe after 10 mm of pipe upward displacement (δ) during Test No. 3. The graphs are shown in pixel space to enable overlaying of PIV displacement field data on top of the original photographs. The background photos have a com-mon pixel resolution of 8.33 pixels/mm. The dis-placement vector field is scaled up by three times and has been corrected for distortions caused by camera movement. Figure 1 illustrates a common feature seen in all tests that the pipe-soil interaction mechanism during the uplift event can be separated into two zones: the Uplift Zone (Zone A) and the In-filling Zone (Zone B). The initiation of the two zones is independent of each other: Zone A initiates near the pipe crown almost as soon as the pipe be-gins to move upwards, the initiation of Zone B seems delayed and only becomes visible after a gap has opened up between the bottom of the pipe and the base soil. It is expected that Zone A is responsi-ble for the soil resistance to pipeline’s uplift motion, whereas the Zone B is likely related to pipeline cy-clic ratcheting in the upwards direction due to irre-versible inward soil migration filling up the gap un-derneath the pipe.
3.2 Analysis of Zone A
Figure 2 illustrates the displacement field during the same test. The red lines indicate the pre-test location of selected soil patches at various heights above the pipe centreline. The blue lines are the final location of these patches at particular δ values. For each pair of red and blue lines, locations where the two start to depart are marked and joined together to form the
solid black lines. These black lines illustrate the boundaries of Zone A.
(a)
(b)
(c)
Figure 2. Deformation of Zone A in Test 3 in mm scale, unmagnified; (a) δ = 0.5 mm; (b) δ = 2.0 mm; (c) δ = 8 mm
It is evident that Zone A develops in a multi-stage process: as the pipe moves upwards, soil patches close to the pipe crown are mobilised almost imme-diately and move together with the pipe, whereas those close to the soil surface respond more slowly and are associated with smaller displacement magni-tudes compared with that of the pipe. Figure 2 also shows that, during the pre-peak stage (δf = 1.70 mm in this case, see Wang et al., 2012), the boundaries of Zone A first propagates towards the soil surface in a prism shape c.f. a reversed bearing capacity failure. Once these boundaries reach the soil surface, the top of Zone A near the soil surface widens, gradually propagating the boundary lines sideways. At around
Zone A
Zone B Zone B

δf, the boundary line just surpasses the vertical shear zone lines assumed by the Vertical Slip Surface model (DNV-RP-F110, 2007). During the post-peak stage, the boundaries of Zone A continue to widen at ever-decreasing rate, and eventually reach a steady wedge shape. The stabilised boundaries of Zone A will no longer be unaffected by further increments in pipe upward displacement. For this particular test, the width of Zone A is steady at 245 mm (or approx-imately 2.5D) at the soil surface beyond δ = 8 mm, and soil outside this zone does not participate in the uplift event.
(a)
(b)
(c)
Figure 3. Evolution of total shear strain field in Test 3 in mm scale, unmagnified; (a) δ = 0.5 mm; (b) δ = 2.0 mm; (c) δ = 4 mm
Figure 3 plots the evolution of the total engineer-ing shear strain field for the same test. The shear bands displayed resemble the solid black lines as in Figure 2, but also reveal their arch-shaped initiation above the pipe crown. As the uplift motion contin-ues, additional shear bands start to appear on top of existing ones, and all initiating from the two “shoul-der” locations of the model pipe. As δ continues to increase, the orientation of these additional shear
bands slowly approaches vertical. At δf, the shear bands just reach the soil surface, which is in accord-ance with expectation: at δf, the majority of the soil above the pipe should participate in the uplift, and contribution from shear will be peaking as shear band length has reached a maximum before on-set of softening. At δ > δf, new shear bands appear outside the existing ones and propagate sideways. However, the rate of appearance and propagation significantly slows, causing clumping-up of shear bands to form two mega shear bands stemming from the model pipe’s shoulder locations slightly inclined upwards and reaching the soil surface. The overall uplift mechanism in Zone A stabilises after δ is slightly larger than δf (≈ 3 mm, or δ/D ≈ 3%, for Test 3), be-yond which increments in δ no longer create addi-tional shear bands, but increase the average shear strain in the existing mega shear bands. A rectangu-lar-shaped “dead-weight zone” also forms above the pipe crown, within which the shape and magnitude of the existing shear bands hardly change.
3.3 Analysis of Zone B
The formation of Zone B is driven by collapse of the gap underneath the pipe. Figure 3 and Figure 4 confirm that the formation and initial propagation of Zone B is separate from that of Zone A. The shear bands attributed to Zone B and Zone A form their respective loops and do not cross over each other be-fore δ = δf. When fully developed, Zone B is of a symmetrical, ear-shaped, flow-around mechanism. It is “hinged" to the bottom of the pipe before a crack opens up, and then to the last point of contact be-tween the bottom of the pipe and the trench after-wards. As δ increases, additional shear bands appear outside existing “ear”. The bottom half of the shape of Zone B eventually stabilises beyond a certain δ value. The top half, on the other hand, continues to grow and propagate upwards.
The development process of Zone B at larger δ values (δ >> δf) is illustrated more clearly in. It is ev-ident that, in this particular test, before δ = 10 mm, or δ/D = 3.9%, the upper reaches of Zone B gradual-ly propagate upwards, but the “ear-shape” is pre-served, and Zone B is distinctly separable from Zone A which indicates an independent initiation process. Beyond δ = 20 mm or δ/D = 7.8%, the top reaches of Zone B begin to propagate into regions under the in-fluence of Zone A. As a result, soil patches at the bottom of Zone A start to drift sideways, and partic-ipate in the flow-around mechanism of Zone B. Be-yond δ = 40 mm, or δ/D = 15.5%, Zones A and B start to form a combined flow-around mechanism. The width of the “dead-weight zone” also narrows significantly but maintains a rectangular shape. The reduced width of the “dead-weight zone” for this particular test is approximately 135 mm, or 0.52D,

25% lower than its width at δf which is approximate-ly 0.70D.
(a)
(b)
(c)
Figure 4. Evolution of total shear strain field in Test 7 in mm scale, unmagnified; (a) δ = 0.5 mm; (b) δ = 2.0 mm; (c) δ = 4 mm
At low H/D ratios, or when (H-δ)/D is less than
0.5, Zone A and Zone B start to merge together. As Zone A continues to be lifted under increasing δ, the soil column collapses sideways in a slope-failure manner at the soil surface to form two slopes in-clined at approximately ϕcrit to the horizontal, and hence start to participate in the circular flow-around mechanism of Zone B. As a result, Zone A becomes more triangular-shaped, and connects directly with Zone B at the top. This process is illustrated in Fig-
ure 6. Another noticeable change is the width of zone A, in this case at approximately 0.70D.
Figure 5. Displacement path field between various δ intervals in Test 8 in mm scale
Figure 6. Displacement path field between various δ intervals in Test 7 in mm scale

At high H/D ratios, the column of soil being lifted in Zone A becomes difficult to identify, and no long-er extends to the soil surface (Figure 7). Zone B, on the other hand, extends significantly upwards to about 1.5D above the pipe crown. The newly ex-tended region acts as a “preparation zone” for Zone B: soil particles are being pushed upwards and side-ways, and later participate in the flow-around mech-anism when the pipe crown reaches its elevation. Because of this complication, Zone A becomes more confined geometrically, in this case to approximately 0.20D in width and 1.0D in height. Beyond this re-gion, the shape of the mechanism at δf is largely pre-served, and pure upward movement is observed.
Figure 7. Displacement path field between various δ intervals in Test 5 in mm scale
4 CONCLUSIVE SUMMARY This paper presents pipe-soil interaction mechanism as observed from Particle Image Velocimetry (PIV) and photogrammetry from a selection of 8 full scale vertical pipe pull-out tests conducted in fully saturat-ed loose sand. The full test program, methodology, and detailed force-displacement results were previ-ously reported by Wang et al., (2012).
Analysis of the displacement and total engineer-ing strain fields obtained from these tests show that the pipe-soil interaction mechanism during the uplift event can be divided into four general stages: the pre-peak stage (δ < δf), the near peak stage (δ ≈ δf), the post-peak transition stage (δ > δf), and the post-peak steady-state stage (very large δ, typically δ > 0.5D).
The pre-peak stage features the generation of arch-shaped first-generation shear bands above the pipe crown and their propagation upwards towards the soil surface and sideways to form two collective mega-shear bands.
The near-peak stage features the gradual stabilisa-tion of the boundaries of Zone A, or the Uplift Zone, formed by the first-generation shear bands, and the creation of a “dead-weight zone” within Zone A
bounded by two mega-shear bands, or second-generation shear bands, which have now propagated and reached the soil surface. Zone B, the Flow-around Infilling Zone, also starts to take the ear-shape and propagate upwards and sideways during Stage II. However, its formation and initial propaga-tion is independent of Zone A.
The post-peak transition stage is a transition stage from the interaction mechanism at δf to the steady-state deformation mechanism at large δ. During this stage, the boundaries of Zone A stay relatively sta-ble, whereas those of the “dead-weight zone” gradu-ally shrink inwards. This results in a significantly re-duced weight contribution towards total measured post-peak uplift resistance. The boundaries of Zone B at the ear top also propagate far enough to start merging with Zone A at the sides, such that soil be-ing lifted and pushed aside near the Zone A bounda-ries and close to the current location of the pipe starts to participate in the flow-around mechanism in Zone B.
The post-peak steady-state stage features the steady-state soil-pipe interaction mechanism at large δ, typically when δ/D > 0.5. The boundaries of the “dead-weight zone” are now stable, and thinner than those assumed by the Vertical Slip Surface Model. The higher the H/D ratio, the thinner the zone be-comes. The shape of Zone B is also relatively stable except at very low H/D ratios, where a combined mechanism of Zones A and B is apparent. At high H/D ratios, the steady-state mechanism also features a preparation zone where soil is pushed upwards and sideways, ready to participate in the flow-around mechanism when pipe reaches its elevation.
The evolution of the soil-pipe interaction mechanism
in loose sand with shallow soil covers during the up-
lift event is summarised in Figure 8.
Intemediate H/D ratios
δ < δf δ = δf δ > δf δ very large
: Boundary of Zone A : Boundary of “Deadweight Zone”
: Boundary of Zone B : Boundary of Preparation Zone
Low H/D ratios ( ≤ 1)
High H/D ratios ( ≥ 3.5)
: Direction of Propagation
Legend:
I II III IVStage
Figure 8. Summary of pipe-soil interaction mecha-nism

5 ACKNOWLEDGEMENT The authors would like to thank KW Limited for its generous financial and informational support to-wards the completion of this research. They would also like to thank Knut Arnesen of DNV GL, Oslo, Norway for kindly reviewing this paper.
The first author would like to thank Trinity Col-lege, University of Cambridge for funding his PhD research on this subject.
6 PREFERENCES
Bransby, M.F., Newson, T.A., Brunning, P., and Davies, M.C.R., 2001. Numerical and centrifuge modelling of upheaval re-sistance of buried pipelines. Proc. OMAE, Brazil: Rio de Janeiro.
Det Norske Veritas 2007. DNV-RP-F110 – Global buckling of submarine pipelines – structural design due to high tempera-ture / high pressure. Recommended Practice, Oslo: Norway.
Dickin, E.A., 1994. Uplift resistance of buried pipelines in sand. Soils and Foundations 34(2): 41-48.
Schaminée, P.E.L., Zorn, N.F., and Schotman, G.J.M., 1990. Soil response for pipeline upheaval buckling analysis: Full-scale laboratory tests and modelling. Offshore Technology Conference, U.S.A.: Houston, OTC 6486.
Trautmann, C.H., O'Rourke, T.D., and Kulhawy, F.H., 1985. Up-lift force-displacement response of buried pipe. ASCE Jour-nal of Geotechnical Eng. Division 111(9): 1061-1075.
Wang, J., Haigh, S. K., Thusyanthan, N. I., & Mesmar, S., 2010. Mobilisation distance in uplfit resistance modeling of pipelines. 2nd International Symposium on Frontiers in Offshore Geotechnics (ISFOG) (pp. 839-844). Australia: Perth, Taylor & Francis.
Wang, J., Haigh, S.K., Forrest, G. and Thusyanthan, N.I., 2012. Mobilisation distance for upheaval buckling of shallowly bur-ied pipelines. ASCE Journal of Pipeline Systems Engineering and Practice, 3(4), 106–114.
White, D.J., Barefoot, A.J., Bolton, M.D., 2001. Centrifuge mod-elling of upheaval buckling in sand. International Journal of Physical Modelling in Geotechnics, 2(1):19-28.
White, D. J., Take, W. A., & Bolton, M. D. (2003). Soil de-formation measurement using particle image velocimetry (PIV) and photogrammetry. Géotechnique, 53(7), 619-631.
White, D.J., Cheuk, C.Y., Bolton, M.D., 2008. The uplift re-sistance of pipes and plate anchors buried in sand. Géotech-nique, 58(10): 771-779.