pinecliff q3 · pdf fileduring the third quarter the company has made substantial progress in...
TRANSCRIPT
2006 INTERIM REPORT
For the period ended
September 30, 2006
Pinecliff Q3_16pg 11/27/06 9:56 AM Page covI
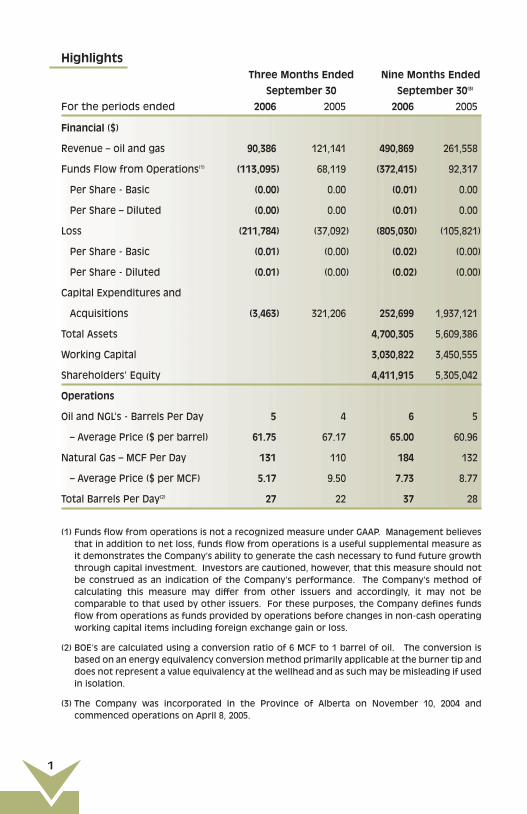
HighlightsThree Months Ended Nine Months Ended
September 30 September 30(3)
For the periods ended 2006 2005 2006 2005
Financial ($)
Revenue – oil and gas 90,386 121,141 490,869 261,558
Funds Flow from Operations(1) (113,095) 68,119 (372,415) 92,317
Per Share - Basic (0.00) 0.00 (0.01) 0.00
Per Share – Diluted (0.00) 0.00 (0.01) 0.00
Loss (211,784) (37,092) (805,030) (105,821)
Per Share - Basic (0.01) (0.00) (0.02) (0.00)
Per Share - Diluted (0.01) (0.00) (0.02) (0.00)
Capital Expenditures and
Acquisitions (3,463) 321,206 252,699 1,937,121
Total Assets 4,700,305 5,609,386
Working Capital 3,030,822 3,450,555
Shareholders’ Equity 4,411,915 5,305,042
Operations
Oil and NGL’s - Barrels Per Day 5 4 6 5
– Average Price ($ per barrel) 61.75 67.17 65.00 60.96
Natural Gas – MCF Per Day 131 110 184 132
– Average Price ($ per MCF) 5.17 9.50 7.73 8.77
Total Barrels Per Day(2) 27 22 37 28
(1) Funds flow from operations is not a recognized measure under GAAP. Management believesthat in addition to net loss, funds flow from operations is a useful supplemental measure asit demonstrates the Company’s ability to generate the cash necessary to fund future growththrough capital investment. Investors are cautioned, however, that this measure should notbe construed as an indication of the Company’s performance. The Company’s method ofcalculating this measure may differ from other issuers and accordingly, it may not becomparable to that used by other issuers. For these purposes, the Company defines fundsflow from operations as funds provided by operations before changes in non-cash operatingworking capital items including foreign exchange gain or loss.
(2) BOE’s are calculated using a conversion ratio of 6 MCF to 1 barrel of oil. The conversion isbased on an energy equivalency conversion method primarily applicable at the burner tip anddoes not represent a value equivalency at the wellhead and as such may be misleading if usedin isolation.
(3) The Company was incorporated in the Province of Alberta on November 10, 2004 andcommenced operations on April 8, 2005.
1
Pinecliff Q3_16pg 11/27/06 9:56 AM Page 1

2
Management’s Discussion and Analysis
The following report dated November 21, 2006 is a review of the operations and current
financial position for Pine Cliff Energy Ltd. (“Pine Cliff” or “the Company”) and should be
read in conjunction with the unaudited financial statements for the nine months
ended September 30, 2006, including the notes related thereto, and the audited
financial statements for the year ended December 31, 2005, together with the notes
related thereto.
General
During the third quarter the Company has made substantial progress in its
international operations in South America. Although no agreements have been
completed with regard to the acquisition of properties, much of the technical
review is presently being completed, providing the information that is required to
assess the economic potential of various options that are available. Negotiations
are continuing on an ongoing basis.
Pine Cliff is also pursuing various prospects in Canada. With the recent change to
the tax status of oil and gas trusts it is anticipated that there may be fewer buyers
for oil and gas assets possibly resulting in reduced prices for such assets. The
offset to this is that there may be fewer investors to provide funds for capital
projects.
Management is confident that it can successfully compete in the rapidly changing
conditions in Canada and internationally.
Financial and Operational
The Company was incorporated in the Province of Alberta on November 10, 2004
and commenced oil and gas operations April 8, 2005. Therefore all 2005 comparative
operational figures are only for six months.
Production
In September, the operator of the gas plant, where approximately 80 percent of the
Company’s production is processed removed the capacity restrictions resulted in a
return of the Company’s production. The Company’s production for the month of
September was approximately 11 barrels per day of natural gas liquids and 212 MCF
per day of natural gas.
Revenue
Revenue from petroleum and natural gas sales was $490,869 during the first nine
months of 2006 compared to $261,558 for the first nine months of 2005. The
increase is due to nine months of operations for 2006 as well as additional drilling
performed during 2005 and the winter of 2006. Approximately 80 percent of the
Company’s production was shut-in from May to the beginning of September
resulting in a decrease of $18,027 in Q3 compared to Q2 oil and gas revenue.
Pinecliff Q3_16pg 11/27/06 9:56 AM Page 2

Royalties
Royalties consist of Crown royalties of ($3,544) (2005 - $29,386) paid to the Province
of Alberta and gross overriding royalties of $22,833 (2005 - $8,038). During the
fourth quarter of 2005, the Company received approval for a Crown royalty holiday
on certain wells. An additional Crown royalty holiday was granted in the third
quarter of 2006 on the Company’s newly drilled wells resulting in a recovery of all
current year Crown royalties and $3,544 relating to prior years. The Company
recorded a 25 percent royalty tax credit on Crown royalties paid to the Province of
Alberta which has been reversed with the receiving of the Crown royalty holiday.
The government of Alberta recently announced the elimination of the Alberta
Royalty Tax Credit effective January 1, 2007.
Interest Income
The Company maintains both Canadian and U.S. investment accounts that pay
interest at prime less various percentages as long as the Company maintains
certain minimum account balances. Interest revenue should continue to decline as
the Company uses its working capital towards expanding its South American
operations.
Production Costs
Production costs for the nine months ended September 30, 2006 were $91,066 or
$9.14 per BOE (2005 – $31,424 or $6.51 per BOE). BOE’s are calculated using a
conversion ratio of 6 MCF to 1 barrel of oil. The conversion is based on an energy
equivalency conversion method primarily applicable at the burner tip and does not
represent a value equivalency at the wellhead and as such may be misleading if
used in isolation. The increase in total operating costs was due to increased
production volumes. Q3 production costs of $23,136 were in line with Q2
production costs of $25,979. With the return of production in September,
production costs on a gross basis will increase. However, it is anticipated that on a
BOE basis costs should return to the $7 to $8 per BOE range.
General and Administrative
General and administrative expenses for the first nine months of 2006 were
$789,640 ($220,442 in the third quarter) compared to $147,214 for the first nine
months of 2005 and $375,669 for the second quarter of 2006. The primary reason for
the increase in 2006 expenses was due to the Company incurring $453,062 in
respect to administration costs related to its activities in South America. The
decrease of $155,227 in Q3 from Q2 was due primarily to the cancellation of an
operations/engineering contract (see below).
Pine Cliff does not have any employees at the present time but engages the
services of consultants on a contract or temporary basis. Pine Cliff’s subsidiary
CanAmericas Energy Ltd. (“CanAmericas”) has also engaged the services of two
individual professionals as senior management and officers of CanAmericas.
On April 14, 2006, CanAmericas entered into an operations/engineering contract
with a South American company to provide services in respect of properties3
Pinecliff Q3_16pg 11/27/06 9:56 AM Page 3
4
CanAmericas is examining in South America. The contract provided for a monthly
retainer of $30,000 U.S. until December 31, 2006. The contract amount was to be
reviewed quarterly and adjusted by mutual consent of the parties. During the third
quarter of 2006 it was mutually agreed to by both parties to cancel the contract
effective the end of the second quarter of 2006.
In addition to the above, increases in geological consulting fees of $62,050
(Canadian operations), audit, accounting and engineering costs related to the 2005
year end audit and financial reporting of $33,525 and an increase of $66,000 in
management fees (see below) were incurred in the first nine months of 2006 and in
2005 the Company did not have expenses for such services.
Pine Cliff also has a management agreement with Comstate Resources Ltd.
(Comstate), a wholly owned subsidiary of Bonterra Energy Income Trust and a
company with common directors and management, to have Comstate provide
executive services (President and CEO, CFO and COO), accounting services, oil and
gas administration and office administration. The management fee consists of a
monthly fee of $18,000 (2005 - $12,000), three percent of net earnings before income
taxes, plus out of pocket costs. Total fees for the nine months ended September
30, 2006 were $162,000 (2005 - $96,000) plus minimal out of pocket costs. No
amounts were owing to Comstate as of September 30, 2006.
Foreign Exchange Loss
As discussed above, the Company incorporated a subsidiary company, CanAmericas
to explore and develop oil and gas properties primarily in South America.
CanAmericas is owned 93 percent by the Company and seven percent by a foreign
private corporation (“Foreign Corp.”). CanAmericas was initially financed with
$1,400,000 U.S. for 5,600,000 common shares from the Company and $100,000 U.S. for
400,000 common shares from Foreign Corp. The loss on foreign exchange of
$52,157 relates to the appreciation of the Canadian dollar from the date of the
above share issuance to September 30, 2006. The third quarter saw a minor
depreciation of the Canadian dollar resulting in a small gain of $2,748.
Stock Based Compensation
Stock based compensation for the nine months ended September 30, 2006 was
$175,061 (2005 - $58,435). The Company has a stock-based compensation plan for
Pine Cliff as well as for CanAmericas. The Company records a compensation
expense over the vesting period based on the fair value of options granted to
employees, directors and consultants in respect of either Company. The Company
issued 895,000 stock options in Pine Cliff during 2006. The Company estimated the
stock options fair value at $191,458 ($0.21 per option) using the Black-Scholes option
pricing model, assuming a weighted average risk free interest rate of 4.13 percent,
weighted average expected volatility of 65 percent, weighted average expected life
of 2.5 years and no annual dividend rate.
During the first quarter of 2006 the Company issued 1,000,000 stock options to
Foreign Corp. in CanAmericas at a price of $0.25 U.S. (the same price as Pine Cliff
paid for its shares). The value of these options was estimated using the Black-
Pinecliff Q3_16pg 11/27/06 9:56 AM Page 4

Scholes option pricing model, assuming a risk free interest rate of 3.815 percent,
expected average volatility of 85 percent, expected average life of 2.5 years and no
annual dividend rate. The total value of these options to be amortized over the
vesting period of the options is $149,588 (approximately $0.15 per option) of which
$80,224 was amortized during the first nine months of 2006.
Depletion, Depreciation, Dry hole Costs and Accretion
During the first nine months of 2006 the Company provided for $188,887 (2005 -
$168,413) related to depletion, depreciation and dry hole costs for its property and
equipment and accretion. The increase is related to additional production volumes
in 2006.
The Company follows the successful efforts method of accounting for petroleum
and natural gas properties and related equipment. Costs of acquiring unproved
properties are capitalized. When petroleum and natural gas properties are found
to contain proved reserves as determined by Company engineers, the related net
book value is depleted on the unit-of-production basis, calculated by field. The
costs of dry holes and abandoned properties are charged to operations. Geological
costs, lease rentals and carrying costs are charged to income as incurred. Costs of
drilling exploratory and development wells that result in additions to proved
reserves are capitalized and depleted on the unit-of-production basis. Tangible
equipment is depreciated on a straight-line basis over ten years.
Income Taxes
The Company follows the liability method of accounting for income taxes under
which the income tax provision is based on the temporary differences in the
accounts calculated using income tax rates expected to apply in the year in which
the temporary differences will reverse. The Company has sufficient tax pools so
that it is not liable for current income tax.
The Company has the following tax pools which can be used to reduce future
taxable income:
Rate of Utilization % Amount
Undepreciated capital costs 25 $ 283,090
Share issue costs 20 108,971
Non-capital loss carryforward (Pine Cliff) 100 156,480
Non-capital loss carryfoward (CanAmericas) 100 467,305
Canadian exploration expenditures 100 392,110
Canadian development expenditures 30 441,252
Canadian oil and gas expenditures 10 748,604
$2,597,812
Non-Controlling Interest
As described above, Foreign Corp. owns seven percent of CanAmericas. The $36,716
of loss applicable to non-controlling interest relates to their share of revenues and
costs associated with CanAmericas’ South American activities.
5
Pinecliff Q3_16pg 11/27/06 9:56 AM Page 5
6
Loss
The loss in the first nine months of 2006 was $805,030 ($211,784 in the third quarter)
compared to $105,821 in the corresponding 2005 period and $526,107 in the second
quarter of 2006. The 2006 loss was predominantly due to general and
administrative costs incurred in respect of the Company’s South American
operations as well as a future tax adjustment. The reduction of $314,323 in the Q3
loss compared to the Q2 loss was due primarily to reduced general and
administrative costs resulting from the cancellation of the operations agreement,
strengthening of the US dollar which resulted in a reduction of $78,523 in foreign
exchange loss and the Q2 future tax adjustment. The Company is optimistic that
current planned activity will result in improved results in the future.
Funds Flow From Operations
Funds flow from operations decreased to negative $372,415 in the first nine months
of 2006 (($113,095) in the third quarter) from $92,317 in first nine months of 2005.
The decrease from the 2005 amount was due to the Company’s activities in South
America. Quarter over quarter saw a reduction in the funds flow loss due primarily
to decreased general and administrative expenses related to the Company’s South
American activities.
The following reconciliation compares funds flow for the first nine months of 2006
and the corresponding 2005 period to the Company’s cash flow from operating
activities as calculated according to Canadian generally accepted accounting
principles:
2006 2005
Cash flow from operating activities $ (149,734) $ 13,297
Items not affecting funds flow
Due from related party (16,006) 9,440
Accounts receivable (217,258) 106,131
Prepaid expenses (1,048) 600
Accounts payable and accrued liabilities 28,500 (24,155)
Due to related party 165 (12,996)
Asset retirement obligations settled 35,123 –
Foreign exchange loss (52,157) –
Funds flow for the period $ (372,415) $ 92,317
Liquidity and Capital Resources
As of September 30, 2006, Pine Cliff had positive working capital of $3,030,822
(December 31, 2005 - $3,565,689). These funds will be used to fund future
exploration and development of Canadian and international properties.
The Company is authorized to issue an unlimited number of common shares
without nominal or par value. Equity transactions during the past nine months are
as follows:
Pinecliff Q3_16pg 11/27/06 9:56 AM Page 6

Issued Number Amount
Common Shares
Balance, January 1, 2006 36,420,041 $ 5,352,428
Shares issued pursuant to Company option plan 78,000 11,700
Transfer of contributed surplus to share capital – 7,202
Balance, September 30, 2006 36,498,041 $ 5,371,330
A summary of the status of the Company’s stock option plan as of September 30,
2006 and December 31, 2005, and changes during the nine month and twelve month
periods ending on those dates is presented below:
September 30, 2006 December 31, 2005
Options Weighted-Average Options Weighted-Average
Exercise Price Exercise Price
Outstanding at
beginning of period 1,686,000 $ 0.16 – $ –
Options granted 895,000 0.52 1,752,000 0.16
Options exercised (78,000) 0.15 – –
Options cancelled (23,000) 0.15 (66,000) 0.15
Outstanding at end
of period 2,480,000 $ 0.29 1,686,000 $ 0.16
Options exercisable
at end of period 765,000 $ 0.15 – $ –
The following table summarizes information about stock options outstanding at
September 30, 2006:
Options Outstanding Options Exercisable
Range of Number Weighted-Average Number
Exercise Outstanding Remaining Weighted-Average Exercisable Weighted-Average
Prices At 9/30/06 Contractual Life Exercise Price At 9/30/06 Exercise Price
$0.15 1,565,000 3.3 years $0.15 765,000 $0.15
$0.50-$0.73 915,000 3.3 years 0.52 – –
$0.15-$0.73 2,480,000 3.3 years $0.29 765,000 $0.15
The Company’s subsidiary CanAmericas adopted a stock option plan during the first
quarter of 2006. Options issued during the first nine months were as follows:
September 30, 2006
Options Weighted-Average
Exercise Price
Outstanding at beginning of period – $ –
Options granted 1,000,000 0.25 U.S.
Options cancelled – –
Outstanding at end of period 1,000,000 $ 0.25 U.S.
Options exercisable at end of period – $ –
The options vest 50 percent each on January 13, 2007 and January 13, 2008.
7
Pinecliff Q3_16pg 11/27/06 9:56 AM Page 7
8
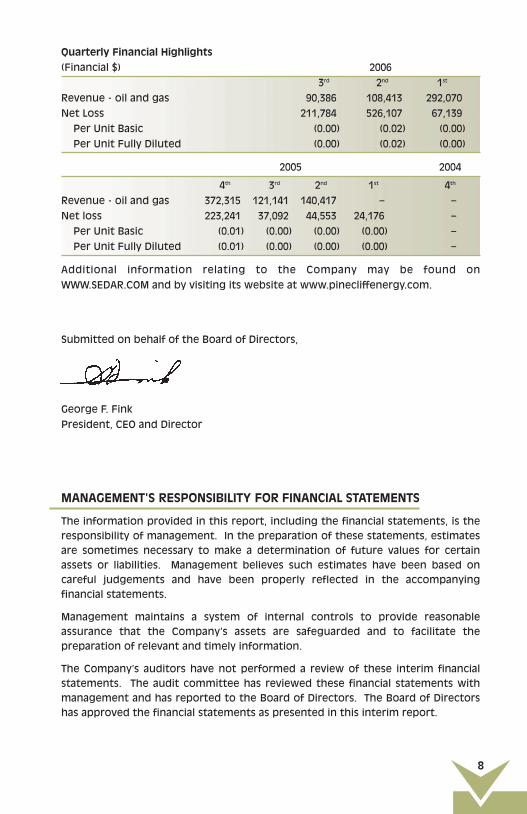
Quarterly Financial Highlights
(Financial $) 2006
3rd 2nd 1st
Revenue - oil and gas 90,386 108,413 292,070
Net Loss 211,784 526,107 67,139
Per Unit Basic (0.00) (0.02) (0.00)
Per Unit Fully Diluted (0.00) (0.02) (0.00)
2005 2004
4th 3rd 2nd 1st 4th
Revenue - oil and gas 372,315 121,141 140,417 – –
Net loss 223,241 37,092 44,553 24,176 –
Per Unit Basic (0.01) (0.00) (0.00) (0.00) –
Per Unit Fully Diluted (0.01) (0.00) (0.00) (0.00) –
Additional information relating to the Company may be found on
WWW.SEDAR.COM and by visiting its website at www.pinecliffenergy.com.
Submitted on behalf of the Board of Directors,
George F. Fink
President, CEO and Director
MANAGEMENT’S RESPONSIBILITY FOR FINANCIAL STATEMENTS
The information provided in this report, including the financial statements, is the
responsibility of management. In the preparation of these statements, estimates
are sometimes necessary to make a determination of future values for certain
assets or liabilities. Management believes such estimates have been based on
careful judgements and have been properly reflected in the accompanying
financial statements.
Management maintains a system of internal controls to provide reasonable
assurance that the Company’s assets are safeguarded and to facilitate the
preparation of relevant and timely information.
The Company’s auditors have not performed a review of these interim financial
statements. The audit committee has reviewed these financial statements with
management and has reported to the Board of Directors. The Board of Directors
has approved the financial statements as presented in this interim report.
Pinecliff Q3_16pg 11/27/06 9:57 AM Page 8

CONSOLIDATED BALANCE SHEETS
As at September 30, 2006 (unaudited) and December 31, 2005 2006 2005
Assets
Current
Cash $3,005,741 $3,334,961
Due from related party (Note 2) – 16,006
Accounts receivable 122,072 339,330
Prepaid expenditures 2,412 3,460
3,130,225 3,693,757
Future Income Tax Asset 110,872 216,254
Property and Equipment
Property and equipment 1,817,276 1,538,809
Accumulated depletion and depreciation (358,068) (180,832)
Net Property and Equipment 1,459,208 1,357,977
$4,700,305 $5,267,988
Liabilities
Current
Accounts payable and accrued liabilities $ 99,403 $ 127,903
Due to related party (Note 2) – 165
99,403 128,068
Asset Retirement Obligations 31,809 29,513
Non-controlling Interests (Note 3) 157,178 –
288,390 157,581
Shareholders’ Equity
Share capital (Note 4) 5,371,330 5,352,428
Contributed surplus 174,677 87,041
Deficit (1,134,092) (329,062)
4,411,915 5,110,407
$4,700,305 $5,267,988
9
Pinecliff Q3_16pg 11/27/06 9:57 AM Page 9

10
CONSOLIDATED STATEMENTS OF LOSS AND DEFICIT
For the periods ended September 30 (unaudited)
Three Months Nine Months
2006 2005 2006 2005
Revenue
Oil and gas sales $ 90,386 $ 121,141 $ 490,869 $ 261,558
Royalties 9,641 (14,195) (19,289) (37,424)
Alberta royalty tax credit (3,334) 2,484 (886) 7,346
Interest income 31,042 19,121 89,754 39,475
127,735 128,551 560,448 270,955
Expenses
Production costs 23,136 11,017 91,066 31,424
General and administrative 220,442 49,415 789,640 147,214
Foreign exchange (gain) loss (2,748) – 52,157 –
Stock based compensation 62,962 30,249 175,061 58,435
Dry hole costs – – 5,550 –
Depletion, depreciation and
accretion 54,329 76,465 183,337 168,413
358,121 167,146 1,296,811 405,486
Loss before Taxes and
Non-Controlling Interests (230,386) (38,595) (736,363) (134,531)
Income Taxes (Recovery)
Current – – – –
Future (7,632) (1,503) 105,383 (28,710)
(7,632) (1,503) 105,383 (28,710)
Loss before Non-controlling
interests (222,754) (37,092) (841,746) (105,821)
Loss applicable to non-controlling
interests (Note 3) 10,970 – 36,716 –
Loss for the Period (211,784) (37,092) (805,030) (105,821)
Deficit, Beginning of Period (922,308) (68,729) (329,062) –
Deficit, End of Period $(1,134,092) $ (105,821) $(1,134,092) $ (105,821)
Loss Per Share - Basic ($0.01) ($0.00) ($0.02) ($0.00)
Loss Per Share - Diluted ($0.01) ($0.00) ($0.02) ($0.00)
Pinecliff Q3_16pg 11/27/06 9:57 AM Page 10
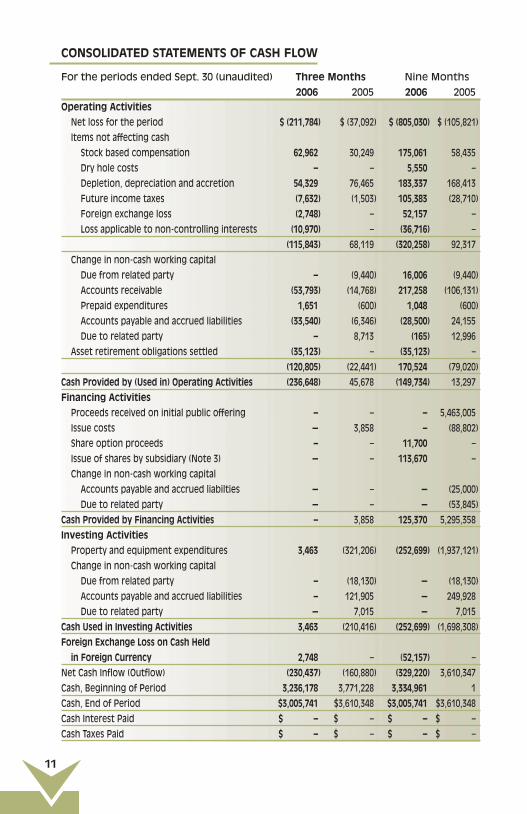
CONSOLIDATED STATEMENTS OF CASH FLOW
For the periods ended Sept. 30 (unaudited) Three Months Nine Months
2006 2005 2006 2005
Operating Activities
Net loss for the period $ (211,784) $ (37,092) $ (805,030) $ (105,821)
Items not affecting cash
Stock based compensation 62,962 30,249 175,061 58,435
Dry hole costs – – 5,550 –
Depletion, depreciation and accretion 54,329 76,465 183,337 168,413
Future income taxes (7,632) (1,503) 105,383 (28,710)
Foreign exchange loss (2,748) – 52,157 –
Loss applicable to non-controlling interests (10,970) – (36,716) –
(115,843) 68,119 (320,258) 92,317
Change in non-cash working capital
Due from related party – (9,440) 16,006 (9,440)
Accounts receivable (53,793) (14,768) 217,258 (106,131)
Prepaid expenditures 1,651 (600) 1,048 (600)
Accounts payable and accrued liabilities (33,540) (6,346) (28,500) 24,155
Due to related party – 8,713 (165) 12,996
Asset retirement obligations settled (35,123) – (35,123) –
(120,805) (22,441) 170,524 (79,020)
Cash Provided by (Used in) Operating Activities (236,648) 45,678 (149,734) 13,297
Financing Activities
Proceeds received on initial public offering – – – 5,463,005
Issue costs – 3,858 – (88,802)
Share option proceeds – – 11,700 –
Issue of shares by subsidiary (Note 3) – – 113,670 –
Change in non-cash working capital
Accounts payable and accrued liabilties – – – (25,000)
Due to related party – – – (53,845)
Cash Provided by Financing Activities – 3,858 125,370 5,295,358
Investing Activities
Property and equipment expenditures 3,463 (321,206) (252,699) (1,937,121)
Change in non-cash working capital
Due from related party – (18,130) – (18,130)
Accounts payable and accrued liabilities – 121,905 – 249,928
Due to related party – 7,015 – 7,015
Cash Used in Investing Activities 3,463 (210,416) (252,699) (1,698,308)
Foreign Exchange Loss on Cash Held
in Foreign Currency 2,748 – (52,157) –
Net Cash Inflow (Outflow) (230,437) (160,880) (329,220) 3,610,347
Cash, Beginning of Period 3,236,178 3,771,228 3,334,961 1
Cash, End of Period $3,005,741 $3,610,348 $3,005,741 $3,610,348
Cash Interest Paid $ – $ – $ – $ –
Cash Taxes Paid $ – $ – $ – $ –
11
Pinecliff Q3_16pg 11/27/06 9:57 AM Page 11

12
Notes to the Consolidated Financial Statements
Periods ended September 30, 2006 and 2005 unaudited
1. SIGNIFICANT ACCOUNTING POLICIES
The accounting policies and methods of application followed in the preparation of
the interim financial statements other than described below are the same as those
followed in the preparation of the Company’s 2005 annual financial statements.
These interim financial statements do not include all disclosures required for
annual financial statements. The interim financial statements as presented should
be read in conjunction with the 2005 annual financial statements.
Consolidation
These financial statements include the accounts of the Company and its 93.3
percent owned subsidiary CanAmericas Energy Ltd. (“CanAmericas”) (see note 3).
Foreign Currency Translation
The Company translates foreign currency denominated monetary assets and
liabilities of its integrated foreign subsidiary at the exchange rate in effect at the
balance sheet date and non-monetary assets and liabilities are translated at
historical exchange rates. Revenues and expenses are translated at estimated
transaction date exchange rates except depletion and depreciation expense,
which is translated at the same historical exchange rates as the related assets.
Exchange gains or losses are included in the determination of net income as
foreign exchange gain or loss.
2. RELATED PARTY TRANSACTIONS
Bonterra Energy Income Trust, an organization with common directors and
management and former parent of the Company, through its wholly owned
subsidiary Comstate Resources Ltd. (“Comstate”) provides management services
and office administration to the Company. The management fee consists of a
monthly fee of $18,000 (2005 - $12,000) plus out of pocket costs, a fee of three
percent of net earnings before income taxes, $250 per month per operated
producing well and $150 per month per water injector well. Total management
fees paid for the first nine months of 2006 were $162,000 (2005 - $96,000) and have
been included in general and administrative costs. As of September 30, 2006, the
Company had no balances owing to Comstate.
3. NON-CONTROLLING INTERESTS
The Company incorporated a subsidiary company, CanAmericas, to explore and
develop oil and gas properties primarily in South America. CanAmericas is owned
93.3 percent by the Company and 6.7 percent by a foreign private corporation
(“Foreign Corp.”). CanAmericas was initially financed by investments of $1,400,000
U.S. for 5,600,000 common shares from the Company and $100,000 U.S. for 400,000
common shares from Foreign Corp.
Pinecliff Q3_16pg 11/27/06 9:57 AM Page 12

Foreign Corp. has been granted an option to acquire an additional 1,000,000
common shares of CanAmericas at $0.25 U.S. per common share. This option vests
at a rate of 50 percent per year over a two year period.
4. SHARE CAPITAL
Authorized
Unlimited number of Common Shares without nominal or par value.
Unlimited number of Class B Preferred Shares without nominal or par value which
may be issued in one or more series.
Issued Number Amount
Common Shares
Balance, January 1, 2006 36,420,041 $5,352,428
Shares issued pursuant to Company option plan 78,000 11,700
Transfer of contributed surplus to share capital – 7,202
Balance, September 30, 2006 36,498,041 $5,371,330
A summary of the status of the Company’s stock option plan as of September 30,
2006 and December 31, 2005, and changes during the nine month and twelve
month periods ending on those dates is presented below:
September 30, 2006 December 31, 2005
Options Weighted-Average Options Weighted-Average
Exercise Price Exercise Price
Outstanding at
beginning of period 1,686,000 $0.16 – $ –
Options granted 895,000 0.52 1,752,000 0.16
Options exercised (78,000) 0.15 – –
Options cancelled (23,000) 0.15 (66,000) 0.15
Outstanding at end
of period 2,480,000 $0.29 1,686,000 $0.16
Options exercisable
at end of period 765,000 $0.15 – $ –
The following table summarizes information about stock options outstanding at
September 30, 2006:
Options Outstanding Options Exercisable
Range of Number Weighted-Average Number
Exercise Outstanding Remaining Weighted-Average Exercisable Weighted-Average
Prices At 9/30/06 Contractual Life Exercise Price At 9/30/06 Exercise Price
$0.15 1,565,000 3.3 years $0.15 765,000 $0.15
$0.50-$0.73 915,000 3.3 years 0.52 – –
$0.15-$0.73 2,480,000 3.3 years $0.29 765,000 $0.15
The Company records a compensation expense over the vesting period based on the
fair value of options granted to employees, directors and consultants.
13
Pinecliff Q3_16pg 11/27/06 9:57 AM Page 13
14
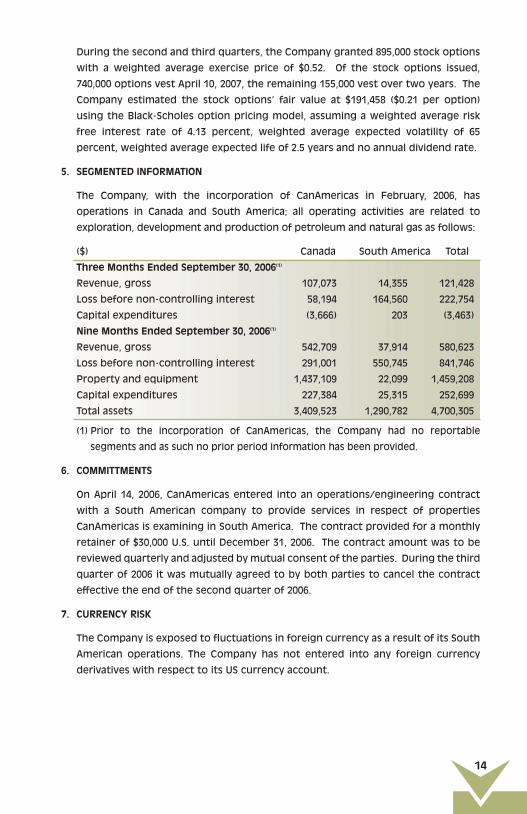
During the second and third quarters, the Company granted 895,000 stock options
with a weighted average exercise price of $0.52. Of the stock options issued,
740,000 options vest April 10, 2007, the remaining 155,000 vest over two years. The
Company estimated the stock options’ fair value at $191,458 ($0.21 per option)
using the Black-Scholes option pricing model, assuming a weighted average risk
free interest rate of 4.13 percent, weighted average expected volatility of 65
percent, weighted average expected life of 2.5 years and no annual dividend rate.
5. SEGMENTED INFORMATION
The Company, with the incorporation of CanAmericas in February, 2006, has
operations in Canada and South America; all operating activities are related to
exploration, development and production of petroleum and natural gas as follows:
($) Canada South America Total
Three Months Ended September 30, 2006(1)
Revenue, gross 107,073 14,355 121,428
Loss before non-controlling interest 58,194 164,560 222,754
Capital expenditures (3,666) 203 (3,463)
Nine Months Ended September 30, 2006(1)
Revenue, gross 542,709 37,914 580,623
Loss before non-controlling interest 291,001 550,745 841,746
Property and equipment 1,437,109 22,099 1,459,208
Capital expenditures 227,384 25,315 252,699
Total assets 3,409,523 1,290,782 4,700,305
(1) Prior to the incorporation of CanAmericas, the Company had no reportable
segments and as such no prior period information has been provided.
6. COMMITTMENTS
On April 14, 2006, CanAmericas entered into an operations/engineering contract
with a South American company to provide services in respect of properties
CanAmericas is examining in South America. The contract provided for a monthly
retainer of $30,000 U.S. until December 31, 2006. The contract amount was to be
reviewed quarterly and adjusted by mutual consent of the parties. During the third
quarter of 2006 it was mutually agreed to by both parties to cancel the contract
effective the end of the second quarter of 2006.
7. CURRENCY RISK
The Company is exposed to fluctuations in foreign currency as a result of its South
American operations. The Company has not entered into any foreign currency
derivatives with respect to its US currency account.
Pinecliff Q3_16pg 11/27/06 9:57 AM Page 14

901, 1015 – 4TH STREET SW
CALGARY, ALBERTA T2R 1J4
www.pinecliffenergy.com
Pinecliff Q3_16pg 11/27/06 9:57 AM Page 15