pinal partnership government relations...
TRANSCRIPT

Pinal Partnership
Government Relations Committee
February 16, 2016

6 things we’ve done right- or -
“why we’re not California”
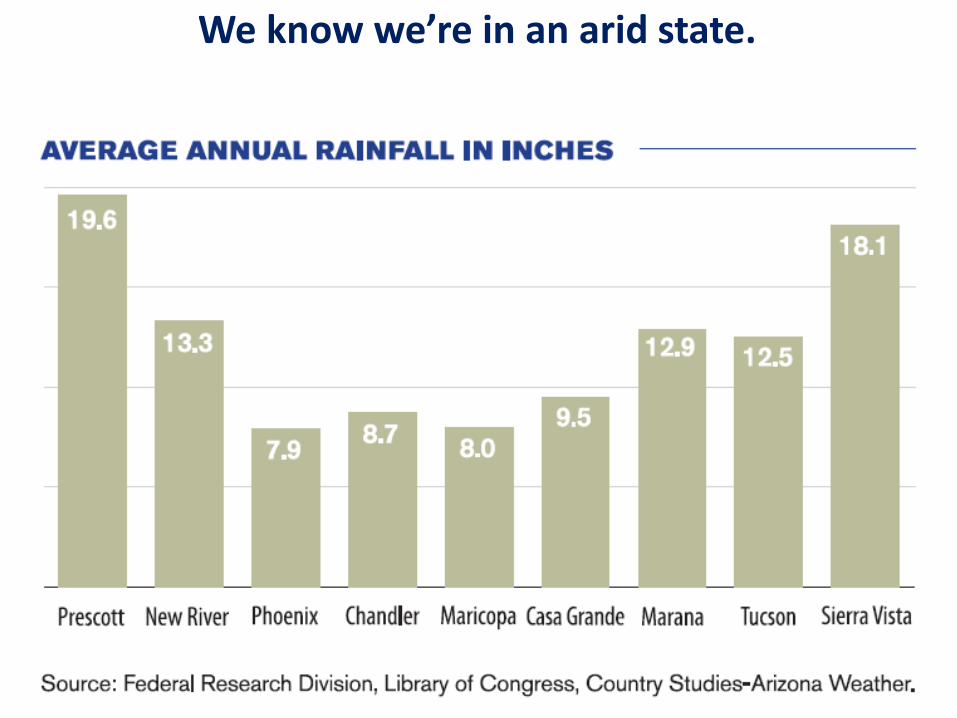
We know we’re in an arid state.
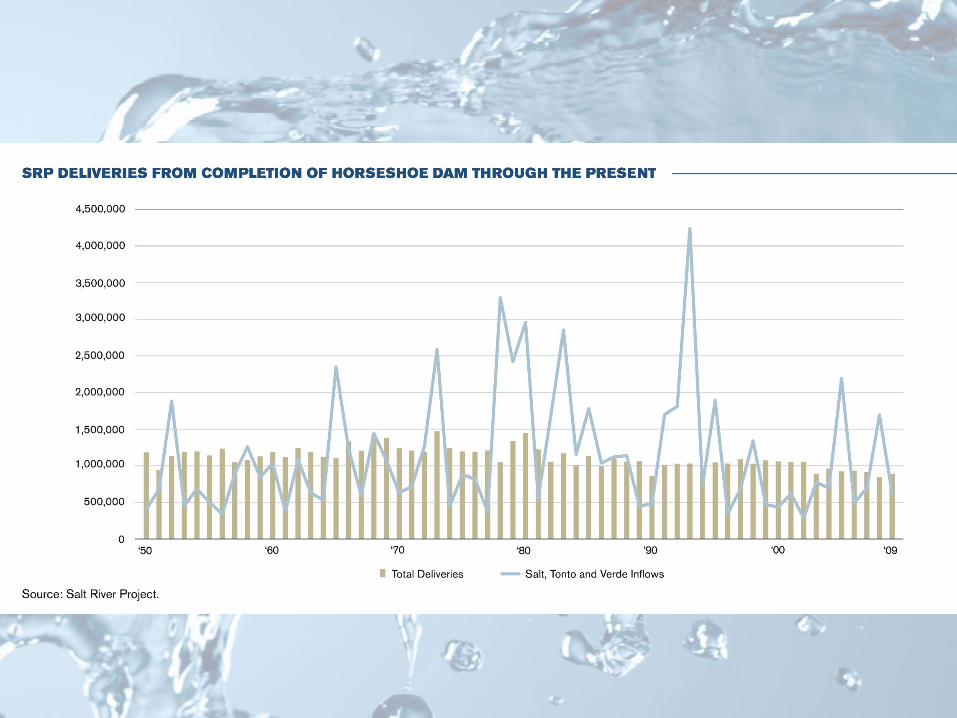

Our system has built in resiliency.
Greater Phoenix Water Sources
CAP
41%
Ground
Water
30%
Effluent
2%
Salt-Verde
27%
Source: Arizona Dept. of Water Resources

0
200,000
400,000
600,000
800,000
1,000,000
1,200,000
1,400,000
1,600,000
Acre
Fe
et
Indian
Priority
326 KAF
M&I Priority
448 KAF
NIA Priority 222 KAF
Ag Pool 157 KAF
Ag Pool Shortage 143
KAF
Other Excess Shortage
32
0,0
00
Priority 3 - 68 KAF
CA
P D
eli
ve
ry P
rio
rity
Lo
wH
igh
Excess
Long-Term Contracts
We have a plan for CAP shortage impacts.
Tier 1 Shortage; Projected 2017 Orders
Source: Central Arizona Project

We’re into banking.
CAP Deliveries by Type 1985 -
2011 CAP & AWBA: 3.7 MAF ( > 2x total annual deliveries)
SRP: > 1 MAF
Total Water Banked: > 9 MAF

Demand for water is changing.

Arizona’s Water Management Story
0.5
1.5
2.5
3.5
4.5
5.5
6.5
7.5
8.5
9.5
10.5
0
20
40
60
80
100
120
140
160
180
200
220
240
260
1957 1973 1980 1990 2000 2010 2013
Mil
lio
n (
acr
e-f
ee
t o
r p
eo
ple
)
$ B
illi
on
AZ Water Demand & Growth (1957 – 2013)
Adjusted Gross Domestic Income Population Water Use (Acre-Feet)Source: Arizona Dept. of Water Resources

what we should be worried about
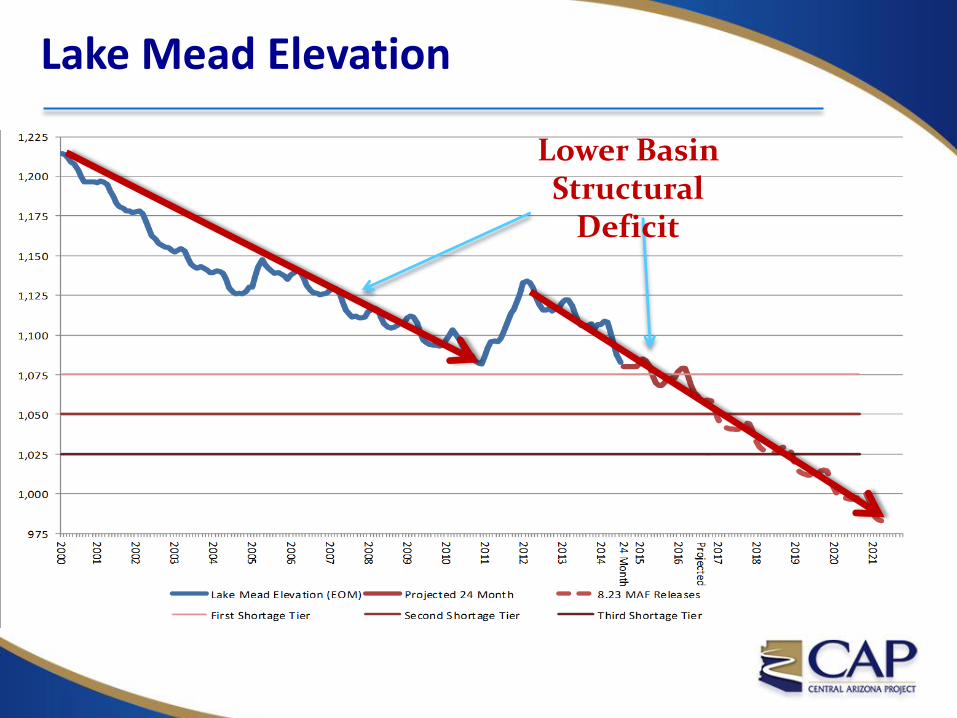
Lake Mead Elevation
Lower Basin Structural
Deficit

Adjudication Areas
General Stream Adjudications
Gila Adjudication • Est. 1974• 24,000 parties• 78,000 claims• > $100,000,000 for lawyers
Little Colorado Adjudication • Est. 1978• 5,000 parties• 14,000 claims
Massive Water Rights Uncertainty
Adjudication Areas

Conflict Over Rural Groundwater Issues
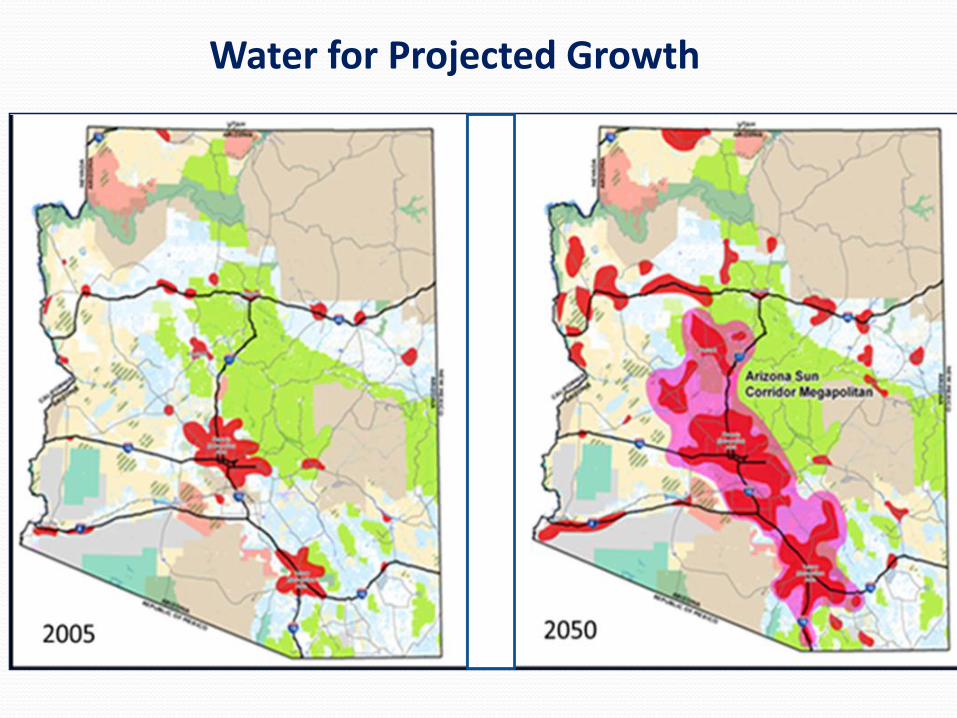
Water for Projected Growth

How will this work forPinal County?
ADWR’s Planning Areas

Projected Demands Basin & Range AMAs
30 – 40% increase in demand
mostly municipal
Source: ADWR Strategic Vision
