pilot test on marlin (electronic logsheet) operation presentation for 2nd er em... · pilot test on...
TRANSCRIPT

PILOT TEST ON MARLIN (ELECTRONIC LOGSHEET)
OPERATIONALMA C. DICKSON, DFT.
Bureau of Fisheries and Aquatic ResourcesPhilippines
2nd E-REPORTING AND E-MONITORING WORKING GROUP MEETING(ERandEMWG2)The Stones Hotel, Bali Indonesia1-2 August 2016

BACKGROUND

MARLIN 100Multi-function electronic
logbook terminal Data patterned from SPC/FFA
Regional Purse Seine Logsheetformat
Connected to the vessel’s VMS Capable of sending email, daily
activity log, fishing area, species caught and fish amount
Detects typhoons and weather conditions
Soon to be upgraded to WIRELESS TABLET(bluetoothconnection) transmitting via same VMS unit
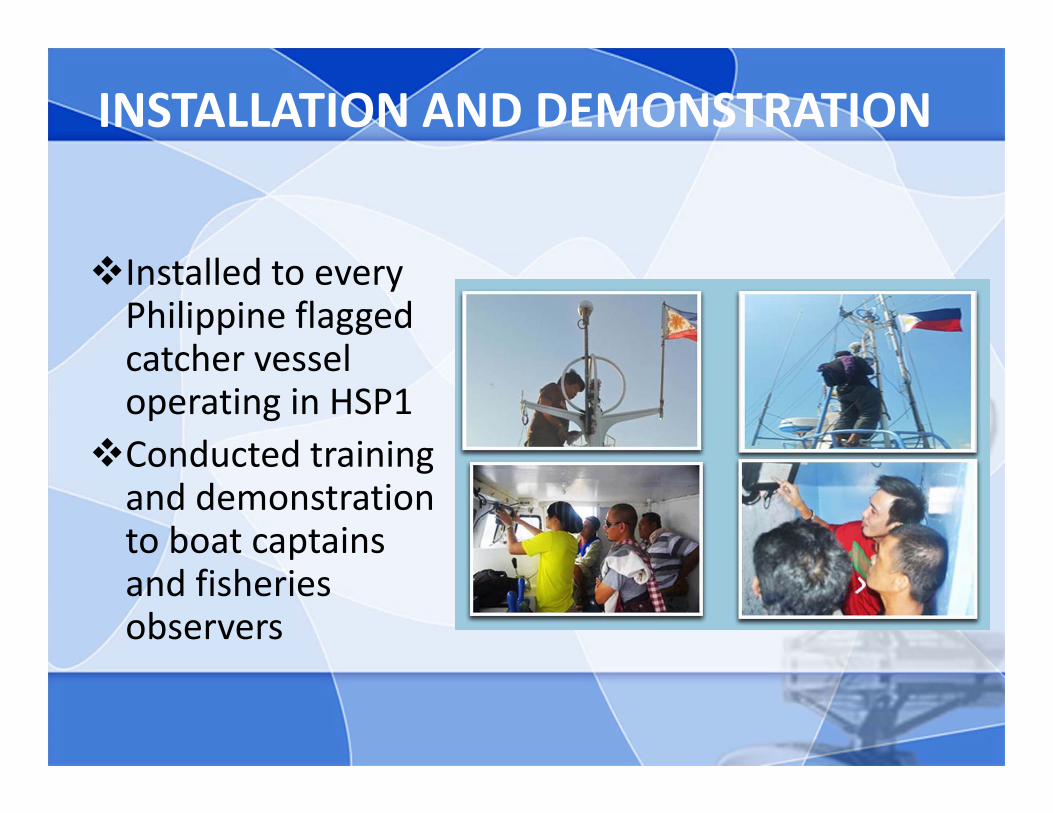
INSTALLATION AND DEMONSTRATION
Installed to every Philippine flagged catcher vessel operating in HSP1
Conducted training and demonstration to boat captains and fisheries observers

DATA ENTRY

PORT OF DEPARTURE
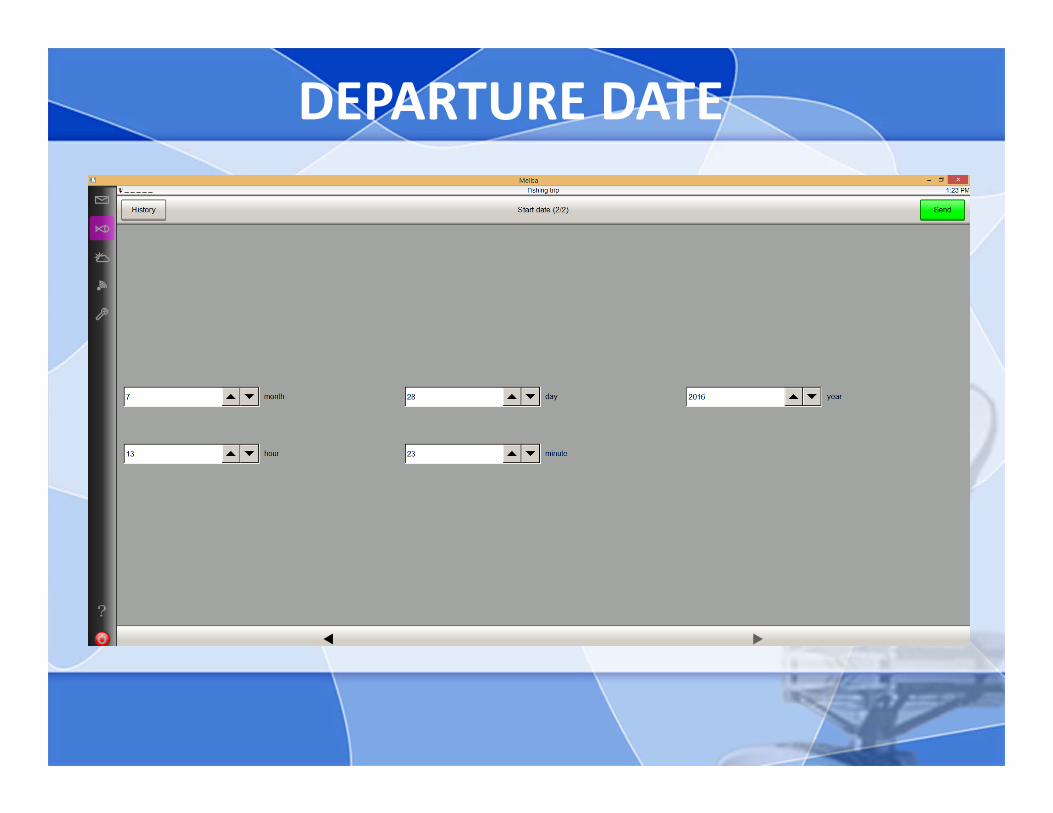
DEPARTURE DATE

ACTIVITY
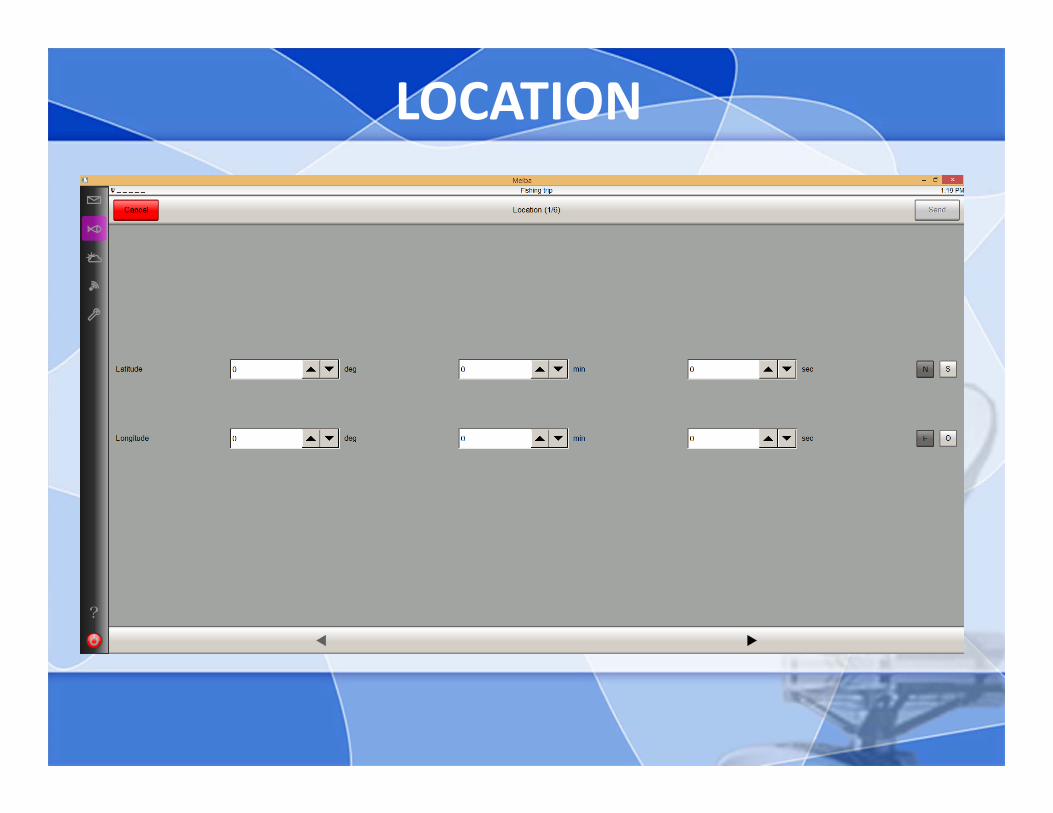
LOCATION

SET START DATE AND TIME

SET END DATE AND TIME

SCHOOL ASSOCIATION
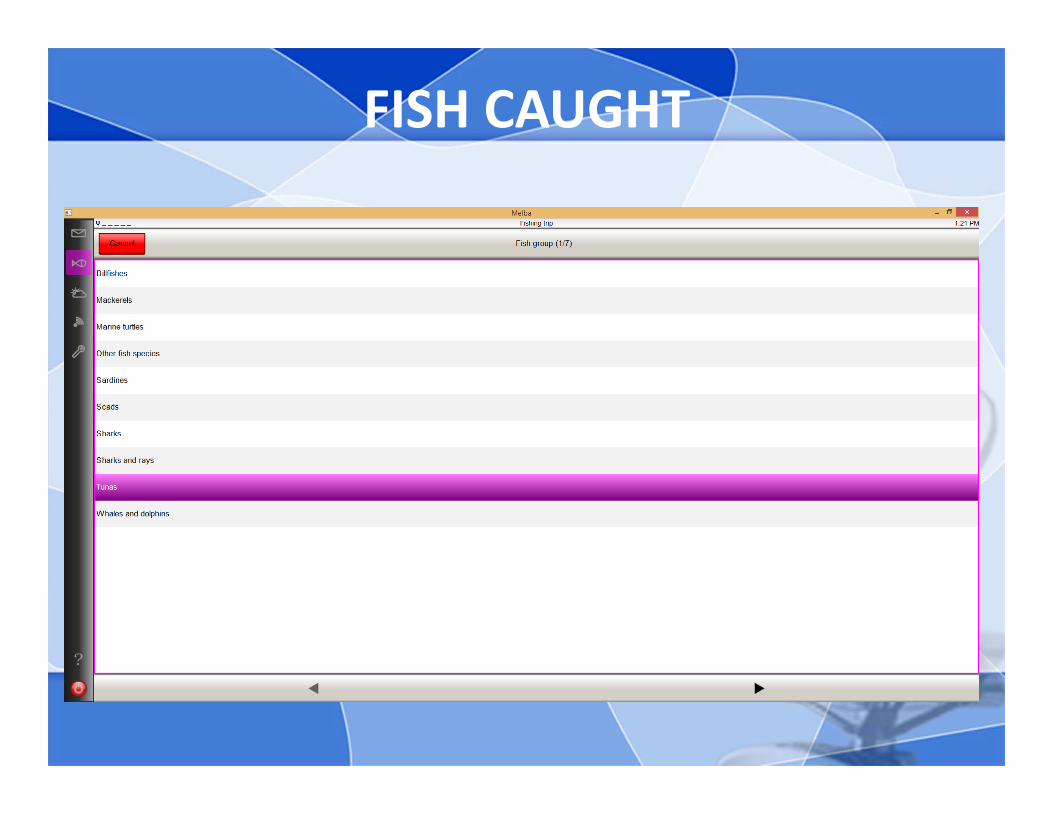
FISH CAUGHT

SPECIES CAUGHT

SPECIES QUANTITY
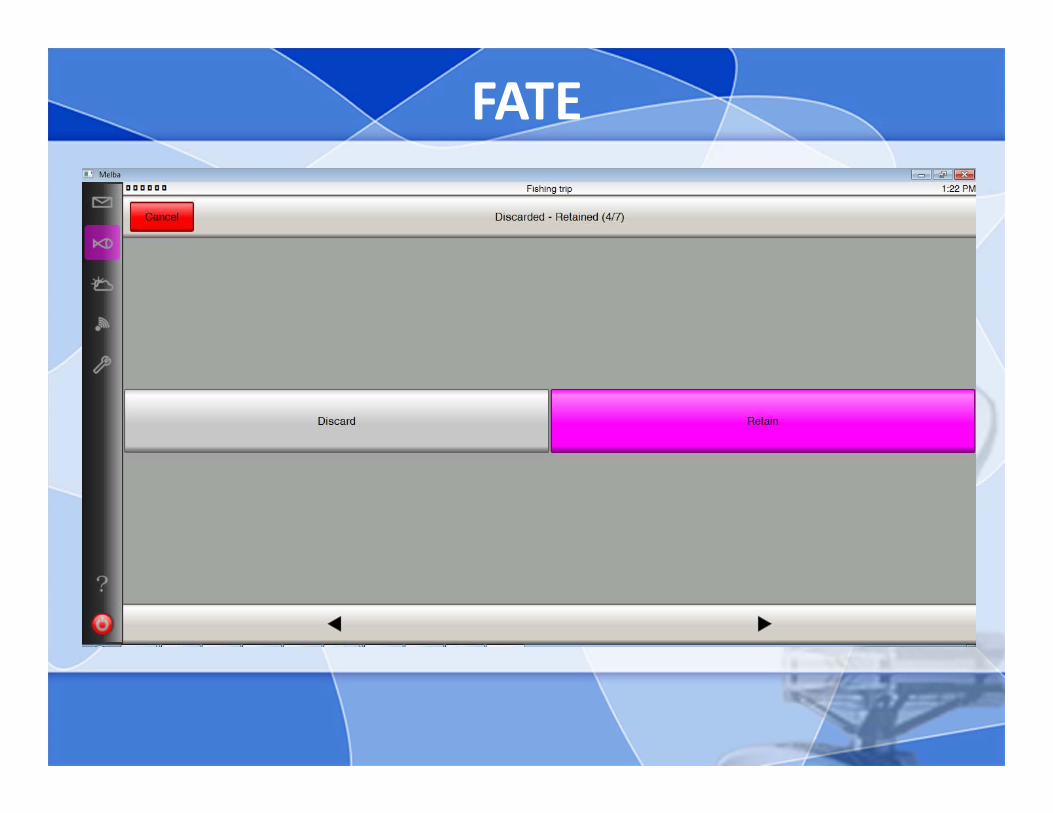
FATE
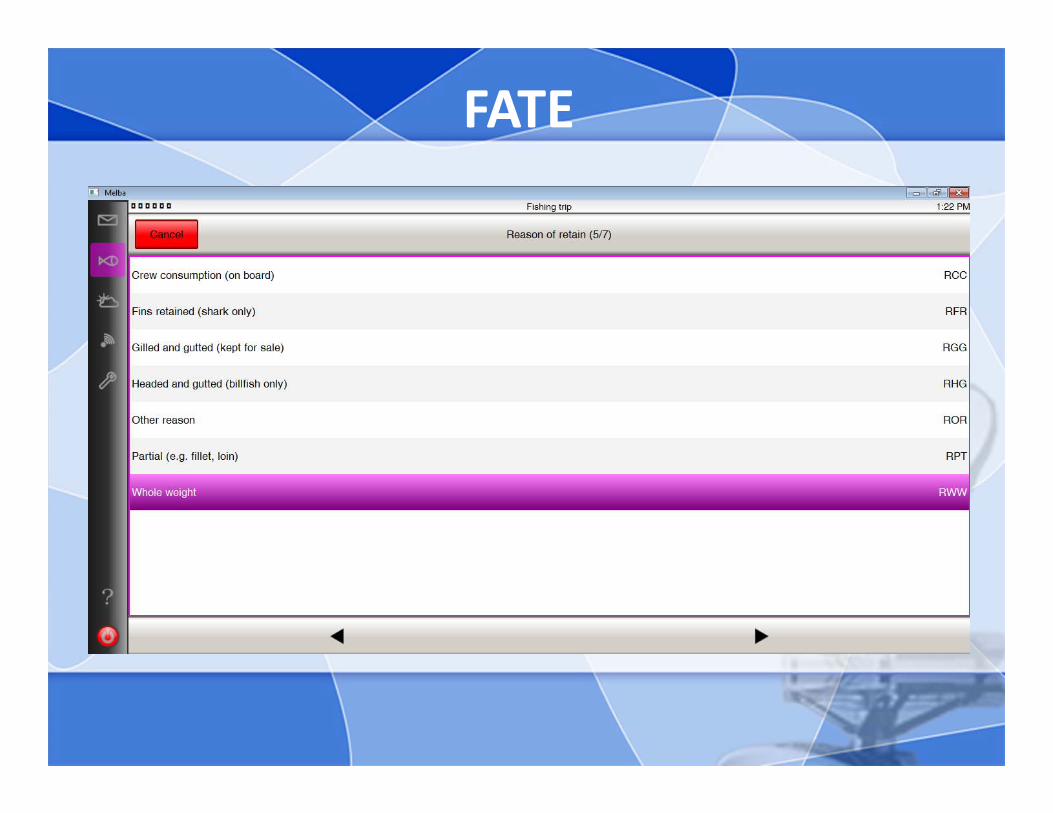
FATE

FISH CARRIER NAME

FISHHOLD NUMBER

NUMBER OF FADS

OTHER ACTIVITY

PORT ARRIVAL
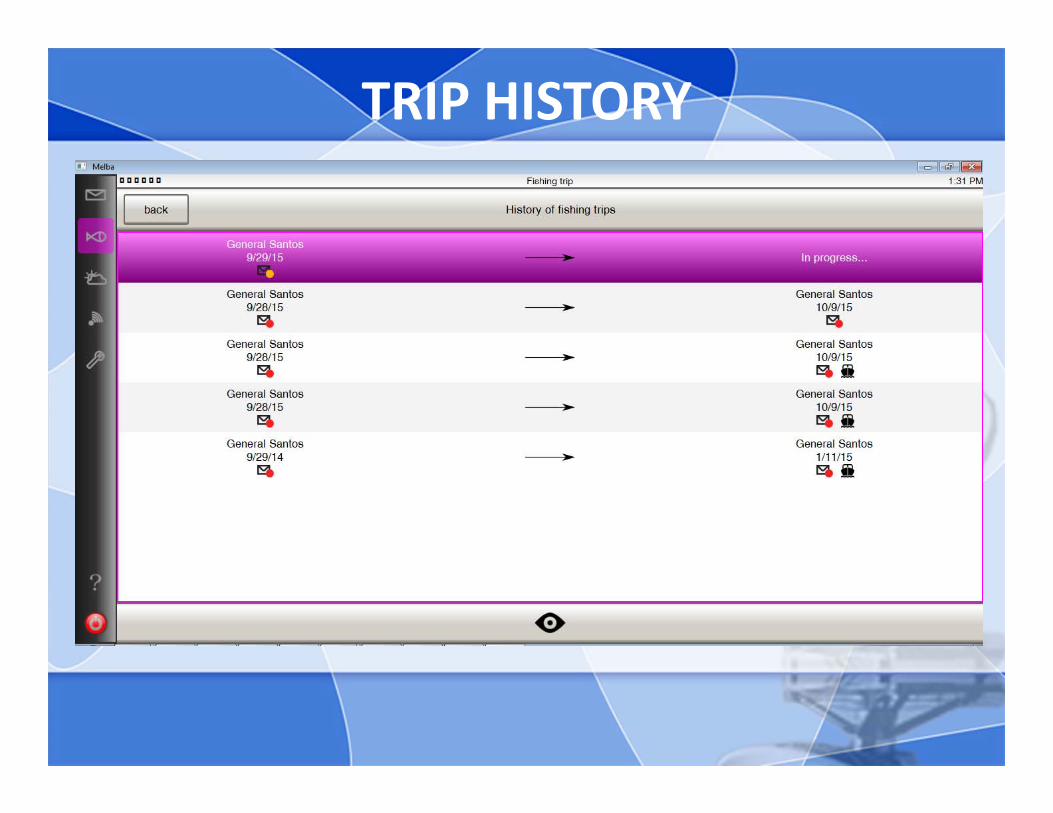
TRIP HISTORY
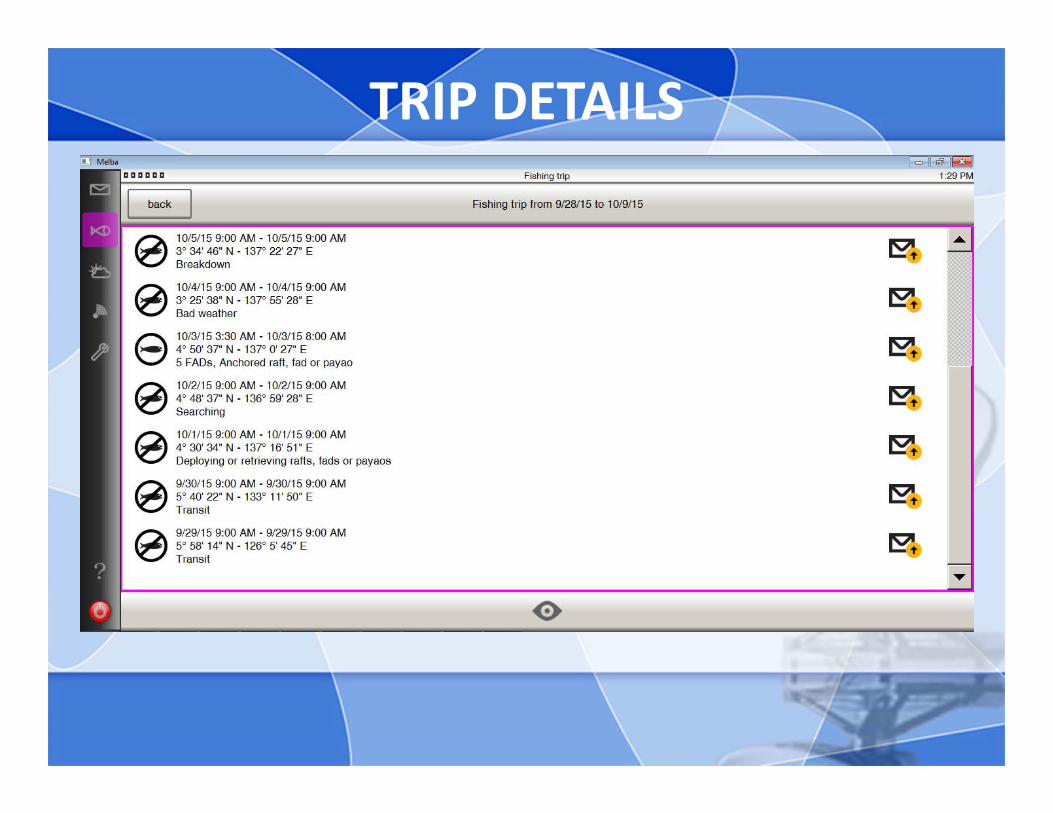
TRIP DETAILS

CATCH DETAILS

REPORTING

LOG IN PAGE

VESSEL INFORMATION PAGE
Name: Country code: Call Sign: OMI number: CFR number: Registration: ICCAT number: Beacon number: Is receiver: (YES OR No) Shipyard: Master name: Master address:

E-REPORTING SPECIFICATION DOCUMENTSUGGESTED TEMPLATE for VESSEL IDENTIFICATION
PHILIPPINES-MARLIN
Name of Vessel Name
Flag State Registration Number Registration
International Radio Call Sign Callsign
Vessel Owner/Company
Hull Markings Consistent with CMM 2004-03WIN Markings consistent with CMM 2004-03WIN formatfor markings consistent with CMM 2004-03IMO Number IMO Number

JOURNEY PAGE(DEFAULT)
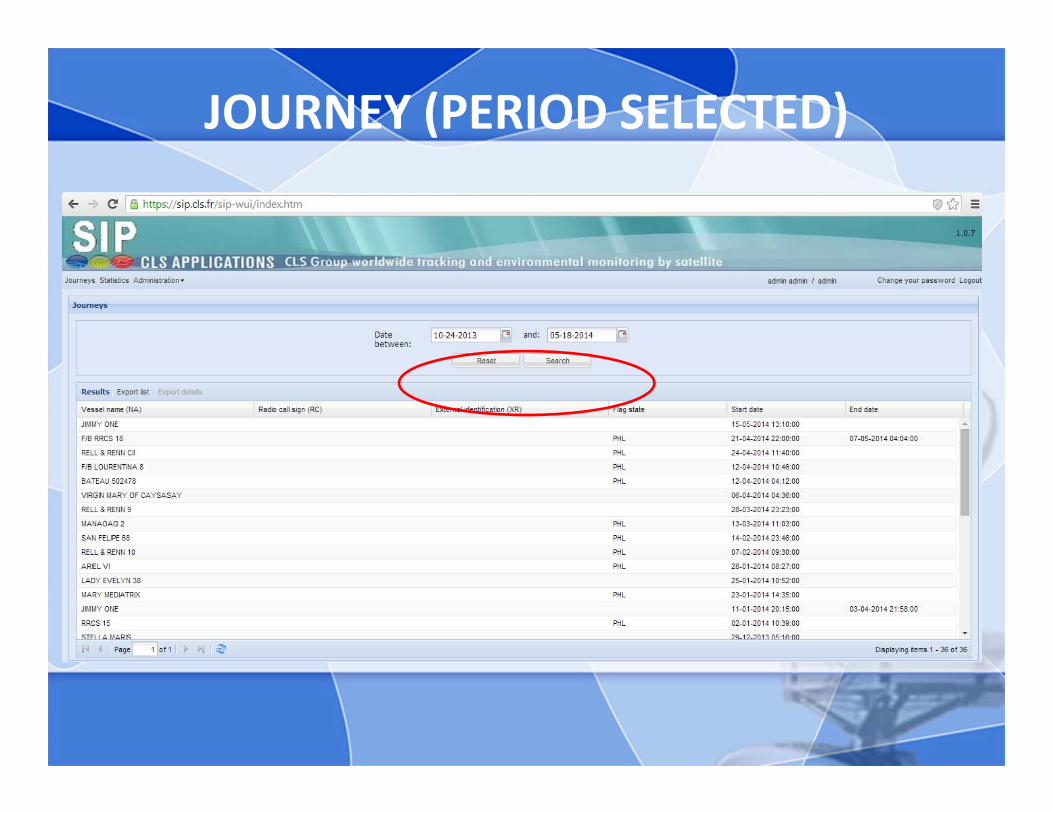
JOURNEY (PERIOD SELECTED)

JOURNEY (VESSEL SELECTED AND EXPORTED)

OUTPUT (START TRIP)

OUTPUT (DEPLOYING FADS)
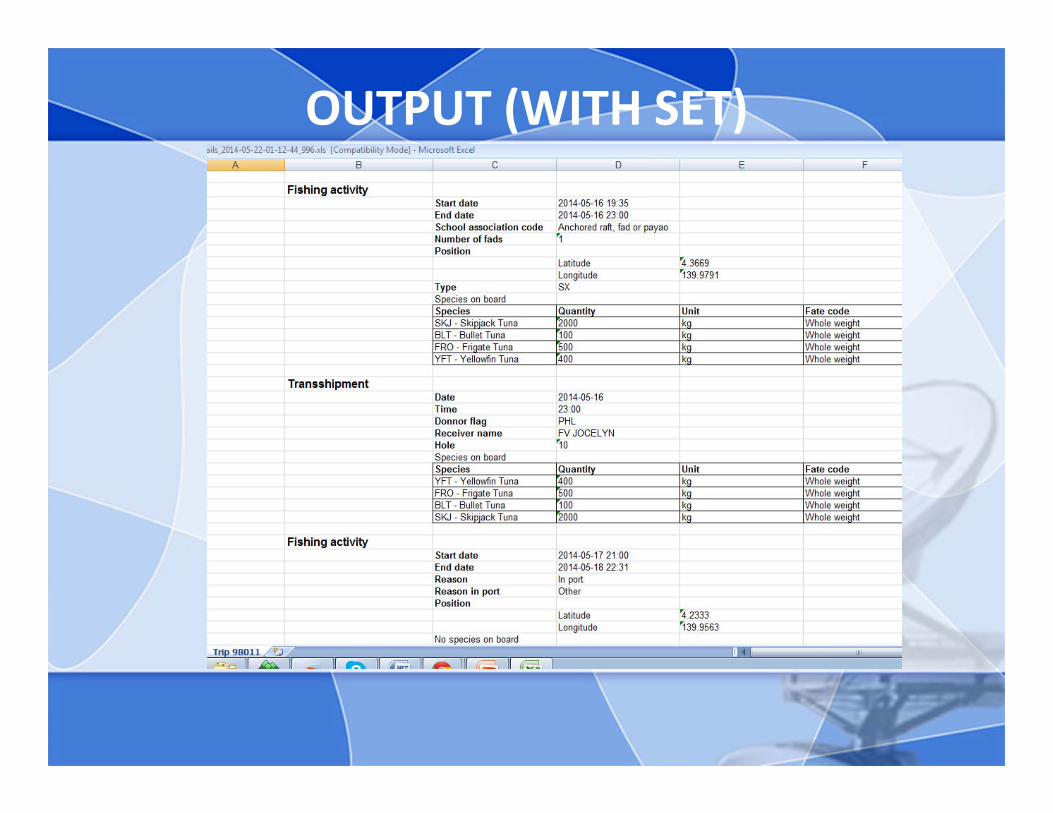
OUTPUT (WITH SET)

STATISTICS (FILTER ON ACTIVITIES)

STATISTICS (FILTER ON SPECIES)

STATISTICS (FILTER ON VESSEL)

SELECT PERIOD AND UNIT OF TIME
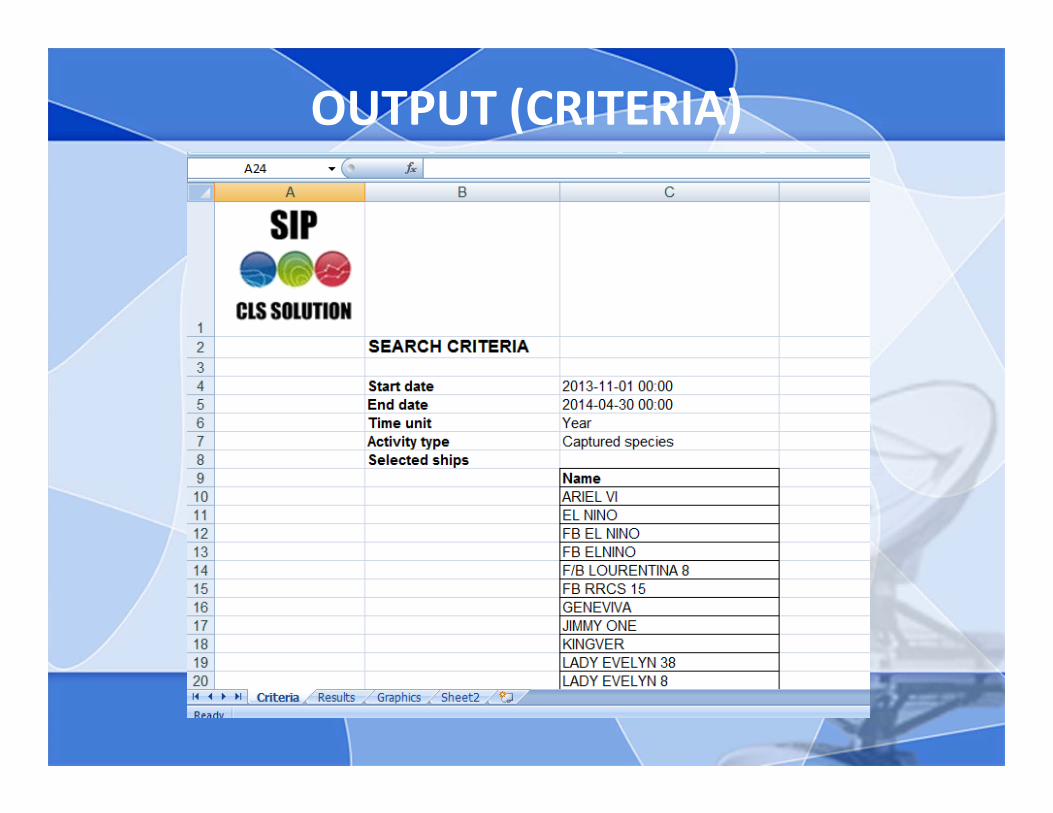
OUTPUT (CRITERIA)

OUTPUT (RESULTS)
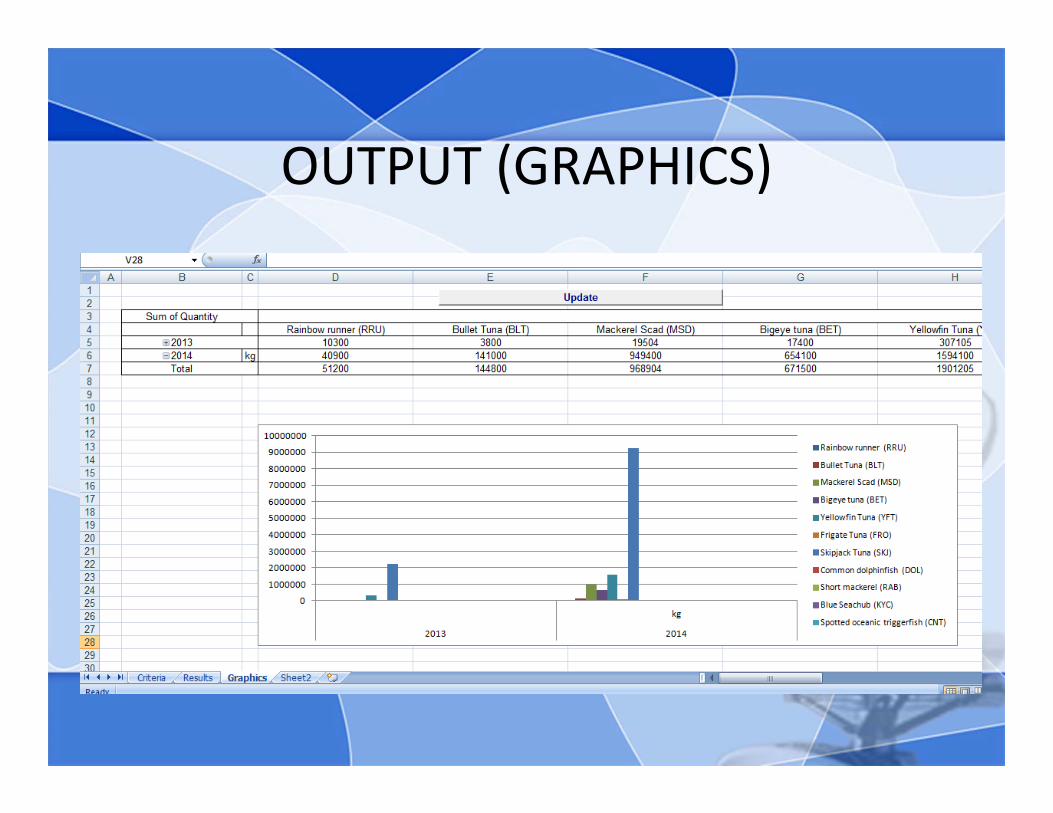
OUTPUT (GRAPHICS)

TRANSMITTED CATCH DATA
YEARNO. OF VESSELS SKJ(MT) YFT(MT) BET(MT) OTHERS(MT) TOTAL
2013 18 2,129.3 283.4 17.7 40.2 2,470.6
2014 32 15,729.9 2,885.2 318.1 1,104.2 20,037.4
2015 31 12,762.3 4,113.4 379.4 951.0 18,206.1
TOTAL 30,621.5 7,282.0 715.2 2,095.4 40,714.1Average of 91% of the catcher vessels in HSP1 were able to transmit data in 2015

MARLIN PLUS RETRIEVED LOGSHEET DATA
YEARNO. OF VESSELS SKJ(MT) YFT(MT) BET(MT) OTHERS(MT) TOTAL
2013 18 2,129.3 283.4 17.7 40.2 2,470.6
2014 35 18,412.3 3,343.9 466.9 1,337.3 23,560.3
2015 34 15,568.7 5,138.5 487.8 1,116.8 22,356.9
TOTAL 36,110.3 8,810.8 972.4 2,494.3 48,387.8Vessel logs from Observer report were used to supplement missing MARLIN data

CATCH BY YEAR(Nov 2013-Dec 2015)

CATCH BY MONTH(REPORTED)MONTH SKJ YFT BET OTHERS
TOTALCATCH SET
CATCH RATE
NO. OF CATCHERS
AVE. CATCH/CATCHER
January 661.9 139.6 3 190.9 1085.6 181 5.5 28 35.6
February 423.7 112.6 6.4 110.5 653.2 131 5.0 22 29.7
March 870.9 258.2 68.3 175.2 1,372.6 193 7.1 22 62.4
April 1468.5 567.7 124.5 205.2 2,365.9 272 8.7 23 102.9
May 1546.9 468.4 63.3 131.1 2,209.7 284 7.8 23 96.1
June 1336.9 618.2 47.3 41.5 2,043.9 199 10.3 23 92.9
October 1899.0 720.4 30.7 47.6 2,697.7 164 16.4 17 158.7
November 2359.5 628.6 18.4 34.5 3,041.0 249 12.2 20 152.1
December 2195.0 599.7 17.5 14.5 2,826.7 222 12.7 22 128.5
TOTAL 12,762.3 4,113.4 379.4 895.2 18,206.1 1,896 9.6 587.3
Declining Average catch was observed from October to December
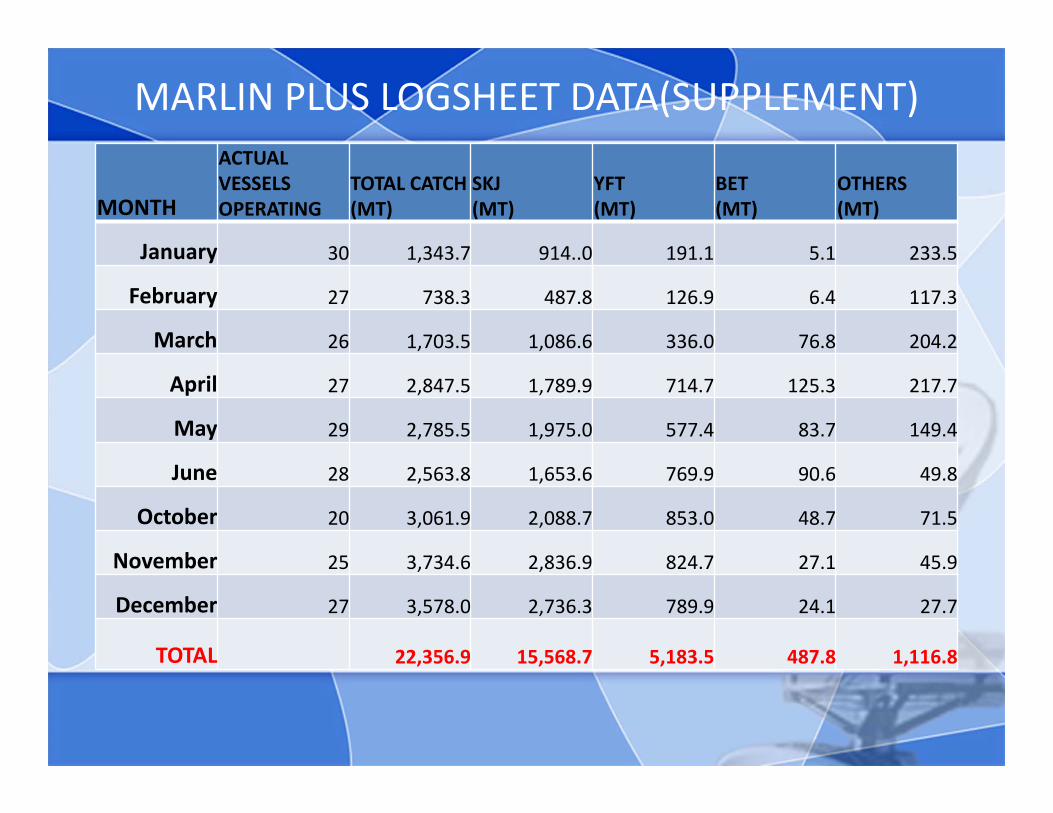
MARLIN PLUS LOGSHEET DATA(SUPPLEMENT)
MONTH
ACTUAL VESSELS OPERATING
TOTAL CATCH(MT)
SKJ(MT)
YFT(MT)
BET(MT)
OTHERS(MT)
January 30 1,343.7 914..0 191.1 5.1 233.5
February 27 738.3 487.8 126.9 6.4 117.3
March 26 1,703.5 1,086.6 336.0 76.8 204.2
April 27 2,847.5 1,789.9 714.7 125.3 217.7
May 29 2,785.5 1,975.0 577.4 83.7 149.4
June 28 2,563.8 1,653.6 769.9 90.6 49.8
October 20 3,061.9 2,088.7 853.0 48.7 71.5
November 25 3,734.6 2,836.9 824.7 27.1 45.9
December 27 3,578.0 2,736.3 789.9 24.1 27.7
TOTAL 22,356.9 15,568.7 5,183.5 487.8 1,116.8
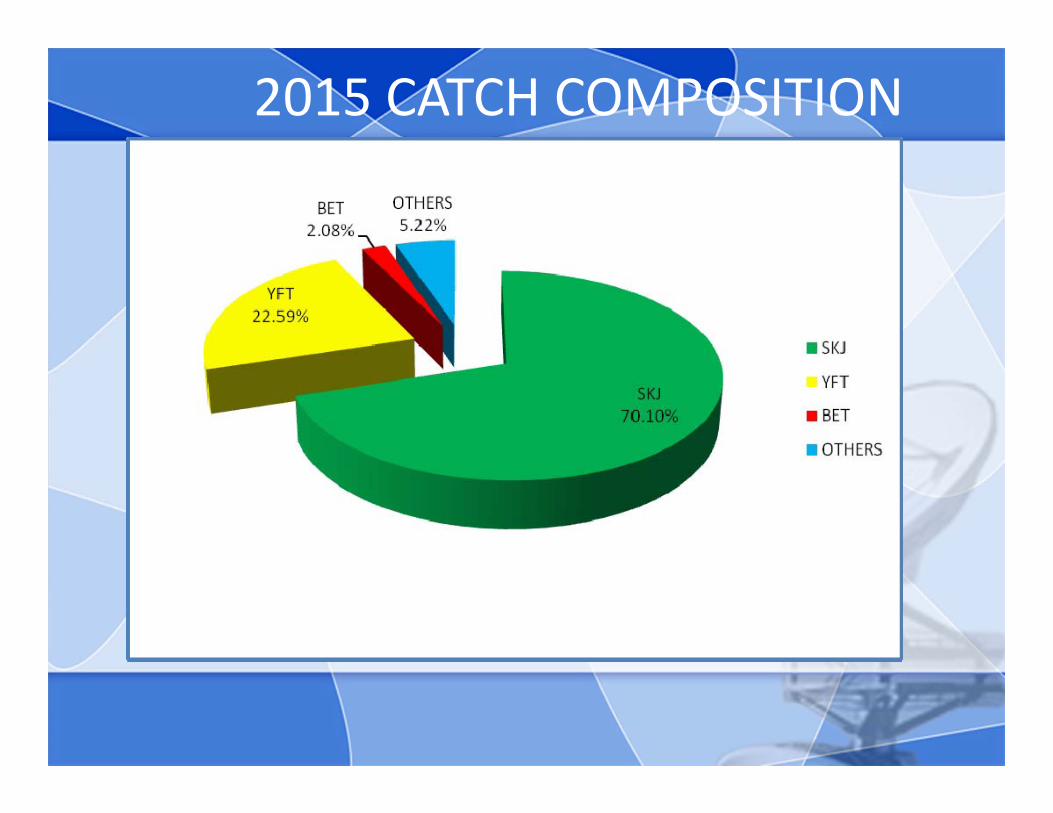
2015 CATCH COMPOSITION
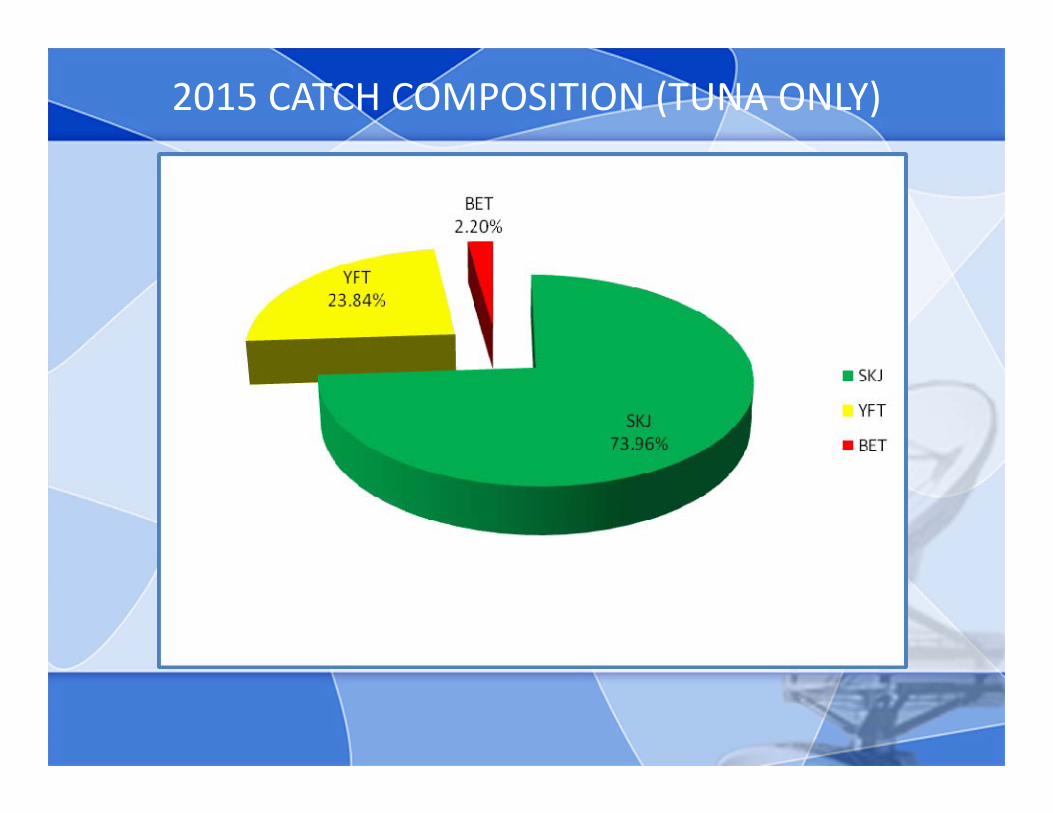
2015 CATCH COMPOSITION (TUNA ONLY)

CATCH RATE PROGRESS
Total catch has increased significantly from October to December despite oflower number of vessels operating. Highest catch rate in October
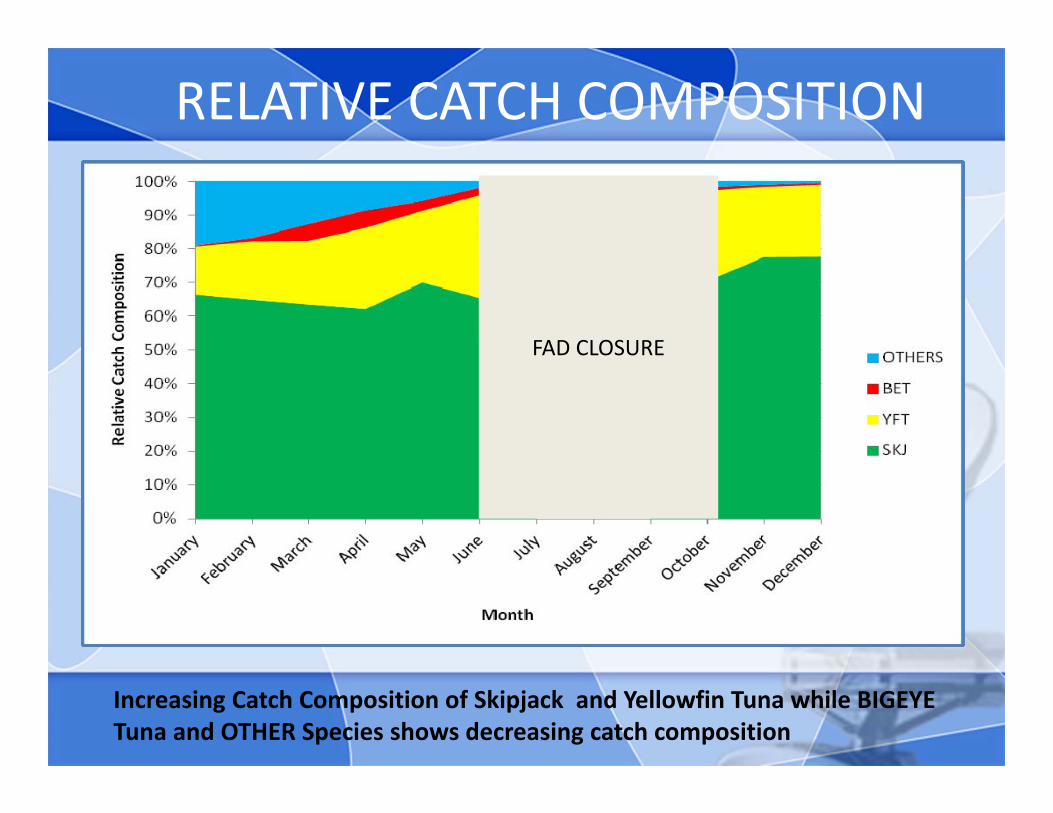
RELATIVE CATCH COMPOSITION
FAD CLOSURE
Increasing Catch Composition of Skipjack and Yellowfin Tuna while BIGEYE Tuna and OTHER Species shows decreasing catch composition

SUMMARY AND RECOMMENDATION
Pilot test of MARLIN in HSP1 catcher vessels has been successfully conducted31 out 34 of Vessels successfully transmit data 81% of data was transmitted from HSP1 in
2015Recommended for efficient catch reportingLack of technical support personnel when
troubleshooting while at sea

THANK YOU