pilot result monitoring energy usage by software
TRANSCRIPT
Pilot result Monitoring Energy usage by Software
Frank van Bokhoven1, Jarno Bloem2
1Energy Software Solutions, Arnhemseweg 39 Rheden, The Netherlands,
2Energy Software Solutions, Arnhemseweg 39 Rheden, The Netherlands [email protected]
ABSTRACT In this paper, the results of a pilot that Energy Software Solutions has conducted by help of AgentschapNL at the datacenters of Reasonnet and Fujitsu, using the ESSaver PUE energy monitoring system. The goal of this pilot was to test in a live environment how the monitoring of processes on servers in a live datacenter hold up in practice, and to investigate how well the measurements were in comparison to the empirically measured figures. During the pilot phase, a number of problems surfaced that had to do with the fact that the test servers were running outdated software and were really backup servers. This made measurement less useful, because no heavy load baring processes were running on them, however, these servers were suited for analyses, because there were still some interesting processes on it. For comparison, another set of servers was rigged to run a grid computing project in order to generate utilization. Lessons were learned about deployment in live datacenters, data consolidation methods and empirical data. Furthermore the interpretation of what data the datacenter management finds useful.
Keywords Energy monitoring, software, Software energy, energy consumption, DCIE, PUE
1. INTRODUCTION The world uses ever more devices running software (PC's, Tablets, Internet, and so on). In the western world. The electrical energy usage consumed by computer devices amounts to more than 20% of total consumption1. This percentage is still rising.
In 2011 and 2012 the Energy Software Solutions has conducted a pilot by the help of AgentschapNL, section Energy and Climate, using the ESSaver PUE energy monitoring system. The goals for the pilot were:
Clarify the workload of the designated servers at Reasonnet and Fujitsu.
Test for ESSaver PUE how installation is done in a production environment.
Test for ESSaver how the monitoring holds up in practice. Datacenters are trying lots of initiatives to monitor energy usage and lowering the overall energy usage. The following levels of monitoring are distinguished:
Energy usage entire datacenter
Energy usage per rack
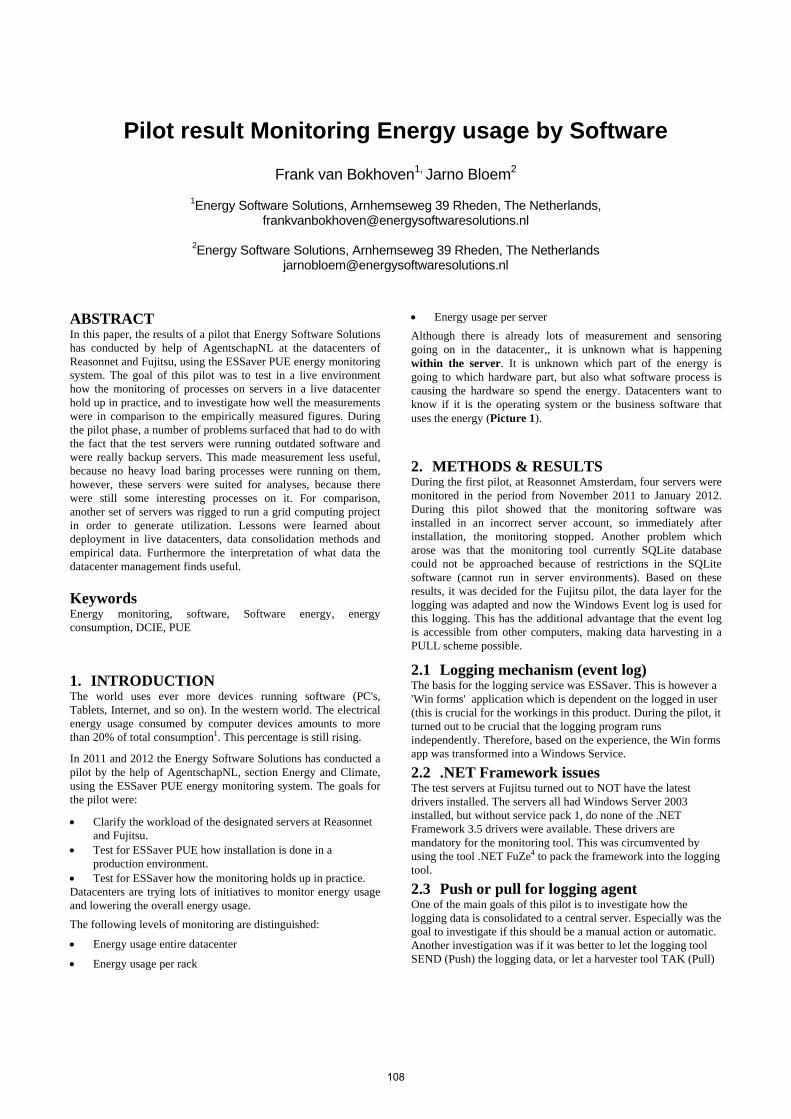
Energy usage per server Although there is already lots of measurement and sensoring going on in the datacenter,, it is unknown what is happening within the server. It is unknown which part of the energy is going to which hardware part, but also what software process is causing the hardware so spend the energy. Datacenters want to know if it is the operating system or the business software that uses the energy (Picture 1).
2. METHODS & RESULTS During the first pilot, at Reasonnet Amsterdam, four servers were monitored in the period from November 2011 to January 2012. During this pilot showed that the monitoring software was installed in an incorrect server account, so immediately after installation, the monitoring stopped. Another problem which arose was that the monitoring tool currently SQLite database could not be approached because of restrictions in the SQLite software (cannot run in server environments). Based on these results, it was decided for the Fujitsu pilot, the data layer for the logging was adapted and now the Windows Event log is used for this logging. This has the additional advantage that the event log is accessible from other computers, making data harvesting in a PULL scheme possible.
2.1 Logging mechanism (event log) The basis for the logging service was ESSaver. This is however a 'Win forms' application which is dependent on the logged in user (this is crucial for the workings in this product. During the pilot, it turned out to be crucial that the logging program runs independently. Therefore, based on the experience, the Win forms app was transformed into a Windows Service.
2.2 .NET Framework issues The test servers at Fujitsu turned out to NOT have the latest drivers installed. The servers all had Windows Server 2003 installed, but without service pack 1, do none of the .NET Framework 3.5 drivers were available. These drivers are mandatory for the monitoring tool. This was circumvented by using the tool .NET FuZe4 to pack the framework into the logging tool.
2.3 Push or pull for logging agent One of the main goals of this pilot is to investigate how the logging data is consolidated to a central server. Especially was the goal to investigate if this should be a manual action or automatic. Another investigation was if it was better to let the logging tool SEND (Push) the logging data, or let a harvester tool TAK (Pull)
108

the data. As result of this pilot, the pull system turned out to be the most workable. However, this greatly depends on the wishes of the management of the datacenter. During the pilot there is also a pull system developed that is started by the (standard) Windows scheduler and regularly sends the log data to the data consolidation server.
2.4 One application can have multiple processes. Many business applications use multiple processes at one time. If the application is running in the internet/intranet, one must also add the usages by the web service application (like IIS or Apache) to the total.
2.5 Test servers must have something to do! The test server Fujitsu HOLSIC001 showed very low activity. The monitored processes showed during the pilot period very few activity. During a meeting where the results of this pilot were discussed, it turned out that the monitored server is a fallback server, for another server. The only activity during the pilot period were the spikes, generated by the antivirus program and network monitoring software, that is standard installed on Fujitsu servers
2.6 Logging Mechanism (event log) The basis for the logging application was ESSaver. This is a 'Win forms' application. Typically this app runs within the user account. This is critical for several reasons for the operation of that product. The pilot at Reasonnet launched a version of that same product. Soon, it was discovered that this did not work, since it became clear that an account independent monitor tool was required.
2.7 Framework issues Several servers at Fujitsu did not appear to have the latest drivers and software updates to run properly. A major omission was the Microsoft .NET framework version 3.5. This framework is required by the monitor tool.
2.8 Push or pull for logging agent Experience has been gained about what the best method for the logged data from the servers to a central location. The result is the ESSaver Harvester, an application that can make contact with a remote server and read event log remotely and emptying it after each read.
2.9 One application can have multiple processes Many business packages use multiple processes simultaneously. If the application is running in the Internet, should also monitor the web server, which is a standard windows process) should also be included in the total consumption.
2.10 Test servers must have something to do! Remarkably, the Fujitsu server HOLSIC001 showed little activity. The processes monitored in the pilot period showed almost no peaks or spikes. During the discussion of these results on 8 June
2012 people Fujitsu has shown that this server was a server that serves as a fallback in case another server fails.
3. Examining the Differences To better compare the differences between an idle server or one with a sizable load, it is decided to start a parallel pilot in the Yggdra test data center. On two servers (Dell PowerEdge 1860) and (DEL PowerEdge 710 2x), (both have Windows Server 2003 installed), the BOINC service is installed. BOINC is the platform for grid computing developed by the University of Berkeley (boinc.berkeley.edu3). This platform uses the unused computing power of computers on the Internet for resource-intensive calculations. The approach is a computational task by BOINC is divided into work-packages, downloaded by computers in the 'grid' then processed and then returned to BOINC, where researchers can use the answer for their research. The application in this pilot is that the computational and network and disk IO, caused by this grid computing, gives a good performance load, comparing the Fujitsu computers. The grid computer approximates a virtual host computer (ie a physical computer that hosts one or more virtual sessions). The chart in (Picture 3) shows the percentage consumption of the Fujitsu HOLSIC001 server. Obviously the software amounts to only 15% of total consumption. It is mainly the power usage of the chassis (e.g. motherboard, fan pages, NICs, RAID controllers, etc.), which covers the vast majority (68%) of usage. The chart in picture 2 shows the consumption on the 'open malaria' server. Since it is the software which forms the greater proportion of the consumption causes (72%). Consumption between these two servers also varies greatly. The Fujitsu HOLSIC001 server consumes 180Watt (1.2 kWh per day), while the Dell PowerEdge 1810, 320 Watts (7.68 kWh per day) consumed. The charts shown above can (of course) also be displayed in numbers. Below are both the server as an open malaria test server. It immediately becomes clear that it makes a huge difference whether a server is idle or actually engaged in a (useful) process. This difference in energy consumption can be explained entirely by the software.
4. Data Completeness In order to be able to comment on the energy consumption of the servers, or investigate any parameter, it is necessary that it is known that there are enough data points in the selected time period. The screen dump in picture 8 shows per server the completeness of the registration data. It looks at the number of log messages per day. For example, if the registration is assumed to create a snapshot every 60 seconds, there would be at least 1140 logs per 24 hours should exist. And even many times that amount if multiple processes are logged. Also, there is a certain continuous progress in the log times. If any of these exhibited an anomaly, it is included in the reports.
109

5. Conclusions and Future Work
• Logging mechanism: Logging should be done via an account independent Windows Service or Linux Deamon.
• Software version issues: In a production datacenter, the reality is that servers do NOT always have the latest available software versions installed. Logging software must be able to cope with all kinds of exotic configurations and limitations. Datacenters cannot easily adjust any imperfections in this aspect, because these servers usually are running critical applications that are owned by other parties.
• Push or pull for logging agent: It depends greatly on the situation at a site (in situ) which data consolidation method is preferable. Both push and pull have their advantages.
• Test servers must have something to do: If you are researching the effect of software on energy usage, make sure your test servers have processes running that are creating load/usage.
• One application can have multiple processes : It is critical to exactly know the architecture of a software package, because many times an application is divided over more than one process.
• Consolidation: Knowing what processes are running on a server gives insights in weather or not a server is in utilized too much or too little. This info is greatly appreciated by datacenter managers because this is info for datacenter consolidation.
The pilot has given many new insights. Not only the registration data but also new insights into the interaction with the staff of the data center and their update and their security policies. Also, new insights are obtained about the method to harvest the log data ''. It
was agreed that the pilot at Fujitsu will be repeated on a larger number of servers, and also on servers that actually ar doing something productive. The presentation, about this pilot was, just like this report, held for the Knowledge Network Green Software, on 8 May 2012, has drawn new interested parties. This pilot will therefore continued in many new trials • New, more extensive pilot at Fujitsu • Trials at other designated datacenters
6. ACKNOWLEDGMENTS We greatly thank Frank Hartkamp of AgentschapNL for his coordination of the pilot. We also would like to thank the companies Reasonnet and Fujitsu, to have provided the test servers for this pilot.
7. REFERENCES [1] Chen Allen, 2012, Research finds Computer-related
Electricity use to be overestimated, ScienceBeat, http://www.lbl.gov/Science-Articles/Archive/net-energy-studies.html
[2] Measurement on the rack, 2012, Jarno Bloem [3] Grid computing with BOINC, 2012, University of Berkely,
http://boinc.berkeley.edu/trac/wiki/DesktopGrid [4] dotNET Fuze, 2012, Energy Software Solutions,
http://essaver.net/en-us/netfuze.aspx
110
1: Measurement within the datacenter. Everything is measured, however what goes on inside the server remains a black box.
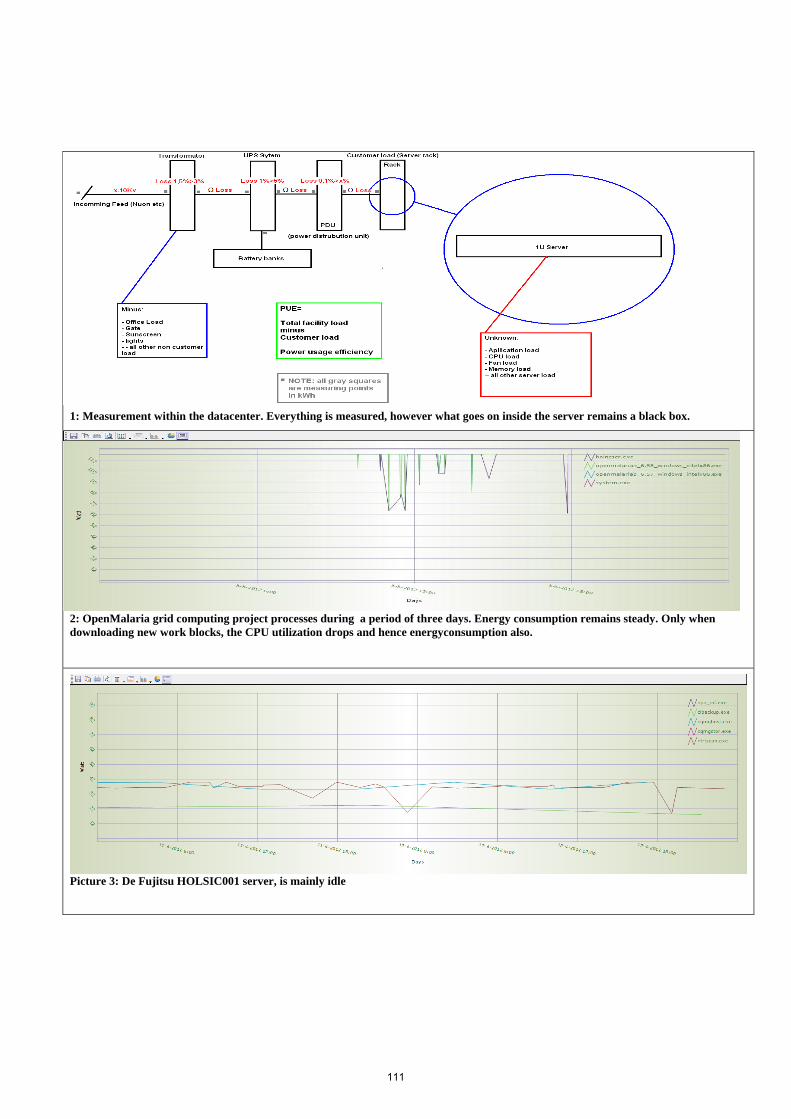
2: OpenMalaria grid computing project processes during a period of three days. Energy consumption remains steady. Only when downloading new work blocks, the CPU utilization drops and hence energyconsumption also.
Picture 3: De Fujitsu HOLSIC001 server, is mainly idle
111
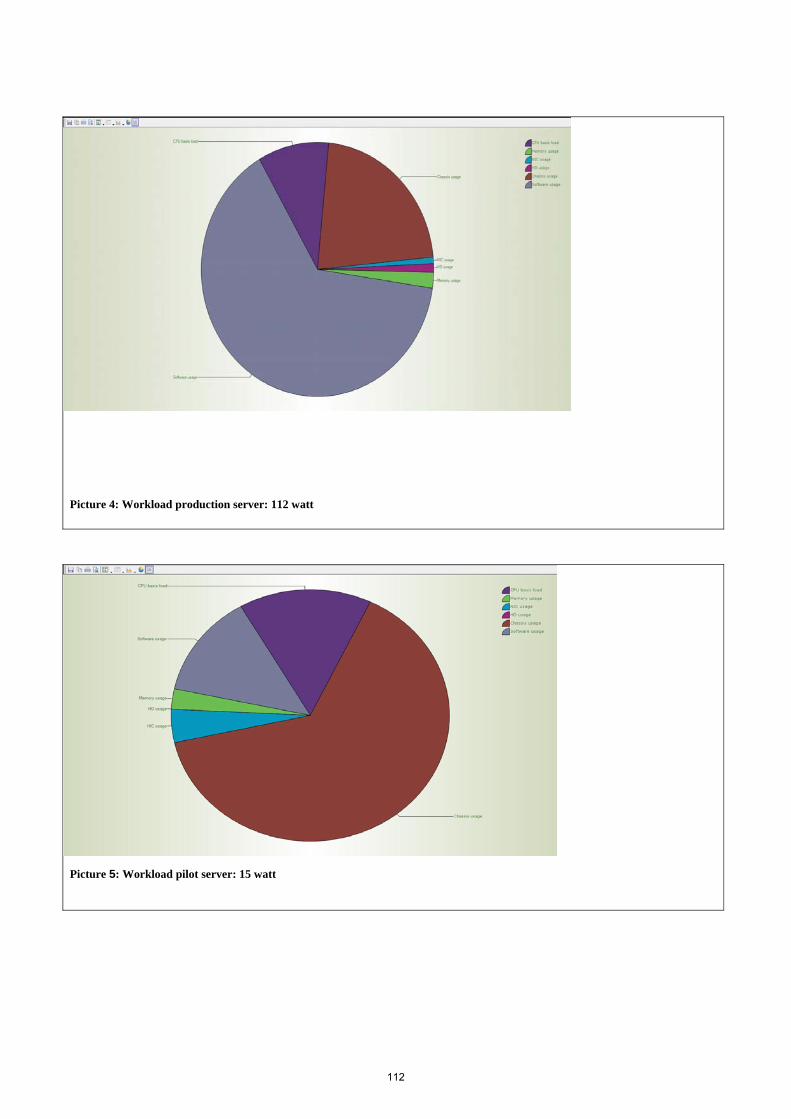
Picture 4: Workload production server: 112 watt
Picture 5: Workload pilot server: 15 watt
112
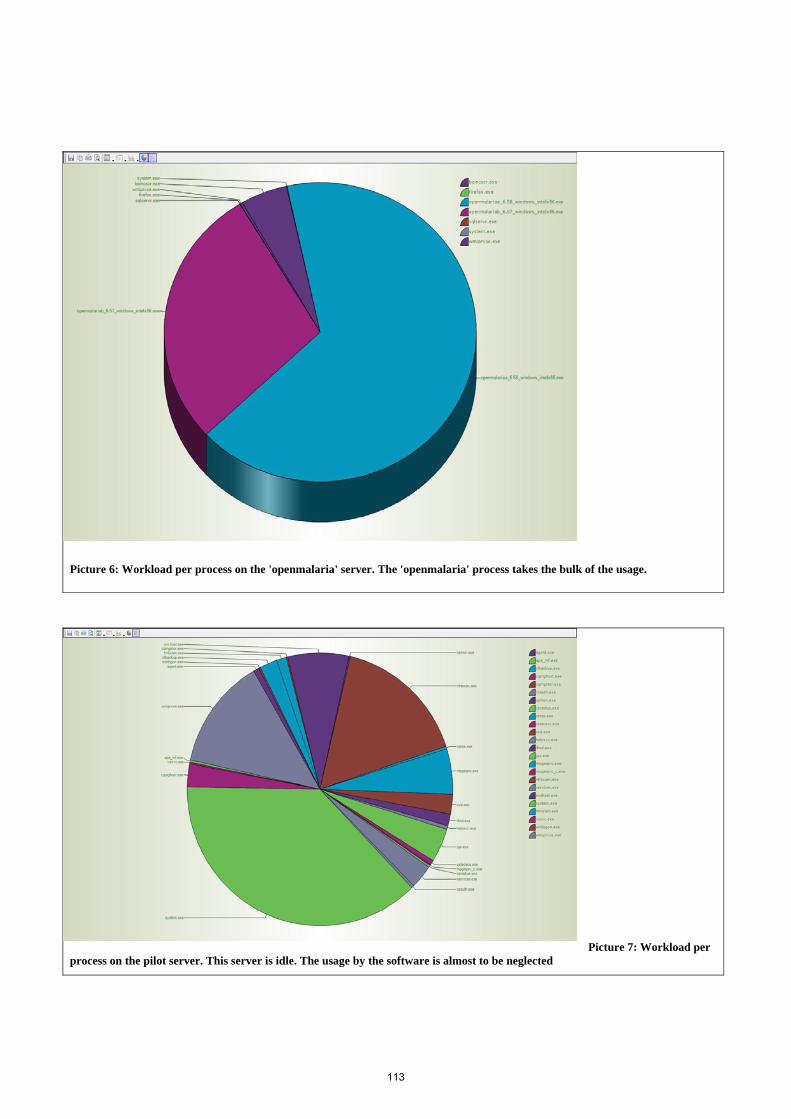
Picture 6: Workload per process on the 'openmalaria' server. The 'openmalaria' process takes the bulk of the usage.
Picture 7: Workload per
process on the pilot server. This server is idle. The usage by the software is almost to be neglected
113
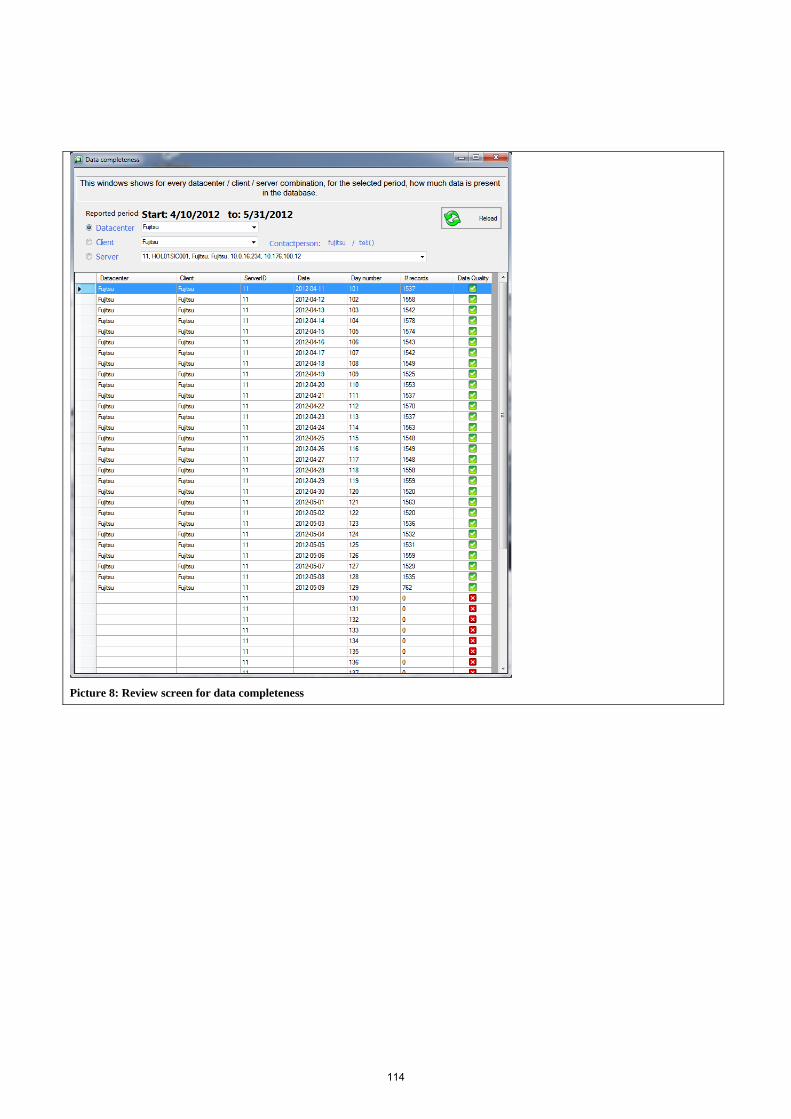
Picture 8: Review screen for data completeness
114
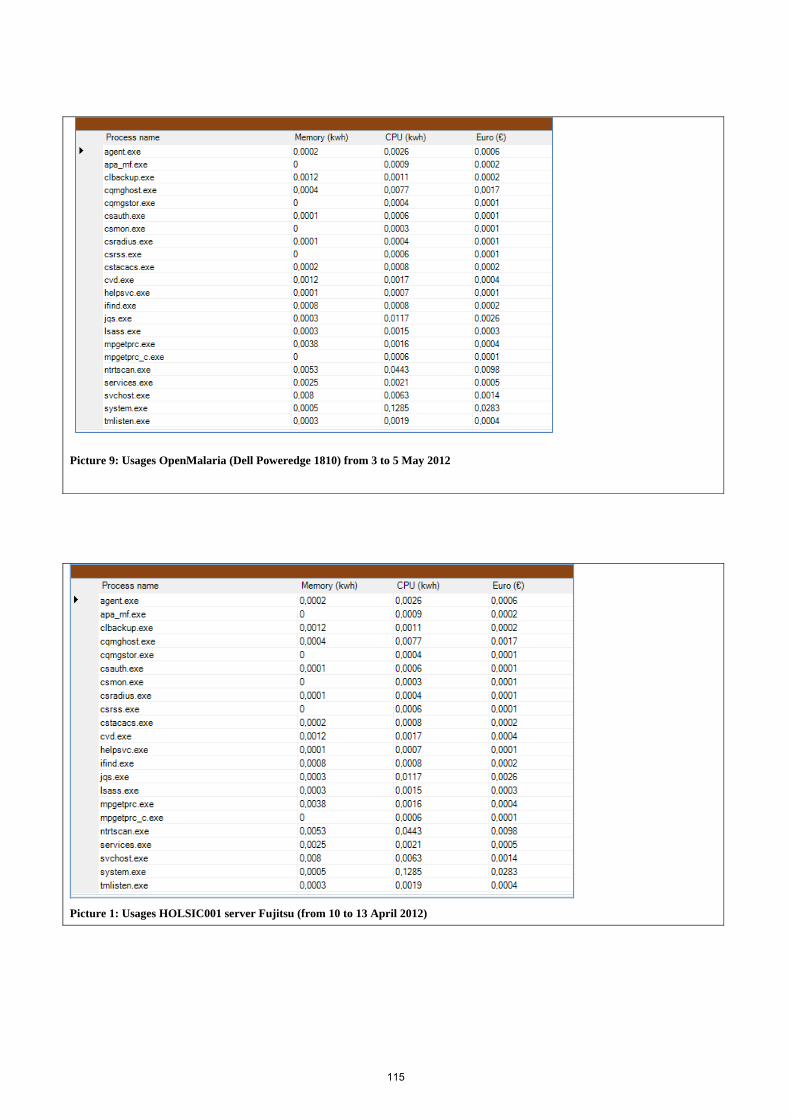
Picture 9: Usages OpenMalaria (Dell Poweredge 1810) from 3 to 5 May 2012
Picture 1: Usages HOLSIC001 server Fujitsu (from 10 to 13 April 2012)
115