pilot plant studies of wastewater chemical … · 2016-08-09 · pilot plant studies demonstrated a...
TRANSCRIPT

MAY 1975
REPORT NO. ENV.E; 46-75^2
PILOT PLANT STUDIESOF WASTEWATER CHEMICALCLARIFICATION USING LIME
C James Martel
Francis A. DiGiano
Robert E. Pariseau
Report to the Division of Water Pollution Control
Massachusetts Water Resources Commission
Contract Number 73-07 (1)
ENVIRONMENTAL ENGINEERING
DEPARTMENT OF CIVIL ENGINEERING
UNIVERSITY OF MASSACHUSETTS
AMHERST, MASSACHUSETTS

PILOT PLANT STUDIES OF WASTEWATER
CHEMICAL CLARIFICATION USING LIME
By
C. James MartelResearch Associate
Francis A. DiGianoAssociate Professor of Civil Engineering
Robert E. PariseauResearch Chemist
Division of Water Pollution Control
Massachusetts Water Resources Commission
Contract Number HDWPC 73-07(1)
Environmental Engineering Program
Department of Civil Engineering
University of Massachusetts
Amherst, Massachusetts 01002

ABSTRACT
Lime clarification of raw wastewater was evaluated in jar tests
and extensive pilot plant operations. The relatively low alkalinity
of Amherst wastewater (averaging 149 mg/1 during pilot plant tests)
required a Time dosage of 380 mg/1 as CaO to produce an effluent
phosphorus of 1 mg/1 or less. Because of low alkalinity, this lime
dosage resulted in a pH of approximately 11.5. These findings confirm
the importance of wastewater alkalinity in lime clarification.
Pilot plant studies demonstrated a need for longer flocculation
periods (approximately 15 minutes) to obtain maximum suspended solids
removal. Extensive pilot-scale testing with a flocculation time of
16 minutes produced an average effluent total phosphorus of 0.6 mg/1
as P, suspended solids of 33 mg/1, COD of 108 mg/1 an a turbidity of
17 JTU. The sludge accumulation rate was 4000 Ibs/MG, or approximately
four times the amount from primary sedimentation.
Lime sludge was shown to have good thickening and dewatering
characteristics; further improvement should be possible by adding
conditioning chemicals such as FeCl^ or polymer. Approximately
60 percent of the total lime requirement was estimated to be recover-
able by recalcination if two-stage recarbonation is used.
Previous pilot plant studies of alum clarification at the UMASS
Wastewater Pilot Plant also produced effective treatment of low
alkalinity wastewater; lime sludge production was twice that of alum.

This disadvantage is offset by the poorer dewatering properties of
alum sludge. Economic analysis for a 10 MGD facility showed that
alum clarification is less expensive than lime clarification.
However, if anaerobic digestion of alum sludge is required, both
alum and Time treatment costs are approximately the same.
n

TABLE OF CONTENTS
Page
ABSTRACT i
TABLE OF CONTENTS iii
LIST OF FIGURES v
LIST OF TABLES vi
INTRODUCTION 1
Background ' 1
Objectives 3
Scope 6
JAR TESTS 8
PILOT PLANT STUDIES 14
Phase I: The Effect of Flocculation Time 14
Phase II: Pilot Plant Performance at Optimum FlocculationTime 18
SLUDGE DEWATERABILITY 29
Thickening 29
Vacuum Filtration 34
Centrifugation 41
Recalcination and Lime Re-Use 41
PERFORMANCE COMPARISON OF LIME AND ALUM CLARIFICATION 45
COST COMPARISON OF LIME AND ALUM CHEMICAL CLARIFICATION 49
CONCLUSIONS 55
REFERENCES 58

TABLE OF CONTENTS, CONTINUED
Page
ANALYTICAL TECHNIQUES 60
DETERMINATION OF THE MEAN VELOCITY GRADIENT(G) 62
CARBON DIOXIDE REQUIRED FOR RECARBONATION 64
ESTIMATES OF LIME SLUDGE PRODUCTION 67
GRAVITY THICKENING AND CENTRIFUGE DATA 69
ESTIMATES OF LIME RECOVERY 76
APPENDIX I
APPENDIX II
APPENDIX III
APPENDIX IV
APPENDIX V
APPENDIX VI
IV

LIST OF FIGURES
FigureNumber
1
2
3
4
5
6
7
8
9
10
11
12
13
AV-1
AV-1
Title Page
Chemical Clarification with Single or Two-Stage Recarbonation
Wastewater Treatment Schemes Using LimeClarification
Total Phosphorus Concentration vs. Lime Dosage
Total Phosphorus Concentration vs. pH
Effect of Flocculation Time on PhosphorusRemoval (3 Minute Rapid Mix)
Effect of Flocculation Time on PhosphorusRemoval (1 Minute Rapid Mix)
Effect of Flocculation Time on Removal Efficiencyof Pilot Plant
Schematic Diagram of Pilot Plant
Influent and Effluent Phosphorus ConcentrationsDuring Phase II Study
Lime Sludge Thickening Curves
Thickener Design Curves
Specific Resistance and Coefficient ofCompressibility for Lime Sludge
Vacuum Filter Yield for Various Feed SolidsConcentrations
Laboratory Settling Curves
Typical Sludge Thickening Curve
4
5
9
Tl
12
12
17
20
25
31
32
36
39
70
71

LIST OF TABLES
TableNumber Title Page
1 Treatment Efficiency vs. Flocculation Time 15
2 Pilot Plant Dimensions and Design Parameters 22
3 Pilot Plant Performance at Optimum FlocculationTime 23
4 Sludge Characteristics and Production Using Lime 27
5 Thickener Supernatant 33
6 Typical Specific-Resistance and Coefficient ofCompressibility Values for Various Sludges 35
7 Comparison of Thickener Supernatant and VacuumFiltrate Quality 40
8 Comparison of Mean Effluent Quality Using Alumor Lime 46
9 Comparison of Alum and Lime SludgeCharacteristics 48
10 Cost of Alum Treatment 51
11 Cost of Lime Treatment Without Recovery 52
12 Cost of Lime Treatment with Recovery 53
VI

INTRODUCTION
Background
It has been well established that discharges from wastewater
treatment plants often contain sufficient plant and algal nutrients to
radically increase the eutrophication rate of receiving waters. It has
also been shown that plant and algal growth can be controlled by limit-
ing the supply of a single major nutrient. Of the major nutrients other
than carbon, phosphorus is most easily controlled. It can be removed
by a number of processes Including lime clarification. Lime treatment
of wastewater not only precipitates phosphorus but improves organic and
suspended solids removal as well.
The addition of lime causes precipitation of calcium bicarbonate as
follows:
Ca(OH)2 + Ca(HC03)2+ 2CaC03+ + 2H20
This reaction is dependent upon the presence of bicarbonate alkalinity.
Remaining calcium ions will react with the orthophosphate ion to precip-
itate hydroxyapatite (an insoluble form of phosphorus) as shown below:
5Ca++ + 40H" + 3HPO^- -> Ca5OH(P04)3* + 3H20
This insoluble hydroxyapatite complex will completely form around pH
9.5 and become increasingly insoluble as the pH rises.
At pH values above 10, magnesium hydroxide is precipitated from
the wastewater according to the following reaction:
Mg"*"+ + Ca(OH)2 -* Mg(OH)2 + Ca++
The magnesium hydroxide precipitate is important because it aids in
liquid-solid separation (1). More detailed information on the reactions

-2-
involved in calcium precipitation of phosphorus can be found elsewhere
(2,3,4,5,6).
The chemical clarification process as applied to wastewater usually
involves rapid mixing of the chemical (in this case, lime) with the
wastewater, followed by flocculation and sedimentation. The rapid mix
must be turbulent enough to distribute the lime throughout the waste-
water for efficient phosphorus removal. The flocculation stage
promotes particle contact which allows the precipitation nuclei and
suspended particles to aggregate and settle out in the sedimentation
stage. The effluent from such a process typically has phosphorus
concentrations below 1.0 mg/1 as P and organic and suspended solids
concentrations approaching secondary treatment quality. However, the
obvious drawbacks to this process are increases in both pH and hardness.
Moreover, calcium is unstable at a high pH and will precipitate out as
calcium carbonate causing inactivation of downstream filters and
scaling in pipes. This problem can be eliminated by recarbonation
which removes the calcium carbonate precipitate before it can effect
downstream processes.
Recarbonation can be accomplished in a single or two-stage system.
In a single-stage system, enough carbon dioxide is added to reduce the
pH to 7.0, or to any other desired value in one step. However, by
applying sufficient carbon dioxide in a single stage most of the
calcium remains in solution causing the calcium hardness of the
effluent to be quite high. Consequently, this system is used in high
alkalinity wastewaters where low lime dosages are adequate for
phosphorus removal. Single-stage recarbonation is also used when lime

-3-recovery Is not planned.
If lime is to be reclaimed or if calcium reduction in the effluent
is required, then two-stage recarbonation is necessary. In two-stage
treatment, sufficient lime is added to raise the pH of the wastewater to
11.0 and above. Low alkalinity wastewaters typically require high lime
dosages for satisfactory floe formation. In the first stage of
recarbonation, enough carbon dioxide is added to bring the pH down to
approximately 9.3 where calcium carbonate precipitation results. This
settled precipitate is a rich source of calcium oxide and may represent
as much as one-third of the total recoverable lime (2). In the second
stage, carbon dioxide is again added to reduce the effluent pH before
discharge. Figure 1 illustrates the unit processes involved in lime
clarification and single and two-stage recarbonation.
The lime clarification process can be included in several waste-
water treatment schemes. Some of the more practical configurations, in
terms of the present, state-of-the-art design practice are shown in
Figure 2. Each scheme is intended to remove both phosphorus and
organics to secondary treatment levels. The carbon adsorption and
biological treatment steps remove the dissolved organics which are not
adequately removed in the lime clarification process.
Objectives
The primary objectives of this study were:
1) To determine the lime dosage necessary to reduce effluent
phosphorus concentrations below 1.0 mg/1 as P in low alkalinity
wastewater,
2} To examine the effect of flocculation time on the treatment
efficiency of the process,

SINGLE STAGE RECARBON A TION
RAW
WASTE WATEREFFLUENT
RAPIDMIX
FLOCCULA-TION
CLARIFICA- RECARBONA-TION TION
TWO STAGE RECARBQN ATIQN
RAW
WASTEWATER
EFFLUENT
RAPID FLOCCU- CLARIF1- RECARBON- CLARIFIMIX LATION CATION ATION CATION
RECARBON-ATION
Figure 1. Chemical Clarification with Single or Two-Stage Recarfaonation.

RAW
WASTEWATERLIME CLARIFICATION
blNfcLt UK
TWO STAGE
RECARBON-ATION
MULTI-MEDIA
FILTRA-TION
CARBON
ADSORP-TION
EFFLUENT• ^*
RAW
WASTEWATERLIME CLARIFICATION
SINGLE ORTWO STAGE
RECARBON-ATION
BIOLOGICAL
TREATMENT
EFFLUENT
Ien
i
RAW
WASTEWATER
BIOLOGICAL
TREATMENTLIME CLARIFICATION
SINGLE ORTWO-STAGE
RECARBON-ATION
EFFLUENT
Figure 2. Wastewater Treatment Schemes Using Lime Clarification.

-6-
3) To demonstrate the treatment effectiveness of lime addition
to raw wastewater through pilot-scale studies,
4) To determine lime sludge characteristics, accumulation rate
and dewaterability,
5) To -measure the quantity of recoverable lime (CaO) in the
dewatered sludge,
6) To examine the cost of chemical clarification with lime,
7) To compare the treatment effectiveness and costs of lime
clarification with alum clarification.
Scope
The investigative approach used in this study was to first
establish the lime concentration required to reduce raw wastewater
phosphorus concentrations to 1.0 mg/1 as P or less. This information
was obtained from jar tests. Jar tests were also used to examine the
effect of flocculation time on the removal efficiencies of lime addition
to raw wastewater.
Pilot plant studies were divided into two phases. Phase I was
concerned with re-examining the effect of flocculation time on a
continuous flow system. Three different flocculation times were
investigated. Phase II was a longer duration study which measured the
performance of the treatment process at the optimum flocculation time
and dosage. Sludge characteristics and accumulation rate were also
determined during this phase.
The unit processes used in the pilot plant treatment scheme
included a hydrasieve, rapid mix, flocculators and a clarifier. Mixed
media filtration was simulated by using a Whatman #2 filter on the
-7-clarified effluent samples. Degritted raw Amherst wastewater and high
quality (95 percent Ca(OH)2) hydrated lime was used in all jar tests
and pilot-scale investigations.
Using sludge generated from the pilot plant studies, various
sludge handling methods were evaluated. These methods included gravity
thickening, centrifugation and vacuum filtration. The supernatant,
centrate, and filtrate from these processes were also analyzed.
Specific resistance tests were conducted and the coefficient of com-
pressibility was determined. Dewatered lime sludge samples were then
recalcined to measure the amount of lime (CaO) available for reuse.
From previous investigations at the UMass Wastewater Pilot Plant
on chemical clarification with alum (7) a comparison of the treatment
effectiveness of lime and alum addition was obtained. Both studies
were conducted using the same pilot scale units.
Parameters analyzed during the jar tests and pilot plant studies
included pH, alkalinity, turbidity, chemical oxygen demand (COU),
total organic carbon (TOC), suspended solids, total phosphorus,
dissolved phosphorus and hardness. The frequency and type of sampling
varied during the study and are explained in the body of the report.
Analytical techniques and sample preservation methods are discussed in
Appendix I.

-8-
JAR TESTS
Before pilot-scale testing could begin, the proper lime dosage
and flocculation time had to be determined. The proper lime dosage,
in this case, is defined as the minimum amount of lime needed to
achieve phosphorus removals below 1.0 mg/1 as P. Phosphorus removal
was used as the main criteria for lime dosage selection because it
is the major function of the chemical clarification process. After
mixing lime with wastewater, adequate flocculation must take place
for particle aggregation. A 15 minute detention time is generally
regarded as sufficient for wastewater (8). However, jar tests were
conducted at various flocculation times to verify this design
condition.
Jar tests were accomplished using a six paddle, variable speed
stirring apparatus^ and one liter wastewater samples. During jar
tests on the effect of lime dosage, each sample was mixed for one
minute at 100 rpm> flocculated for 15 minutes at 30 rpm and allowed
to settle for 30 minutes. After settling, a sample of the supernatant
was withdrawn for analysis of total phosphorus content and pH. This
procedure was repeated for three wastewaters of low to medium
alkalinity typical of Amherst. The results are shown in Figures 3
and 4.
Figure 3 indicates that lime concentrations between 300 and
400 mg/1 as CaO will reduce total phosphorus levels below 1.0 mg/1
as P for all alkalinities tested. As a conservative estimate, a
1Phipps and Bird Incorporated, Richmond, Virginia.

ooO
(OO
o
a:i-zLUOzooUJ
600
500 h
400 h-
TREATMENTa .^^ OBJECTIVE
I I I
ALKALINITY (mg/ l osCaC03)
210145110
2 300 I-
2001-
100 I-
2 3 4 5 6TOTAL PHOSPHORUS ( m g / l a s P )
Figure 3. Total Phosphorus Concentration vs. Lime Dosage.
8

-10-
lime dosage of 380 mg/1 as CaO should provide consistent phosphorus
removals below 1.0 mg/1 as P. This is in agreement with a previous
study by Bowen (24) using Amherst wastewater. A high dosage
requirement is characteristic of low alkalinity wastewaters where
greater quantities of lime are needed to form enough calcium carbonate
precipitate to produce a good-settling floe.
The pH of jar test samples with less than 1.0 mg/1 total
phosphorus concentration can be expected to remain in a narrow range
between 11,0 and 12.0, as shown in Figure 4. Consequently, pH can
be an effective measure of phosphorus removal and lime dosing can
be paced by a pH control system. This fact should simplify process
control and operation of a lime clarification system.
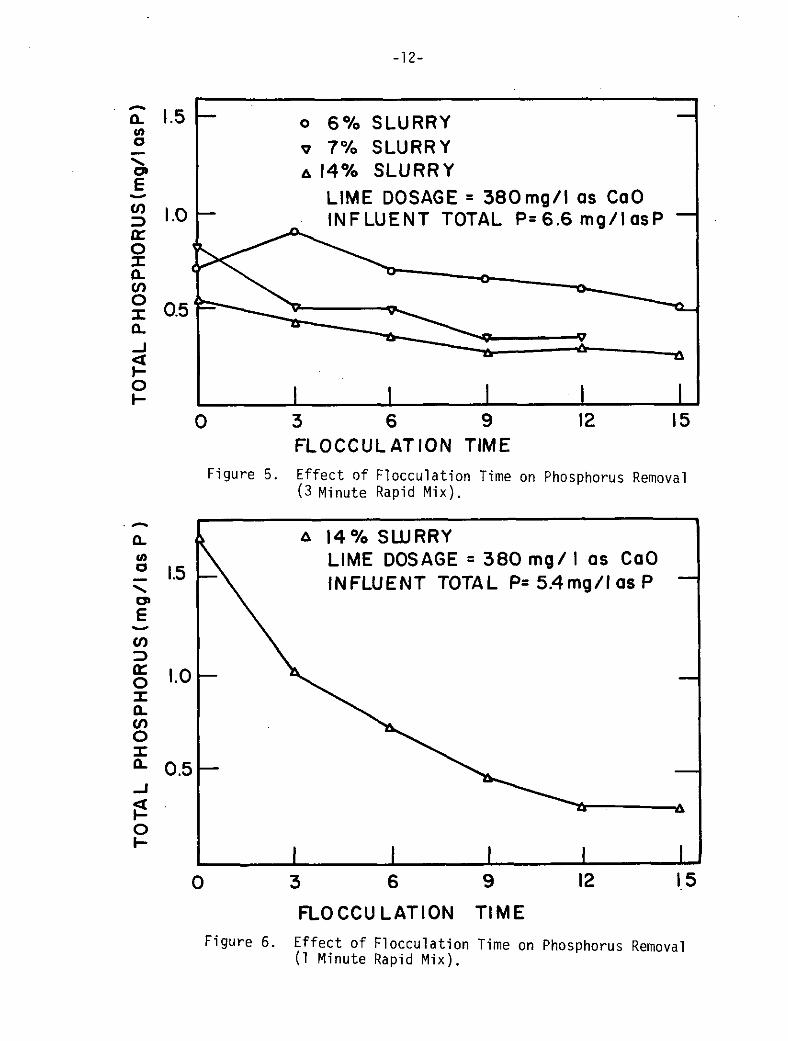
Jar tests conducted using a rapid mix time of 3 minutes, a
settling time of 30 minutes and various lime slurry concentrations
revealed that flocculation time had little effect on phosphorus removal
(see Figure 5). However, further testing at a reduced rapid mix time
of one minute and 14 percent slurry showed phosphorus removal to be
significantly affected by flocculation time (see Figure 6). As a
result, it appears that rapid mix time is as important as flocculation
time in obtaining maximum phosphorus removal. A short rapid mix time
may ineffectively disperse the lime slurry and longer flocculation
times will be needed to obtain proper mixing. Increasing the rapid
mix time results in better dispersion and maximum phosphorus removal
is attainable at lower flocculation times. This finding suggests that

-11-
ALKALINITY (mg/l as CaC03)
TREATMENT OBJECTIVE
Figure 4. Total Phosphorus Concentration vs. pH
-12-
Q.(Oo
oȣ
.5 6% SLURRY7% SLURRY
14% SLURRYLIME DOSAGE = 380mg/l as CaOINFLUENT TOTAL P= 6.6 mg/l asP
Figure 5.
3 6 9 1 2 1 5FLOCCULATION TIME
Effect of Flocculation Time on Phosphorus Removal(3 Minute Rapid Mix).
14% SLURRYLIME DOSAGE = 380 mg/ I as CaOINFLUENT TOTAL P=5.4mg/lasP
3 6 9
FLOCCULATION TIME
Figure 6. Effect of Flocculation Time on Phosphorus Removal(1 Minute Rapid Mix).

-13-
savings can be realized if the process design includes a rapid mix
reactor capable of providing at least three minutes detention rather
than building larger flocculation basins to make up for a lack of
mixing in the rapid mix phase.
Alternatively, lower slurry concentrations such as the six
percent slurry recommended in the EPA Process Design Manual for
Phosphorus Removal (3) may not require as'much rapid mixing as the
higher slurry concentrations. The difference in rapid mix require-
ments between low and high slurry concentrations was not investi-
gated because it would result in only minor differences in reactor
sizing. Overdesigning the rapid mix reactor to provide five minutes
detention time would assure dispersal of lime slurry at a minor
increase in capital cost. However, more concern for the adequacy
of flocculation basin design could result in some savings and a
better effluent quality. Although jar tests did not show a strong
relationship between phosphorus removal and flocculation time (at a
rapid mix time of three minutes), it was decided that pilot plant
studies should be conducted at different flocculation times in an
attempt to verify jar test results under more realistic conditions.

-14-
PILOT PLANT STUDIES
Pilot plant studies were divided into two phases. Phase I was an
extension of the jar test study in which the effect of flocculation time
on the treatment effectiveness of the chemical clarification process
was examined: The Phase II study was conducted using the optimum
flocculation time determined from Phase I. Lasting for a period of 35
days, the Phase II study provided a basis for determining the reliabil-
ity and performance of the clarification process using lime. In
addition, this extended study permitted measurement of sludge
characteristics and accumulation rate.
Phase I: The Effect of Flocculation Time
The Phase I pilot plant study was conducted in the summer of 1973
by Sweeney (9). Using many of the same pilot scale units described in
the Phase II study, Sweeney evaluated flocculation times of 4.4, 7.5,
and 17 minutes. During these tests, a 14 percent slurry of Ca(OH)?
was fed into a rapid mix tank and mixed with raw wastewater for a
period of three minutes. The lime slurry feed was adjusted to provide
a concentration of 380 mg/1 as CaO. After rapid mix and flocculation,
the treated wastewater was allowed to settle in the clarifier for
approximately 3.5 hours.' Each flocculation time was evaluated over a
period of three days of continuous operation. A total of 15 influent
and effluent grab samples were taken. These samples were analyzed for
pH, turbidity, suspended solids, total phosphorus and total dissolved
organic carbon (TOC),
The results of their study appears in Table I. Mean influent,
effluent and percent removal values are shown along with the effluent

Parameter
-15-
TABLE 1
TREATMENT EFFICIENCY VS. FLOCCULATION TIME (9)
Flocculation Time (Min)
4.4 7.5 17.0
Turbidity (UTU)
Suspended Solids(mg/1)
Total Phosphorus(mg/1)
Total OrganicCarbon (dissolved)
(mg/1)
PH
mean Influentmean effluentmean % removaleffluent stand. dev.
mean influentmean effluentmean % removaleffluent stand. dev.
mean influentmean effluentmean % removaleffluent stand. dev.
mean influentmean effluentmean % removaleffluent stand. dev.
mean influentmean effluenteffluent stand. dev.
693056
8.3
147
53
64
28.0
6.20
1.25
80
0.44
40
34
15
3.9
7.3
11.6
0.08
57
13
77
6.1
155
51
67
34.0
6.40
.77
88
0.20
42
30
28
5.7
7.2
11.6
0.07
62
6
90
1.9
124
13
89
6.3
6.00
.57
91
0.19
44
29
34
5.2
7.1
12.0
0.09

-16-
standard deviation. All parameters displayed a decrease in concentra-
tion as flocculation increased except for pH which remained relatively
constant between 11.6 and 12.0. At the optimum flocculation time of
17 minutes, the effluent turbidity, suspended solids, total phosphorus
and total dissolved organic carbon (TOC) concentrations were 6 JTU,
13 mg/1, 0.57 mg/1 as P, and 29 mg/1 respectively,
Interpretation of the data in Table I can be simplified by
comparing the various parameters on the basis of percent removal
rather than effluent concentrations produced. In this way, differences
in influent concentration are taken into account. Figure 7 graphically
shows the effect of flocculation time on the removal efficiencies.
It is to be noted that the percent removals of all parameters are
greatest at a flocculation time of 17 minutes. Figure 7 also shows
that the greatest increase in phosphorus, turbidity and TOC removal
efficiency occurred when flocculation time was increased from 4.4 to
7.5 minutes. For example, phosphorus removal "increased from 80 to 88
percent between the 4.4 and 7.5 minute flocculation time while
additional flocculation up to 17 minutes only increased the removal
efficiency to 91 percent - an increase of only three percent. Con-
sequently, it appears that if phosphorus removal is the primary
concern of the clarification process, a flocculation time of approxi-
mately eight minutes would be adequate. However, if downstream pro-
cesses such as carbon adsorption and nitrification are to be included
in the treatment system, longer flocculation times may be justified
for removal of suspended solids. As shown in Figure 7, the percent
removal of suspended solids increased almost linearly as the floccu-

100
80
60
i n i rTOTAL PHOSPHORUS
SUSPENDED SOLIDS
LUcr
40
20DISSOLVED TOC
I I I I
14 16: 4 6 8 10 12
FLOCCULATION TIME (MINUTES)
Figure 7. Effect of Flocculation Time on Removal Efficiency of Pilot Plant.
18 20

-18-
lation time increased. A maximum removal of 80 percent was obtained at
a flocculation time of 17 minutes. Higher suspended solids removals
at the longer flocculation times were probably due to a greater
opportunity for particle contact and aggregation.
The apparent discrepancy between jar test results, which showed
no appreciable difference in effluent quality as a result of increasing
flocculation time (using a rapid mix time of 3 minutes), and the pilot
plant studies, could be due to a number of factors. In a pilot plant
system, hydraulic short circuiting, reactor geometry, and diurnal variation
in influent strength could have an overriding effect on the distribu-
tion and mixing of lime. Thus, more reactor time would be needed to
compensate for this lack of mixing. Full-scale plants could be sub-
ject to even greater hydraulic variations which may justify conserva-
tive flocculation basin design.
Phase II. Pilot Plant Performance at Optimum Flocculation Time
Because the primary objective of this study was to demonstrate
the treatment potential of the lime clarification process, it was
decided that the Phase II studies should be conducted at a flocculation
time which would insure an excellent overall removal of all wastewater
pollutants. Alternatively, selection of an optimum flocculation time
could be based on phosphorus removal only. Based on overall removal
efficiency, the previous Phase I study indicated that longer floccula-
tion periods produced a better quality effluent. Maximum removals for
all parameters tested were obtained at a flocculation time of 17
minutes. However, in the Phase II study, a 16 minute rather than a 17
minute flocculation period was used because it facilitated flowrate
control in the pilot plant system.. The difference in treatment

-19-
efficiency between 16 and 17 minutes of flocculation, is considered
minimal.
A schematic diagram of the pilot plant facility used during the
Phase II study is shown in Figure 8. The degritted and comminuted
wastewater was received from the neighboring Amherst Sewage Treatment
Plant and pumped over a Bauer Hydrasieve . The hydrasieve removed
larger flotable solids which would otherwise cause blockages in the
small conduits of the pilot plant while it allowed raw wastewater to
pass. Cleaning the hyrasieve was accomplished twice daily by rinsing
with a water hose.
Raw wastewater from the hydrasieve was directed to a weirbox where
the flowrate was controlled at four gallons per minute. The waste-
water then entered the rapid mix tank where it was mixed with lime. A
six percent slurry (0.5 Ibs Ca(OH)2 per gallon) was used as recommended
in the EPA Process Design Manual for Phosphorus Removal (3). By
adjusting the slurry feedrate, a concentration of 380 mg/1 as CaO
was maintained in the wastewater. The lime used was 95 percent pure
hydrated lime (Ca(OH)2).
From the rapid mix tank the lime and wastewater mixture was
flocculated for 16 minutes in two, in-series basins. Effluent from the
basins flowed into a 900 gallon circular clarifier which provided a 3.75
hour detention time. The clarifier was equipped with a rim inlet
chamber and a center weir overflow. The cone shaped clarifier bottom
contained a shaft mounted sludge scraper and a plexiglass window to
monitor sludge accumulation. A more detailed listing of the pilot plant
The Bauer Bros. Co., a subsidiary of Combustion Engineering,Springfield, Ohio.

LIME SLURRYTANK
DEGR1TTEDHYDRASIEVE
ANDCOMMINUTEDWASTEWATER FLOCCULATORS
EFFLUENT
RAPIDMIX
LARGE SOLIDSSLUDGE
PROCESS EVALUATIONS
RECARBONATIONMULTI-MEDIAFILTRATION
rooi
PROCESS EVALUATIONS
•GRAVITY THICKENING• VACUUM FILTRATION•CENTRIFUGATION•LIME RECOVERY
Figure 8. Schematic Diagram of Pilot Plant,

-21-
dlmensions and design parameters are shown in Table 2. Calculations
of the mean velocity gradients (G) for both the flocculation basins
and rapid mix tank are shown in Appendix II.
Effluent from the clarifier was not subjected to further treatment.
However, the degree of recarbonation required and probable quality of
effluent as a result of multi-media filtration were evaluated by labora-
tory tests. Recarbonation requirements were evaluated for both single
and two-stage systems according to the method presented by Gulp and
Culp (2). Multi-media filtration was simulated by filtering a
clarified sample through a Whatman #2 filter paper prior to analysis.
Past experience has shown that the quality of the filtrate will be
about the same as that achieved with a multi-media filter (8).
During the Phase II study, accumulated sludge in the clarifier
was wasted and measured daily. The sludge level was readily observable
through a plexiglass window. In order to obtain a uniform sample,
sludge was wasted into an adjacent tank and manually stirred. Samples
of the clarifier sludge were then collected and preserved for later
thickening, vacuum filtration, centrifugation and lime recovery
evaluations. These sludge dewatering processes will be discussed in
the next section.
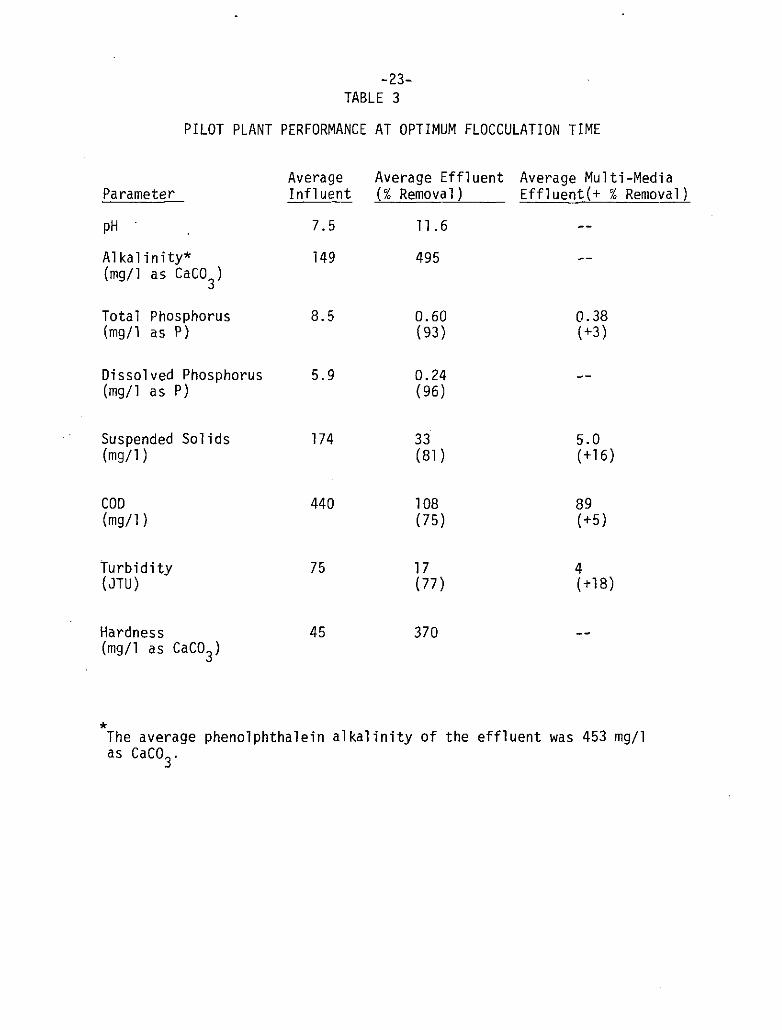
The results of the 35 day, Phase II pilot plant study are shown in
Table 3. During this study grab samples of the raw wastewater influent,
and clarifier effluent were taken at 9 AM, 10 AM 11 AM, 1 PM, 2 PM.
3 PM and composited. Analytical techniques and procedures are discussed
in Appendix I.
Throughout the 35 day study, excellent removals of phosphorus,

-22-
TABLE 2 .
PILOT PLANT DIMENSIONS AND DESIGN PARAMETERS
Rapid Mix Tank
Capacity
Detention Time
Mean Velocity Gradient (G)
Flocculation Basin
Number of Basins
Dimensions
Vol ume
Detention Time (2 basins)
Paddle Area
Flocculation rpm
Mean Velocity Gradient (G)
Clarifier
Diameter
Volume
Detention Time (@ 4 gpm)
Overflow rate (@4 gpm)
Weir loading (@ 4 gpm)
20 gal.
5 min.
463 sec-1
3.66 ft x 1.25 ft x1.0 ft
32 gal.
16 min.
0.444 ft2
30
73 sec-1
5.5 ft.
900 gal.
3.75 hours
242 gpd/ft2
1834 gpd/ft
-23-TABLE 3
PILOT PLANT PERFORMANCE AT OPTIMUM FLOCCULATION TIME
Average Average Effluent Average Multi-MediaParameter Influent (% Removal) Effluent(+ % Removal)
pH
Alkalinity*(mg/1 as CaCO )
*J
Total Phosphorus(mg/1 as P)
Dissolved Phosphorus(mg/1 as P)
Suspended Solids(mg/1)
COD(mg/1)
turbidity(JTU)
Hardness 45 370(mg/1 as CaCO )
O
*The average phenolphthalein alkalinity of the effluent was 453 mg/1as CaC03-
7.5
149
8.5
5.9
174
440
75
11.6
495
0.60(93)
0.24(96)
33(81)
108(75)
17(77)
—'-
0.38(+3)
—
5.0(+16)
89(+5)
4(+18)

-24-
suspended solids, chemical oxygen demand (COD), and turbidity were
obtained. Total and dissolved phosphorus concentrations were
effectively removed below 1.0 mg/1 as P during the entire experiment.
With an average influent phosphorus concentration of 8.5 mg/1 as P and
an effluent concentration of 0.6 mg/1 as P, the mean percent removal of
phosphorus was 93 percent. An additional three percent removal could
be obtained by multi-media filtration. Daily variations in influent
and effluent total phosphorus concentrations are shown in Figure 9.
Effluent phosphorus concentrations remained low despite large variations
in influent values.
Influent suspended solids were reduced by 81 percent as a result
of the lime clarification process. Another 16 percent reduction is
predicted by multi-media filtration thereby producing a final effluent
containing only 5.0 mg/1 suspended solids. Herein lies the value of
multi-media filtration in preventing solids build-up in subsequent
treatment steps such as carbon contactors.
Like suspended solids, a large fraction of turbidity (18 percent)
can be removed by multi-media filtration. Clarification alone removed
another 77 percent for a total removal of 95 percent. The effluent
turbidity after both clarification and filtration processes was
only 5 JTU.
COD removals were not greatly improved by simulated multi-media
filtration (5.0 percent). However, chemical clarification alone removed
75 percent leaving 108 mg/1 in the effluent. Because secondary treat-
ment standards are usually stated in terms of biochemical oxygen
demand (BOD), and not COD, it is not possible in this case to clearly

COo
o>E
enIDo:O
oa.
i-o
10
8
0
INFLUENTEFFLUENT (CLARIFIER)EFFLUENT { MULTI-MEDIA
FILTER)
10 30 35
rotni
15 20 25TIME ( DAYS)
Figure 9. Influent and Effluent Phosphorus Concentrations During Phase II Study.
40

-26-
establish whether chemical clarification alone would meet secondary
standards. In most cases, further treatment (e.g. by carbon
adsorption or activated sludge) would be necessary to consistently
remove an additional fraction, of dissolved organics.
Due to the high pH and hardness of the effluent, recarbonation
will be necessary. Calculations shown in Appendix III indicate that
a total of approximately 1830 Ibs/MG of C02 will be necessary for a
two-stage recarbonation system. For single-stage recarbonation
where lime recovery is not planned approximately 3350 Ibs/MG of CO?
will be required. More carbon dioxide is needed in single-stage
recarbonation because the calcium carbonate precipitate is not removed
and must therefore be converted to soluble calcium bicarbonate.
Potential sources of CO? gas include stack gas from a lime reclaiming
or sludge incineration furnace, commercial liquid carbon dioxide and
natural gas.
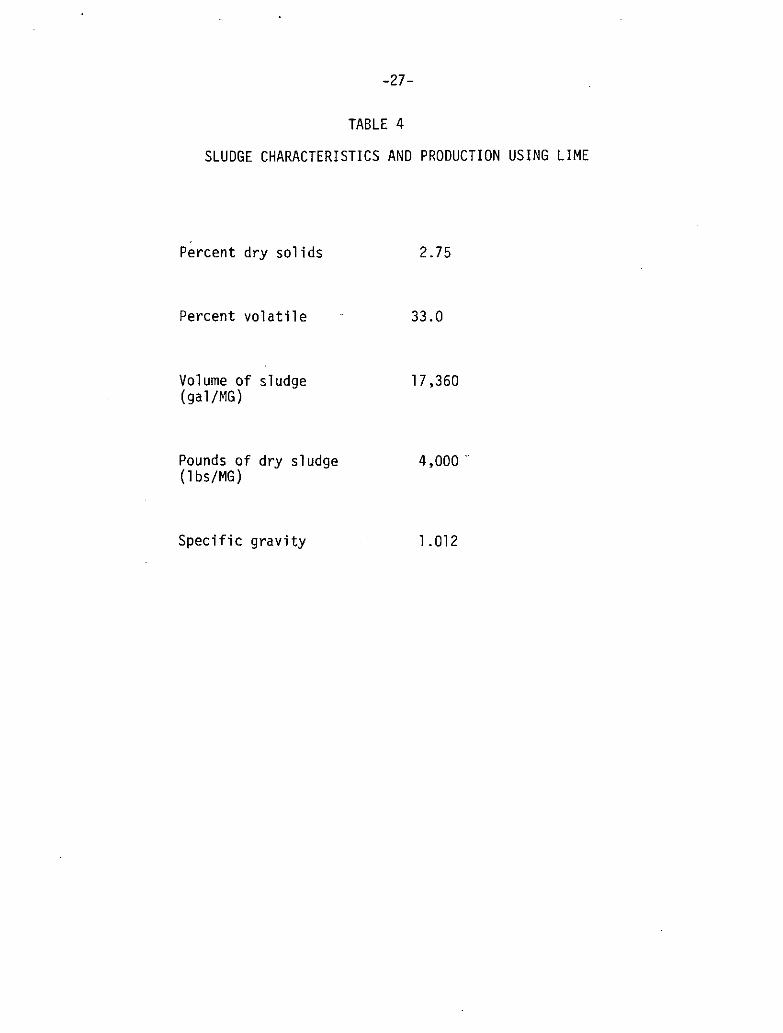
Lime sludge characteristics and accumulation rates are shown in
Table 4. Four thousand pounds per million gallons (4,000 Ibs/MG) of
lime sludge were produced during the pilot plant study. This figure
is in close agreement with estimates of sludge quantities calculated
from precipitation reactions and suspended solids removal. These
calculations are shown in Appendix IV. Higher sludge accumulation
rates would occur if two-stage recarbonation were included in the pro-
cess because of the additional calcium carbonate precipitate produced.
The lime sludge did not have an offensive odor and could be stored
indefinitely at 4°C.
-27-
TABLE 4
SLUDGE CHARACTERISTICS AND PRODUCTION USING LIME
Percent dry solids 2.75
Percent volatile 33.0
Volume of sludge 17,360(gal/MG)
Pounds of dry sludge 4,000(Ibs/MG)
Specific gravity 1.012

-28-
Operational problems encountered during the 35 day lime study
included:
1) Buildup of CaCO^ precipitate on the rapid mix propeller
and shaft. Air agitation instead of mechanical mixing
would probably solve this problem.
2) Scaling of both flocculators and the clarifier with 1/50
inch of CaCCL precipitate.
3) Occasional clogging of slurry feed line.

-29-
SLUDGE DEWATERABILITY
One of the most important aspects of wastewater treatment is
sludge dewatering and disposal. In addition, recovery and reuse
ofavailable lime is also a necessary consideration. As part of
this study, gravity thickening, vacuum filtration, centrifugation
and recalcination processes were evaluated.
Thickening
Sludge that is not thick enough for efficient and economical
dewatering by processes such as vacuum filtration and centrifugation
requires a "thickening" step. Such is the case with the lime sludge
produced during the Phase II study which averaged only 2.75 percent
dry solids. The aim of lime sludge thickening is to increase the
concentration of dry solids to a more workable range of four to ten
percent while greatly reducing sludge volume.
In this study, the gravity thickening process was evaluated
according to the graphical method of Talmage and Fitch (10). Five
gallon samples of clarifier sludge were placed in 5.5 inch diameter
plexiglass columns (filled to a water column height of 4 ft) and the
position of the sludge interface was recorded over a 24 hour period.
No stirring devices were used. A plot of sludge interface versus time
resulted in the settling curves shown in Appendix V.
From each settling curve, representing a given feed solids con-
centration, solids loading rates to the thickener were calculated for
achieving various underflow solids concentrations according to the

-30-
method outlined in Appendix V. This procedure resulted in the
relationship shown in Figure 10 where thickener solids loading rates
versus underflow solids concentration are plotted for each feed
solids concentration investigated. A more generalized form of this
relationship is given by the thickener design curves shown in
Figure 11. Here, thickener solids loading rates can be determined for
a variety of feed and thickener underflow concentrations. For example,
if the average feed solids concentration is 3 percent the thickening
process can be expected to produce a sludge of 6 to 9 percent solids.
Solids loading rates should range between 9 and 17 lbs/day-ft2.
Burns and Shell (11) reported similar results in their study where
a 3 percent lime sludge was thickened to 8 percent solids using a9
solids loading rate of 11.2 lbs/day-ft .
The quality of the thickener supernatant is shown in Table 5.
Alkalinity, pH, suspended solids, turbidity and hardness were approxi-
mately equivalent in concentration to the clarification process
effluent (refer to Table 3), However, total phosphorus and COD con-
centrations increased to values characteristic of the untreated waste-
water. Because suspended solids concentrations w^re low, it seems that
these high COD and phosphorus levels were due to the dissolved fraction.
The presence of dissolved COD and phosphorus could result from the
break-up of floe aggregates during settling and compression which would
release enmeshed colloidal particles to the supernatant. However,
return of this supernatant to the plant influent should not affect
COD and phosphorus removals because of the relatively small volume

•31-
a•o
e>
COoIDoCO
a:LUzLU
a
100
90
80
70
60
50
40
30
20
10
5.3 % FEED SOLIDSCONCENTRATION
3.5%
2.6% 137%
1 I I
5.3 %2.6 %3.7 %3.5 %I . I %
I0 2 4 6 8 10 12
THICKENER UNDERFLOW SOUDS % BY WEIGHTFigure 10. Lime Sludge Thickening Curves.

-32-
CJ
i>-o
COO
I]Ocn
crUJ2:UJ^axH
100
90
80
70
60
50<
Q
40
30
20
10
THICKENER UNDERFLOWSOLIDS, % BY WEIGHT 6%
7%
I I0 1 2 3 4 5 6
FEED SOLIDS CONCENTRATION, % BY WEIGHT
Figure 11. Thickener Design Curves.

-33-
TABLE 5
THICKENER SUPERNATANT
ThickenerParameter Supernatant
pH ' 11-7
Alakalinity (phenolphthalein) 429(mg/1 as CaC03)
Alkalinity (total) . 493(mg/1 as CaC03)
Suspended Solids 24
COD (mg/1) 374
Turbidity (JTU) 18
Total Phosphorus . 8.4(mg/1 as P)
Hardness 438(mg/1 as CaC03)
1Average of 8 determinations
-34-
produced; of the 100 gallons of sludge wasted daily from the pilot
plant, approximately 50 gallons or 0.8 percent of the total plant flow,
would return as supernatant.
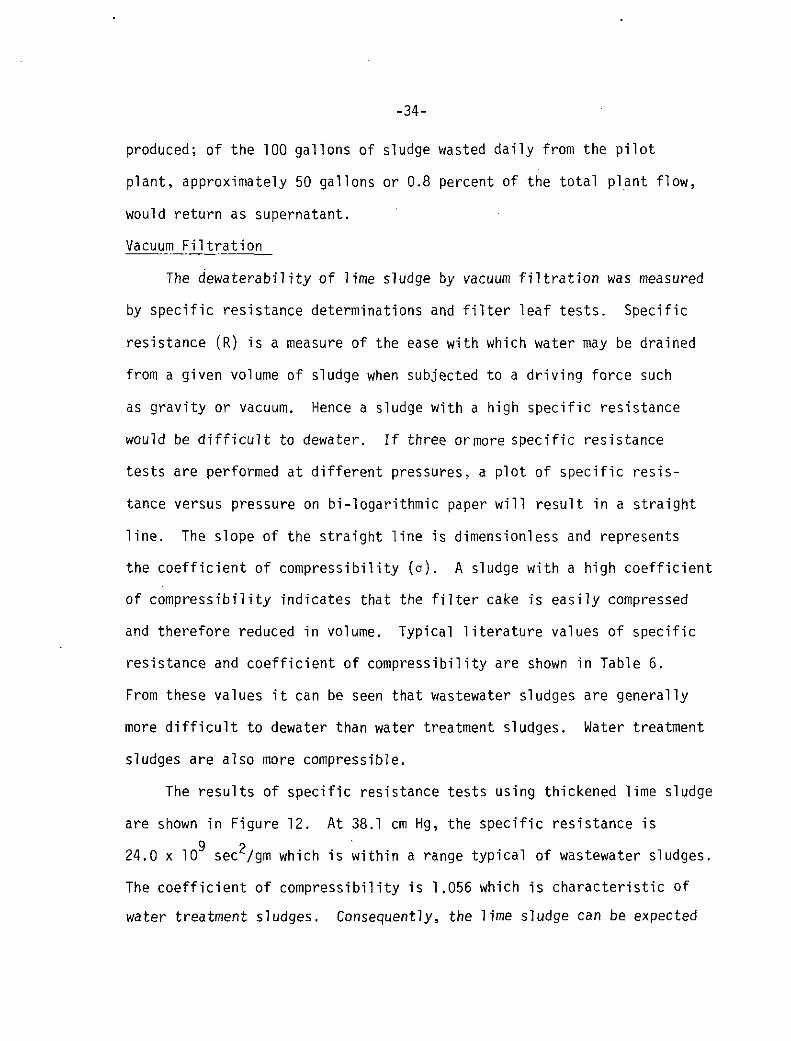
Vacuum Filtration
The dewaterability of lime sludge by vacuum filtration was measured
by specific resistance determinations and filter leaf tests. Specific
resistance (R) is a measure of the ease with which water may be drained
from a given volume of sludge when subjected to a driving force such
as gravity or vacuum. Hence a sludge with a high specific resistance
would be difficult to dewater. If three ormore specific resistance
tests are performed at different pressures, a plot of specific resis-
tance versus pressure on bi-logarithmic paper will result in a straight
line. The slope of the straight line is dimensionless and represents
the coefficient of compressibility (a). A sludge with a high coefficient
of compressibility indicates that the filter cake is easily compressed
and therefore reduced in volume. Typical literature values of specific
resistance and coefficient of compressibility are shown in Table 6.
From these values it can be seen that wastewater sludges are generally
more difficult to dewater than water treatment sludges. Water treatment
sludges are also more compressible.
The results of specific resistance tests using thickened lime sludge
are shown in Figure 12. At 38.1 cm Hg, the specific resistance is9 ?24.0 x 10 secVgm which is within a range typical of wastewater sludges.
The coefficient of compressibility is 1.056 which is characteristic of
water treatment sludges. Consequently, the lime sludge can be expected

-35-
TABLE 6
TYPICAL SPECIFIC-RESISTANCE AND COEFFICIENT OF COMPRESSIBILITY
VALUES FOR VARIOUS SLUDGES
Specific Resistance @ Coefficient ofSludge 38.1 cm Hg(sec2/gm) Compressibility
Primary Wastewater (13)
Digested Wastewater (12)
Water Treatment (12)
15
14
1
- 50 x 109
- 70 x 109
- 10 x 109
0.51
0.8
- 0.74
- 1.3

-36-
0.0
Eo>
CMOUJen
ooxcr
LUo
IV)
enUJcrou.uUJ0.en
50
4.0
3.0
2.0
.0
.5
.4
3
2
SOLIDS CONTENT = 6 . 6 %COEFFICIENT OF COMPRESSIBILITY
- '-056
= 3.0
I I I I I I i I I I 1 I5 10 20 40 60 80 100
PRESSURE ( AP) , cm Hg
Figure 12. Specific Resistance and Coefficient of Compressibility for Lime Sludge.

-37-
to display dewatering characteristics similar to both types of sludge
i.e. moderately difficult to dewater but easy to compress. The method
used for determining both specific resistance and coefficient of
compressibility is described in a report by Adrian et al. (12).
Although vacuum filter yield rates can be determined from specific
resistance measurements, filter leaf tests provide a more realistic
method of specifying operational characteristics of the vacuum filter.
Not only are test results more accurate with respect to yield rate*
cake moisture and filtrate clarity but they offer a visual demonstration
of cake texture, cracking and dischargeability from the filter medium.
The filter leaf tests discussed in this report were performed at the
UMASS Wastewater Pilot Plant facility using equipment and procedures
of the Komline-Sanderson Company.
A twill cloth (#C-528) with a porosity of 20 CFM was chosen as
the filter medium. Three other cloths were tried (#C-509, C-525,
C-2022) with varying degrees of success. Overall, the nylon twill
cloth produced the most easily discharged cake and a filtrate of
acceptable clarity. Based upon preliminary experiments, a vacuum of
20 in Hg and 37,5 percent submergence was used in all tests. Five
thickened sludges ranging from 5.2 to 10 percent solids concentration
were evaluated. Selection of the optimum yield rate for each sludge
was based on the maximum drum speed which produced an acceptable cake
discharge. No conditioning chemicals were used during any of these
tests.
Komline-Sanderson Engineering Corporation, Peapack, New Jersey.
-38-
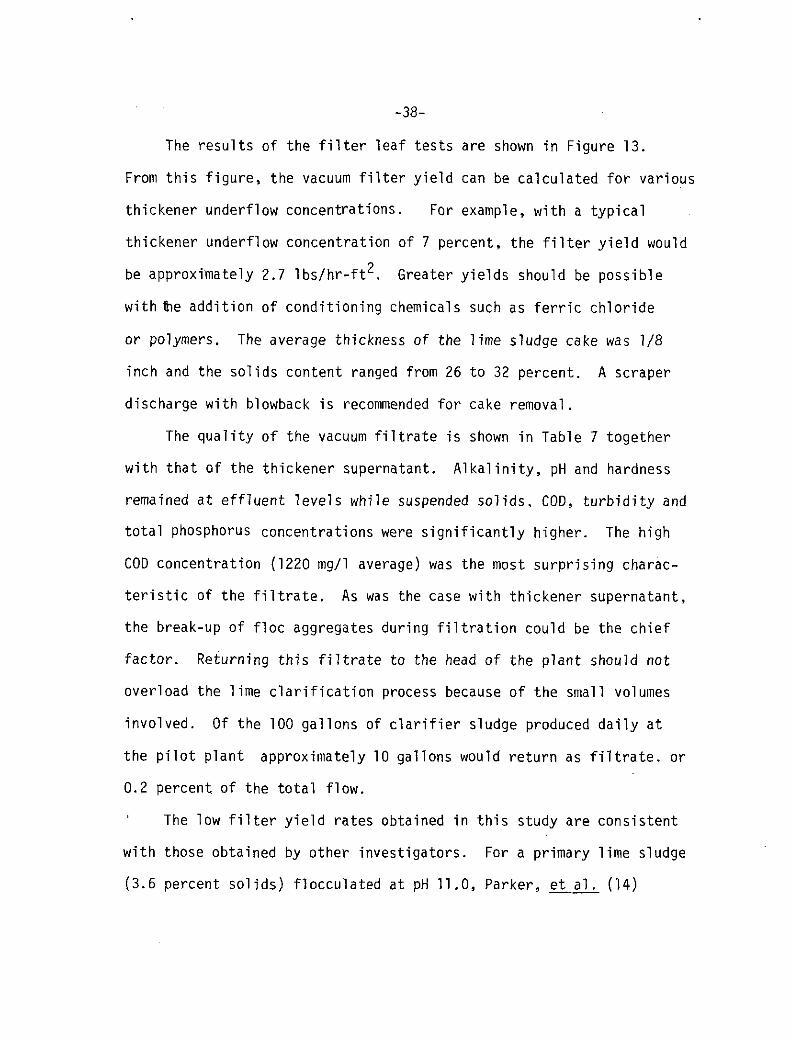
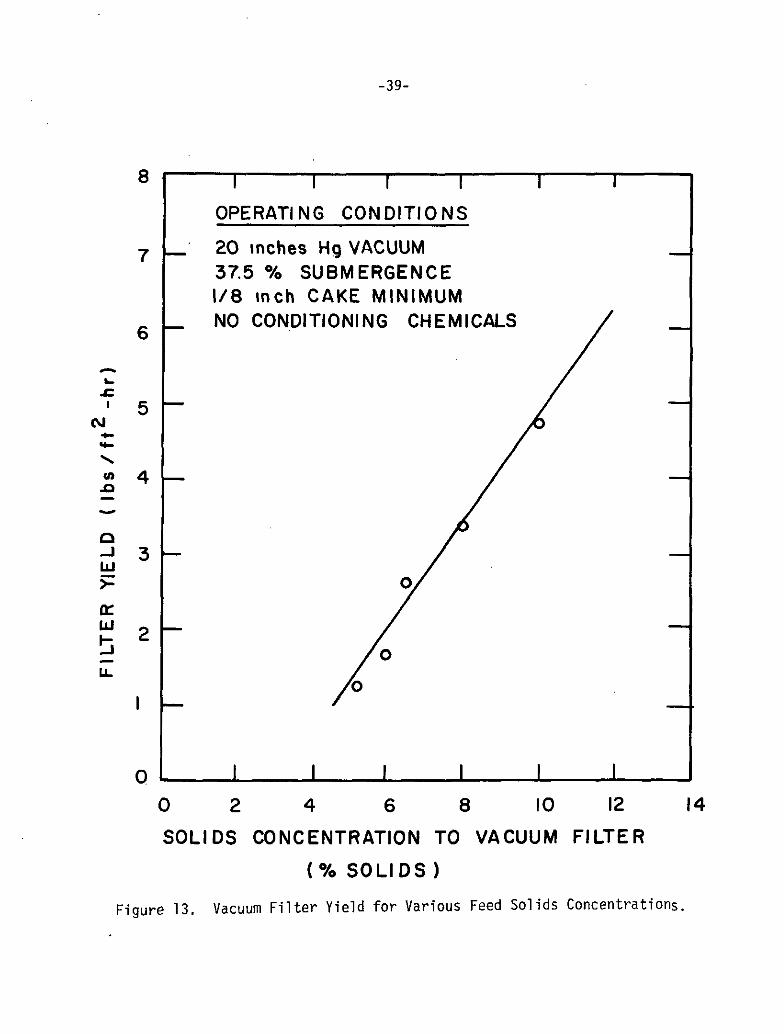
The results of the filter leaf tests are shown in Figure 13.
From this figure, the vacuum filter yield can be calculated for various
thickener underflow concentrations. For example, with a typical
thickener underflow concentration of 7 percent, the filter yield wouldp
be approximately 2.7 Ibs/hr-ft . Greater yields should be possible
with tie addition of conditioning chemicals such as ferric chloride
or polymers. The average thickness of the lime sludge cake was 1/8
inch and the solids content ranged from 26 to 32 percent. A scraper
discharge with blowback is recommended for cake removal.
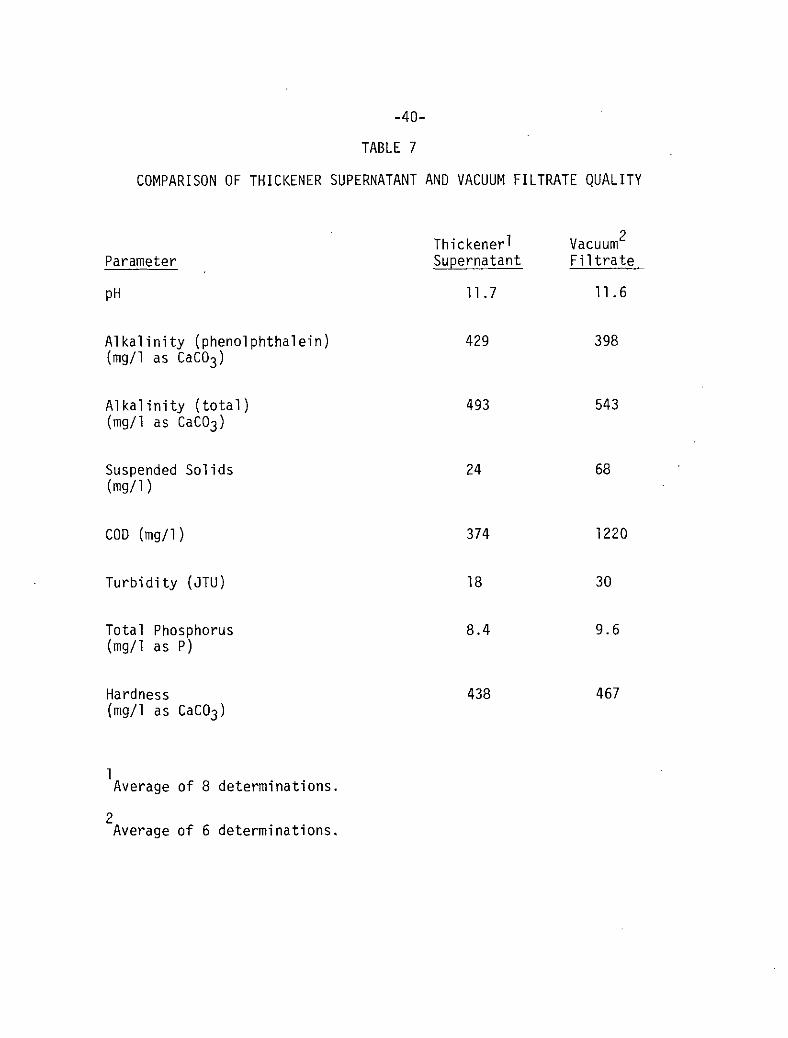
The quality of the vacuum filtrate is shown in Table 7 together
with that of the thickener supernatant. Alkalinity, pH and hardness
remained at effluent levels while suspended solids, COD, turbidity and
total phosphorus concentrations were significantly higher. The high
COD concentration (1220 mg/1 average) was the most surprising charac-
teristic of the filtrate. As was the case with thickener supernatant,
the break-up of floe aggregates during filtration could be the chief
factor. Returning this filtrate to the head of the plant should not
overload the lime clarification process because of the small volumes
involved. Of the 100 gallons of clarifier sludge produced daily at
the pilot plant approximately 10 gallons would return as filtrate, or
0.2 percent of the total flow.
The low filter yield rates obtained in this study are consistent
with those obtained by other investigators. For a primary lime sludge
(3.6 percent solids) flocculated at pH 11.0, Parker, et al. (14)
-39-
8
CM
to 4.a
a:UJ
0
I I I I
OPERATING CONDITIONS
20 inches Hg VACUUM37.5 % SUBMERGENCE1/8 inch CAKE MINIMUMNO CONDITIONING CHEMICALS
i 1 1 i
0 2 4 6 8 10 12
SOLIDS CONCENTRATION TO VACUUM FILTER
(% SOLIDS)
Figure 13. Vacuum Filter Yield for Various Feed Solids Concentrations.
14
-40-
TABLE 7
COMPARISON OF THICKENER SUPERNATANT AND VACUUM FILTRATE QUALITY
Thickener^ VacuumParameter Supernatant Filtrate
pH 11.7 11.6
Alkalinity (phenolphthalein) 429 398(mg/1 as CaC03)
Alkalinity (total) 493 543(mg/1 as CaC03)
Suspended Solids 24 68(mg/1)
COD (mg/1) 374 1220
Turbidity (JTU) 18 30
Total Phosphorus 8.4 9.6(mg/1 as P)
Hardness 438 467(mg/1 as CaC03)
1Average of 8 determinations.
2Average of 6 determinations.

-41-o
reported a filter yield rate of 1.5 Ibs/hr-ft . From the data
presented by Burns and Shell (11), a 7 percent sludge would produce
a 2.4 Ibs/hr-ft2 filtration rate. They also conducted tests with
anionic polyelectrolyte flocculation aid (Dow Chemical., AP-30) which
increased vacuum filter yields by 30 to 70 percent.
Centrifugation
Three gallons of thickened lime sludge were sent to Bird Machine
Company for preliminary centrifuge tests. From laboratory spin
tests they predicted that a production model machine would produce a
cake containing solids "in the 30 percent range". They also indicated
that a clear centrate may result without the use of chemical aids.
Lime recovery by "wet classification'' is also possible using a series
of two or three centrifuges. The letter reporting the results of the
centrifuge test is shown in Appendix V.
Recalcination and Lime Re-Use
If the lime sludge can be disposed of satisfactorily on land, then
this may be the most economical alternative. However, if this is not
the case, recovery and re-use of the lime fraction in the sludge may
be the cheapest arrangement. In this way sludge volumes would be
reduced and savings could be realized not only in disposal costs but
chemical costs as well.
Lime recovery or recalcination is a relatively simple process
consisting of incinerating the sludge at temperatures of about 1850 F.
Bird Machine Company. Incorporated. South Walpole, Massachusetts 02071.
-42-
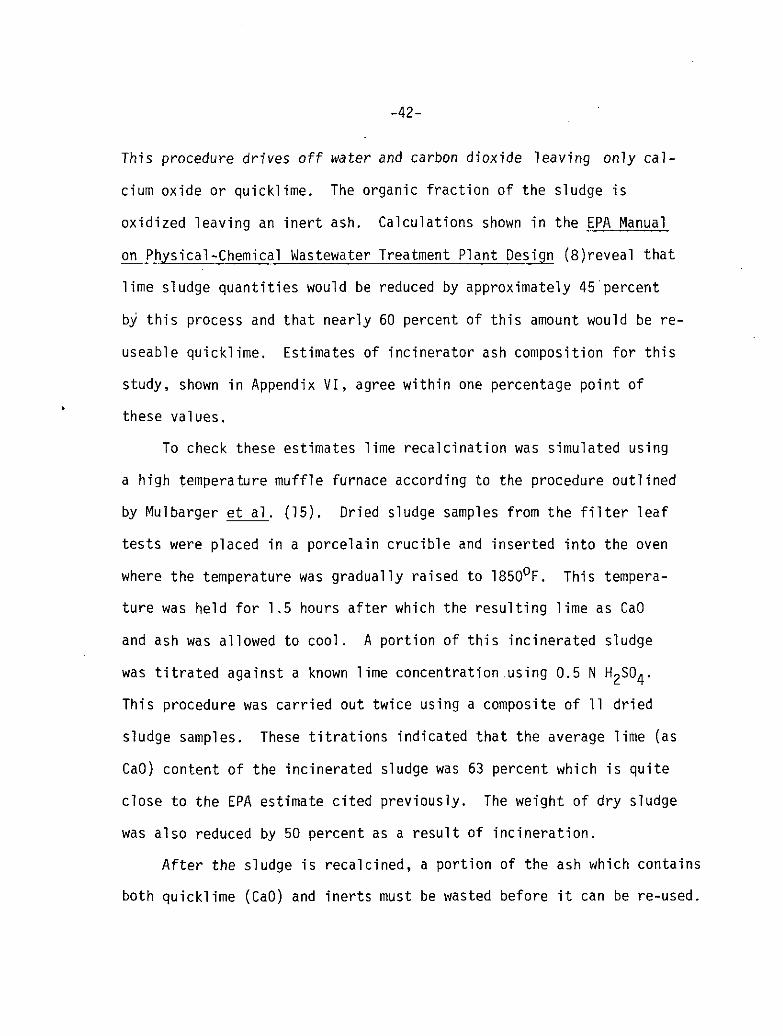
This procedure drives off water and carbon dioxide leaving only cal-
cium oxide or quicklime. The organic fraction of the sludge is
oxidized leaving an inert ash. Calculations shown in the EPA Manual
on Physical-Chemical Wastewater Treatment Plant Design (8}reveal that
lime sludge quantities would be reduced by approximately 45 percent
by this process and that nearly 60 percent of this amount would be re-
useable quicklime, Estimates of incinerator ash composition for this
study, shown in Appendix VI, agree within one percentage point of
these values.
To check these estimates lime recalcination was simulated using
a high temperature muffle furnace according to the procedure outlined
by Mulbarger et al. (15). Dried sludge samples from the filter leaf
tests were placed in a porcelain crucible and inserted into the oven
where the temperature was gradually raised to 1850°F. This tempera-
ture was held for 1.5 hours after which the resulting lime as CaO
and ash was allowed to cool. A portion of this incinerated sludge
was titrated against a known lime concentration.using 0.5 N H^SO*.
This procedure was carried out twice using a composite of 11 dried
sludge samples. These titrations indicated that the average lime (as
CaO) content of the incinerated sludge was 63 percent which is quite
close to the EPA estimate cited previously. The weight of dry sludge
was also reduced by 50 percent as a result of incineration.
After the sludge is recalcined, a portion of the ash which contains
both quicklime (CaO) and inerts must be wasted before it can be re-used.

-43-
Wasting is necessary to reduce the buildup of inerts due to recycling
into the clarification process. The actual wastage rate of percent
blowdown will depend on how fast inerts accumulate in the system.
Usually a 25 percent blowdown rate is assumed for theoretical
calculations (8).
With a 50 percent reduction in sludge weight due to recalcina'tion
and a lime (as CaO) content of 63 percent and 25 percent blowdown
rate, the lime available for re-use can be calculated as follows:
Dry sludge production = 4000 Ibs/MG
Recalcined sludge (50% reduction) = 2000 Ibs/MG
Available CaO (63% recalcined sludge) = 1260 Ibs/MG
Available CaO (after 25% blowdown) = 945 Ibs/MG
The lime used during clarification was 380 mg/1 as CaO or 3170 Ibs/MG.
If 945 Ibs/MG are recycled into the chemical clarification process,
2225lbs/MG of make-up lime will be required or 70 percent of the total
lime requirement. Clearly, the recalcination and re-use of lime in
this case would not be economically attractive. However, if the
effluent is recarbonated, substantial quantities of calcium carbonate
could be precipitated out and recalcined along with the clarification
process sludge. Calculations in Appendix VI show that an additional
1260 Ibs/MG of lime (as CaO) could be recovered which is equal to
the amount obtained from the clarification process. The total available
lime (as CaO) including recarbonation, is then 1890 Ibs/MG (assuming
25 percent blowdown of recarbonated sludge). Consequently, the make-

-44-
up lime requirement is now reduced to approximately 40 percent,
or 1280 Ibs/MG, Whether lime recovery and re-use would be economi-
cally justifiable in this case is not clear. Only an orderly
economic evaluation would provide the answer. The cost of lime
clarification including lime recovery is discussed in the section
entitled "Cost Comparison of Lime and Alum Chemical Clarification".

-45-
PERFORMANCE COMPARISON OF LIME AND ALUM CLARIFICATION
Prior to this study, a similar pilot plant investigation of
alum clarification was conducted. These results are summarized in
a report entitled "Pilot Plant Studies of Wastewater Chemical
Clarification Using Alum" (7), While the same pilot-scale units
were used in both studies, Amherst primary effluent was used during
the alum study rather than raw wastewater. Hence, a direct compar-
ison of alum and lime clarification is not possible. Because primary
effluent wasused in the alum study, it would be reasonable to expect
lower effluent turbidity, suspended solids and TOC concentrations
than in the lime study. However, phosphorus removals should not
be greatly affected because primary treatment does not remove
significant amounts of phosphorus.
A comparison of the mean effluent quality of alum and lime clari-
fication is shown in Table 8. The low pH and alkalinity of alum
treated effluent and the high pH and alkalinity due to lime treatment
is predictable considering the respective acidic and caustic character
of alum and lime. Because of the low pH produced by alum addition,
it was concluded that a pH control or monitor system would be required
On the other hand* because of the high pH produced by lime treatment
recarbonation is necessary. Excellent total and dissolved phosphorus
removals were achieved using both chemicals. Effluent phosphorus
concentrations were approximately equivalent using either alum or lime,
Turbidity and suspended solids concentration were slightly lower using
alum. However, this may be due to lesser concentrations of these

-46-
TABLE 8'
COMPARISON OF MEAN EFFLUENT QUALITY USING ALUM OR LIME*
Parameter Alum Lime
pH • 6.3 11.6
Alkalinity 35 495(mg/1 as CaC03)
Total Phosphorus 0.55 0.60(mg/1 as P)
Dissolved Phosphorus 0.27 0.24(mg/1 as P)
Turbidity 8 17(OTU)
Suspended Solids 8 33(mg/1)
*It should be noted that raw wastewater was used in the lime studywhereas primary effluent was used during the alum study.

-47-
parameters in primary effluent which reduces the loading on the alum
clarification process.
Not shown in Table 8 are organic removals obtained by each
process. A direct comparison was not possible because total organic
carbon (TOC)'was measured in the alum study and chemical oxygen demand
(COD) in the lime study. The TOC of the alum treated effluent was 36
mg/1 and the COD of the lime clarification effluent was 108 mg/1.
A comparison of alum and lime sludge characteristics is shown in
Table 9. Alum sludge characteristics were adjusted to reflect a raw
wastewater feed system. From this data it is evident that lime
clarification will produce more sludge than alum clarification both in
volume and dry solids. However the lime sludge was more dense than the
alum sludge and should dewater more easily. Also, the lime sludge had
very little odor and would remain in this stable condition for long
periods of time.
In conclusion, it would appear that on the basis of effluent
quality, either chemical would produce equivalent results. Both
chemicals also produced large quantities of sludge which must be
dewatered and ultimately disposed. The dewaterability of lime sludge
was investigated in this report and satisfactory results were obtained.
In contrast, no dewaterability tests were performed using alum sludge.
These tests will be conducted as part of another study. Other investi-
gators (11,16) have already demonstrated the dewaterability of alum
sludges with conventional equipment. Consequently, the primary
determinant in selecting either lime or alum clarification will depend
on costs, which are discussed in the next section.
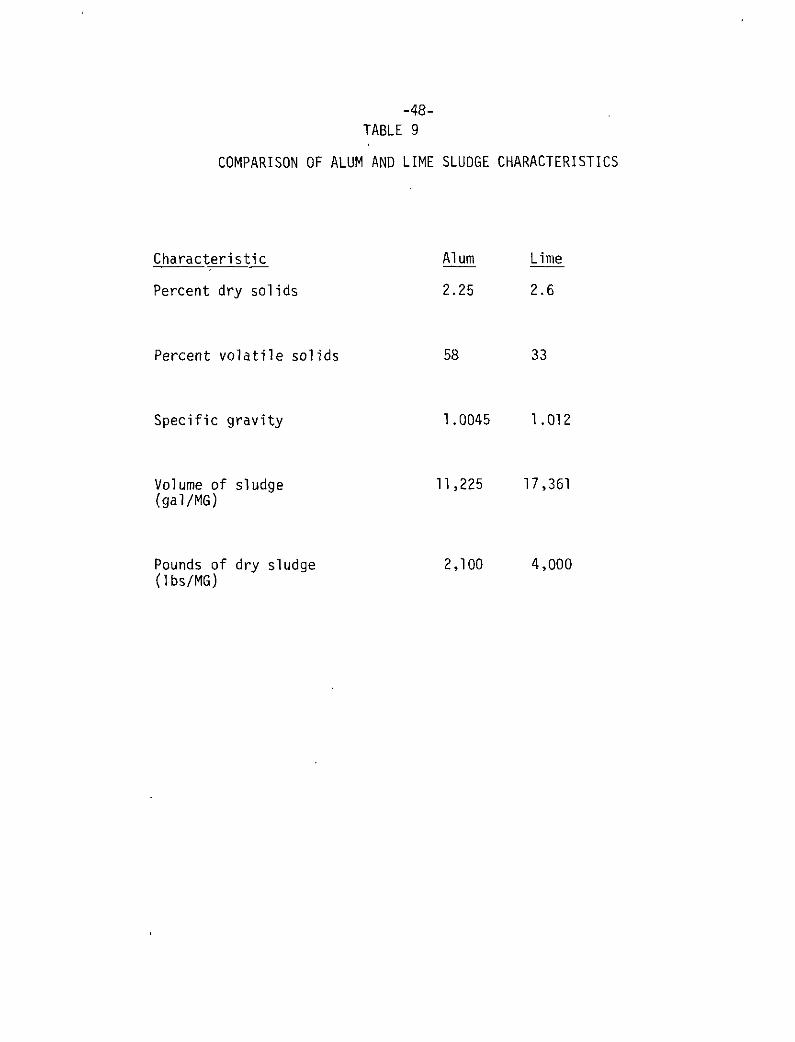
-48-TABLE 9
COMPARISON OF ALUM AND LIME SLUDGE CHARACTERISTICS
Characteristic Alum Lime
Percent dry solids 2.25 2.6
Percent volatile solids 58 33
Specific gravity 1.0045 1.012
Volume of sludge 11,225 17,361(gal/MG)
Pounds of dry sludge 2,100 4,000(Ibs/MG)

-49-
COST COMPARISON OF LIME AND ALUM CHEMICAL CLARIFICATION
One of the more uncertain areas concerning chemical clarifi-
cation of wastewater is the cost of the process. Accurate cost data
will notbe availableuntil many plants have been built and operated
for several years. Even cost estimates are often outdated and mis-
leading because of recent increases in fuel, electrical and chemical
costs. For example it is a common misconception that one of the main
advantages of using lime is that it costs less than other chemical
coagulants. However, the cost of fuel needed to convert limestone
to lime has increased dramatically over the last two years, causing
a threefold increase in lime costs. Consequently the economic
advantage of lower chemical cost has been largely eliminated and
lime recovery becomes more of a necessity.
Despite the lack of actual cost data from full-scale treatment
facilities, up-to-date cost estimates can be determined from a number
of publications (11,20,21,22,23). This cost information was used to
generate comparative cost data based on the treatment requirements
of Amherst wastewater and a flow of 10 MGD. These costs are conceptual
in nature and do not involve extensive investigation ofsite, construc-
tion or hydraulic details. Moreover, the cost comparison includes
only the chemical clarification and sludge handling portions of a
total treatment scheme.
All costs presented in this analysis were based on March 1975
price levels (ENR Construction Cost Index = 2200- EPA-STP Index
(Boston) = 240). Capital costs were ammortized at 7 percent for 20

-50-
years. Operation and maintenance costs were based on a 10 MGD design
capacity, an alum cost of $80/ton, and a lime cost of $60/ton as
Ca(OH)2.
The costs of a chemical clarification treatment scheme using alum
is shown in Table 10. The processes included were preliminary treat-
ment (bar screens and comminution) solids contact, chemical feed
system (including chemical costs), vacuum filtration and sanitary
landfill. Anaerobic digestion is shown separately in the event that
sludge stabilization is required. The total cost of this system is
approximately 18£/100Q gallons without anaerobic digestion and
20<£/1000 gallons with anaerobic digestion. A major portion of this
cost is the chemical cost of alum,.
The estimated costs of chemical clarification using lime, with
and without lime recovery, are shown in Tables 11 and 12, respectively.
The processes included in the lime clarification scheme are the same
as the alum clarification scheme except that single-stage recarbonation
was included in the lime clarification scheme without recovery; two-
stage recarbonation and recalcination were incorporated in the lime
clarification scheme with recovery. The total cost of lime treatment
without recovery (see Table 11) was estimated at 25<£/1000 gallons.
The "large quantities of lime required (21 tons/day as Ca(OH)?) account
for the high cost of this treatment method. In comparison, the cost
of lime treatment with recovery is only 20^/1000 gallons (Table 12)
and indicates the economic desirability of a lime recovery system

-51-
TABLE 10
COST OF ALUM TREATMENT
Process*
Bar Screens &ComminutionCH,23)
Solids Contact(20)
Chemicals &Feed System(11,20)
Vacuum Filter(21)
Sanitary Landfill(21)
TOTAL (w/o AnaerobicDigestion)
With AnaerobicDigestion
TOTAL (with Anaerobic
DesignCondition
10 MGD
600 gpd/ft2
175 mg/1alum
1 lb/hr-ft2
42 wettons/day
200,000 ft3
Capital Costtf/1000 gal
.02
2,02
,19
1.78
.47
4.48
1.25
5.73
0 & M Cost<£/1000 gal
0.11
. 2.55
6.89
1.55
2.31
13.41
0.56
13.97
Total Costtf/1000 gal
0,13
4.57
7.08
3.33
2.78
17,89
1.81
19.70Digestion)
Appropriate references for cost calculations are shown in parentheses.

-52-
TABLE 11
COST OF LIME TREATMENT WITHOUT RECOVERY
Design Capital Cost 0 & M Cost Total CostProcess* Condition it/1000 gal c/1000 gal £71000 gal
Bar Screens & 10 MGD 0.02 0.11 0.13Comminution(11.23)
Solids Contact 1500 gpd/ft 1.19 1.64 2.83(20)
Chemicals & 380 mg/1 0.47 14.10 14.57Feed System (20) as CaO
Single-Stage 1/3 cost of 0.25 0.33 0.58Recarbonation two-stage(22) system
Vacuum Filter 4.0 lbs/hr-ft2 0.85 2.09 2.94(21)
Sanitary 67 wet 0.62 3.07 3.69Landfill (21) tons/day
TOTAL 3.40 21.34 24.74
*Appropriate references for cost calculations are shown in parentheses.

-53-
TABLE 12
COST OF LIME TREATMENT WITH RECOVERY
Design Capital Cost 0 & M Cost Total CostProcess* Condition <£/1000 gal (j/1000 gal 1/1000 gal
Bar Screens' & 10 MGD .02 0.11 0,13Communition(11,23)
Solids Contact 1500 gpd/ft2 1.19 1.64 2.83(20)
Chemicals & Feed 60% lime 0.47 6.50 6.97System (20) recovery
Two-Stage 10 MGD 0.75 1.00 1,75Recarbonation (22)
Vacuum Filtration 4.0 lbs/hr-ft2 0.85 2,09 2.94(21)
Recalcination (22) 20 tons/day 2.96 2,29 5.25dry sludge
Sanitary Landfill 4.4 tons/day - 0.26 0.26($6/Ton)
TOTALS 6.24 13.89 20,13
*Appropriate references for cost calculations are shown in parentheses

-54-
even for relatively small plants. The use of a 60 percent lime
recovery factor was based on laboratory recalcination tests (see
section entitled "Lime Recalcination and Re-Use").
The results of this cost analysis indicate alum clarification
to be the least expensive alternative, provided that anaerobic
digestion is not required. If digestion is required alum treatment
becomes as expensive as lime treatment with recovery. Lime treatment
without recovery is by far the most expensive alternative.
-55-
CONCLUSIONS
1) Jar tests indicated that a lime dosage of 380 mg/1 as CaO
will reduce the total phosphorus concentration in raw Amherst
wastewater to 1.0 mg/1 or "less. A relatively constant pH of
approximately 11.5 can be expected from such a dosage.
2) Phosphorus removal did not improve significantly with longer
flocculation times in either jar tests or pilot plant studies.
However, the jar tests showed that if the rapid mix time was
reduced from 3 minutes to 1 minute, longer flocculation times were
needed for equivalent phosphorus removals.
3) Pilot plant studies conducted at different flocculation times
demonstrated a need for longer flocculation periods (approximately
15 minutes) to obtain maximum suspended solids removal.
.4) Lime clarification of raw wastewater can consistently reduce
phosphorus concentrations below 1.0 mg/1 as P. Extended pilot
plant studies also demonstrated that suspended solids, turbidity,
and chemical oxygen demand (COD) can also be reduced by 81, 77
and 75 percent respectively. Multi-media filtration is most
effective in further reducing suspended solids and turbidity.
5) The sludge accumulation rate as a result of lime addition can be
expected to increase dramatically. During the pilot plant studies,
4000 Ibs/MG were produced which is approximately four times the
amount from primary sedimentation alone. An additional 2250 Ibs/MG
of CaC03 sludge would be produced by two-stage recarbonation.
6) Thickening characteristics of lime sludge are good. Laboratory
tests show that thickener sludge concentrations in the 6 to 9
-56-percent range can be expected for a solids loading rate of 9
to 17 lbs/day-ft2.
7) A conditioning chemical such as FeCl3 or a polymer will be
needed to increase vacuum filter yield rates to more acceptable2
levels of 5 or 6 Ibs/hr-ft . Filter leaf tests using thickened
lime sludge and no conditioning chemicals typically produced yield
rates of 3.0 Ibs/hr-ft2.
8) Dewatering by centrifugation should produce cake solids in the
30 percent range. A clear centrate may also result without the
use of coagulant aids.
9) Because of the volume of supernatant and vacuum filtrate produced
is small, their high COD content should not severely affect the
treatment efficiency of the process,
10) Approximately 60 percent of the total lime requirement can be
recovered by recalcination if two-stage recarbonation is used.
11) With proper dosing, alum or lime clarification are equally effec-
tive in treating low alkalinity wastewater. The main difference
in the two processes is that alum clarification lowers pH and
alkalinity such that provisions for upward pH adjustment are
required while lime addition raises pH and alkalinity, and downward
pH adjustment is necessary. Also sludge production in the lime
system is greater than alum but lime sludge is easier to handle.

-57- •'
12) Comparative cost studies show that chemical clarification of
raw wastewater is less expensive using alum than lime. The
cost of a 10 MGD clarification scheme using alum is
approximately 18tf/100Q gallons. However, if anaerobic
digestion of alum sludge is required, this cost is increased
to 20<£/1000 gallons which is equivalent to the estimated
cost of lime clarification with lime recovery. Lime treatment
without recovery is by far the most expensive alternative at
25<t/1000 gallons.

-58-
REFERENCES
1) Stamberg, J.6., Bishop, D.F., Warner, H.P., Griggs, S.H., "LimePrecipitation in Municipal Wastewaters," Robert A. Taft WaterResearch Center, Cincinnati, Ohio (1969).
2) Gulp, R.L. and Gulp, G.L., Advanced Wastewater Treatment, VanNostrand Reinhold, New York, N.Y. (1971).
3) Process Design Manual for Phosphorus Removal, Black and VeatchConsulting Engineers, U.S. Environmental Protection AgencyTechnology Transfer, Contract #14-12-396 (October 1971).
4) Cecil, L,K.s "Evaluation of Processes Available for Removal ofPhosphorus from Wastewater," Office of Research and MonitoringEPA, Project No. 17010 DRF (October 1971).
5) Ferguson, J.F., McCarty, P.L., "Effects of Carbonate and Magnesiumon Calcium Phosphate Precipitation," Environ. Sci. & Tech., 5_,534 (1971).
6) Jenkins, D., Ferguson, J.F., Menor, A.B., "Chemical Processes forPhosphate Removal." Water Research, 5_, 369 (1971).
7) Martel, C.J., DiGiano, F.A. and Pariseau, R.E., "Pilot PlantStudies of Wastewater Chemical Clarification Using Alum," ReportHo. ENV.E. 44-74-9, Department of Civil Engineering, Universityof Massachusetts/Amherst (December 1974).
8) "Physical-Chemical Wastewater Treatment Plant Design," EPATechnology Transfer Publication (August 1973).
9) Sweeney, E.J., "Pilot Plant Studies on the Effect of FlocculationTime on Phosphorus Removal by Lime Addition to Raw DomesticWastewater," University of Massachusetts, Department of CivilEngineering, Master of Science Special Project, (September 1973).
10) Talmage, W.P. and Fitch, E.B., "Determining Thickener Unit Areas,"Ind. Eng. Chem., 47, 38 (1955).
11) Burns, D.E. and Shell, G.L., "Physical Chemical Treatment of aMunicipal Wastewater Using Powdered Carbon," EnvironmentalProtection Technology Series, EPA-R2-73-264 (October 1973).
12) Adrian, D.D., Lutin, P.A. and Nebiker, J.H., "Source Control ofWater Treatment Waste Solids, Report No. EVE 7-68-1, Departmentof Civil Engineering, University of Massachusetts/Amherst(April 1968).
13) Metcalf and Eddy, Inc., Wastewater Engineering, McGraw-Hill, Inc.,New York, N.Y. (1972).

-59-
14) Parker, D. S., Zadick, F. J., Train, K. E.9 "Sludge Processing forCombined Physical-Chemical-Biological Sludges." EnvironmentalProtection Technology Series, EPA-R2-73-250 (July 1973).
15) Mulbarger, M. D., Grossman, E., Ill, Dean, R. B. and Grant, O.L.,"Lime Clarification Recovery, Reuse, and Sludge DewateringCharacteristics," Jour. Water Poll. Control Fed., 41 2070 (1969).
16) Wilson, T. E., Bizzarri, R. E., Burke, T., Langdon, P. E., Jr.,and Courson, C. M.s "Upgrading Tampa's Primary Treatment Plantwith Chemicals and Water Treatment Works Sludge," presented atthe 47th Annual Conference, Water Pollution Control Federation,Denver, Colorado (October 1974).
17) Standard Methods for the Examination of Water and Wastewater,13th Edition, American Public Health Association, Washington, D.C.(1971).
18) Methods for Chemical Analysis of Water and Wastes, U.S. EnvironmentalProtection Agency, Office of Technology Transfer, EPA-625/6-74-003(1974).
19) Sawyer, C. N. and McCarty, P. !_., Chemistry for Sanitary Engineers,McGraw-Hill, 2nd Edition (1967).
20) Process Design Manual for Suspended Solids Removal, U.S. EnvironmentalProtection Agency Technology Transfer, EPA 625/1-75-003a (January 1975).
21) Process Design Manual for Sludge Treatment and Disposal, U.S.Environmental Protection Agency Technology Transfer, EPA 625/1-74-006,(October 1974).
22) Advanced Wastewater Treatment as Practiced at South Tahoe,U. S. Environmental Protection Agency, Project 17010 ELQ (WPRD 52-01-67),(August 1971).
23) Estimating Manpower Requirements for Conventional Wastewater TreatmentFacilities, EPA 17090 DAN 10/71, (1971).
24) Bowen, S. P., "Evaluation of Process Design Parameters for PhosphorusRemoval from Domestic Wastewater by Chemical Clarification",Doctoral Dissertation, University of Massachusetts, Department ofCivil Engineering (1974).
-60-
APPENDIX I
ANALYTICAL TECHNIQUES
All analyses were performed in accordance with the 13th Edition
of Standard Methods for the Examination of Water and Wastewater (l?)
and Methods for Chemical Analysis of Water and Wastes (18). Most
samples were analyzed immediately after sampling, but when preservation
was necessary, it was done according to EPA guidelines (18).
Phosphorus - Total phosphorus was determined according to the
EPA single reagent method. Dilutions were made as necessary. The
persulfate digestion was used and colormetric determinations were
carried out with a Bausch and Lomb Spectronic 20.
At least two standards and a reagent blank were analyzed with
every set of samples. Glassware was washed with hot 1+1 hydrochlo-
ric acid, and filled with distilled water until use.
Soluble phosphorus was determined by immediate filtration
through a 0.45 micron membrane filter prior to analysis.
Alkalinity - Alkalinity was measured by titrating each sample
with .01 N HpSQ* to the respective endpoints of 4.5 for total
alkalinity and 8.3 for phenophthalein alkalinity. Electrometric
titrations were carried out on a Radiometer model 28B pH meter and
results expressed in mg/1 as CaC03-
Chemical Oxygen Demand (COD) - The samples including a blank
were refluxed for two hours and titrated with standardized .01 N
ferrous ammonium sulfate.

-61-
Turbidity - Turbidity measurements were obtained using a Hach
Model 2100A Turbidometer. The meter was standardized before each
use and the data was expressed in Jackson Turbidity Units (JTU).
Suspended Solids - The glass fiber filter technique with a mem-
brane filter holder was used throughout the study. The volatile
portion was determined by ignition at 550°C for 15 minutes.
Total Solids - The water was boiled off an appropriate volume
of sewage or sludge in a dried and tared dish. The residue was
dried at 103°C and weighed.
Total Volatile and Fixed Residue - The residue from the total
solids determination was ignited at 550°C, cooled and weighed.
Hardness - A 25 ml sample was titrated against standardized
EDTA titrant.

-62-
APPENDIX II
DETERMINATION OF THE MEAN VELOCITY GRADIENT (G)
F1peculation Tanks
The mean velocity gradient (G) can be determined from the
equation:
G = (—J ) "* (1)2pV
where:
G = mean velocity gradient, ft/sec/ft = I/sec.
C . = drag coefficient of flocculator paddles moving perpendicular
to fluid.2
A = paddle area, ft
3p = mass fluid density, slugs/ft
v = relative velocity of paddles in fluid, ft/sec, usually 70
to 80 percent of the paddle tip speed.2
u = absolute fluid viscosity, Ib force-sec/ft3
V = flocculator volume, ft
For the flocculation units used during the pilot plant studies,
the assumed and calculated values of the above parameters are:
C . = 1.8 for rectangular paddles
A = 1 in. x 32 in. x 2 = 64 in2 = 0.444 ft2
p = 1.938 Ib-sec2/ft4 @ 60°F
v = .75 v = .75(277 nR/60), where v = paddle-tip speed
n = rpm = 30
R = radius of paddles = .375 ft.

-63-
u = 2.36 x 10"5 lb-sec/ft2
V = 32 gal = 4278 ft3
Subst i tut ing these values in Equation 1, the mean velocity
gradient (G) is 73 sec' wh ich is w i t h i n the range of 20 to 75 sec~
recommended for f loccu la t ion (13) . A h i g h velocity gradient was
used to prevent set t l ing of the heavy l ime f loe in the f loccula t ion
basins.
Rapid Mix Tank
The velocity gradient in a rapid mix tank must be greater than
that in a flocculation basin to insure proper mix ing . G u l p and
G u l p (2) recommend a velocity gradient of at least 300 sec" . For
a rapid mix tank wi th an electrically driven propeller and shaf t ,
the mean velocity gradient (G) can be determined from the equation:
G = f H P W x 55U.1/2
V V
where HPW is the water horsepower.
For a rapid mix tank wi th a volume of 20 ga l lons and a stirrer
with a 1/30 HP, 75 percent efficient motor, the mean velocity
gradient (G) is 463 sec~ . This velocity gradient wi th a 5-minute
detention time should be adequate for dispersing the l ime slurry
in the wastewater.
-64-
APPENDIX III
CARBON DIOXIDE REQUIRED FOR RECARBONATION
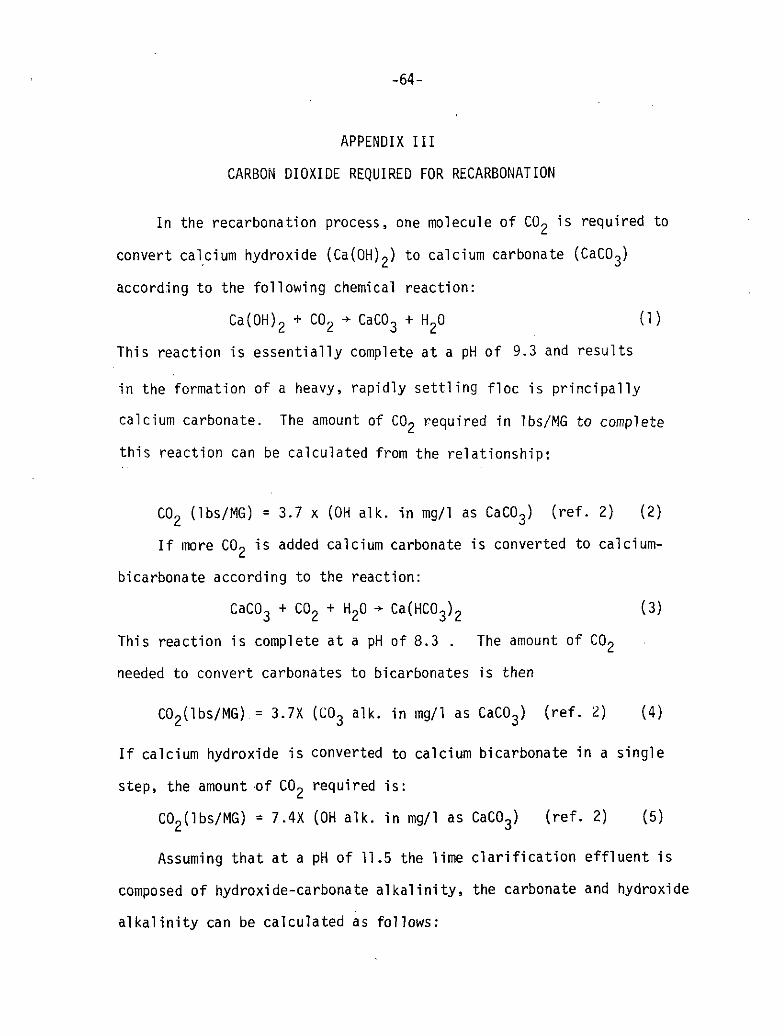
In the recarbonation process, one molecule of C02 is required to
convert calcium hydroxide (Ca(OH)2) to calcium carbonate (CaC03)
according to the following chemical reaction:
Ca(OH)2 + C02 •* CaC03 + H20 (1)
This reaction is essentially complete at a pH of 9.3 and results
In the formation of a heavy, rapidly settling floe is principally
calcium carbonate. The amount of C02 required in Ibs/MG to complete
this reaction can be calculated from the relationship:
C02 (Ibs/MG) = 3.7 x (OH alk. in mg/1 as CaC03) (ref. 2} (2)
If more C02 is added calcium carbonate is converted to calcium-
bicarbonate according to the reaction:
CaC03 + C02 + H20 •* Ca(HC03)2 (3)
This reaction is complete at a pH of 8.3 . The amount of C02
needed to convert carbonates to bicarbonates is then
C02(lbs/MG).= 3.7X (C03 alk. in mg/1 as CaC03) (ref. 2) (4)
If calcium hydroxide is converted to calcium bicarbonate in a single
step, the amount of C02 required is:
C00(lbs/MG) = 7.4X (OH alk. in mg/1 as CaCOJ (ref. 2) (5)L. J
Assuming that at a pH of 11.5 the lime clarification effluent is
composed of hydroxide-carbonate alkalinity, the carbonate and hydroxide
alkalinity can be calculated as follows:

-65-
C03 alk(mg/l CaC03) = 2X(total alk(mg/l CaC03) -
phenol, alk (mg/1 (CaC03)) (ref. 19 ) (6)
OH a!k(mg/l CaC03) = total alk. (mg/1 CaC03) -
C03 alk. (mg/1 CaC03) (ref. 19) (7)
From Table 5 the phenolphthalein alkalinity is 453 mg/1 as CaC03
and the total alkalinity is 495 mg/1 as CaC03. Thus, from Equations
6 and 7, the carbonate alkalinity can be calculated to be 84 mg/1 as
CaC03 and the hydroxide alkalinity is 411 mg/1 as CaC03-
Two-Stage Recarbonation
In the first stage, C02 is added to convert calcium hydroxide
to calcium carbonate precipitate. According to Equation 2, the
amount of C02 required is then:
C09 (Ibs/MG) = 3.7X (411 mg/1 as CaCO,) = 1521.L. O
After precipitation of CaCO,, additional COp is added in the
second stage to further reduce the pH from approximately 9.3 to 8.3
or below. According to Equation 4, the CO,, required can be calculated
as follows:
C09(lbs/MG) = 3.7X (84 mg/1 as CaCO.) = 311.C. J
The total carbon dioxide requirement for both stages of recarbonation
is then 1832 Ibs/MG.
Single-Stage Recarfaonation
If lime is not to be reused, single-stage recarbonation may be
employed. However> by applying all the carbon dioxide in a single
step, little calcium is precipitated and the hardness of the effluent
is increased. To change all the hydroxide and carbonate alkalinity
to bicarbonate, the COp required is:
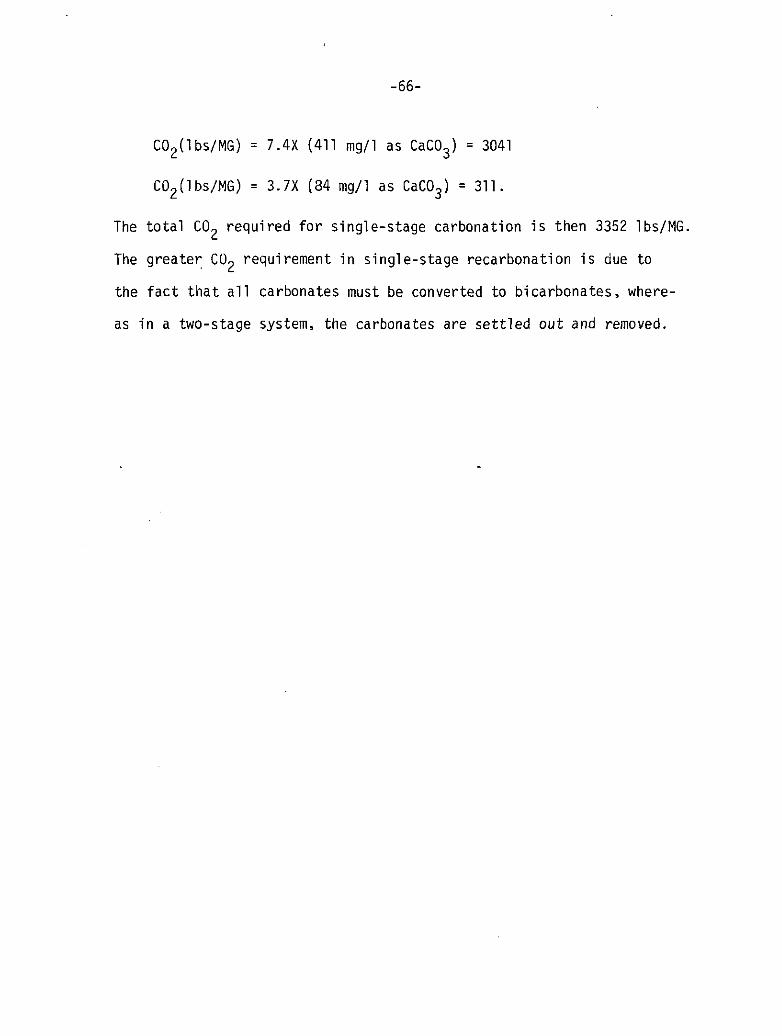
-66-
CCUlbs/MG) = 7 .4X (411 mg/1 as CaCOj = 3041£ O
C02(lbs/MG) = 3.7X (34 mg/1 as CaC03) = 311.
The total CO- required for single-stage carbonation is then 3352 Ibs/MG,
The greater CO- requirement in single-stage recarbonation is due to
the fact that all carbonates must be converted to bicarbonates, where-
as in a two-stage system, the carbonates are settled out and removed.
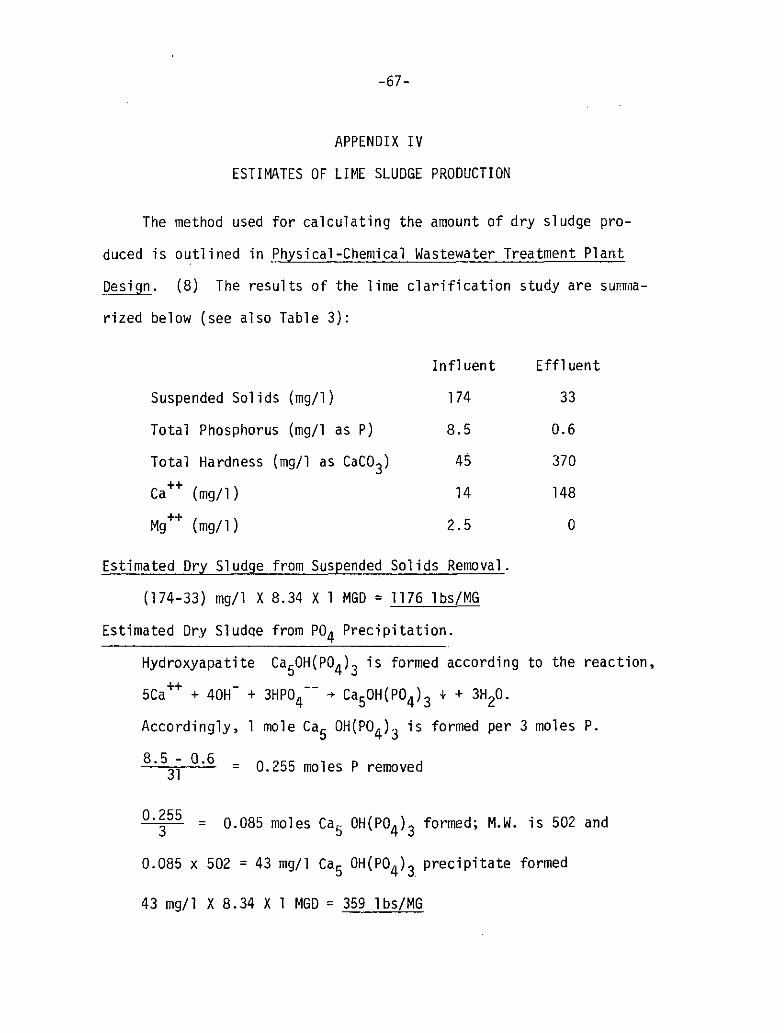
-67-
APPENDIX IV
ESTIMATES OF LIME SLUDGE PRODUCTION
The method used for calculating the amount of dry sludge pro-
duced is outlined in Physical-Chemical Wastewater Treatment Plartt
Design. (8) The results of the lime clarification study are summa-
rized below (see also Table 3):
Influent
Suspended Solids (mg/1 )
Total Phosphorus (mg/1 as P)
Total Hardness (mg/1 as CaC03)
Ca++ (mg/1)
Mg++ (mg/1)
Estimated Dry Sludge from Suspended Solids
174
8.5
45
14
2.5
Removal .
Effluent
33
0.6
370
148
0
(174-33) mg/1 X 8.34 X 1 MGD = 1176 Ibs/HG
Estimated Dry Sludge from P04 Precipitation.
Hydroxyapatite CarOH(P04)- is formed according to the reaction
SCa"*" + 40H" + 3HP04~~ •+ Ca5OH(P04)3 i + 3H20.
Accordingly, 1 mole Cac OH(P04)~ is formed per 3 moles P.
8.5 - 0.631
= 0.255 moles P removed
°'355 = 0.085 moles Ca5 OH{P04)3 formed; M.W. is 502 and
0.085 x 502 = 43 mg/1 Ca5 OH(P04)3 precipitate formed
43 mg/1 X 8.34 X 1 MGD = 359 Ibs/MG

-68-
Estimated Dry Sludge from CaC03 Precipitate.
Lime Dosage = 380 mg/1 as CaO or 271 mg/1 as Ca++
Influent Ca++ (mg/1) = 271 +14 = 285
Effluent Ca++ (mg/1) = 148
Total Ca++ (mg/1} in sludge = 137
Less Ca++ in hydroxyapatite ppt. = 179+
Ca -in calcium carbonate sludge = 120
Dry sludge from CaC03 = JOO x 12Q = 30Q mg/]
300 mg/1 X 8.34 x 1 MGD = 2502 Ibs/MG
Estimated Dry Sludge Due to Mg(OH)2 Precipitation• i
Magnesium hydroxide (Mg(OH)~) is formed according to the reaction
Mg++ + Ca (OH)2 •* Mg(OH)2 + Ca++
With one mole of Mg(OH}? formed per mole of Mg++, the amount of
magnesium hydroxide sludge produced is:
I—Y = 0.1 X 58.31 = 6 mg/1 as Mg (OH)2
6 mg/1 X 8.34 X 1 MGD - 50 Ibs/MG
Summary of Dry Sludge Production
Sludge Species Tbs/MG
Sewage solids 1176
Ca, OH(POA)« precipitate 3590 4- j
CaCOo precipitate 2502\j
Mg(OH)2 precipitate 50
Total 4087

-69-
APPENDIX V
GRAVITY THICKENING AND CENTRIFUGE DATA
Gravity Thickening
The gravity thickening characteristics of lime sludge were
determined by the following test procedure:
1) A 5-gallon sample of the wasted lime sludge from the
clarifier was set aside. The characteristics of this
sludge are shown in Table 4. Some samples were diluted
or concentrated to obtain various initial sludge concen-
trations ( C T ) .
2) The 5-gallon sample was poured into a 5.5 inch graduated
plexiglass column and the interface height recorded with
time. No mixing was provided. The height of the interface
was recorded over a period of 24 hours. The settling curves
of 5 sludges of various initial concentrations are shown
in Figure AV-1.
3) The supernatant was siphoned off and preserved for analysis
(see Table 5). The remaining thickened sludge was drained
from the column into one-gallon containers and a sample
withdrawn for percent solids analysis. The gallon containers
of sludge were refrigerated and used later in filter leaf
tests.
4) By the method of Talmage and Fitch (10) a "working line"
was developed tangent to the settling curve at the com-
pression point. Figure AV-2 shows a typical sludge thickening
curve with a "working line" which will be used to compute

-70-
SLUDGE % SOLIDS
C | ( 0 h r s ) CF(24hrs)
7.5
6.6
4.4
7.9
5.9
10
0 1 J
0 255 10 15 20
TIME ( M R S )
Figure AV-1. Laboratory Settling Curves.
30

-71-
H
LUX
UJa
QCUJ
WORKING LINE
COMPRESSION POINT
TIME
Figure AV-2. Typical Sludge Thickening Curve

-72-
a thickener solids loading at a given underflow concentration
(cu).5) A desired thickener underflow concentration (C ) in percent
solids was selected.
6) Knowing the specific weight of the solids (SW ) and superna-
tant (SW0) and the weight of solids (W_), the volume ofX. S
slurry (Vsl) associated with an assumed thickener underflow
concentration (C ) was computed according the the relationship
W W.Vsl = +
where W« = weight of liquid in underfl ow
The weight of solids (W ) can be calculated from the initial
sludge concentration (C T ) and the volume of sludge used.
By drying a measured volume of sludge at 103°C and relating
the weight of dried sludge solids to an equivalent weight
of water, the specific gravity of the dry sludge was deter-
mined to be 1.785. The specific weight (SW ) is then3
111.38 Ib/ft . The specific weight of liquid in the under-3
flow (SWj was assumed to be the same as water (62.4 Ibs/ft ).
7) The sludge interface height (h) associated with the
computed volume of slurry (V -.) was calculated and the time (t)
for thickening was determined from the working line (see
Figure AV-2) .

-73-
8) Knowing t, C and H, the predicted thickener loading (U) can
be calculated from the relationship,
C HII = -* -U t
9) Steps 5 through 8 were repeated for several thickener under-
flow concentrations. The plotted data generated by this
procedure resulted in a smooth curve relating thickener
solids loading vs. underflow solids concentration for a
given feed solids concentration. Laboratory thickening
test results shown in Figure 10 were developed in this
manner.
Centrifugation
The results of laboratory centrifuge tests are presented in
the following letter from the Bird Machine Company.

-74-
BIRD MACHINE COMPANY, INC., SO. WALPOL.E, MASS. OSO71PHONE: 617 668-0400 / TELEX: 92 4428 / CABLE: BIRDMACHIN SOWALPOLEMASS
January 29, 1975
University of MassachusettsDepartment of Civil EngineeringAmherst, MA 01002
Attention: Mr. C. James Martel
Subject:
Dear Mr. Martel:
Sludge Sample #291BMC Lab Report #8168
I am enclosing a copy of the above referenced lab reportcovering the results of the sludge sample as described inyour letter of Decejnber 17, 1974.
The preliminary spin tests are encouraging in that dewateredcake products in the low 20% range were produced, and highsolids recovery (.clear centrate). was realized with extremelylow polymer dosage. The lab work, therefore, indicates thata sludge of this nature would be handled extremely satisfactoryin a production model machine, and I would predict cake productsin the 30% range and a possibility of accomplishing centrateclarity without chemical aids.
Concerning the recalcining of the lime for reclamation, Iwould appraise you of the South Lake Tahoe installation inCalifornia. This project has received wide spread notorietyas a tertiary treatment plant, and has been written up invarious publications. Specifically I would direct your attentionto the manual on "Advanced Waste Water Treatment" by Gulp & Gulp,Van Nostrand Reinhold, Publishers. In addition, the publicationby the U.S. Government Printing Office entitled "Advanced WasteWater Treatment as Provided at Lake TahoeV would be of interest,and this publication carries Research Series No. 17010ELQ-08/71.
Basically, the dewatering application at Tahoe consists of threecentrifuges, with Unit No. 1 handling the straight organicsludge from which the cake product is incinerated for finaldisposal. The second machine is used in the recalcining processand functions in the following manner.
N. N.W. Hwy,, PARK RIDGE, ILL. 60068 7 Durwooby Park, ATLANTA, OA. 30341 9415 S.W. Canyon Court, PORTLAND, ORE. B7221 1354 Creeksld* Drive. WALNUT CREEK, CALIF. 94S98
30 Gales! Drive. WAYNE. N.J. 07470 P O. Bo* 48*. DUNBAR, W VA. 25084 2721 Mine S Mill Road. LAKELAND, FLA. 33803

-75-
BIRD MACHINE COMPANY, INC.
University of MassachusettsDepartment of Civil EngineeringAmherst, MAMr. C. James MartelJanuary 29, 1975
- 2 -
The lime slurry fed to the second unit is operated in a"classifying" manner, wherein only the calcium carbonateis precipitated and removed from the centrifuge, with thecentrate containing the other impurities such as metalhydroxides, etc. In this manner, almost pure calcium carbonateis recovered from the system prior to being sent to therecalcining unit. The cake product from this machine isnormally in the 40% solids region.
In the event that you are considering such a program orprocess, I would recommend that you utilize an additionalcentrifuge to handle the centrate from the initial limeslurry machine. In this manner, the second machine woulddewater the impurities to approximately 12-15% solids andthen process for further disposal either by landfill orincineration.
Please review the attached data and if we can be of anyfurther assistance to you, do not hesitate to contact usaccordingly.
Very truly yours,
BIRD'MACHINE COMPANY, INC.
A.S. NisbetSales EngineerEnvironmental Control Equipment
ASN:pjt/23
Enc.

-76-
APPENDIX VI
ESTIMATES OF LIME RECOVERY
Incinerated Sludge Production
Assuming a 60 percent volatile content of the sewage as
calculated in Appendix IV and complete conversion of CaCCL to
CaO the sludge (ash) composition after incineration would be:
Sludge Species Ibs/MG
Sewage solids 470
Ca5 OH(P04)3 precipitate 359
CaO 1401
Mg(OH)2 precipitate 50
Total 2280
Estimated sludge weight reduction = 44 percent
Percent of quicklime (CaO) = 61 percent
Additional Lime Sludge Due to Recarbonation
If two stage recarbonation is added to the lime clarification
process, substantial quantities of calcium carbonate could be pre-
cipitated out and recalcined for re-use. Assuming that the effluent
can be discharged at a moderate hardness concentration of 100 mg/12+as CaCO~ (40 mg/1 as Ca ) the estimated quantity of lime sludge
recovered from recarbonation is calculated as follows:2+Influent to first stage recarbonation = 148 mg/1 as Ca2+Effluent from first stage of recarbonation = 40 mg/1 as Ca
Ca2+ in sludge = 108 mg/1 as Ca2+
or CaC03 precipitate '= 270 mg/1 as CaCQ3
270 mg/1 X 8.34 X 1 MGD : = 2252 Ibs/MG

-77-
If this calcium carbonate sludge is incinerated along with
the chemical clarification sludge, approximately 1260 Ibs/MG of
additional quicklime (CaO) will be recovered.