pilot impacts portal: user acceptance testing · pdf filecsiro ict centre pilot impacts...
TRANSCRIPT

CSIRO ICT CENTRE
Pilot Impacts Portal:
User Acceptance Testing Compilation of Primer and User Test Scripts
Robert Power and Bella Robinson CSIRO ePublish # EP124663 June 2012
Prepared for: Fire & Rescue NSW

P a g e | ii Pilot Impacts Portal: User Acceptance Testing 15/06/2012
CSIRO ePublish # EP124663
CSIRO ICT Centre Computer Science and Information Technology Bld (Building 108) ANU North Road Acton ACT GPO Box 664 Canberra ACT 2601 Australia
Citation
Power R. and Robinson B. (June 2012) Pilot Impacts Portal: User Acceptance Testing. CSIRO, Australia. EP124663
Copyright and disclaimer
© 2012 CSIRO To the extent permitted by law, all rights are reserved and no part of this publication covered by copyright may be reproduced or copied in any form or by any means except with the written permission of CSIRO.
Important disclaimer
CSIRO advises that the information contained in this publication comprises general statements based on scientific research. The reader is advised and needs to be aware that such information may be incomplete or unable to be used in any specific situation. No reliance or actions must therefore be made on that information without seeking prior expert professional, scientific and technical advice. To the extent permitted by law, CSIRO (including its employees and consultants) excludes all liability to any person for any consequences, including but not limited to all losses, damages, costs, expenses and any other compensation, arising directly or indirectly from using this publication (in part or in whole) and any information or material contained in it.

15/06/2012 Pilot Impacts Portal: User Acceptance Testing P a g e | 1
1 Introduction
1.1 Background
User Acceptance Testing (UAT) is a process performed by users to determine if a system functions correctly according to the system specification. The process is guided by a series of test scripts which are each aimed at verifying that a particular business function is achieved by the system being tested. The test scripts are established in reference to the system requirements.
The UAT process is performed at the end of system development. It is the final task undertaken to ensure the delivered system meets the user’s expectations and correctly achieves the stated business functions defined in the requirements. Successful completion of the UAT is necessary for the client to accept the new system.
The information contained in this report was originally developed as a series of reports for use by the testers. These reports consisted of an overview describing the UAT process, a primer introducing the Pilot Impacts Portal graphical user interface (GUI) features and 8 test scripts. These reports have been compiled into this report. Appendix B contains a summary of the feedback received by the testers.
1.2 Overview
A series of test scripts have been developed for the Pilot Impacts Portal based on the requirements specification. The requirements describe the system features of the portal in 11 categories:
1. Navigate the Impacts Framework 2. Provide a Geographical User Interface 3. Link from the Impacts Framework to related
Data Items 4. Explore the Available Data Items 5. Produce Reports
6. Extract Data Items 7. Include New Data Item 8. Update Existing Data Item 9. Portal Access and User Management 10. Pilot Impacts Portal Monitoring 11. Miscellaneous
1.3 UAT Test Scripts
The UAT test scripts outline the process a user will undertake in performing the UAT task. A template test script is included in Appendix A. The template is applied to the numerous requirements to derive the final UAT test scripts that will then be used by FRNSW to verify the developed portal operates as expected when the software development is finished.
1.4 Mapping the Requirements to the UAT test scripts
The Pilot Impacts Portal Requirements Specification defines the system features as precise and unambiguous descriptions of the system. The test scripts may demonstrate the capabilities of the portal in terms of multiple requirements. That is, there is a many to one mapping of the requirements to the test scripts. This mapping is focused on a general theme of activity a user is expected to perform when using the portal.
The mapping of the UAT test scripts to the specific requirements is shown below, along with an indication of the approximate amount of time expected to complete the test script.

P a g e | 2 Pilot Impacts Portal: User Acceptance Testing 15/06/2012
Portal User Theme Script # Requirements demonstrated Approximate time to complete (minutes)
Impacts Framework 1 NAV-Req1, Nav-Req2, EXT-Req1, USR-Req2
45
User Registration 2 USR-Req1, USR-Req3, USR-Req4, USR-Req11, MSC-Req1, MSC-Req3, MSC-Req4
45
Map GUI Navigation 3 GUI-Req1, GUI-Req3, GUI-Req4, GUI-Req6
30
Map GUI Locations 4 GUI-Req2 25
Data Linkages 5 LNK-Req1, LNK-Req2, GUI-Req8 25
Data Exploration 6 EXP-Req1, EXP-Req2, EXP-Req3 25
Reports 7 RPT-Req1, RPT-Req2, RPT-Req3 15
Data Extracts 8 EXT-Req2, EXT-Req3, EXT-Req4, EXT-Req5
15
1.5 General Instructions
Note the following:
• The tester is expected to be familiar with the Impacts Framework as described by the report and Microsoft Excel spreadsheet available at: http://www.fire.nsw.gov.au/page.php?id=914.
• The tester is expected to be familiar with the Pilot Impacts Portal Requirements Specification. This will be provided as part of the UAT package.
• The test scripts assume the tester is using one of the following web browsers: Internet Explorer version 8, Mozilla Firefox version 6, Google Chrome version 13 or Safari version 5.1. More recent version numbers are ok.
• The tester is expected to be using the Windows XP or Windows 7 platforms. • The Pilot Impacts Portal is located at: http://www.fend.org.au/portal/.
To self register, click on the Register link and fill in the required details. An e-mail will be sent with a URL that must be followed to activate your account
• The Pilot Impacts Portal – Map View is located at: https://www.fend.org.au/portal/secure/index.html?page=map.
• The tester must have a username and password to access the Map View in the Pilot Impacts Portal. This is set up during self registration as described above.
• The Pilot Impacts Portal is best viewed using a 17 inch monitor or larger, with a landscape screen orientation and a screen resolution of at least 1280 x 1024.
• The tester is required to complete all seven test scripts identified on page 2. This should take approximately three and a half hours to complete.
• For any technical assistance or usability issues please contact Robert Power, CSIRO on 02 6216 7039 or [email protected]. For any project related questions, please contact Melanie Stutchbury on 02 9265 2674 or [email protected].

15/06/2012 Pilot Impacts Portal: User Acceptance Testing P a g e | 3
2 Primer
There are a number of user interface elements available that users must know how to use in order to successfully operate the portal. These elements are described below and include specific names that will be used in the UAT test scripts when referencing the user interface elements.
It is expected that users will be familiar with most of these controls, such as “buttons”, “drop down lists” and so on. However, there are some terms introduced, such as the “Navigation Bar” and “Accordion Tabs” which may not be familiar.
These terms are used extensively in the User Acceptance Testing scripts.
2.1 General Instructions
When operating the portal we recommend at least the following specifications:
Operating System: Windows XP or Windows 7 CPU: 2.4 GHz RAM: 2 GB Internet connection speed: 50 Mbps Screen resolution: 1280 x 1024 Browser version: Internet Explorer 8, Mozilla Firefox 6, Google Chrome 13 or Safari 5.1
To find out your internet connection speed you may need to ask someone from your IT support department. Or for a rough estimate, you can try this web site: http://www.speedtest.net
It is also recommended that you make your browser window full screen so that all of the portal components fit comfortably. To make your window full screen, click on the “Maximise” icon in the top right corner of the window.
The browser version numbers specified are minimum values: more recent versions will work also. To check the version number of your browser, do the following:
Internet Explorer: Click on the “Help” menu item and then select “About Internet Explorer”. You should then be presented with a popup box much like the following. The version number is circled.

P a g e | 4 Pilot Impacts Portal: User Acceptance Testing 15/06/2012
Firefox: Click on the “Help” menu item and then select “About Firefox”. You should then be presented with a popup box much like the following. The version number is circled.
Chrome: Click on the “Spanner” icon in the top right of the Chrome window as shown below.
Then select “About Google Chrome” from the drop down menu. You should then be presented with a popup box much like the following. The version number is circled.

15/06/2012 Pilot Impacts Portal: User Acceptance Testing P a g e | 5
Safari: Click on the “Cog” icon in the top right of the Safari window as shown below.
Then select “About Safari” from the drop down menu. You should then be presented with a popup box much like the following. The version number is circled.
2.2 Portal Overview
The Pilot Impacts Portal is available at: http://www.fend.org.au/. Opening this URL in a web browser will present the user with the portal as shown in Figure 1 below:

P a g e | 6 Pilot Impacts Portal: User Acceptance Testing 15/06/2012
Figure 1: Pilot Impacts Portal Home Page
Note that the URL is redirected to: http://www.fend.org.au/portal/.
The user interface elements described below are used extensively in the Pilot Impacts Portal. The following examples use Microsoft’s Internet Explorer version 81.
URL Links A URL link is shown in blue and underlined. On the Pilot Impacts Portal home page, there are 11 links. These are indicated in Figure 2 using red ovals. Note that a link is blue when the page has not been previously visited. A link is shown as a dull red colour when the link has been visited before.
1 Or to be precise, version 8.0.7601.17514

15/06/2012 Pilot Impacts Portal: User Acceptance Testing P a g e | 7
Figure 2: URL Links and the Navigation Bar
The Navigation Bar The portal has a number of interrelated components that can be switched between using the tabs on the navigation bar. The tab components are identified by their labels: Home, Framework, Registry, Map, Help, Acknowledgements and Contact Us. The different tabs are mostly referred to as pages, for example the “home page”, the “help page”. However, some are referred to differently since they provide special features specific to the portal:
o Framework Explorer The Framework Tab on the Navigation Bar.
o Registry Explorer The Registry Tab on the Navigation Bar.
o Map View The Map Tab on the Navigation Bar.
The navigation bar is highlighted in Figure 2 using a blue rectangle. Only one tab can be active at a time. A tab is activated by moving the mouse over the tab label and selecting it by clicking the left mouse button. The active tab is shown in white while the inactive ones are greyed.

P a g e | 8 Pilot Impacts Portal: User Acceptance Testing 15/06/2012
Figure 3: Example Drop Down Lists and Buttons
Drop Down Lists A drop down list allows the user to choose from a range of options. Figure 3 shows the Framework tab of the portal where there are five drop down lists allowing the user to choose various options to explore the content of the Impacts Framework. The first drop down list is highlighted using a blue rectangle. Inside this are a further two blue rectangles to distinguish the different features used in a drop down list:
o Label The drop down list has a label to indicate what the choice is for. In this example of Figure 3, the highlighted label is Event.
o Options These are the choices that can be made using the drop down list. The user must place the cursor in the options box and click the left mouse button to active the drop down list. This shows the user the list of available options to choose from. Note that only one choice can be selected. When there are a large number of choices available, the list will appear with a scroll bar on the right. The user makes a choice by either moving the mouse to the required option or by using the up and down arrow buttons. As this is done the current option is highlighted using reverse video of the text. The choice is made by again clicking the left mouse button or by hitting the “Enter” button on the keyboard. The options are displayed as black test indicating they may be chosen. When the text is displayed in grey it cannot be chosen. Greyed options are used to indicate to the user that in some circumstances the choice is available: but not for the current settings. This use of greyed text is also used elsewhere in the portal.

15/06/2012 Pilot Impacts Portal: User Acceptance Testing P a g e | 9
In the example of Figure 3, the user has chosen the event Earthquake.
Buttons A button is used to perform an action. The action is activated by using the mouse to position the cursor over the button and clicking it using the left mouse button.
There are four buttons shown in Figure 3 with two highlighted using red ovals. Each button is labelled with text on it providing an indication of the action associated with the button. A button that is inactive, meaning the action cannot be performed, is indicated by the text being greyed out. An example in Figure 3 is the right button labelled “View Impact Data Items”.
Accordion Tabs Accordion tabs are similar to regular tabs except they are vertical instead of horizontal. An accordion tab is used as part of the Map Tab on the Portal Navigation Bar, as shown in Figure 4. There are five tabs available, identified by their labels: Layers, Locations, Building Information, Historical Events and Reports. Only one tab can be active at a time. A tab is activated by moving the mouse over the tab label and selecting it by clicking the left mouse button. The active tab is shown in white while the inactive ones are greyed.
Text Boxes A text box allows a user to enter text in the box provided. The text box has a label indicating what the text is for. Two text boxes are shown in Figure 4. The “From” text box is highlighted using a blue rectangle and contains the value 2000.
Check Boxes A check box is used to indicate that an option is either active or inactive. When active, there is a tick inside the box (). When inactive, the box is empty. There are numerous check boxes shown in Figure 4.Two are active, the last one and the one highlighted using a red oval. The state of check box is toggled by placing the cursor over the check box and clicking the left mouse button.

P a g e | 10 Pilot Impacts Portal: User Acceptance Testing 15/06/2012
Figure 4: Accordion Tabs, Text Boxes and Check Boxes
The Map View The Map is available when the Map Tab on the Portal Navigation Bar is active, as shown in Figures 4 and 5. The Map is a Google Map which provides street map, terrain and satellite imagery backdrops for Australia. The Map is also referred to as the “Map View” and is highlighted in Figure 5.
Navigation Controls The Google Map includes its own mechanisms for navigating the map: the Navigation Controls highlighted in Figure 5. These controls consist of four elements, seen from top to bottom in Figure 5:
o Arrows The four arrows are used for panning north, south, east or west.
o Street View “Person” This is for Street view, which has not been utilised by the Portal and should not be used.
o Zoom The “+” and “-” allow the Map View to be zoomed in or out.
o Zoom Slider An alternative method for zooming.
Google provide detailed online help with navigating their mapping interface, refer to the following:
o Google Maps Help
o Getting to Know Google Maps
o Navigating in Google Maps

15/06/2012 Pilot Impacts Portal: User Acceptance Testing P a g e | 1 1
Figure 5: The Map View, Google Map Navigation Controls and Radio buttons
The Map View can be controlled as follows:
o Zoom The Map View can be zoomed in or out by using the mouse scroll button (if present) or by using the navigation controls:
- moving the slider up or down
- clicking the “+” (zoom in) or “–” (zoom out) at either end of the slider
o Pan The Map View can be panned, where the map displayed is moved, by placing the cursor within the Map View, holding down the left mouse button and dragging the map to the desired location. Alternatively, the Google Navigation controls can be used to pan the map by
- Press the up arrow to move north
- Press the down arrow to move south
- Press the right arrow to move east
- Press the left arrow to move west
Radio Buttons A radio button allows one choice to be made from two or more available options. The radio buttons are labelled to indicate what the choice is for. The chosen selection has a black dot next to it. A different choice is made by placing the cursor over a different selection and clicking the left mouse button. Figure 5 shows a group of four radio buttons allowing the user to choose the different kinds of Boundary Layers to enable in the Map View. SLA has been chosen. Note that the option CCD is not

P a g e | 12 Pilot Impacts Portal: User Acceptance Testing 15/06/2012
available, indicated by the label being in grey text.
2.3 Other Graphical Elements
There are a few other graphical elements the user will encounter when using the Pilot impacts Portal. These are noted below:
Population Statistics ABS Populations Statistics are available for LGA, SLA and CCD regions. In the example of Figure 6, the SLA corresponding to the suburb of Florey in Canberra is shown. Note the outline of the suburb is highlighted in yellow on the Map View.
Figure 6: Population Statistics and Building Information
Building Information NEXIS Building Information is available from the Accordion Tab. Note there are three categories of building information: Residential, Commercial and Industrial. This can be seen in Figure 6. Note there are two scroll bars displayed: one for the Building Information Accordion tab content and another for the displayed NEXIS building information itself.
Event Display Elements Fire Emergency and Natural Disaster (FEND) events are displayed in the Map View as shown in Figure 7. There are two methods used to represent such events on the Map View:

15/06/2012 Pilot Impacts Portal: User Acceptance Testing P a g e | 1 3
Figure 7: Displaying Events
o General FEND events So far the portal has event information for cyclones, earthquakes and flood regions. These events are shown as cyclone tracks (the red lines), earthquakes (semi-transparent maroon dots of varying sizes with larger dots indicating stronger earthquakes) and flood regions (semi-transparent blue regions). The list of such events is expected to increase as more relevant data items are identified and integrated into the portal.
o Attorney General’s Department Disasters Database events This data item includes information about numerous FEND events. Instead of dispersing the information about the AGD described events into the various FEND event categories, they are reported as a group in the portal. These events are shown using icons to distinguish them. The icons used are shown in Table 1 below. Note the bushfire and urban fire icons are the same.
Bushfire
Flood
Tornado
Cyclone
Landslide
Tsunami
Earthquake
Storm
Urban Fire
Table 1: AGD event icons
Impacts Pop-ups Individual FEND events may have associated impacts information defined for them. When this is the case, the depiction of the event in the Map View can be selected by placing the cursor over it and clicking the left mouse button. The event details will then be displayed in a pop up. Two examples are

P a g e | 14 Pilot Impacts Portal: User Acceptance Testing 15/06/2012
shown are Figure 8. These pop-ups remain displayed until their close button is selected – the cross (X) in the top right hand corner of the pop-up.
Figure 8: Displaying Impacts
2.4 Error Messages
There are some error conditions that may occur when using the portal. These are described below.
Boundary Layers The ABS Boundary Layers are overlaid onto the Google Map. On rare occasions, these layers do not load correctly. An example is shown in Figure 9. This is usually an intermittent problem which will go away after the user pans or zooms the map.

15/06/2012 Pilot Impacts Portal: User Acceptance Testing P a g e | 1 5
Figure 9: Boundary Layer problems
Error Message Pop-ups Error messages are reported using pop-ups. The message will be displayed in a pop-up and the user may have to use a button to make the pop-up close. Figure 10 shows a message that may result when displaying many events in the Map View.
Figure 10: Unresponsive Error Message
Message Pop-ups Two other message pop-ups are shown below. The first is displayed when no historical event data is found for a chosen time period, see Figure 11. This example is obtained when using the data range of 1800 to 1850 on the Historical Events Accordion Tab in the Map View.

P a g e | 16 Pilot Impacts Portal: User Acceptance Testing 15/06/2012
Figure 11: No historical data available message
A similar message may occur when historical events exist for a specified date range but not for the specific events chosen by the user. Refer to Figure 12. This example was obtained by selecting only earthquake events on the Historical Events Accordion Tab in the Map View with a date range of 2000 to 2012. As the message below indicates, event information exists for this time period, but not earthquake events.
Figure 12: No historical event data visible message.

15/06/2012 Pilot Impacts Portal: User Acceptance Testing P a g e | 1 7
3 UAT: Impacts Framework
Pilot Impacts Portal – Test Script # 1
System Feature Theme: Impacts Framework Browser: Please specify one of: IE, Firefox,
Chrome, Safari
Version #: Include the version number
Test Date:
Start Time:
End Time:
Tester Name: Your name Platform: Please specify one of the following:
Windows XP, Windows 7
Attempt Number: Is this the first, second,
etc attempt at performing the test
3.1 Introduction
The portal user will be able to explore the content of the Impacts Framework by navigating it in terms of the disaster category (bushfire, cyclone, flood, and so on), the event characteristics, the type of objects impacted by an event, the harm that results, and the economic, social and environmental impacts themselves.
Access to the Impacts Framework content will be enabled using predefined access paths with the user selecting from predefined choices. These choices are determined by the content of the Impacts Framework. For example, a user can select from the predefined collection of 11 natural disaster and fire emergency events; for example if a user selects a storm event, there will be four associated event characteristics (hail, lightning, rain or wind) and so on that the user can select from.
Once the user has identified a subset of information of interest from the Impacts Framework, it can be saved as a CSV or XML file.
While some aspects of the Pilot Impacts Portal require authentication, a username and password, access to the Impacts Framework does not.

P a g e | 18 Pilot Impacts Portal: User Acceptance Testing 15/06/2012
3.2 Functional Requirements Tested – Script 1
Functional requirement: NAV-Req1
Description: Allow the user to access the Impacts Framework content using predefined access paths.
Expected Results: The content of the Impacts Framework spreadsheet will be accessible using a web accessible user interface making the
information content more accessible to navigate than is currently possible using Microsoft Excel.
Functional requirement: NAV-Req2
Description: Allow the user to restrict the information returned using the predefined access paths. For example, only return environmental
impacts, not all impacts.
Expected Results: Present the content of the Impacts Framework chosen by the user in different ways to allow different methods of exploring
the identified information.
Functional requirement: EXT-Req1
Description: Extract a subset of the Impacts Framework as a CSV or XML file.
Expected Results: Save the Impacts Framework content chosen by the user as a CSV or XML file.
Functional requirement: USR-Req2
Description: Access to the Impacts Framework data item component of the portal does not require a user to login.
Expected Results: Direct access to the Impacts Framework content using the Pilot Impacts Portal.

15/06/2012 Pilot Impacts Portal: User Acceptance Testing P a g e | 1 9
3.3 Tasks
The following steps are to be performed by the tester to complete script 1.
No. Objective Tester Action Expected Result Actual Result Pass/Fail
1 Begin test. Start a web browser.
Fill in the details in the header of the test script above noting who the tester is, the operating platform, browser and versions.
Web browser started and connected to the internet.
2 Access the Pilot Impacts Portal Framework Explorer web page.
Open the URL:
http://www.fend.org.au/
This will be redirected to:
http://www.fend.org.au/portal/
See Figure 13.
3 Access the Pilot Impacts Portal Framework Explorer web page.
Select the second tab labelled “Framework” on the Navigation Bar.
The Framework Explorer web page is displayed.
See Figure 14.
4 Investigate impacts about ground collapse resulting from earthquakes.
In the Event drop down list, select “Earthquake”.
The Event selection is changed to “Earthquake”.
5 In the Event Characteristic drop down list, select “Ground collapse”.
The Event Characteristics selection is changed to “Ground collapse”.
6 Show the impacts resulting from destroyed public roads.
In the Object Category drop down list, select “Infrastructure – Public (excl. parks and reserves)”.
The Object Category selection is changed to “Infrastructure – Public (excl. parks and reserves)”.

P a g e | 20 Pilot Impacts Portal: User Acceptance Testing 15/06/2012
No. Objective Tester Action Expected Result Actual Result Pass/Fail
7 In the Object drop down list, select “Roads”.
The Object selection is changed to “Roads”.
8 In the Harm drop down list, select “Destroyed”.
The Harm selection is changed to “Destroyed”.
9 Press the Find Impacts button. The results section at the bottom of the web page is updated showing the found impacts.
The impacts first shown are the direct impacts. There is only one for this example.
The result will be the same as shown in Figure 15.
10 Examine the indirect impacts.
There are two categories of impacts defined by the Impacts Framework: direct and indirect.
Direct impacts occur as an immediate consequence of the event. Indirect impacts occur as a consequence of the previous impact.
In the results section of the Framework Explorer, the Tree View option should be displayed. See Figure 15.
Expand the impact description
by pressing the icon on the left.
Three indirect impacts that may result from the original impacts are displayed.
See Figure 16.
11 Repeat step 10 six more times. A further 8 indirect impacts are shown.
See Figure 17.

15/06/2012 Pilot Impacts Portal: User Acceptance Testing P a g e | 2 1
No. Objective Tester Action Expected Result Actual Result Pass/Fail
12 Use the Table view results to view all impacts.
The Tree View uses indentation to distinguish the different impact levels while the Table View presents the related impacts in the same row. Note that in the Table View, repeated impacts are greyed.
In the results section of the Framework Explorer, select the Table View option.
Use the scroll bar in the results section as required to view all the impacts information.
The result will be as shown in Figure 18.
The same information is displayed but using a different structure.
13 Examine the economic impacts.
The impacts, both direct and indirect, may be classified as being economic, social or environmental. Note that not all impacts are classified into one of these three options.
In the results section of the Framework Explorer, select the Economic Impacts option.
Economic impacts are indicated as such in the Tree View and Table View using the following
icon: .
The user can view the impacts by their category without regard to the direct/indirect hierarchy.
The result will be the same as shown in Figure 19.
14 Examine the social impacts. In the results section of the Framework Explorer, select the Social Impacts option.
Social impacts are indicated as such in the Tree View and Table View using the following icon:
.
The result will be the same as shown in Figure 20.

P a g e | 22 Pilot Impacts Portal: User Acceptance Testing 15/06/2012
No. Objective Tester Action Expected Result Actual Result Pass/Fail
15 Examine the environmental impacts.
In the results section of the Framework Explorer, select the Environmental Impacts option.
Environmental impacts are indicated as such in the Tree View and Table View using the
following icon: .
The result will be the same as shown in Figure 21.
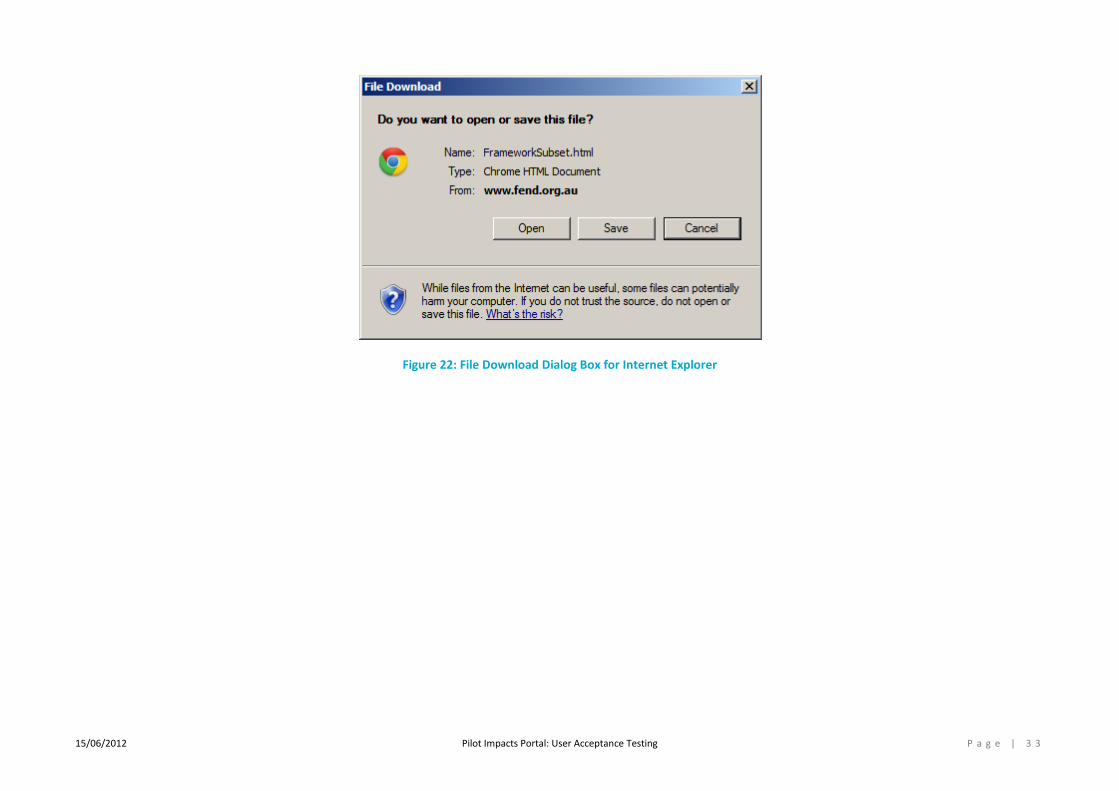
16 Download the discovered impacts as a HTML file.
Below the results section of the Framework Explorer are two links that allow a user to download the identified impacts.
Select the “HTML” link. A browser specific file download dialog box will be displayed, see Figure 22. The user can choose to save the file or open it.
Save the file to the desktop.
17 View the downloaded HTML file.
Open the downloaded HTML file in a browser.
Either double-click the file icon or drag the file icon over the browser window.
The contents of the file will be displayed in a browser.
The result will be the same as shown in Figure 23.
18 Download the discovered impacts as a CSV file.
Below the results section of the Framework Explorer are two links that allow a user to download the identified impacts.
Select the “CSV” link. A browser specific file download dialog box will be displayed, similar to Figure 22. The name of the file will be different.
The user can choose to save the file or open it.
Save the file to the desktop

15/06/2012 Pilot Impacts Portal: User Acceptance Testing P a g e | 2 3
No. Objective Tester Action Expected Result Actual Result Pass/Fail
19 View the downloaded CSV file.
Note: on Windows 7, WordPad is available from the Start menu and following All Programs, then Accessories.
Open the downloaded file in Microsoft Excel or using WordPad.
The CSV file is expected to be used by software and is not structured to be viewed by the user.
The contents of the downloaded file will be displayed.
The result will be the same as shown in Figure 24 when viewed using WordPad.
20 Compare the results with the Impacts Framework MS Excel spreadsheet.
The impacts in the example presented above can be verified to be correct in terms of the original Impacts Framework XLS spreadsheet.
Open the Impacts Framework MS Excel spreadsheet2.
Display the corresponding section as follows:
1. For help with the Impacts Framework spreadsheet, refer to the Introduction worksheet.
2. Open the earthquake worksheet.
3. In the “Ground collapse” Event Characteristic, open the “Infrastructure - Public (excl. parks and reserves)” impacts.
The content shown in the spreadsheet should correspond to the Figure 25.
There are 5 rows present which corresponds to the Table View of Figure 18.
2 The Excel spreadsheet is available from the FRNSW Impacts Project web page: http://www.fire.nsw.gov.au/page.php?id=914.

P a g e | 24 Pilot Impacts Portal: User Acceptance Testing 15/06/2012
Figure 13: Pilot Impacts Portal

15/06/2012 Pilot Impacts Portal: User Acceptance Testing P a g e | 2 5
Figure 14: Impacts Framework Explorer

P a g e | 26 Pilot Impacts Portal: User Acceptance Testing 15/06/2012
Figure 15: Earthquake Impacts

15/06/2012 Pilot Impacts Portal: User Acceptance Testing P a g e | 2 7
Figure 16: First Indirect Impacts

P a g e | 28 Pilot Impacts Portal: User Acceptance Testing 15/06/2012
Figure 17: All Indirect Impacts

15/06/2012 Pilot Impacts Portal: User Acceptance Testing P a g e | 2 9
Figure 18: Impacts displayed using Table View

P a g e | 30 Pilot Impacts Portal: User Acceptance Testing 15/06/2012
Figure 19: Economic Impacts

15/06/2012 Pilot Impacts Portal: User Acceptance Testing P a g e | 3 1
Figure 20: Social Impacts

P a g e | 32 Pilot Impacts Portal: User Acceptance Testing 15/06/2012
Figure 21: Environmental Impacts
15/06/2012 Pilot Impacts Portal: User Acceptance Testing P a g e | 3 3
Figure 22: File Download Dialog Box for Internet Explorer

P a g e | 34 Pilot Impacts Portal: User Acceptance Testing 15/06/2012
Figure 23: Downloaded HTML file

15/06/2012 Pilot Impacts Portal: User Acceptance Testing P a g e | 3 5
"Direct Impact Category","Direct Impact","Direct Impact Data Item","Indirect Impact Level 1 Category","Indirect Impact Level 1","Indirect Impact Level 1 Data Item","Indirect Impact Level 2 Category","Indirect Impact Level 2","Indirect Impact Level 2 Data Item","Indirect Impact Level 3 Category","Indirect Impact Level 3","Indirect Impact Level 3 Data Item","Indirect Impact Level 4 Category","Indirect Impact Level 4","Indirect Impact Level 4 Data Item","Indirect Impact Level 5 Category","Indirect Impact Level 5","Indirect Impact Level 5 Data Item"
economic,"Destruction of Roads","(km's of roads destroyed)",,"Use of alternative route to reach destination",,economic,"Increased petrol costs for individuals and businesses","(cost of additional petrol)",,,,,,,,,
,,,,,,economic,"Increased time required to reach destination","(additional time required to reach destination)",,,,,,,,,
,,,economic,"Unable to leave residence / town, as road was only way in and out","(no. of people isolated)",economic,"For businesses, loss of income, as movement of goods out of the town and people into the towm has stopped","(loss in revenue for affected businesses)",economic,"Employees laid off","(no. of employees laid off)",,"Pressure to find another job",,social,"Decrease in mental health (i.e. stress, anxiety)","(medical costs / cost of professional counselling)"
,,,,,,social,"Feelings of isolation","(no. of people taking time off work or school)",social,"Decrease in mental health (i.e. stress, anxiety)","(medical costs / cost of professional counselling)",,,,,,
,,,economic,"Replace roads","(cost of replacing roads)",,,,,,,,,,,,
Figure 24: Downloded CSV file

P a g e | 36 Pilot Impacts Portal: User Acceptance Testing 15/06/2012
Figure 25: Impacts Framework XLS Earthquake Impacts

15/06/2012 Pilot Impacts Portal: User Acceptance Testing P a g e | 3 7
4 UAT: User Registration
Pilot Impacts Portal – Test Script # 2
System Feature Theme: User Registration Browser: Please specify one of: IE, Firefox,
Chrome, Safari
Version #: Include the version number
Test Date:
Start Time:
End Time:
Tester Name: Your name Platform: Please specify one of the following:
Windows XP, Windows 7
Attempt Number: Is this the first, second,
etc attempt at performing the test
4.1 Introduction
Users are required to register to access the mapping and feedback components of the portal. Registration requires an email address which is used as the user name to access the portal. A user self registers by completing a registration web form. Once submitted the user is sent an email including a URL link to activate the newly created user account plus URL links to the copyright and terms and conditions. A user can change some of their registration details.
The aim is for users to be self managing. There is online help available for the portal and user feedback can be submitted using the online web form available on the web or by contacting to the site administrator using the [email protected] email address.

P a g e | 38 Pilot Impacts Portal: User Acceptance Testing 15/06/2012
4.2 Functional Requirements Tested – Script 2
Functional requirement: USR-Req1
Description: Include a terms and conditions statement for using the Pilot Impacts Portal
Expected Results: The user has access to the terms and conditions for using the Pilot Impacts Portal and they are easily identifiable.
Functional requirement: USR-Req3
Description: The user must agree to the terms and conditions before being allocated a username
Expected Results: Registration is only successful if the user accepts the terms and conditions.
Functional requirement: USR-Req4
Description: Access to the content of the Pilot Impacts Portal requires the user to login using their allocated username
Expected Results: The mapping component and the user feedback form require the user to login to the portal. If a user tries to access the
mapping component without first logging in, they will be presented with the login form. When a user is logged in and they
access the “Contact Us” page, a web form is available to provide feedback; otherwise a web page is shown with the contact
details of the portal administrator.
Functional requirement: USR-Req11
Description: Provide a web form to allow a potential new user to request a user account to access the portal
Expected Results: The user can access the registration web form to successfully register to create an account to login to the portal.

15/06/2012 Pilot Impacts Portal: User Acceptance Testing P a g e | 3 9
Functional requirement: MSC-Req1
Description: Provide online user documentation
Expected Results: Online user documentation is available to the user.
Functional requirement: MSC-Req3
Description: Include a disclaimer on the Pilot Impacts Portal indicating that the contents are made available from various data custodians
and that this information may be incomplete or inaccurate
Expected Results: The disclaimer is part of the general disclaimer for all CSIRO managed web sites. There is also an “Acknowledgements” web
page showing the different data sources available in the portal, the third party software used to develop the portal and the
icons used.
Functional requirement: MSC-Req4
Description: Allow a user to provide a comment on their experience of using the portal or pose a question.
Expected Results: A user must be logged in to the portal in order to access the feedback form. This is a web form allowing the user to make a
comment on the system or to provide feedback. The comments are emailed to the portal administrator.

P a g e | 40 Pilot Impacts Portal: User Acceptance Testing 15/06/2012
4.3 Tasks
The following steps are to be performed by the tester.
No. Objective Tester Action Expected Result Actual Result Pass/Fail
1 Begin test. Start a web browser.
Fill in the details in the header of the test script above noting who the tester is, the operating system, browser and versions.
Web browser started and connected to the internet.
2 Access the home page.
The user must not already have a portal account. If they do and they want to reuse this account to test the registration process, please send an email to [email protected] to remove the existing account.
Open the URL:
http://www.fend.org.au/
This will be redirected to:
http://www.fend.org.au/portal/
3 Access the registration web form.
Click the “Register” link.
Figure 26 shows the Pilot Impacts Portal home page with 3 circles indicating where the “Register” link is, three tabs on the Navigation Bar that will be explored in this test script and the links to the Copyright statement and Legal notice and disclaimer.
The user will be presented with the Pilot Impacts Portal Registration form.
An example is shown in Figure 27. Note that the CAPTCHA word will be different.

15/06/2012 Pilot Impacts Portal: User Acceptance Testing P a g e | 4 1
No. Objective Tester Action Expected Result Actual Result Pass/Fail
4 Complete the form by filling in the details.
The user must have an email account from one of the nominated organisations listed at:
http://www.fend.org.au/pipadmin/admin_orgs.jsp
A user account can be created by the portal administrator if this is not the case. Please contact: [email protected].
The user must agree to the Copyright and Legal Notice and Disclaimer before the “Register” submit button becomes active.
The user must also enter the generated CAPTCHA word. This is to ensure a person is creating a user account and not a software agent.
The user is able to provide the necessary registration information.
An example completed form is shown in Figure 28.
5 Register. Click the “Register” button to create an account.
If there are any problems, try to register again by clicking the “Register” submit button.
The CAPTCHA word has an expiry time – if the user takes too long to register, then the word will expire and a new one will be needed. This is achieved by reloading the registration page.
Please contact the administrator if they are continued problems.
When registration is successful, the user is informed as shown in Figure 29.
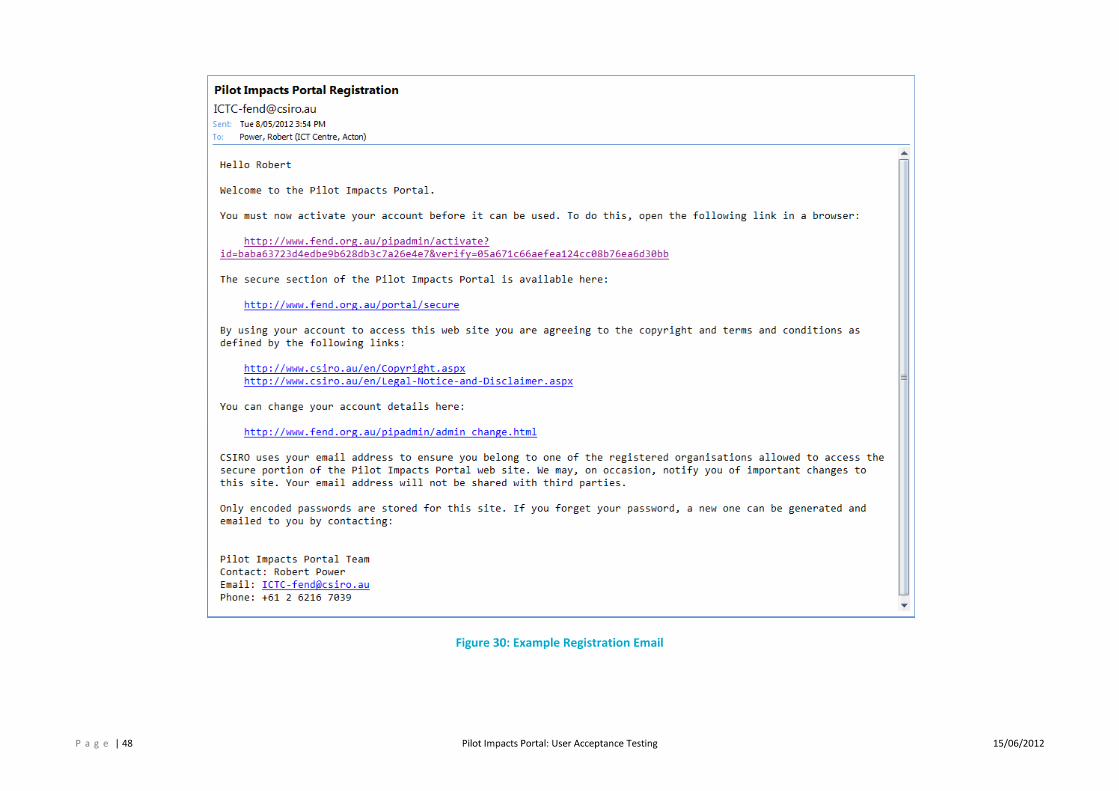
6 Review the activation email.
When registration is successful, the user will receive an activation email.
The user account cannot be used until it is activated. If the user attempts to do so, they are presented with the message shown in Figure 31.
An example email is shown in Figure 30.

P a g e | 42 Pilot Impacts Portal: User Acceptance Testing 15/06/2012
No. Objective Tester Action Expected Result Actual Result Pass/Fail
7 Activate the account. Open the activation URL in a browser.
If there are any problems, try to activate again.
A registration successful message will be shown, similar to Figure 32.
8 Open the “Contact Us” page.
Click the “Contact Us” tab on the Navigation Bar.
This step is to show the different pages displayed before and after logging in to the portal.
The contact details of the Pilot Impacts Portal are displayed as shown in Figure 33.
9 Login. Open the Pilot Impacts Portal home page:
http://www.fend.org.au/portal/
and click the “Login” link.
Enter your user name (full email address) and password. Then click the "Log In" button.
The Login page is displayed, see Figure 34.
10 View the secure Pilot Impacts Portal page.
The secure Pilot Impacts Portal home page is:
https://www.fend.org.au/portal/secure/
Note the use of https in the URL.
The “Map” tab on the Navigation Bar is now accessible
The secure home page is shown in Figure 35. The differences between the secure home page and the original one (Figure 26) are highlighted.
11 Open the “Contact Us” page.
Click the “Contact Us” tab on the Navigation Bar.
Compare the content with Figure 33 in step 8 above.
The feedback form is displayed as shown in Figure 36.

15/06/2012 Pilot Impacts Portal: User Acceptance Testing P a g e | 4 3
No. Objective Tester Action Expected Result Actual Result Pass/Fail
12 Enter a comment. Choose a “Feedback Type” from the drop down list and then enter some text in the form.
Click the “Submit Feedback” button.
The following message is displayed to the user below the “Submit Feedback” button:
Thank you for your feedback!
The feedback is sent as an email to: [email protected] and is recorded in a database along with the email address (portal user name) of the user providing the feedback.
13 Review the user documentation.
Select the fifth tab labelled “Help” on the Navigation Bar.
Use the scroll bar on the right to review the help content.
The help page is displayed as shown in Figure 37.
14 Review the “Acknowledgments” page.
Select the sixth tab labelled “Acknowledgements”.
Use the scroll bar on the right to review the help content.
The acknowledgements page is displayed as shown in Figure 38.

P a g e | 44 Pilot Impacts Portal: User Acceptance Testing 15/06/2012
Figure 26: Pilot Impacts Portal home page highlighting areas being tested

15/06/2012 Pilot Impacts Portal: User Acceptance Testing P a g e | 4 5
Figure 27: Registration Form

P a g e | 46 Pilot Impacts Portal: User Acceptance Testing 15/06/2012
Figure 28: Example Completed Registration Form

15/06/2012 Pilot Impacts Portal: User Acceptance Testing P a g e | 4 7
Figure 29: Successful Registration Message
P a g e | 48 Pilot Impacts Portal: User Acceptance Testing 15/06/2012
Figure 30: Example Registration Email

15/06/2012 Pilot Impacts Portal: User Acceptance Testing P a g e | 4 9
Figure 31: Inactivated Account Message

P a g e | 50 Pilot Impacts Portal: User Acceptance Testing 15/06/2012
Figure 32: Activation Successful Message

15/06/2012 Pilot Impacts Portal: User Acceptance Testing P a g e | 5 1
Figure 33: The Contact Us Page

P a g e | 52 Pilot Impacts Portal: User Acceptance Testing 15/06/2012
Figure 34: Login Page

15/06/2012 Pilot Impacts Portal: User Acceptance Testing P a g e | 5 3
Figure 35: The Secure Home Page

P a g e | 54 Pilot Impacts Portal: User Acceptance Testing 15/06/2012
Figure 36: The Contact Us Feedback Form

15/06/2012 Pilot Impacts Portal: User Acceptance Testing P a g e | 5 5
Figure 37: The Online Help Page

P a g e | 56 Pilot Impacts Portal: User Acceptance Testing 15/06/2012
Figure 38: The Acknowledgements Page

15/06/2012 Pilot Impacts Portal: User Acceptance Testing P a g e | 5 7
5 UAT: Map GUI Navigation
Pilot Impacts Portal – Test Script # 3
System Feature Theme: Map GUI Navigation Browser: Please specify one of: IE, Firefox,
Chrome, Safari
Version #: Include the version number
Test Date:
Start Time:
End Time:
Tester Name: Your name Platform: Please specify one of the following:
Windows XP, Windows 7
Attempt Number: Is this the first, second,
etc attempt at performing the test
5.1 Introduction
The Pilot Impacts Portal will include a map based interface to allow the user to navigate to an area of interest. As the zoom level passes a predefined level, new geographic data layers will become visible to the user. These layers can then be enabled or disabled by the user and are again removed from view when the zoom level threshold is again passed. The geographic data items may be linked to the corresponding elements of the Impacts Framework.
Users are required to register to access the mapping components of the portal. Test Script # 2 should be completed prior to performing this one.
The baseline data items provide context for a fire emergency or natural disaster event described by the Impacts Framework. This data includes geographic information describing the built environment, local government boundaries, residential zoning, land use details and demographics as well as information described by the Impacts Framework such as bridges, road signage, fencing, national park facilities (BBQs, shower blocks, tables and chairs, shelters, toilets), telephone poles, the electricity network, walking trails, fire towers, field crops and so on.

P a g e | 58 Pilot Impacts Portal: User Acceptance Testing 15/06/2012
5.2 Functional Requirements Tested – Script 3
Functional requirement: GUI-Req1
Description: The map will be navigable using pan and zoom operations
Expected Results: The user will be able to pan and zoom the map in multiple ways.
Functional requirement: GUI-Req3
Description: The map will include geographic layers of baseline data items
Expected Results: The user will be able to recognise different baseline data items available in the portal.
Functional requirement: GUI-Req4
Description: Data layers will be enabled and disabled depending on the zoom level
Expected Results: The user will understand when and why layers are enabled and disabled automatically when navigating the map.
Functional requirement: GUI-Req6
Description: An enabled layer can be disabled by the user
Expected Results: The user will be able to turn layers on (enabled) and off (disabled).

15/06/2012 Pilot Impacts Portal: User Acceptance Testing P a g e | 5 9
5.3 Tasks
The following tasks will demonstrate how to navigate the mapping component of the portal.
No. Objective Tester Action Expected Result Actual Result Pass/Fail
1 Begin test. Start a web browser.
Fill in the details in the header of the test script above noting who the tester is, the operating system, browser and versions.
Web browser started and connected to the internet.
2 Access the Map View component of the Pilot Impacts Portal.
Open the URL:
http://www.fend.org.au/
Select the “Map” tab on the Navigation Bar.
The user will be prompted to login.
The URL will be redirected to:
http://www.fend.org.au/portal/
The user will successfully login and be presented with a map as shown in Figure 39.
3 Review the Accordion Tabs.
On the right of the map are a number of display elements organised as an accordion. Only one display element is visible at a time. Note that the state (contents) of each element is maintained as the accordion view is changed.
Select the various tabs available in the accordion view.
The user will be comfortable with switching between the following tabs:
Layers
Locations
Building Information
Historical Events
Reports
P a g e | 60 Pilot Impacts Portal: User Acceptance Testing 15/06/2012
No. Objective Tester Action Expected Result Actual Result Pass/Fail
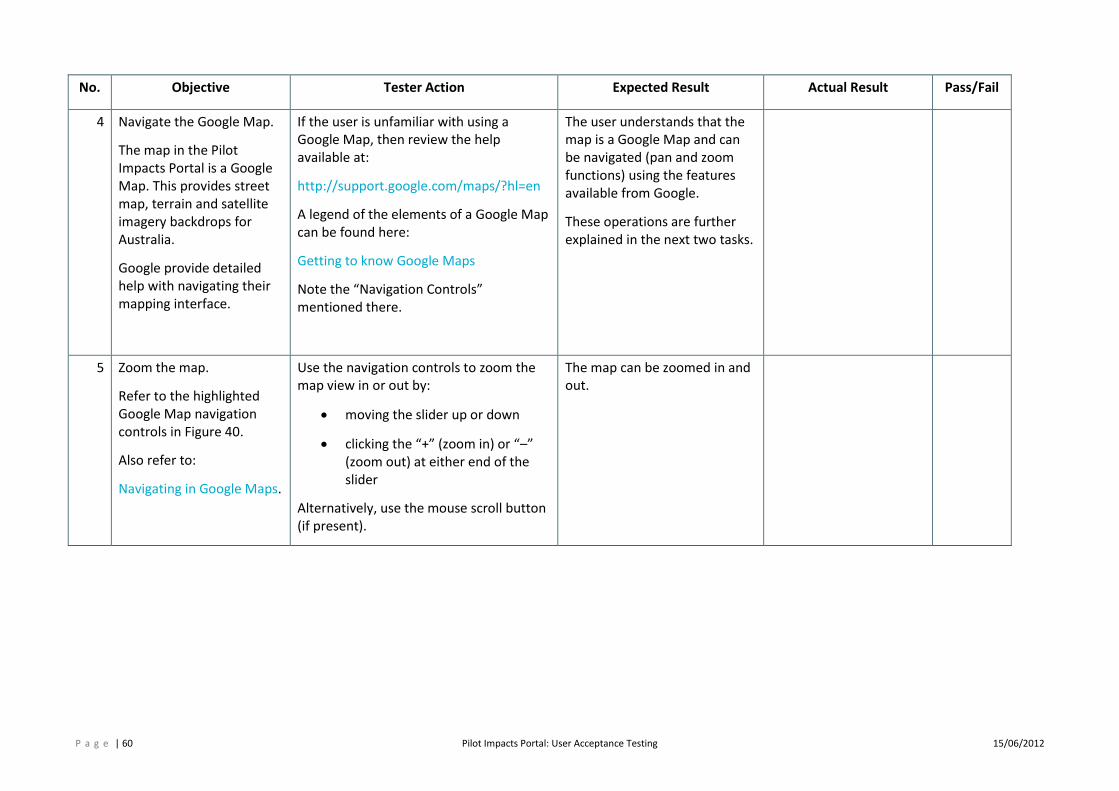
4 Navigate the Google Map.
The map in the Pilot Impacts Portal is a Google Map. This provides street map, terrain and satellite imagery backdrops for Australia.
Google provide detailed help with navigating their mapping interface.
If the user is unfamiliar with using a Google Map, then review the help available at:
http://support.google.com/maps/?hl=en
A legend of the elements of a Google Map can be found here:
Getting to know Google Maps
Note the “Navigation Controls” mentioned there.
The user understands that the map is a Google Map and can be navigated (pan and zoom functions) using the features available from Google.
These operations are further explained in the next two tasks.
5 Zoom the map.
Refer to the highlighted Google Map navigation controls in Figure 40.
Also refer to:
Navigating in Google Maps.
Use the navigation controls to zoom the map view in or out by:
moving the slider up or down
clicking the “+” (zoom in) or “–” (zoom out) at either end of the slider
Alternatively, use the mouse scroll button (if present).
The map can be zoomed in and out.
15/06/2012 Pilot Impacts Portal: User Acceptance Testing P a g e | 6 1
No. Objective Tester Action Expected Result Actual Result Pass/Fail
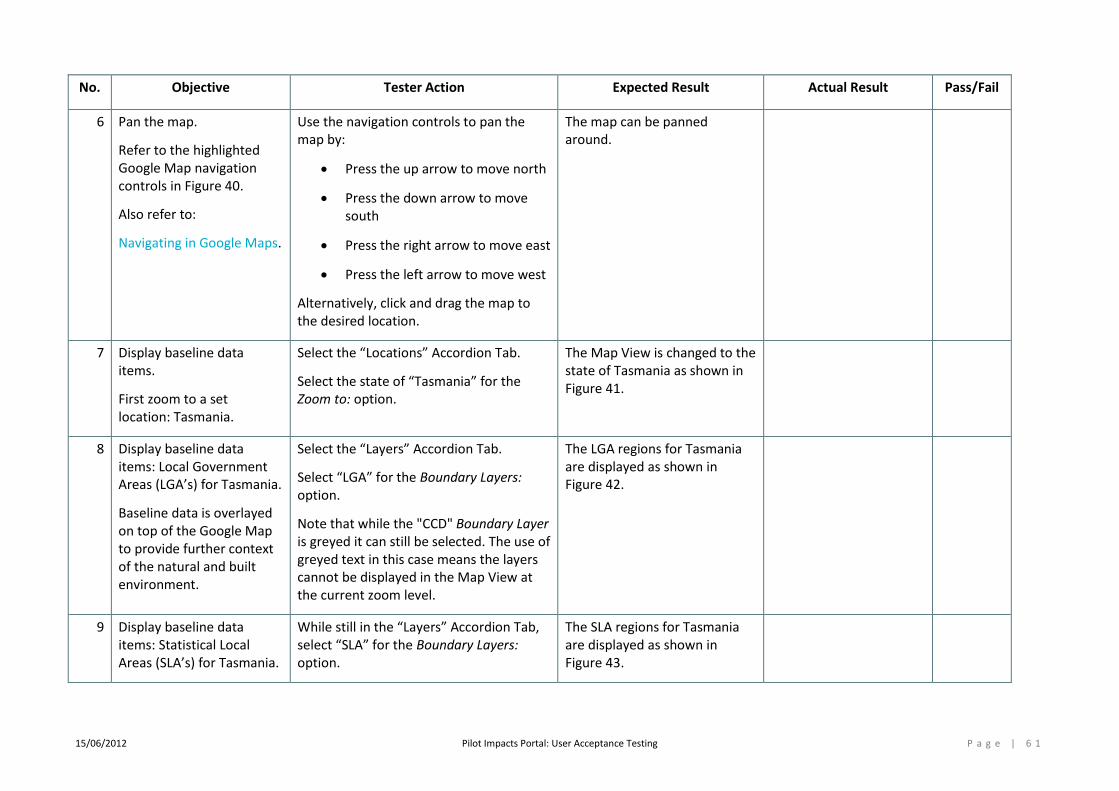
6 Pan the map.
Refer to the highlighted Google Map navigation controls in Figure 40.
Also refer to:
Navigating in Google Maps.
Use the navigation controls to pan the map by:
Press the up arrow to move north
Press the down arrow to move south
Press the right arrow to move east
Press the left arrow to move west
Alternatively, click and drag the map to the desired location.
The map can be panned around.
7 Display baseline data items.
First zoom to a set location: Tasmania.
Select the “Locations” Accordion Tab.
Select the state of “Tasmania” for the Zoom to: option.
The Map View is changed to the state of Tasmania as shown in Figure 41.
8 Display baseline data items: Local Government Areas (LGA’s) for Tasmania.
Baseline data is overlayed on top of the Google Map to provide further context of the natural and built environment.
Select the “Layers” Accordion Tab.
Select “LGA” for the Boundary Layers: option.
Note that while the "CCD" Boundary Layer is greyed it can still be selected. The use of greyed text in this case means the layers cannot be displayed in the Map View at the current zoom level.
The LGA regions for Tasmania are displayed as shown in Figure 42.
9 Display baseline data items: Statistical Local Areas (SLA’s) for Tasmania.
While still in the “Layers” Accordion Tab, select “SLA” for the Boundary Layers: option.
The SLA regions for Tasmania are displayed as shown in Figure 43.

P a g e | 62 Pilot Impacts Portal: User Acceptance Testing 15/06/2012
No. Objective Tester Action Expected Result Actual Result Pass/Fail
10 Demonstrate that baseline layers are enabled only when the zoom level is past a threshold.
Select the “Locations” Accordion Tab.
The state of Tasmania should still be selected. Now enter the following for the other Zoom to: options:
Statistical Division: Greater Hobart
Statistical Subdivision:
Greater Hobart
Statistical Local Area (SLA):
Hobart (C) Remainder
The Map View is as shown in Figure 44.
11 Display baseline data items: Census Collection Districts (CCD’s) for the SLA “Hobart (C) Remainder”.
Select the “Layers” Accordion Tab.
Note that the “CCD” Boundary Layer is not available (it is greyed out).
Now click the “+” on the navigation control to zoom the map view one “level”.
Now the “CCD” Boundary Layer is available – select the “CCD” option.
The Map View is as shown in Figure 45.
Note the information in the “Layers” Accordion Tab includes information about the selected layer under the heading: Highlighted area:
The chosen SLA is drawn in yellow. This can be seen in Figures 44 and 45.
12 Turn off the boundary layers.
While still in the “Layers” Accordion Tab, select “None” for the Boundary Layers: option.
The boundary layer is removed.
Note the highlighted area remains as a yellow region on the Map View.
15/06/2012 Pilot Impacts Portal: User Acceptance Testing P a g e | 6 3
No. Objective Tester Action Expected Result Actual Result Pass/Fail
13 Explore the boundary layers and the pan and zoom functions.
The tester is encouraged to explore the pan and zoom functions, turning on/off the different boundary layers and to observe when the LGA, SLA and CCD boundary layers are enabled or disabled depending on the map zoom level.
The user is familiar with the pan and zoom functions and turning on/off the different boundary layers.

P a g e | 64 Pilot Impacts Portal: User Acceptance Testing 15/06/2012
Figure 39: Pilot Impacts Portal Map Component

15/06/2012 Pilot Impacts Portal: User Acceptance Testing P a g e | 6 5
Figure 40: Google Map Navigation Controls

P a g e | 66 Pilot Impacts Portal: User Acceptance Testing 15/06/2012
Figure 41: Map View of Tasmania

15/06/2012 Pilot Impacts Portal: User Acceptance Testing P a g e | 6 7
Figure 42: LGA Boundaries for Tasmania

P a g e | 68 Pilot Impacts Portal: User Acceptance Testing 15/06/2012
Figure 43: SLA Boundaries for Tasmania

15/06/2012 Pilot Impacts Portal: User Acceptance Testing P a g e | 6 9
Figure 44: The "Hobart (C) - Remainder" SLA

P a g e | 70 Pilot Impacts Portal: User Acceptance Testing 15/06/2012
Figure 45: CCD Boundary Layers for "Hobart (C) - Remainder"

15/06/2012 Pilot Impacts Portal: User Acceptance Testing P a g e | 7 1
6 UAT: Map GUI Locations
Pilot Impacts Portal – Test Script # 4
System Feature Theme: Map GUI Locations Browser: Please specify one of: IE, Firefox,
Chrome, Safari
Version #: Include the version number
Test Date:
Start Time:
End Time:
Tester Name: Your name Platform: Please specify one of the following:
Windows XP, Windows 7
Attempt Number: Is this the first, second,
etc attempt at performing the test
6.1 Introduction
The Pilot Impacts Portal Map View can be focused (zoomed) to a known location in a number of ways:
choosing a state or territory;
entering a Local Government Area (LGA) name;
entering a Statistical Local Area (SLA) name;
typing a location to search for.
The Map View “Layers” and “Locations” Accordion Tabs have interrelated functionality which presents the user with different options when navigating the map interface to a specific location. Some of these features were demonstrated in Test Script 3 where the aim was to demonstrate the Map View functionality. This test script shows all the different ways of navigating the Map View interface to a known location.

P a g e | 72 Pilot Impacts Portal: User Acceptance Testing 15/06/2012
6.2 Functional Requirements Tested – Script 4
Functional requirement: GUI-Req2
Description: The map will be navigable by the user providing location information, such as a town, suburb, or postcode
Expected Results: The user will be able to navigate to a location in the various ways described above.

15/06/2012 Pilot Impacts Portal: User Acceptance Testing P a g e | 7 3
6.3 Tasks
The following tasks will demonstrate how to navigate the mapping component of the portal to a specific location.
No. Objective Tester Action Expected Result Actual Result Pass/Fail
1 Begin test. Start a web browser.
Fill in the details in the header of the test script above noting who the tester is, the operating system, browser and versions.
Web browser started and connected to the internet.
2 Access the map component of the Pilot Impacts Portal.
Open the URL:
http://www.fend.org.au/
Select the “Map” tab on the Navigation Bar.
The user will be prompted to login.
The URL will be redirected to:
http://www.fend.org.au/portal/
The user will successfully login and be presented with a map of Australia.
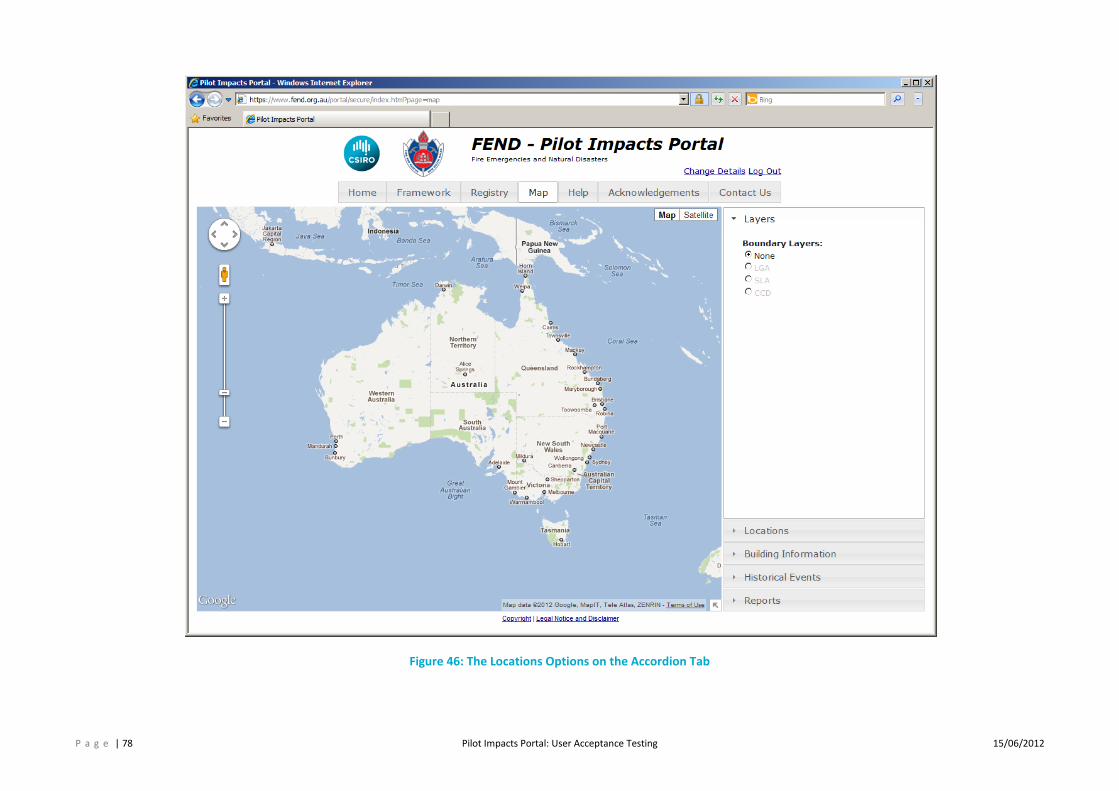
3 Understand the relationship between the “Layers” and “Locations” Accordion Tabs.
Select the “Locations” Accordion Tab.
There are three options available:
Zoom to
Enter an LGA or SLA
Enter a location
The Map View is as shown in Figure 46.
Make sure “None” is selected as the Boundary Layer in the “Layers” Accordion Tab.

P a g e | 74 Pilot Impacts Portal: User Acceptance Testing 15/06/2012
No. Objective Tester Action Expected Result Actual Result Pass/Fail
4 Show the Western Australian LGA layers.
Select “Western Australia” as the state to Zoom To.
Select the “Layers” Accordion Tab.
Select “LGA” as the Boundary Layer.
Select the “Locations” Accordion Tab again.
The Map View is as shown in Figure 47.
Note there is now an extra option available for Zoom To – there is a drop down list of available LGA regions.
5 Show the WA Albany LGA. Select “Albany (C)” for the LGA. The Map View is as shown in Figure 48.
Note the region is now highlighted in yellow.
6 Show Western Australian SLA layers.
Select the “Layers” Accordion Tab.
Select the “SLA” option for Boundary Layers.
Select the “Locations” Accordion Tab again.
When on the “Layers” Accordion Tab, note the Highlighted area is shown as “LGA Albany (C)” as a result of the previous task.
The Map View is as shown in Figure 49.
Note there are now extra options available for Zoom To – there are three pull down lists of available allowing the user to choose a Statistical Division, Statistical Subdivision and Statistical Local Area (SLA).

15/06/2012 Pilot Impacts Portal: User Acceptance Testing P a g e | 7 5
No. Objective Tester Action Expected Result Actual Result Pass/Fail
7 Navigate to the “Albany (C) Bal” SLA.
The state of "Western Australia" should still be selected. Now enter the following for the other Zoom To options:
Statistical Division:
Lower Great Southern
Statistical Subdivision:
King
Statistical Local Area (SLA):
Albany (C) Bal
The Map View is as shown in Figure 50.
Note that the various options in the drop down lists must be completed in sequence. After choosing a Statistical Division, the Statistical Subdivision pull down list is populated. Then when one of these is chosen, the SLA pull down list is populated and may be chosen from.
8 Return the map to its original view of the whole of Australia.
Select “None” for the Boundary Layers in the “Layers” Accordion Tab.
Clear the Highlighted area.
Click “Reset Zoom” in the “Locations” Accordion Tab.
The Map View is returned to its original state showing Australia with no boundary layers.
Note the user may need to use the scroll bar in the “Locations” Accordion Tab to be able to access the “Reset Zoom” button.

P a g e | 76 Pilot Impacts Portal: User Acceptance Testing 15/06/2012
No. Objective Tester Action Expected Result Actual Result Pass/Fail
9 Navigate to the Albany LGA. While in the “Locations” Accordion Tab, enter the letters “alb” in the text box labelled Enter LGA:
The user will be presented with a choice of known LGA’s throughout Australia that match the first three characters entered. The possible matches are:
Albany (C)
Albury (C)
The Map View is as shown in Figure 51.
The user can either choose the first to select Albany, or continue typing. Note the matching is case insensitive.
The Map View will be updated to show the Albany LGA, as shown in Figure 52. Note there are no boundary layers shown.
10 Navigate to the Albany Creek SLA.
While in the “Locations” Accordion Tab, enter the letters “alb” in the text box labelled “Enter SLA:”.
Choose or type “Albany Creek”.
Use the Navigation Controls to zoom in and out. This SLA is near Brisbane.
The user will again be presented with a choice of matching SLA’s Australia. There are nine SLA’s that match “alb”. Note the matching is anywhere in the SLA name, not only the start.
Choosing the “Albany Creek” SLA will update the Map View as shown in Figure 53.
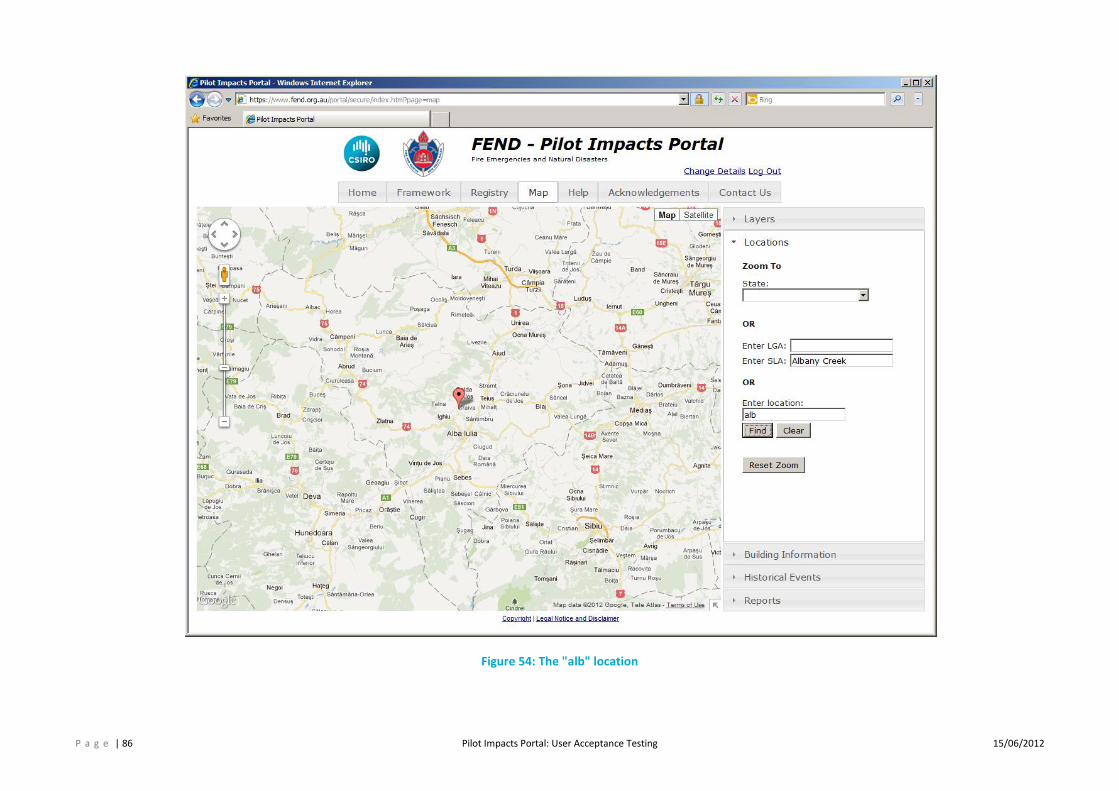
11 Navigate the Map View by entering a location.
The Google Map is global and not restricted to Australia.
In the “Locations” Accordion Tab, enter the letters “alb” in the text box labelled “Enter Location”.
Then click the “Find” button.
The Map View is as shown in Figure 54.
Use the Navigation Controls to zoom in and out: this location is in Romania!

15/06/2012 Pilot Impacts Portal: User Acceptance Testing P a g e | 7 7
No. Objective Tester Action Expected Result Actual Result Pass/Fail
12 Navigate the Map View by entering a location.
In the “Locations” Accordion Tab, enter the location “Albany Creek” in the text box labelled Enter Location.
Then click the “Find” button.
The Map View is as shown in Figure 53.
The SLA of “Albany Creek” near Brisbane is again shown.
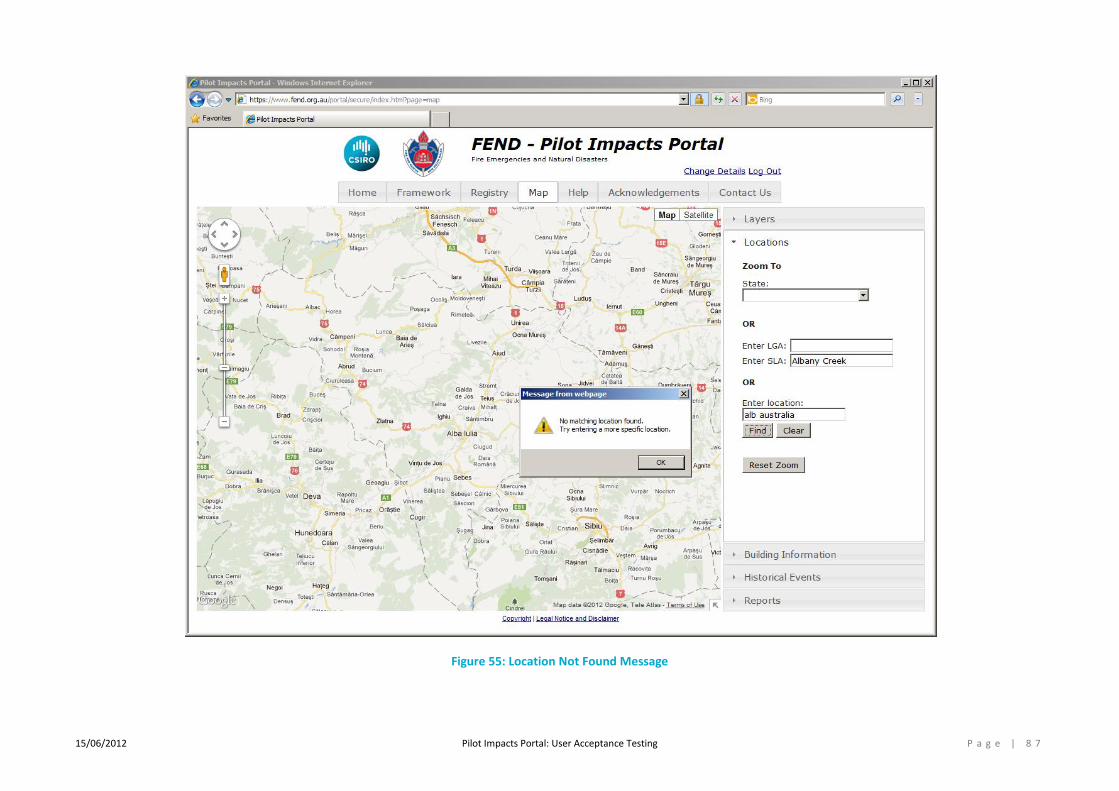
13 Navigate the Map View by entering a location.
In the “Locations” Accordion Tab, enter the location “alb australia” in the text box labelled “Enter Location”.
Then click the “Find” button.
The Map View is as shown in Figure 55.
The location could not be found and so an error pop-up is shown.
14 Navigate the Map View by entering a location.
In the “Locations” Accordion Tab, enter the location “albany australia” in the text box labelled “Enter Location”.
Then click the “Find” button.
The Map View is as shown in Figure 56.
The town of Albany in Western Australia is found.
15 Navigate the Map View by entering a location.
In the “Locations” Accordion Tab, enter the location “Springfield” in the text box labelled Enter Location.
Then click the “Find” button.
The location Springfield near Brisbane is found.
16 Navigate the Map View by entering a location and an Australian state.
Repeat the above task using the various Australian state and territory abbreviations: “Springfield ACT”, “Springfield NSW”, etc.
“Springfield” is found except for NT and ACT. When searching for “NT” an error is returned, while the “ACT” finds a location in the USA.
P a g e | 78 Pilot Impacts Portal: User Acceptance Testing 15/06/2012
Figure 46: The Locations Options on the Accordion Tab

15/06/2012 Pilot Impacts Portal: User Acceptance Testing P a g e | 7 9
Figure 47: The Western Australian LGA regions

P a g e | 80 Pilot Impacts Portal: User Acceptance Testing 15/06/2012
Figure 48: The WA "Albany (C)" LGA Region

15/06/2012 Pilot Impacts Portal: User Acceptance Testing P a g e | 8 1
Figure 49: The WA SLA Regions around Albany

P a g e | 82 Pilot Impacts Portal: User Acceptance Testing 15/06/2012
Figure 50: The WA "Albany (C) Bal" SLA Region

15/06/2012 Pilot Impacts Portal: User Acceptance Testing P a g e | 8 3
Figure 51: Starting the Navigation to the Albany LGA

P a g e | 84 Pilot Impacts Portal: User Acceptance Testing 15/06/2012
Figure 52: Completing the Navigation to the Albany LGA

15/06/2012 Pilot Impacts Portal: User Acceptance Testing P a g e | 8 5
Figure 53: The Albany Creek SLA
P a g e | 86 Pilot Impacts Portal: User Acceptance Testing 15/06/2012
Figure 54: The "alb" location
15/06/2012 Pilot Impacts Portal: User Acceptance Testing P a g e | 8 7
Figure 55: Location Not Found Message

P a g e | 88 Pilot Impacts Portal: User Acceptance Testing 15/06/2012
Figure 56: Albany Australia

15/06/2012 Pilot Impacts Portal: User Acceptance Testing P a g e | 8 9
7 UAT: Data Linkages
Pilot Impacts Portal – Test Script # 5
System Feature Theme: Data Linkages Browser: Please specify one of: IE, Firefox,
Chrome, Safari
Version #: Include the version number
Test Date:
Start Time:
End Time:
Tester Name: Your name Platform: Please specify one of the following:
Windows XP, Windows 7
Attempt Number: Is this the first, second,
etc attempt at performing the test
7.1 Introduction
The data items available in the Pilot Impacts Portal consist of the Impacts Framework, baseline (context information, refer to Test Script # 3), fire emergency and natural disaster event information and details of the impacts associated with these events.
The event and impacts data items are expected to relate to the Impacts Framework. For example, only event types found in the Impacts Framework are contained in the portal. There are no data items relating to heat waves or pandemics since these events are not in the Impacts Framework.
The linkage of the event and impacts data items to the Impacts Framework can be used in the portal: the user can navigate the map to discover data items of interest, then link to the Impacts Framework content. The reverse will be possible also: from the Impacts Framework, link to related data items. This link may be to the metadata description of the data items or allow the user to select instances of the data items by indicating a geographic region of interest, for example using a gazetteer, a local government area (LGA), statistical local area (SLA) or a census collection district (CCD).

P a g e | 90 Pilot Impacts Portal: User Acceptance Testing 15/06/2012
7.2 Functional Requirements Tested - Script 5
Functional requirement: LNK-Req1
Description: The user can find associated metadata of relevant data items while navigating the Impacts Framework
Expected Results: The user can find information about data items available in the portal based on the content of the Impacts Framework.
Functional requirement: LNK-Req2
Description: The user can find associated relevant data item instances while navigating the Impacts Framework by providing a location
of interest (for example using place name from a gazetteer, LGA, SLA or CCD)
Expected Results: The user can find information about data items available in the portal based on the content of the Impacts Framework and
for a specific region of interest based on a user specified location.
Functional requirement: GUI-Req8
Description: The user can find associated information from the Impacts Framework by selecting a data item on the map
Expected Results: The user is able to switch from the map component to the Impacts Framework component of the portal.

15/06/2012 Pilot Impacts Portal: User Acceptance Testing P a g e | 9 1
7.3 Tasks
The following tasks will demonstrate how to navigate the mapping component of the portal and to link to content in the Impacts Framework.
No. Objective Tester Action Expected Result Actual Result Pass/Fail
1 Begin test. Start a web browser.
Fill in the details in the header of the test script above noting who the tester is, the operating system, browser and versions.
Web browser started and connected to the internet.
2 Access the Pilot Impacts Portal – Map View by selecting the “Map” tab on the Navigation Bar.
Open the URL:
http://www.fend.org.au/
Click the “Map” tab on the Navigation Bar and login.
Refer to Test Script 2 for details of registering and logging in to the portal.
The user can access the Map View of the Pilot Impacts Portal.
3 Show all events for a given time period.
Select the “Historical Events” Accordion Tab.
Change the date range to be from 1980 to 2000.
Click the “Show” button.
20 years of events are displayed on the Map View as shown in Figure 57.
Make sure the “Only show events with impact data” is selected.
Note the “Show” button changes to be “Update”.

P a g e | 92 Pilot Impacts Portal: User Acceptance Testing 15/06/2012
No. Objective Tester Action Expected Result Actual Result Pass/Fail
4 Turn off (hide) some of the events in the Map View.
Turn off the first three events: Cyclone Tracks, Earthquakes and Flood regions.
The Map View will be as shown in Figure 58.
The events that remain are from the AGD Disaster database and contain information about various event types as shown.
4 Turn off most of the events in the Map View.
Turn off all but the AGD Earthquakes.
Note that the icons are located approximately where the event occurred.
The Map View will be as shown in Figure 59.
There are three earthquake events corresponding to the time period selected.
5 Find the details of an event. Click the icon in the Northern Territory.
Details of the event are shown in a pop-up. The pop up may move the Map View slightly.
Refer to Figure 60.
The event details include URL links to further information from the original data source and a link back to the Impacts Framework.
6 Link to the Impacts Framework content about impacts from earthquake.
Click the last link in the pop-up labelled:
View Impacts Framework for Earthquake events.
A query is done on the Impacts Framework, selecting the Event “Earthquake”, Object Category “Infrastructure - Public (excl. parks and reserves)” and Harm “Destroyed”.
Refer to Figure 61.

15/06/2012 Pilot Impacts Portal: User Acceptance Testing P a g e | 9 3
No. Objective Tester Action Expected Result Actual Result Pass/Fail
7 Return to the Map View. Click the Map tab on the Navigation Bar.
The Map View will return to the way it was before following the link in step 6 above, see Figure 60.
This demonstrates that state is maintained between the different tabs in the Navigation Bar.
8 Close the pop-up. Click the close icon in the top right hard corner of the pop-up to close it.
The Map View will be the same as it was in Figure 59, although the map of Australia may have been moved slightly to make room for the pop-up in step 5.
9 Show all earthquake data for the chosen time period.
Data items for the same event types exist from different data sources.
Turn on the “Earthquakes” events by clicking the second check box.
More earthquake icons appear as small circles which sometimes correspond to the icons already shown from the AGD Disaster database.
Refer to Figure 62.
10 Show event summary description.
Hover the mouse over the icon near Newcastle.
A brief description of the corresponding event is displayed as shown in Figure 63. This feature is only available for the events from the ADG Disasters database.

P a g e | 94 Pilot Impacts Portal: User Acceptance Testing 15/06/2012
No. Objective Tester Action Expected Result Actual Result Pass/Fail
11 Show the non-AGD events. Enable the Cyclone Tracks and Flood regions in the Map View by clicking the boxes so there is a “tick” () in them.
Disable the AGD Disaster Events by clearing the tick in the corresponding check box. Pan and zoom the map as desired.
The Map View will be the same as it is in Figure 64.
Note the AGD Earthquake check box has a tick in it – but the parent check box overrides this and so the AGD earthquake icons are not displayed.
12 Explore the event details. Click on the various cyclone tracks or flood extents to view event information.
Various pop-ups will be displayed which may alter the Map View by moving the map of Australia.
13 Reset the Map View. Click the “Clear” Button on the Historical Event Accordion Tab and clear any open pop-ups.
Click the “Reset Zoom” button on the Locations Accordion Tab.
All events are cleared from the Map View, pop-ups are removed and the map of Australia is returned to its starting position.
14 Use the Impacts Framework Explorer to show events of interest on the Map View.
This shows the linkage of the Impacts Framework and the Map View.
Click the “Framework” tab on the Navigation Bar.
Choose “Earthquake” as the Event.
Click the “Map Events” button.
The Map View is displayed showing all earthquake information.
The result is the same as task 9; refer to Figure 62.
Note the previous date range for the “Historical Events” Accordion Tab in the Map View is retained.

15/06/2012 Pilot Impacts Portal: User Acceptance Testing P a g e | 9 5
No. Objective Tester Action Expected Result Actual Result Pass/Fail
15 Show earthquake events that have impacts data.
On the “Historical Events” Accordion Tab, change the date range to be 1980 – 1990 and only select the Earthquakes (turn off the AG Disasters Events).
Click the "Update" button.
Only two events are shown.
All the events shown so far in the steps above have been events that have impacts information recorded for them as well.
This is indicated by the “Only show events with impact data” check box being ticked.
16 Show earthquake events that have no impacts data.
Turn off the “Only show events with impact data” check box.
The “Historical Events” Accordion Tab may need to be scrolled to access this check box. Refer to Figure 65.
Many more events are shown. Refer to Figure 65.

P a g e | 96 Pilot Impacts Portal: User Acceptance Testing 15/06/2012
Figure 57: Historical Events for the period 1980-2000

15/06/2012 Pilot Impacts Portal: User Acceptance Testing P a g e | 9 7
Figure 58: Attorney-General's Disaster Events

P a g e | 98 Pilot Impacts Portal: User Acceptance Testing 15/06/2012
Figure 59: Attorney-General's Earthquake events

15/06/2012 Pilot Impacts Portal: User Acceptance Testing P a g e | 9 9
Figure 60: Attorney-General's Earthquake event details

P a g e | 100 Pilot Impacts Portal: User Acceptance Testing 15/06/2012
Figure 61: Impacts Framework Earthquake Information
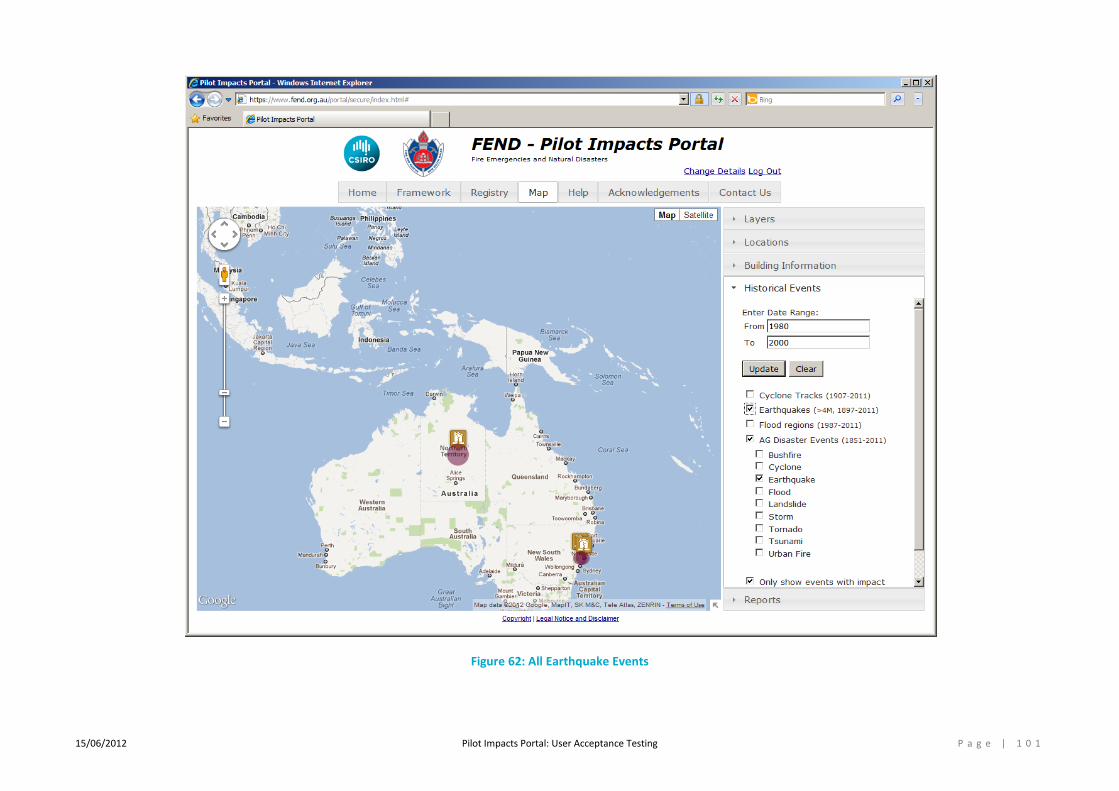
15/06/2012 Pilot Impacts Portal: User Acceptance Testing P a g e | 1 0 1
Figure 62: All Earthquake Events

P a g e | 102 Pilot Impacts Portal: User Acceptance Testing 15/06/2012
Figure 63: Earthquake Event Summary Information

15/06/2012 Pilot Impacts Portal: User Acceptance Testing P a g e | 1 0 3
Figure 64: All Non-AGD Events

P a g e | 104 Pilot Impacts Portal: User Acceptance Testing 15/06/2012
Figure 65: All Earthquake Events, including those without Impact data

15/06/2012 Pilot Impacts Portal: User Acceptance Testing P a g e | 1 0 5
8 UAT: Data Exploration
Pilot Impacts Portal – Test Script # 6
System Feature Theme: Data Exploration Browser: Please specify one of: IE, Firefox,
Chrome, Safari
Version #: Include the version number
Test Date:
Start Time:
End Time:
Tester Name: Your name Platform: Please specify one of the following:
Windows XP, Windows 7
Attempt Number: Is this the first, second,
etc attempt at performing the test
8.1 Introduction
A list of the data items contained in the Pilot Impacts Portal will be available for the user to browse. This will be static content updated by the portal administrator when new data items are included.
The description of the data items contained in the portal is maintained as a registry. The registry contents can be searched by the user.

P a g e | 106 Pilot Impacts Portal: User Acceptance Testing 15/06/2012
8.2 Functional Requirements Tested – Script 6
Functional requirement: EXP-Req1
Description: Provide a list of the data items included in the portal for the user to browse
Expected Results: A complete listing of all data items in the portal can be displayed for the user.
Functional requirement: EXP-Req2
Description: Allow a user to obtain a complete metadata description for a given data item
Expected Results: The description of each data item in the registry includes a metadata description.
Functional requirement: EXP-Req3
Description: Show any linkages from the data item to the Impacts Framework
Expected Results: The data items may be linked to the Impacts Framework content. When this is the case, the linkages are recorded in the
registry and can be viewed by the user.

15/06/2012 Pilot Impacts Portal: User Acceptance Testing P a g e | 1 0 7
8.3 Tasks
The following tasks demonstrate how to explore the data items available in the portal.
No. Objective Tester Action Expected Result Actual Result Pass/Fail
1 Begin test. Start a web browser.
Fill in the details in the header of the test script above noting who the tester is, the operating system, browser and versions.
Web browser started and connected to the internet.
2 Obtain a full listing of the data items available in the portal.
Open the URL:
http://www.fend.org.au/
This shows the portal home page. Follow the link “Data Items Registry Listing”.
The following page is opened:
http://www.fend.org.au/portal/registry
A scrollable listing of the data items currently available in the portal is shown, refer to Figure 66.
Each data item has a number of metadata elements described: a description of the data item, when it was created, how it was obtained, the category it is in and links to further information.
3 Access the registry component of the Pilot Impacts Portal.
Open the URL:
http://www.fend.org.au/
Click “Registry” tab on the Navigation Bar.
The user is not required to login.
The URL will be redirected to:
http://www.fend.org.au/portal/
The user will be presented with the registry explorer as shown in Figure 67.

P a g e | 108 Pilot Impacts Portal: User Acceptance Testing 15/06/2012
No. Objective Tester Action Expected Result Actual Result Pass/Fail
4 Find Earthquake data items.
The events are defined in the Impacts Framework. They are: bushfire, cyclone, earthquake, fire emergency, flood, landslide, meteorite strike, storm, storm surge, tornado and tsunami.
Select “Event” for the Data Item Category and “Earthquake” for the Event.
Click the “Find Data Items” button.
Note that the linkage to the Impacts Framework is the event described.
The data items describing earthquake events are shown; refer to Figure 68.
Note that in the Event drop down list, the events without data items in the portal are greyed and cannot be chosen.
5 Review data items metadata.
The data items available in the portal are documented by noting where the copyright, licensing conditions and where the original data can be obtained.
Click the first copyright link in the “Links” column.
The user’s web page is directed to the copyright information of the AGD Disasters database.
6 Return to the Pilot Impacts Portal.
When the user navigates away from the Pilot Impacts Portal, all state is lost.
Click the Browser’s back button. The “state” of the registry search performed in task 4 has been lost.
Such links should be opened in a new browser window or a new browser tab.
7 Find Earthquake data items. Repeat task 4 to again display the metadata for the earthquake data items.
The data items describing earthquake events are shown; refer to Figure 68.

15/06/2012 Pilot Impacts Portal: User Acceptance Testing P a g e | 1 0 9
No. Objective Tester Action Expected Result Actual Result Pass/Fail
8 Explore the metadata. Follow the various data items metadata links.
Open these links in a new window or browser tab to retain the user’s state of the Pilot Impacts Portal.
9 Download the registry subset.
Return to the Registry Explorer showing the data items describing earthquake events. Refer to task 4.
Click the “HTML” link labelled “Download Registry Subset” at the bottom of the page.
Either save the file and open in a new browser window or tab, or choose open.
The same information as shown in Figure 68 is available as a HTML web page.
The Registry Explorer user’s settings (“Event” and “Earthquake”) are shown at the top of the HTML page. This allows the same report to be reproduced later.
Refer to Figure 69.
10 Find Impacts data items.
The data items are categorised as describing events, impacts or baseline information.
Return to the Registry Explorer and enter “Impacts” for the Data Item Category.
The available options for searching the registry are changed as shown in Figure 70.
There are 11 predefined events in the Impacts Framework. Impacts and baseline data items are categorised by the objects in the real world that an event can cause harm to. The objects are organised in the Impacts Framework into categories.

P a g e | 110 Pilot Impacts Portal: User Acceptance Testing 15/06/2012
No. Objective Tester Action Expected Result Actual Result Pass/Fail
11 Find data items in the portal impacting public roads.
Note that Object Categories and Objects for which there are no data items available are greyed in the drop down lists and cannot be chosen.
In the Object Category and Object drop down lists, select “Infrastructure – Public (excl. parks and reserves)” and “Roads”.
Click the “Find Data Items” button.
Note that the linkage to the Impacts Framework is the Object described.
Two data items are found as shown in Figure 71.
Note that the “Find Data Items” button needs to be clicked before the list of matching data items is refreshed.
12 Find all baseline data items. In the Registry Explorer enter “Baseline” for the Data Item Category and leave “all” for the options in the two objects drop down list.
Click the Find Data Items button.
A scrollable list of nine data items is shown; refer to Figure 72.
Note that the linkage to the Impacts Framework is in the Object column of the table displayed.

15/06/2012 Pilot Impacts Portal: User Acceptance Testing P a g e | 1 1 1
Figure 66: Full listing of Data Items in the Registry

P a g e | 112 Pilot Impacts Portal: User Acceptance Testing 15/06/2012
Figure 67: Registry Explorer

15/06/2012 Pilot Impacts Portal: User Acceptance Testing P a g e | 1 1 3
Figure 68: Earthquake Data Items Description

P a g e | 114 Pilot Impacts Portal: User Acceptance Testing 15/06/2012
Figure 69: HTML Export Registry Subset

15/06/2012 Pilot Impacts Portal: User Acceptance Testing P a g e | 1 1 5
Figure 70: Registry Explorer – Impacts

P a g e | 116 Pilot Impacts Portal: User Acceptance Testing 15/06/2012
Figure 71: Example Impacts Data Items

15/06/2012 Pilot Impacts Portal: User Acceptance Testing P a g e | 1 1 7
Figure 72: All Baseline data items

P a g e | 118 Pilot Impacts Portal: User Acceptance Testing 15/06/2012
9 UAT: Reports
Pilot Impacts Portal – Test Script # 7
System Feature Theme: Reports Browser: Please specify one of: IE, Firefox,
Chrome, Safari
Version #: Include the version number
Test Date:
Start Time:
End Time:
Tester Name: Your name Platform: Please specify one of the following:
Windows XP, Windows 7
Attempt Number: Is this the first, second,
etc attempt at performing the test
9.1 Introduction
A report is a summary of the information obtained by the user when using the portal. This will be a hard copy print out or saved in an electronic format, such as a simple text file, XML or PDF. This information is expected to provide evidence for the user to support their investigation. This feature will only be available for data where the terms and conditions allow it.

15/06/2012 Pilot Impacts Portal: User Acceptance Testing P a g e | 1 1 9
9.2 Functional Requirements Tested – Script 7
Functional requirement: RPT-Req1
Description: A report can be produced from the Pilot Impacts Portal system. The report content will correspond to the information
being displayed to the user
Expected Results: PDF reports can be produced containing a summary of the information available in the portal corresponding to the user’s
current settings.
Functional requirement: RPT-Req2
Description: The report can be saved as a file in a format yet to be decided; for example as plain text, XML, PDF, CSV or an image file
(similar to a print screen operation)
Expected Results: Reports are saved in PDF format.
Functional requirement: RPT-Req3
Description: A report will contain the details of when it was created, the user connected to the portal who created it, and describe how
to re-create the same information when using the portal
Expected Results: The report contains details of when it was created and the portal settings used to produce it.

P a g e | 120 Pilot Impacts Portal: User Acceptance Testing 15/06/2012
9.3 Tasks
The following tasks will demonstrate how to produce reports of information contained in the portal.
No. Objective Tester Action Expected Result Actual Result Pass/Fail
1 Begin test. Start a web browser.
Fill in the details in the header of the test script above noting who the tester is, the operating system, browser and versions.
Web browser started and connected to the internet.
2 Locate a region to generate a
report about.
Access the Pilot Impacts Portal –
Map View web page.
Open the URL:
http://www.fend.org.au/
Click the “Map” tab in the Navigation Bar and login.
Refer to Test Script 2 for details
of registering and logging in to
the portal.
The user can access the Map
View of the Pilot Impacts
Portal.
3 Locate the Adelaide Hills region.
This is the region that will be
reported on.
In the “Layers” Accordion Tab, select the “LGA” Boundary Layer.
Select the “Locations” Accordion Tab. Choose “South Australia” and “Adelaide Hills (DC)” for the State and Local Government Area (LGA) drop down lists.
When choosing the “LGA”
Boundary Layer, the default
zoom level means the option is
greyed out but still selectable.
These layers will appear when
the zoom level passes the
threshold.
The Map View is as shown in Figure 73.

15/06/2012 Pilot Impacts Portal: User Acceptance Testing P a g e | 1 2 1
No. Objective Tester Action Expected Result Actual Result Pass/Fail
4 Show all AGD events for the date
range 1900-2012 that have
impacts data.
Note that the location of the
events in the Map View are at
fixed locations, however their
depiction may seem to change
relative to the map depending on
the zoom level.
On the “Historical Events” Accordion Tab, change the date range to be 1900 – 2012 and only select the “AG Disasters Events” with all event options selected as shown in Figure 74.
Make sure the “Only show events with impact data” button is selected.
Seven events are shown, with three in the Adelaide Hills region, see Figure 74.
5 Generate a report.
Reports are generated for a
chosen LGA or SLA region.
Note that different browsers use
different methods of saving files.
Open the “Reports” Accordion Tab.
Press the “Generate Report” button.
Save the PDF report to a known location, for example on the desktop.
The Map View is as shown in
Figure 75.
Note the LGA name is noted
(Adelaide Hills (DC)) in the
“Reports” Accordion Tab. By
default the building information
and historical events are
chosen.
6 Open the report that has a file
name is a format similar to:
LGA40120_20120510_094217.pdf.
The file name starts with “LGA”
followed by the ABS code used for
the region and finishes with a
timestamp of when the file was
created.
Double click the file to open it.
Note the timestamp format is: year, month, day, hour, minutes and seconds.
The generated report is
included as an attachment to
this UAT test script.
Screen shots are also provided
in Figures 76-78.

P a g e | 122 Pilot Impacts Portal: User Acceptance Testing 15/06/2012
No. Objective Tester Action Expected Result Actual Result Pass/Fail
7 Review the report contents.
The report contains embedded
URL links to further information
about the report contents.
The report begins with a Google Map overlayed by the LGA region highlighted in yellow.
Next to the map is the ABS population by age group data for the region.
See Figure 76.
The user’s email (their portal
login) is noted at the top of the
report along with information
about the portal settings used
to generate the report.
8 Review the report contents.
Note the generated report only
includes information about events
described by the AGD Disasters
database. This is not currently
configurable.
Then the historical events for the regions are listed.
See Figure 77.
A summary of each event
considered to be in the region
of interest is listed, including
details of:
Event title
Impact Summary
This is followed by a link to the
original event report.
9 Review the report contents. Lastly the NEXIS building information is included.
See Figure 78.

15/06/2012 Pilot Impacts Portal: User Acceptance Testing P a g e | 1 2 3
Figure 73: Adelaide Hills LGA

P a g e | 124 Pilot Impacts Portal: User Acceptance Testing 15/06/2012
Figure 74: All AGD Disasters in the Adelaide Hills region for 1900-2012

15/06/2012 Pilot Impacts Portal: User Acceptance Testing P a g e | 1 2 5
Figure 75: Generating a Report

P a g e | 126 Pilot Impacts Portal: User Acceptance Testing 15/06/2012
Figure 76: Report Google Map region and ABS Population Statistics

15/06/2012 Pilot Impacts Portal: User Acceptance Testing P a g e | 1 2 7
Figure 77: Report Events and Impacts

P a g e | 128 Pilot Impacts Portal: User Acceptance Testing 15/06/2012
Figure 78: Report NEXIS Information

15/06/2012 Pilot Impacts Portal: User Acceptance Testing P a g e | 1 2 9
Appendix A UAT Test Script Template
Pilot Impacts Portal – Test Script #
System Feature Theme: Describes the test being performed
Browser: Please specify one of: IE, Firefox, Chrome, Safari Version #: Include the version number
Test Date: Start Time: End Time:
Tester Name: Your name Platform: Please specify one of the following: Windows XP, Windows 7
Attempt Number: Is this the first, second, etc attempt at performing the test
A1 Introduction
Provide a brief description of the system features being tested and note the specific requirements being demonstrated.
A2 Functional Requirements Tested
For each functional requirement, include a summary in the table below.
Functional requirement:
Description:
Expected Results:

P a g e | 130 Pilot Impacts Portal: User Acceptance Testing 15/06/2012
A3 Tasks
No. Objective Tester Action Expected Result Actual Result Pass/Fail

15/06/2012 Pilot Impacts Portal: User Acceptance Testing P a g e | 1 3 1
Appendix B User Feedback
The User Acceptance Testing was performed by staff from WA FESA (21 May 2012), Queensland DCS (23 May 2012) and FRNSW (May – June 2012). A summary of the results is outlined below.
B1 WA FESA
Issue Comment Date Resolved
When opening the framework explorer, the table was not visible due to the small screen size. How to make the table visible?
Both Framework and Registry results tables now have a minimum height of 300. If this doesn't fit in the visible screen area the browser will display a scroll bar at the side. If you increase the browser window size, you will need to "Find Impacts" again to get the results table to fill the expanded space available, it does not dynamically expand.
4 June
Indirect impacts not obvious - how to highlight this? See above. 4 June
Raw CSV. Could make it pretty like the Impacts Framework. The CSV is difficult to view in Excel. Rob explained that the CSV is for machine processing not human reading. This was accepted.
Provide documentation in the user guide. 5 June
The Comodo certificate was not recognized! Need to contact Mark from FESA (via Carole) to find out about certificates. How do you find out the list of CA certs that are trusted by a browser?
Email sent to Mark Purchase (FESA IT person) 1 June. Awaiting reply.
Need a glossary on the Web site. Glossary and Abbreviations used now part of the online help. 5 June
Spelling mistake: Test Script 4 item 4 LDA => LGA. Simple fix 4 June

P a g e | 132 Pilot Impacts Portal: User Acceptance Testing 15/06/2012
Issue Comment Date Resolved
State extents not correct for laptops. Need to set screen resolution as defined in primer. Or modify the extents? See the WA example. Then the LGA didn't show up as described in the UAT.
State extents were checked and found to be correct. Google Maps zooms and pans the map so that the entire state is visible and centered. In some cases this only results in a map "pan" (eg QLD and WA) which the user may not notice.
4 June
For the Historical Events tab, Change "Show" to "Update" (or just keep at one and don't swap).
Now just keeps the label as "Show". 1 June
Having some events display event name when hover over was confusing - do for the others as well?
All historical events now display a tooltip when mouse hovers over it on the map. When the map is cluttered though, sometimes the marker (icon) tooltips fail to appear, eg AFAC fires. The marker tooltips are provided by the Google Maps API so not much we can do there, except turn off if its annoying!
31 May
Why put the AGD events separate? Discussed this. Maybe make it more clear on the listing of events?
Changed the events data items names to indicate where the information comes from. Makes it clearer that the information is based on data item – not event type.
5 June
Look up cyclones by name? All events now have a summary displayed as a tool tip (hover the mouse over the icon). Specific searching of events by name is only relevant for cyclones - other events are not normally named, with a few exceptions (Black Saturday, Ash Wednesday, ...). We want to stay with the current method of using a date range to search for events, then let the user explore.
Also - see below regarding efforts to select cyclones easier.
5 June
Difficult to click on cyclones? Want a measure of the impacts corridor of a cyclone. Maybe after one is selected?
Cyclone tracks now have a invisible "buffer" around them. Note the red cyclone tracks are 2 pixels wide and the new (not visible) buffer is 10 pixels wide. Cyclone selection (hover tool tip and mouse click) are associated with the buffer making it much easier to select the cyclones.
6 June
Maybe link related events. Example quoted was Yasi turned into a storm for WA which had lightning strikes which caused fires. All the one event?
This is beyond the scope of the portal: it is a data warehouse of existing information. If the data custodians don’t link the data in this way, neither do we.
6 June

15/06/2012 Pilot Impacts Portal: User Acceptance Testing P a g e | 1 3 3
B2 Queensland DCS
Issue Comment Date Resolved
Ross noted that in the UAT the framework diagram was not clearly defined. (thought that the downloaded CSV would look like this also).
Need to explain that the exported CSV information is for machine processing, not human readability in Excel. Provide documentation in the user guide (see above also).
5 June
When finding albany - when hitting clear, should remove the text. The clear button clears the "marker". The user interface will be updated to better reflect the behaviour.
Update: Button now labelled "Clear Marker". Find location text is not cleared in case the user just wants to edit it before searching again (eg to add a state).
31 May
When navigating away from the portal (following a link), when return (browser back button), should return to the same tab on the navigation bar.
All hyperlinks to non FEND pages now have the target="_blank" attribute which should force them to open in new browser tabs. When the user returns to the Portal's tab its state will be retained.
4 June
TS 4 task 4 - LDA => LGA Simple Fix (see above also) 4 June
When browsing for locations - the OR wasn't clear. Thought entering "Springfield" under "Enter Locations" would also use the "Zoom To" state of WA. Maybe use boxes to distinguish that these are distinct methods of navigating.
Replaced "OR"s with horizontal rules and removed the "Zoom To" heading. Also when one method of zooming/selected is carried out, the others are cleared, to hopefully make it clearer that they are independent.
1 June
When doing a place name location search, don't go to locations outside Australia?
The location search had been modified to display a "No matching Australian location found" message if there are matching locations, but none from Australia. (It already displays a "none found" message if no matches found at all).
31 May
In the list of event types, indicate where the data is from. Changed the events data items names to indicate where the information comes from. Makes it clearer that the information is based on data item – not event type (see above also).
5 June
Highlight that the list of events are from different custodians, not just "this is the cyclone data".
Changed the events data items names to indicate where the information comes from. Makes it clearer that the information is based on data item – not event type (see above also).
5 June

P a g e | 134 Pilot Impacts Portal: User Acceptance Testing 15/06/2012
Issue Comment Date Resolved
Don't allow AGD disaster elements to be selected when the parent check box is not selected.
Selecting/Deselecting the AG events check box now enables/disables its children sub event checkboxes.
1 June
Selena found an error when navigating the framework: line 1689 jquery.jstree.js char 33. When clicking the "Clear Impacts" button. Ross also had JavaScript error.
Investigated (5 June). Unable to replicate. Will contact Ross to test again. Sent email to Ross and Selena (13 June) asking them to check for the error again.
Selena wants a "reset" button for the impacts framework explorer - to take it back to the starting settings.
Added Reset button which both resets the drop down menus and clears any impacts found earlier.
1 June
Ross had an intermittent error - the hover over events wasn't working - then it did!
Unable to replicate. Ignored.
Cannot use the Google Maps API in a closed community. Must be public. Will need to provide general access to the portal.
Allow anyone with an email address to self register - but those not from a recognized agency cannot extract data, generate report and maybe restrict access to some data items on the map.
Removed the organisation drop down list when registering. Organisation now determined by email address. Those will "recognized" email addresses are given the role "pip-recognized" which allows them to access the reports tab to generate a report and download data.
13 June
In the Framework Explorer, when viewing results in the tree view, the hand remains visible, hinting there is a link to follow when this is not the case.
Adjusted style sheet so that "hand" cursor doesn't appear when over tree view text.
4 June
On the Historical Event accordion tab, the clear button didn’t clear the dates. "This was confusing when I went to the framework page as the previous dates were retained but nothing showed this on the framework page."
Updated the buttons to be more specific: "Show Events" and "Clear Events". 5 June

15/06/2012 Pilot Impacts Portal: User Acceptance Testing P a g e | 1 3 5
B3 FRNSW
Issue Comment Date Resolved
Entering a location doesn't select (highlight) a region (LGA/SLA).
A highlighted area needs to be chosen (noted on the Layers tab) by the user. Finding a location is not enough - must select a region. When the region is selected, the outline of the region/area is coloured yellow to make it obvious to the user.
31 May
A date range cannot be defined when exploring the Impacts Framework.
The user interface will be updated to make this more obvious for the user. 1 June
Building information is blank when a location has been selected.
Update: Highlighted area has been renamed to "Selected region" and is always visible on all relevant tabs. If no region is currently selected, "None selected" is display in italics. Also to avoid confusion about the relation between the various ways of selecting/finding a location/region on the Locations tab, once an sla/lga or location is selected or found, the other items are cleared.
31 May
Generated reports sometimes contain details of events which seem not to be related to the chosen region.
Correct. The date range is available on the Historical Events Accordion Tab. We don't want to have multiple places where this can be defined for the user - having it in one place is preferred.
31 May
The clear Impacts button in the framework explorer doesn’t clear the selection.
A highlighted area needs to be defined (noted on the Layers tab). Finding a location is not enough - must select a region. The user interface will be updated to make this more obvious for the user.
5 June
The map doesn't refresh when you select another event from the framework explorer. All other tabs retain the previous information.
Update: Highlighted region has been renamed to "Selected region" and is always visible on all relevant tabs. If no region is currently selected, "None selected" is display in italics. Building information is also now always in sync with the other panels, i.e. clears its data when selected region is cleared.
5 June
Under locations, the clear button doesn’t appear to clear anything.
The events reported on are from the AGD Disaster's Database. The event locations are defined in reference to the disaster regions. These regions are "coarse" and as such sometimes overlap a chosen region when the event text description seems to indicate the event is not relevant.
31 May
Multi-regions cannot be selected for reporting. The selection of overlapping disasters for selected SLA/LGA region when generating reports will be checked.
5 June

P a g e | 136 Pilot Impacts Portal: User Acceptance Testing 15/06/2012
Issue Comment Date Resolved
On the Layers tab, when selecting "None" after having one of LGA, SLA or CCD being chosen. The legend for the layer remains. This should be removed.
Update: The behaviour of the disaster region overlapping code has been checked and is behaving correctly. To better understand why a disaster has been included, the list of affected regions is now displayed, plus a link to the region map. This is done both on the map (in the event popup window) and in the pdf reports.
31 May
Load up the new NEXIS data Correct. It clears the impacts results. We prefer to keep it this way. There is a new "Reset" button which clears the Impacts selection and results.
Fix spelling mistakes in the online help Yes it does? This can occur if the user starts operating the framework explorer prior to logging in. When displaying the events (selecting the "Map Event" button on the Framework Explorer), the user must log in which then redirects to a new web site. The previous Framework Explorer selection has been lost. From then on, however, the framework and map view should be "linked".
5 June
Include the AIRS conditions of use information and update the registry
The clear button clears the "marker". The user interface will be updated to better reflect the behaviour.
6 June
New role for the monitor app Update: Button now labelled "Clear Marker". Find location text is not cleared in case the user just wants to edit it before searching again (eg to add a state).
5 June
Deploy monitor app on fend with correct authentication Correct. This wont be done by the end of June, but may be implemented next financial year.
5 June
Make it easier to select cyclone tracks on the Map View. Fixed the code so that population scale legend for LGA and SLAs is only visible with layer is visible.
6 June
Closing the event popups when hitting the "Clear Events" button.
Data loaded (12 June 2012). Integrating into the portal will take longer since the data format has changed significantly. This will require changes to the Building Information tab, the reports generated and the data download options.
13 June
When the population popups are present for SLAs or LGAs, they disappear when a different layer (or none) is chosen. This is managed by Google Fusion tables. When a CCD popup is present, choosing a different layer (or none) and the pop up remains. Investigate the option of removing them when choosing a different layer.
Fixed (mostly removed since the online help now available in the User's Guide pdf). 13 June

15/06/2012 Pilot Impacts Portal: User Acceptance Testing P a g e | 1 3 7
Issue Comment Date Resolved
DFO (flood) data is incorrect in places. For example, there is a flood in China and another in WA that are noted as being in NSW!
AIRS info now in registry and registry updated. 13 June
Reduce the number of AIRS events. There are a lot of fire icons to be displayed. Investigate ways of reducing the number displayed. For example, only obtain event where the amount of area burnt is > some threshold?
New role created: esa-monitor. 13 June
Data Download problem for IE 8. Monitor web app deployed: http://www.fend.org.au/monitor. 13 June
Problem with CAPTCHA when registering... Cyclone tracks now have a invisible "buffer" around them. Note the red cyclone tracks are 2 pixels wide and the new (not visible) buffer is 10 pixels wide. Cyclone selection (hover tool tip and mouse click) are associated with the buffer making it much easier to select the cyclones.
14 June

P a g e | 138 Pilot Impacts Portal: User Acceptance Testing 15/06/2012
Glossary
ABS Australian Bureau of Statistics
AGD Attorney-General's Department
BOM Bureau of Meteorology
CCD Census Collection District
CIPMA Critical Infrastructure Program for Modelling and Analysis
CSIRO Commonwealth Scientific and Industrial Research Organisation
CSV Comma Separated Values
FEND Fire Emergency or Natural Disaster
FEND web site www.fend.org.au
FRNSW Fire and Rescue New South Wales
GA Geoscience Australia
HTML Hypertext Markup Language
IT Information Technology
LGA Local Government Area
NEXIS National Exposure Information System
PDF Portable Document Format
SLA Statistical Local Area
URL Uniform Resource Locator
XLS Microsoft Excel spreadsheet, from the 3 letter file extension used
XML Extensible Markup Language

15/06/2012 Pilot Impacts Portal: User Acceptance Testing P a g e | 1 3 9
Acknowledgments
The Australian Natural Disasters Impacts Framework Project (the Impacts Project) is a national project managed by FRNSW and funded jointly by the Natural Disaster Mitigation Program and the NSW Government with 50% contribution from the Commonwealth and 50% from the NSW Government.

P a g e | 140 Pilot Impacts Portal: User Acceptance Testing 15/06/2012


P a g e | 142 Pilot Impacts Portal: User Acceptance Testing 15/06/2012
CONTACT US
t 1300 363 400 +61 3 9545 2176 e [email protected] w www.csiro.au
YOUR CSIRO
Australia is founding its future on science and innovation. Its national science agency, CSIRO, is a powerhouse of ideas, technologies and skills for building prosperity, growth, health and sustainability. It serves governments, industries, business and communities across the nation.
FOR FURTHER INFORMATION
CSIRO ICT Centre Robert Power t +61 2 6216 7039 e [email protected] w www.csiro.au/ict CSIRO ICT Centre Bella Robinson t +61 2 6216 7049 e [email protected] w www.csiro.au/ict