pillar iii 2017 - santander€¦ · chapter summary enhanc. table list of tables 2017 pillar iii...
TRANSCRIPT

2017
CAPITAL MANAGEMENT AND ADEQUACY Pillar 3 Disclosures
#Santander_Pillar3

2017 Pillar 3 Disclosures 2
25 Capital
27 Capital function
28 Capital management and adequacy
29 Capital management priorities in 2017
30 Capital buffers and eligible capital requirements
33 Pillar 1 regulatory capital
82 Pillar 2 economic capital
86 Recovery and resolution plans and special situations response framework
7 Executive summary
12 Overview of Pillar 3 at Santander Group 20 Regulatory framework
21
Pillar 3Disclosures
2017
EXECUTIVE SUMMARY CAPITAL

32017 Pillar 3 Disclosures
199 Remuneration policies
209 Appendices
Other appendices available on the Santander Group website
Pillar 3 editable format tables
91 Credit risk
161 Credit risk - Securitisations
175 Market risk
189 Operational risk
191 Other risks and internal control
3 4
RISK SANTANDER GROUP
Access files2017 Pillar 3 Appendices & 2017 Pillar 3 tables available on the Santander Group website

2017 Pillar 3 Disclosures 4

52017 Pillar 3 Disclosures
A report that is constantly evolving and prepared in line with EBA principles of market disclosure and transparency
LINKS to other sections of this report.
INCLUDES EVERY IMPROVEMENTFrom the different international bodies applicable in 2017.
QR CODES linked to other public documents.
EASY-TO-LOCATE INFORMATIONFind the information required under part VIII of the Capital Requirements Regulation.
Go to Appendix I
SIGNIFICANCE
COMPARABILITY
CONSISTENCYover time
CLARITY improved navigability
An ex ante review of the information in this report is performed by an external auditor and an ex post review by internal audit.
Document approved by:• Board of directors
Reviewed by:• Board Risk committee• Capital committee
Control and Governance
EXCEL TABLESCan be edited to make the information easier to analyse.
Access file2017 Pillar 3 Tablesavailable on the Santander Group website
Go to Table 1

1. INTRODUCTION
EXECUTIVE SUMMARY
1 1.1. Executive summary 7
1.2. Santander Group Pillar 3 Report overview
12
1.2.1. Santander Group background information
12
1.2.2. Structure of the 2017 Pillar 3 Disclosures
12
1.2.3. Governance: approval and publication
13
1.2.4. Transparency enhancements 14
1.2.5. Differences between the consolidation method for accounting purposes and the consolidation method for regulatory capital calculation purposes
16
1.2.6. Disclosure criteria used in this report
16
1.2.7. Substantial amendments due to a change in perimeter and corporate transactions
18
1.3. Regulatory framework 201.3.1. Regulatory changes in 2017 20

Main summary
Chapter summary
Enhanc. table
List of tables
2017 Pillar III Disclosures 7
1. Introduction
1.1. Executive summary*In 2017, Santander Group conducted its business in a more favourable economic environment than in preceding years. Low interest rates in mature markets were the most adverse factor for the banking business. Against this backdrop, our robust business model enabled us to deliver double-digit growth in the Group’s underlying profit and that of most of the countries where we operate. Our RoTE was among the best in the sector, and we combined balance sheet growth with better capital ratios and a higher dividend per share.
Our strategic priorities were to:
1. Press forward with our commercial transformation, both in traditional banks and through our independent units operating under the start-up model. The three pillars of our transformation programme are to:
• Improve customer loyalty through innovative, simple and tailored solutions. Among other actions, we continued to secure the 1|2|3 strategy in various countries, adapted our global strategy for the SME segment to the local characteristics of each market, achieved strong growth in the cards market, particularly in Spain and Brazil, and created the Wealth Management division in order to enhance the service we provide to our private banking and asset management customers. On the back of this transformation process, we now have 17.3 million loyal customers (a 13% year-on-year increase).
• Promote the digital transformation of channels, products and services. Initiatives such as Digilosofia in Spain, the fully digital Openbank, Superdigital in Brazil, the Cash Nexus payment platform, Santander Pay, the new global machine learning platform and other initiatives are driving the digital transformation and significantly improving the customer experience as well as opening new sources of revenue. This strategy enabled us in 2017 to increase the number of both digital customers (by more than 4 million to over 25 million) and digital transactions (around 40% of the total).
• Continue to improve customer satisfaction and experience with simpler and more efficient processes, underpinned by a multichannel offering. At year-end, seven of our units were among the top three local banks in their respective countries for customer satisfaction. We were named Global Bank of the Year and Bank of the Year, Latin America, by The Banker magazine as well as Best Bank in the World for SMEs and Best Bank in Latin America by Euromoney.
2. Strengthen our position in the markets where we operate. The most notable transaction was our acquisition of Banco Popular, which enabled us to strengthen our leading position in Spain and to become the largest private sector bank in Portugal in terms of domestic business. We also reinforced our position in retail banking in Argentina, increased stake in the United States and closed an agreement to acquire Deutsche Bank's commercial and retail banking business in Poland.
3. Exit non-core businesses. Our main actions were the sale of TotalBank in the United States and 51% of Banco Popular’s real estate business.
As regards business performance, activity and results grew, profitability was higher and the balance sheet stronger.
Growth. Fluctuations in exchange rates and changes in our perimeter had a significant impact on balances in 2017.
Excluding the forex impact, lending rose by 12%, spurred by the integration of Banco Popular (disregarding this factor, by 2%). On a like-for-like basis, seven units improved. Of particular note were Argentina (+44%, driven by consumer credit and SMEs), Brazil (+7%, due to the strong performance of individual customers and SMEs), Portugal (+8%, partly as a result of a corporate transaction), SCF (+6% due to auto finance) and Poland (+5% from SMEs and corporates).
Customer funds rose 17% (excluding the forex impact), benefiting from the integration of Banco Popular. Excluding Popular, funds increased 8%, due mainly to demand deposits and investment funds, and they rose in eight of the core countries (including double-digit growth in Latin America).
Santander’s business model and geographic diversification between mature and developing countries enable it to generate stable, recurring profits.
Although exchange rates did affect the balance sheet, their impact on the income statement was virtually zero.
Underlying profit before tax was €13,550 million, 20% more than in 2016. The Group’s strength is reflected in its main line items:
• A record year for gross income (€48,392 million, a 10% increase), with double-digit growth in net interest income and fee income - together, these two items accounted for 95% of total revenues.
* This English version is a translation of the original in Spanish for information purposes only. In the event of a discrepancy, the original Spanish-language version prevails.

2017 Pillar 3 Disclosures
1. INTRODUCTION
8
• Stable costs in real terms and on a like-for-like basis, despite higher costs related to regulatory matters and investments in the transformation process. Santander Group is one of the world’s most efficient banks, with a cost-to-income ratio of 47%.
• Continuous improvement in credit quality, as reflected in a 4% fall in provisions and an improvement in the cost of credit to 1.07%.
A higher tax charge in the lower part of the income statement, as well as some positive and negative non-recurring results in net capital gains and provisions, which totalled €897 million net of tax (€417 million in 2016).
The Group’s attributable profit was €6,619 million (+7%). Excluding Banco Popular, which recorded a loss of €37 million as a result of integration costs, attributable profit stood at €6,656 million.
Profitability. Raising profitability and creating shareholder value were among our main priorities.
Our capacity to generate stable, recurring profits over the last few years has enabled us to accumulate capital, finance business growth and boost total shareholder return in cash.
In 2017, the underlying RoTE was 11.8% and the underlying RoRWA 1.48%, both up on 2016. We increased attributable profit per share by 1% (8% in underlying profit terms) and raised the cash dividend per share by 11%.
The market viewed our strategy and its impact on business and results favourably. Total shareholder return (TSR) was 17%, outperforming the DJ Stoxx Banks and DJ Stoxx 50.
Strength. Santander has a medium-low risk profile and high-quality assets. Our proactive risk management gives us credit quality ratios that are among the best in the sector. We have an NPL ratio of 4.08% (+15 bp as a result of the acquisition of Banco Popular) and a coverage ratio of 65%. Excluding Popular, the NPL ratio was 3.38%, 55 bp lower than in 2016, our fourth consecutive improvement.
In addition, our cost of credit improved further, to 1.07%, 11 bp lower than in 2016.
Almost all the countries where the Group operates improved their credit quality ratios. The NPL ratio was lower in eight countries and the cost of credit, in seven.
We generated capital continuously each quarter (+29 bp), reaching a fully loaded CET1 of 10.84%, higher than our target and putting us well on track to attain our objective of 11% in 2018.
We comfortably met the minimum regulatory requirements, ending the year with a phased-in CET1 of 12.26%, well above the minimum requirement.
Regulatory ratiosDec. 2017
Regulatory requirements2018
REGULATORY CAPITAL
CET1
CET1
12.26%
8.655%
0.51%
2.00%
1.50%
0.03%
2.22%
0,.75%
1.875%
1.50%
4.50%
T1
T2
T2
AT1
CCy B3
G-SIB1
CCoB2
Pillar 2 Requirement
Pillar 1 minimum
Capital ratio(phased-in)
14.99%
Total capital12.155%
1. Global Systemically Important Banks buffer
2. Conservation capital buffer
3. Anti-cyclical capital buffer Calculated using September 2017 data for requirement as at 1 January 2018.
2017 CET1 FULLY LOADED EVOLUTION
%
Dec
. 16
Ord
inar
y ge
nera
tion
Ban
co P
opul
ar
acqu
isit
ion
Cap
ital
in
crea
se
Peri
met
er
Ava
ilabl
e fo
r sa
le a
nd o
ther
s
Dec
. 17
10.55
1.14
0.53
-1.14-0.19 -0.05
10.84
+29b.p.

2017 Pillar 3 Disclosures 9
Main summary
Chapter summary
Enhanc. table
List of tables
Millions of Euros
Fully loaded Phased in
Dec-2017 Dec-2016 Dec-2015 Dec-2014 Dec-2017 Dec-2016 Dec-2015 Dec-2014
Common Equity (CET1) 65,563 62,068 58,705 48,129 74,173 73,709 73,478 64,250
Tier 1 73,293 67,834 64,209 52,857 77,283 73,709 73,478 64,250
Total capital 87,588 81,584 76,209 60,394 90,706 86,337 84,350 70,483
Risk weighted assets 605,064 588,088 583,917 582,207 605,064 588,088 585,633 585,621
CET1 Ratio 10.84% 10.55% 10.05% 8.27% 12.26% 12.53% 12.55% 10.97%
Tier 1 Ratio 12.11% 11.53% 11.00% 9.08% 12.77% 12.53% 12.55% 10.97%
Total capital ratio 14.48% 13.87% 13.05% 10.37% 14.99% 14.68% 14.40% 12.03%
CHANGES IN MAIN CAPITAL AND RATIO FIGURES
Capital %
Tier 2 Tier 1 CET1
Dec14
8.27
0.811.29
Dec15
10.05
0.952.05
Dec16
10.55
0.982.34
Dec17
10.84
1.272.37
Capital ratios (Fully loaded) Capital ratios (Phased in)
Dec14
10.97
1.06
Dec15
12.55
1.85
Dec16
12.53
2.15
Dec17
12.26
0.512.2210,37
13,0512,03
14,40 14,68 14,9913,87 14,48
Capital ratio %
Total ratio Tier 1 CET 1
Dec16 Mar17 Jun17* Sep17 Dec17
10.55 10.66 10.72 10.80 10.84
* Including the capital increase completed on 27 July 2017.
Capital ratios (Fully loaded) Capital ratios (Phased in)
Dec16 Mar17 Jun17* Sep17 Dec17
12.5312.12 12.08 12.18 12.26
* Including the capital increase completed on 27 July 2017.
11.53
13.87
11.63
14.10
11.84
14.17
12.04
14.38
12.11
14.4814.68
12.32
14.62
12.47
14.64
12.69
14.89
12.77
14.99
12.53
CAPITAL REQUIREMENTS BY RISK TYPE AND GEOGRAPHY
31 Dec. 2017
Spain UK Rest of Europe Brazil Rest of Latin America USA
29%
16%
20%
13%
11%
11%
57%
17%
1%
8%
16%
1%
24%
14%
16%13%
15%
18%
86%
41,575Millions of Euros
1,933Millions of Euros
4,897Millions of Euros
4 % 10 %
CREDIT RISK MARKET RISK OPERATIONAL RISK

2017 Pillar 3 Disclosures
1. INTRODUCTION
10
ELIGIBLE CAPITAL (PHASED IN)
Millions of Euros
* Including the capital increase completed on 27 July 2017.
+5.1%2016/2017
Dec17
Jun17*
Dec16
86,33792,283*
90,706
RWA EVOLUTION
Millions of Euros
* Including the capital increase completed on 27 July 2017.
588,088
Dec17
Jun17*
Dec16
630,130*
605,064
+2.9%2016/2017
LEVERAGE RATIOS (FULLY LOADED)
%
* Including the capital increase completed on 27 July 2017.
Dec17
Jun17*
Dec16
5.0%
5.0%
5.0%
LEVERAGE RATIOS (PHASED IN)
%
* Including the capital increase completed on 27 July 2017.
Dec17
Jun17*
Dec16
5.4%5.2%
5.3%
DISTRIBUTION OF ECONOMIC CAPITAL NEEDS
31. Dec. 2017
Market ALM interest Operational Business Material Assets Others Credit Goodwill
9%
39%
27% 4%4%4%
4%
9%
Corporates Non-commercial mortgages Elegibles renewables Others Retail Equities Securitisations
50%
22%
2%
13%
7%1% 5%
DISTRIBUTION OF CAPITAL REQUIREMENTS FOR CREDIT RISK BY BASEL CATEGORY. IRB APPROACH
31. Dec. 2017

2017 Pillar 3 Disclosures 11
Main summary
Chapter summary
Enhanc. table
List of tables
FLOW STATEMENT. CAPITAL REQUIREMENT FOR CREDIT RISK (CR8)*
Millions of Euros
RWA Capital
Starting figure (31/12/2016) 500,216 40,017
Asset size 4,677 374
Asset quality – –
Model updates -7,407 -593
Methodology and policy – –
Acquisitions and disposals 49,562 3,966
Foreign exchange movements -29,915 -2,393
Other – –
Ending figure (31/12/2017) 517,133 41,371
* Including capital requirements of equities, securitisations and counterparty risk (excluding CVA and CCP)..
CAPITAL REQUIREMENTS FOR MARKET RISK STANDARDISED APPROACH
Million of EurosCapital RWAs
Starting figure (31/12/2016) 949 11,863
Change in calculation basis of MMPP. -13 -163
Banco Popular integration 116 1,448
Changes in business -276 -3,446
Ending figure (31/12/2017) 776 9,702
FLOW STATEMENT. RWA FOR IMA MARKET RISK EXPOSURES (MR2-B)
Millions of Euros
VaRStressed
VaR IRCComprehensive
risk measure OtherTotal
RWAsTotal capital
requirements
RWAs Dec. 2016 2,370 6,751 4,259 – 835 14,215 1,137
Regulatory adjustment – – – – – – –
RWAs at the previous year (end of the day) 2,370 6,751 4,259 – 835 14,215 1,137
Movement in risk levels 265 2,445 –2,421 – –45 244 20
Model updates/changes – – – – – – –
Methodology and policy – – – – – – –
Acquisitions and disposals – – – – – – –
Foreign exchange movements – – – – – – –
Other – – – – – – –
RWAs at the end of the reporting period (end of the day) 2,635 9,196 1,838 – 790 14,459 1,157
Regulatory adjustment – – – – – – –
RWAs Dec. 2017 2,635 9,196 1,838 – 790 14,459 1,157
FLOW STATEMENT. CAPITAL REQUIREMENT FOR OPERATIONAL RISK
Millions of Euros
Capital RWAs
Starting figure (31/12/2016) 4.887 61.084
Application of the ASA approach in Mexico -145 -1.810
Sale of the Allfunds company -8 -96
Management companies by global method 63 783
Incorporation Popular Spain 376 4.698
Incorporation Popular Portugal 25 314
Exchange rate effect -328 -4.102
Change in business 28 346
Ending figure (31/12/2017) 4,897 61,217
RoRAC AND VALUE CREATION
Millions of Euros
31 Dec. 2017 31 Dec. 2016
Main segments RoRACValue
creation RoRACValue
creation
Continental Europe 19.7% 2,110 17.3% 1,426
UK 19.3% 764 20.2% 825
Latin America 41.8% 4,049 33.1% 2,879
US 8.9% 22 9.2% -13
Total business unit 23.9% 6,946 20.7% 5,117

2017 Pillar 3 Disclosures
1. INTRODUCTION
12
1.2. Overview of Pillar 3 at Santander Group
This section describes the structure of the 2017 Report, its validation governance, approval and publication and an explanation of the transparency improvements introduced pursuant to the Basel Committee guidelines and those of other international bodies.
1.2.1. Background information on Santander GroupBanco Santander, S.A. is a private-law company, subject to the rules and regulations applicable to banks operating in Spain. In addition to its own activities, Banco Santander is the parent of a group of subsidiaries engaged in a variety of activities, which together make up Santander Group. The CRR and CRD IV and their transposition in Spain through Bank of Spain Circular 2/2016, on supervision and solvency, apply on a consolidated level across the entire Santander Group.
At the end of 2017, Santander Group was the largest bank in the euro area and the fourteenth largest in the world in terms of stock market capitalisation: EUR 88,410 million.
Its business model is focused on commercial banking products and services with the aim of meeting the needs of its 133 million customers, including private individuals, SMEs and businesses. The Group operates through a global network of 13,697 branch offices, the most extensive in international banking, as well as digital channels, in order to provide top-quality service and the utmost flexibility. Santander Group has EUR 1,444 billion in assets and manages customers funds worth EUR 986 billion across all its customer segments. It has over 4 million shareholders and over 200,000 employees. Commercial and retail banking accounts for 89% of the Group’s income.
At present, Santander Group’s vision is to be the best retail and commercial bank by earning the trust and loyalty of employees, customers, shareholders and society at large, all under the Simple, Personal and Fair corporate culture. Looking ahead, it aims to become the best open digital platform for financial services.
Santander Group companies included in the scope of regulatory consolidation for the purposes of calculating the capital ratio under the CRR are the same as those included in the scope of consolidation for accounting purposes under Bank of Spain Circular 4/2004.
In application of Part I (General Provisions) of the CRR, certain Santander Group companies are consolidated using a different method to that used for accounting consolidation.
The companies for which a different consolidation method is used, based on the regulations applied, and the equity investments that are deducted from capital are listed in Appendix IV of the 2017 Pillar 3 Appendix document, available on the Santander Group website. As of the reporting date, both types of investment are exempt from deduction pursuant to article 48 of the CRR.
Access file2017 Pillar 3 Appendicesavailable on the Santander Group website
Santander Group does not make use of the exemption contemplated in article 49 of the CRR, therefore the disclosure of table INS1 (Non-deducted participations in insurance undertakings) does not apply.
As of 31 December 2017, under Article 7 and 9 from the CRR, the subsidiaries Santander Leasing S.A. EFC and Santander Factoring y Confirming S.A. EFC are exempt from the minimum capital requirements, the limit on large exposures and the internal corporate governance obligations. No use of the exemptions under the applicable regulations has been made for any other Santander Group subsidiaries.
On 7 June 2017, Banco Santander announced the acquisition of 100% of the share capital of Banco Popular Español, S.A. As a result, Banco Popular becomes part of Santander Group. Therefore, every amount contained in this report from june 2017 onwards, both in tables and graphs, is shown at a consolidated level taking into account the aforementioned acquisition.
Santander Group is one of the banks that have not required state aid in any of the countries in which it operates.
For all those aspects whose disclosure is required under Part Eight of the CRR and which are not applicable to Santander Group, see Appendix I – CRR Mapping –, where they are reported as “N/A” (not applicable).
As of 31 December 2017, none of the financial institutions included in Santander Group consolidated had less than the minimum capital required under applicable regulation.
1.2.2. Structure of the 2017 Pillar 3 Disclosures ReportSantander’s Pillar 3 Disclosures Report is divided into eight chapters and three appendices. The first chapter describes the background to Pillar 3 at Santander Group, material events affecting the Group that occurred in 2017 and the regulatory environment.
The second chapter provides full information on capital, including qualitative information on the capital function in Santander Group and quantitative information on Santander Group’s capital base and capital requirements.
Chapters 3 to 7 describe the risk function at Santander Group and provide detailed information on credit risk, securitisation, market and ALM risk, operational risk, liquidity risk, compliance and conduct risk, capital risks and a description of the Internal Control function.

2017 Pillar 3 Disclosures 13
Main summary
Chapter summary
Enhanc. table
List of tables
Chapter 8 contains information on remuneration policy.
The appendices contain a CRR Mapping that shows the primary location in the report of the disclosed information according to Part Eight of the CRR and a list of the tables contained in the report, as well as a glossary for a better understanding of the report.
The Santander website contains 7 appendices in editable format with the information required under prevailing legislation in relation to various different aspects, including eligible capital, the issue of preferred and subordinated debt and the different consolidation methods for Santander Group's subsidiaries.
Throughout the report, cross references to other public documents can be found, enlarging the content of this report via QR codes and hyperlinks:
QR code use and web links
3. File name that contains the information
1. If you are reading a printed copy, capture the QR
2. If you are viewing the PDF in a device, click the circle
Access file 2017 Pillar 3 Appendices available on the Santander Group website
The Pillar 3 Disclosures Report is elaborated according to the obligations established in Part Eight of the Capital Requirements Regulation (CRR), which sets out the main principles of disclosure by institutions.
1.2.3. Governance: approval and publicationPursuant to the official disclosure policy Santander Group publishes its annual Pillar 3 Disclosures following board approval. Prior to the board of directors' approval on 13 February 2018, the report was reviewed by the risk, regulation and compliance committee at a meeting held on 29 January and also by the capital committee at a meeting held on 8 February 2018.
In addition, a set of quarterly information has been published since March 2015 in compliance with the “Guidelines on materiality, proprietary and confidentiality and on disclosure frequency”, pursuant to article 432, sections 1 and 2 and article 433 of Regulation (EU) 575/2013.
No exceptions have been made to the publication of information considered proprietary or confidential.
During April, the Joint Supervisory Team (JST) conducted a review of last year s annual Pillar 3 Disclosure Report, in order to verify its compliance with the disclosure requirements provided by the CRR, without reporting any significant objection in their analysis. Appendix I contains a list showing the location of the information disclosed in accordance with the relevant articles of Part Eight of the Regulation.
In line with corporate governance recommendations on the rotation of the external auditor, the annual general meeting held on 18 March 2016 appointed PricewaterhouseCoopers Auditores S.L. (PwC) as external auditor of the Bank and of its Consolidated Group for 2016, 2017 and 2018.
The information contained in this report has been subject to review by the external auditor (PwC), who found no material issues with regard to the reasonableness of the disclosures and compliance with the reporting requirements established in the CRD IV and the CRR.
Senior management certificationThe board of directors of Santander Group certify that the publication of the Pillar 3 disclosures report is compliant with the guidelines of Part Eight of Regulation (EU) 575/2013 and consistent with the "Pillar 3 Disclosures Policy" adopted by the board of directors.
The Pillar 3 disclosures report relies on a range of processes relating to the internal control framework, duties and responsibilities having been defined for review and certification of the information set out in the report at several levels of the organisation. In addition, the external auditors carry out an ex ante review, and the work plans for recurring reviews by internal audit also cover this report.
The Pillar 3 Disclosures Report is available in the “Shareholders and Investors” section of the Santander Group website (www.santander.com), under “Financial and Economic Information”.
Access file 2017 Pillar 3available on the Santander Group website
Disclosures of Santander Group subsidiariesIn addition to the information contained in this report, Santander Group subsidiaries that are considered to have significant importance for their local market, pursuant to article 13 of the CRR (Application of disclosure requirements on a consolidated basis), publish information on their websites in relation to: own funds, capital requirements, capital buffers, credit risk adjustments, remuneration policy and the application of credit risk mitigation techniques.

2017 Pillar 3 Disclosures
1. INTRODUCTION
14
1.2.4. Transparency enhancementsIn recent years, Santander Group has taken note of the recommendation issued by different international bodies with the aim of improving the transparency of the information published each year in the Pillar 3 Disclosures Report.
In December 2016, the European Banking Association (EBA) published its final guidelines on disclosure requirements under Part Eight of the Capital Requirements Regulation. These guidelines apply from this year onward and provide guidance to financial institutions on how to comply with applicable regulations.
Meanwhile, in March 2017 the Basel Committee released the second phase of its "Revised Pillar 3 Disclosure Requirement", which we believe will be transposed by the EBA during 2018.
The following graph shows the expected legislative timeframe for the upcoming years:
LEGISLATIVE TIMEFRAME
2017 2018 2019 TBD
Capital requirements IFRS 9 TLAC Standardised approach RWA
Credit risk Asset Encumbrance Market risk Operational risk
Counterparty Credit risk Key metrics Other ongoing policy reforms
Market risk Prudent Valuation Adjustement
EAB
LCR Composition of CapitalBCBS
Macroprudential NSFR
Leverage ratio IRRBB
Remuneration
* BCBS Phase II disclosure requirements (2017-2019) are pending EBA’s transposition. Those corresponding to Phase III (TBD) have not been published yet.
Santander Group has now incorporated all of this year’s applicable enhancements. Appendix I provides a list showing the location of the information required under the different articles of Part Eight of the CRR, while the Santander Group website includes a file containing all of the tables shown in this document in editable format to facilitate their treatment.
Access file2017 Pillar 3 Tablesavailable on the Santander Group website

2017 Pillar 3 Disclosures 15
Main summary
Chapter summary
Enhanc. table
List of tables
The enhancements introduced are detailed below:
TABLE 1. TRANSPARENCY ENHANCEMENTS
Table Guidelines on disclusure requirements EBA/GL/2016/11 PILLAR 3 2017
OV1 Overview of RWAs 2.2.2.
LI1Differences between accounting and regulatory scopes of consolidation and mapping of financial statements categories with regulatory risk categories 1.2.6.
LI2 Main sources of differences between regulatory exposure amounts and carrying values in financial statements 1.2.6.
LI3 Outline of the differences in the scope of consolidation (entity by entity) Appendix IV
INS1 Non-deducted participations in insurance undertakings N/A
CRB-B Total and average net amount of exposures 3.2.
CRB-C Geographical breakdown of exposures 3.2.
CRB-D Concentration of exposures by industry or counterparty types 3.2.
CRB-E Maturity of exposures 3.2.
CR1-A Credit quality of exposures by exposure classes and instrument 3.2.
CR1-B Credit quality of exposures by industry or counterparty types 3.2.
CR1-C Credit quality of exposures by geography 3.2.
CR1-D Ageing of past-due exposures 3.2.
CR1-E Non-performing and forborne exposures 3.2.
CR2-A Changes in stock of general and specific credit risk 3.2.
CR2-B Changes in stock of non-performing and impaired loans and debt securities 3.2.
CR3 Credit risk mitigation techniques – overview 3.11.4.
CR4 Standardised and IRB approach - Credit risk exposure and CRM effects (CR4) 3.2.
CR5 Standardised approach (including a breakdown of exposures post conversion factor and post mitigation techniques) 2.2.2.1.3.
CR6 IRB – Credit risk exposures by exposure class and PD range 2.2.2.1.1.
CR7 IRB – Effect on RWA of credit derivatives used as CRM techniques 3.10.
CR8 RWA flow statements of credit risk exposures under IRB 2.2.2.1.
CR9 IRB approach – Backtesting of PD per exposure class 3.9.1.
CR10 IRB (specialised lending and equities) 2.2.2.1.1.
CCR1 Analysis of the counterparty credit risk (CCR) exposure by approach 3.10.
CCR2 Credit valuation adjustment (CVA) capital charge 3.10.
CCR3 Standardised approach - CCR exposures by regulatory portfolio and risk 2.2.2.1.3.
CCR4 IRB – CCR exposures by portfolio and PD scale 3.10.
CCR5-A Impact of netting and collateral held on exposure values 3.10.
CCR5-B Composition of collateral for exposures to counterparty credit risk 3.11.2
CCR6 Credit derivatives exposures 3.11.2.
CCR7 RWA flow statements of CCR exposures under Internal Model Method (IMM) N/A
CCR8 Exposures to CCPs 3.11.5
MR1 Market risk under standardised approach 2.2.2.3.
MR2-A Market risk under IMA 2.2.2.3.
MR2-B RWA flow statements of market risk exposures under an IMA 2.2.2.3.
MR3 VaR, stressed VaR and IRC by geography 5.2.1.
MR4 Comparison of VaR estimates with gains/losses 5.2.5.
Table Revised Pillar 3 disclosures requirements - BCBS PILLAR 3 2017
SEC1 Securitisation exposures in the banking book 4.3.4.
SEC2 Securitisation exposures in the trading book 4.3.4.
SEC3Securitisation exposures in the banking book and associated regulatory capital requirements – bank acting as originator or as sponsor 4.3.4.
SEC4 Securitisation exposures in the banking book and associated capital requirements – bank acting as investor 4.3.4.

2017 Pillar 3 Disclosures
1. INTRODUCTION
16
Table Guidelines on LCR disclosure - EBA/GL/2017/01 PILLAR 3 2017
LCR Quantitative information of Liquidity Coverage Ratio 7.1.
Table Guidelines on disclosure of encumbered and unencumbered assets - EBA/GL/2014/03 Annual Report
AE-A Encumbered and unencumbered assets 4. Economic and Financial Review Consolidated financial Report: Liquidity and funding risk management
AE-B Collateral received
AE-C Encumbered assets and collaterals recieved and liabilities related
Table Leverage Ratio - Comission implemtenting regulation (UE) 2016/200 PILLAR 3 2017
LRSum Summary reconciliation of accounting assets and leverage ratio exposures Appendix IX
LRCom Leverage ratio common disclosure. Appendix IX
LRSpl Split-up of on balance sheet exposures (excluding derivatives and SFTs) Appendix IX
Table Own funds requirements - Comission implemtenting regulation (UE) 1423/2013 PILLAR 3 2017
Template 1 Capital instruments’ main features Appendix VI
Template 2 Transitional own funds disclosure template Appendix VII
Table Countercyclical capital buffer - Comission implemtenting regulation (UE) 2015/1555 PILLAR 3 2017
Table 1Geographical distribution of credit exposures relevant for the calculation of the countercyclical capital buffer Appendix X
Table 2 Amount of institution-specific countercyclical capital buffer Appendix X
1.2.5. Differences between the consolidation method for accounting purposes and the consolidation method for regulatory capital calculation purposesFor the purposes of calculating the capital ratio based on the nature of their business activities, Santander Group units included in the prudential scope of consolidation are consolidated using the full consolidation method, with the exception of jointly controlled entities, which uses proportionate consolidation. All companies that cannot be consolidated based on their business activities are accounted for using the equity method and so are treated as equity exposures.
The basis of the information used for accounting purposes differs from that used for the calculation of regulatory capital requirements. The measures of risk exposure may differ depending on the purpose for which they are calculated, such as financial reporting, regulatory capital reporting or management information. The exposure data included in the quantitative disclosures in this document are used for calculating regulatory capital.
Appendix IV found on the Santander Group website contains table LI3, which provides information on the consolidation method used for each Group company based on the various scopes of accounting and prudential consolidation.
Access file2017 Pillar 3 Appendicesavailable on the Santander Group website
1.2.6. Disclosure criteria used in this reportThis report has been prepared in accordance with the applicable European Capital Requirements Regulation (CRR).
Below are the details of the type of information that best reflects the discrepancies between the regulatory information shown in this report, and the information shown in the annual report and the accounting information:
• The measures of credit risk exposure used for calculating regulatory capital requirements include (i) not only current exposures, but also potential future risk exposures arising from future commitments (contingent liabilities and commitments) or changes in market risk factors (derivative instruments) and (ii) the mitigating factors of these exposures (netting arrangements and collateral agreements for derivative exposures, and collateral and personal guarantees for on-balance-sheet exposures).
• Criteria used when classifying defaulted exposures in portfolios subject to advanced approaches for calculation of regulatory capital are more conservative than those used for preparing the disaggregated information provided in the Annual Report.

2017 Pillar 3 Disclosures 17
Main summary
Chapter summary
Enhanc. table
List of tables
The following table shows the relationship between the various categories of the financial statements and the risk categories in accordance with prudential requirements.
TABLE 2. DIFFERENCES BETWEEN ACCOUNTING AND REGULATORY SCOPES OF CONSOLIDATION AND MAPPING OF FINANCIAL STATEMENTS CATEGORIES WITH REGULATORY RISK CATEGORIES (LI1)
Millions of Euros
Carrying values as
reported in published
financial statements
Carrying values under
scope of regulatory
consolidation
Carrying values of items:
Subject to credit risk
framework
Subject to counterparty
credit risk framework
Subject to the securitisation
framework
Subject to the
market risk framework
Not subject to capital
requirements or subject to
deduction from capital
Assets
Cash and cash balances at central banks 110,995 110,992 110,991 – – 1 –
Financial assets held for trading 125,458 125,344 – 67,712 49 125,295 –
Financial assets designated at fair value through profit or loss 34,781 33,108 – 20,142 – 33,108 –
Available-for-sale financial assets 133,271 120,405 117,712 – 2,694 – –
Loans and receivables 903,013 905,399 900,072 11,161 1,867 – -7,702
Held-to-maturity investments 13,491 13,491 13,437 – 54 – –
Derivatives – Hedge accounting 8,537 8,539 – 8,539 – – –
Fair value changes of the hedged items in portfolio hedge of interest rate risk 1,287 1,286 – – – – 1,286
Investments in subsidiaries, joint ventures and associates 6,184 6,643 4,916 – – – 1,726
Reinsurance assets 341 – – – – – –
Tangible assets 22,975 20,047 20,047 – – – –
Intangible assets 28,683 29,186 – – – – 29,186
Tax assets 30,243 30,273 22,355 – – – 7,919
Other assets 9,766 11,309 10,705 – – – 604
Non-current assets and disposal groups classified as held for sale 15,280 15,383 15,383 – – – –
Total assets 1,444,305 1,431,406 1,215,618 107,554 4,664 158,404 33,020
Liabilities
Financial liabilities held for trading -107,624 -107,747 – – – -107,747 -86,764
Financial liabilities designated at fair value through profit or loss -59,617 -40,790 – -18,038 – -40,790 -5,232
Financial liabilities measured at amortised cost -1,126,069 -1,133,038 – – – – -1,133,038
Derivatives – Hedge accounting -8,044 -8,025 – – – – -8,025
Fair value changes of the hedged items in portfolio hedge of interest rate risk -330 -330 – – – – -330
Liabilities under insurance contracts -1,117 – – – – – –
Provisions -14,490 -14,580 -274 – – – -14,307
Tax liabilities -7,592 -7,512 – – – – -7,512
Other liabilities -12,591 -12,573 – – – – -12,573
Total liabilities -1,337,472 -1,324,595 -274 -18,038 – -148,536 -1,267,782

2017 Pillar 3 Disclosures
1. INTRODUCTION
18
Shown below are the main differences between the accounting values appearing on the financial statements and the exposures for prudential purposes.:
TABLE 3. MAIN SOURCES OF DIFFERENCES BETWEEN REGULATORY EXPOSURE AMOUNTS AND CARRYING VALUES IN FINANCIAL STATEMENTS (LI2)
Millions of Euros
Total
Items subject to:
Credit risk framework CCR framework
Securitisationframework
Market risk framework
Asset carrying value amount under scope of regulatory consolidation (as per template EU LI1) 1,486,240 1,215,618 107,554 4,664 158,404
Liabilities carrying value amount under regulatory scope of consolidation (as per template EU LI1) 166,848 274 18,038 – 148,536
Total net amount under regulatory scope of consolidation -330,777 35,177 -74,283 15,269 -306,941
Off-balance sheet amounts 294,231 292,455 – 1,775 –
Regulatory Add-on 33,291 – 33,291 – –
Differences in valuations – – – – –
Differences due to different netting rules, other than those already included in row 2 -369,695 – -62,754 – -306,941
Non-eligibility of the balances corresponding to accounting hedges (derivatives) -9 – -9 – –
CCPs 16,849 – 16,849 – –
Securitizations with risk transfer -2,133 -15,632 0 13,499 –
Differences due to consideration of provisions -24,288 -24,282 0 -6 –
Differences due to CRMs -81,709 -20,080 -61,630 – –
Differences due to CCFs -197,314 -197,284 -30 – –
Exposure amounts considered for regulatory purposes (EAD) 1,322,311 1,251,069 51,309 19,933 –
The reconciliation of public and non-public balance sheets is shown in Appendix V.
Access file2017 Pillar 3 Appendicesavailable on the Santander Group website
1.2.7. Substantial amendments due to a change in perimeter and corporate transactionsA breakdown is provided below of the main purchases and sales of stakes in other companies, and other major corporate transactions by Santander Group last year:
a) Acquisition of Banco Popular Español, S.A.On 7 June 2017 (the acquisition date), the Group, as part of its strategy for growth in the markets where it operates, acquired 100% of the share capital of Banco Popular Español, S.A. (Banco Popular) under the framework of the resolution system adopted by the Single Resolution Board ("SRB") and executed by the Spanish Fund for Orderly Bank Restructuring ("FROB"), in accordance with EU Regulation 806/2014 of the European Parliament and of the Council, of 15 July, Directive 2014/59/EU of the European Parliament and of the Council, of 15 May 2014, and Law 11/2015, of 18 June, on the recovery and resolution of credit institutions and investment firms.
Within the framework of the execution of this resolution, the following has occurred:
• All of Banco Popular's shares in circulation at the close of 7 June 2017 and the shares resulting from the conversion of the regulatory Additional Tier 1 capital instruments issued by Banco Popular have been converted into unavailable reserves.
• The conversion of all regulatory capital Tier 2 instruments issued by Banco Popular into newly issued Banco Popular shares, all of which have been acquired by Banco Santander for the price of one euro.
The operation was authorised by the European Commission on 8 August 2017. However, regulatory approval is still pending with regard to the indirect acquisition of some of Banco Popular's subsidiaries located in the United States.
b) Agreement for the sale of Banco Popular's property businessWith regard to Banco Popular's property business, on 8 August 2017, Banco Santander reported the transaction between Banco Popular and the Blackstone fund relating to the acquisition by the fund of 51%, and therefore control, of the aforementioned property business comprising the portfolio of repossessed properties, doubtful debts from the property sector and other assets related to this activity of Banco Popular and its subsidiaries (including deferred tax assets) registered on certain specific dates (31 March or 30 April 2017).

2017 Pillar 3 Disclosures 19
Main summary
Chapter summary
Enhanc. table
List of tables
The signing took place once the European Commission had authorised the acquisition of Banco Popular by Banco Santander, without imposing restrictions, having examined the transaction from a competition law perspective.
Completing the transaction will result in the creation of a company to which Banco Popular will transfer the business consisting of the aforementioned assets, 100% of the capital of Aliseda Servicios de Gestión Inmobiliaria, S.L. (“Aliseda”) and other subsidiary companies included in the transaction. The valuation attributed to the assets in Spain (properties, loans and tax assets, without including Aliseda and the other subsidiary companies) is approximately €10 billion but is subject to final determination depending on the volume of assets remaining on the completion date and the integration of Aliseda and all other subsidiary companies. Management of the capital of the joint venture will be assigned to Blackstone on completion.
The transaction is subject to obtaining, no later than 30 March 2018, the necessary regulatory authorisations and other conditions that are normal for this type of transaction. It is expected that these authorisations and conditions will be obtained and fulfilled by that date, resulting in completion during the first quarter of 2018.
As of 31 December 2017, in accordance with IFRS 5, the assets relating to this transaction have been classified under non-current assets and disposable groups of elements classified as held for sale. The earnings generated by these assets during the 2017 financial year have no material impact on the Group's income statement. Once the relevant regulatory authorisations have been obtained, the transaction will involve the derecognition of these assets from the Group's balance sheet, with no material impact on the income statement.
c) Acquisition of the shareholding of DDFS LLC in Santander Consumer USA Holdings Inc. (SCUSA) On 2 July 2015, the Group reported that it had reached an agreement to purchase the 9.65% shareholding that DDFS LLC held in SCUSA.
On 15 November 2017, after having agreed some amendments to the original agreement and having obtained the relevant regulatory authorisations, the Group completed the acquisition of 9.65% of SCUSA's shares for a total amount of $942 million, which meant a decrease of €492 million in the balance of minority interests and a reduction in reserves amounting to €307 million. Following this transaction, the Group's shareholding in SCUSA amounts to approximately 68.12%.
d) Agreement regarding Santander Asset Management
i) Acquisition of 50% of Santander Asset Management
On 16 November 2016, following the abandonment, agreed with the Unicredit Group on 27 July 2016, of the merger project involving Santander Asset Management and Pioneer Investments, the Group reported that it had reached an agreement with Warburg Pincus (“WP”) and General Atlantic (“GA”) through which on 22 December 2017 Santander acquired from these companies their 50% shareholding in Santander Asset Management.
Santander Group has paid a total sum of €545 million and has assumed financing of €439 million, the business combination generating goodwill of €1,173 million and €320 million of "intangible assets - contracts and relations with customers" identified in the preliminary assignment of the price, with no other value adjustments to the net assets of the business. Similarly, the market valuation of
the previous shareholding held has had no material impact on the Group's income statement.
Considering that the main activity of the business is asset management, the bulk of this is recorded off the balance sheet. The main net assets acquired, in addition to the aforementioned intangible assets, are net deposits in credit institutions (€181 million) and net tax assets (€176 million). Given their nature, their fair value does not differ from the book value recorded in the companies' books.
In compliance with current accounting standards, and in accordance with the provisions of paragraph 45 of IFRS 3 "Business combinations", the acquiring company has a period of one year from the acquisition date to value the business combination and to adjust the acquired company's assets and liabilities to fair value. The valuations made by the Group are the best estimate available on the date of drawing up these consolidated annual accounts, so they are provisional in nature and cannot be considered final. However, the Group does not expect any significant changes to occur to this amount up to the end of the period available for considering the valuation as final.
The amount contributed by this business to income and to the net attributed profit of the Group, both from the acquisition date and if the transaction were assumed to be carried out on 1 January 2017, is immaterial.
ii) Sale of the shareholding in Allfunds Bank
As part of the transaction to acquire the 50% of Santander Asset Management not owned by Santander Group, Santander, WP and GA agreed to explore different alternatives for the sale of their shareholding in Allfunds Bank, S.A. (“Allfunds Bank”), including a possible sale or floatation. On 7 March 2017, the Bank announced that, together with its partners in Allfunds Bank, it had reached an agreement for the sale of 100% of Allfunds Bank to funds affiliated with Hellman & Friedman, a leading venture capital fund, and GIC, the sovereign wealth fund from Singapore. On 21 November 2017, the Group reported that it had completed the sale by the Bank and its partners of 100% of the capital of Allfunds Bank, obtaining the sum of €501 million from the sale of its 25% shareholding in Allfunds Bank, which has led to a net capital tax gain of €297 million.
e) Acquisition of the retail banking and private banking business of Deutsche Bank Polska, S.A.On 14 December 2017, the Group reported that its subsidiary Bank Zachodni WBK, S.A., together with Banco Santander, S.A., had reached an agreement with Deutsche Bank, A.G. to acquire the retail banking and private banking business of Deutsche Bank Polska, S.A., excluding the portfolio of mortgages in a foreign currency and including the acquisition of shares in DB Securities, S.A. (Poland), for an estimated amount of €305 million, which will be paid in cash and newly-issued Bank Zachodni WBK, S.A. shares.
The transaction, which is subject to obtaining the corresponding regulatory authorisations and its approval by the General Shareholders' Meetings of Bank Zachodni WBK, S.A. and Deutsche Bank Polska, S.A, will not have a significant impact on the Group's fully loaded CET1 common equity.

2017 Pillar 3 Disclosures
1. INTRODUCTION
20
1.3. Regulatory frameworkIn December 2010, with the aim of enhancing the quality, consistency and transparency of the capital base and improving risk coverage, the Basel Committee on Banking Supervision (BCBS) published a new global regulatory framework for the international capital standards (Basel III), reinforcing the requirements established in the previous frameworks (known as Basel I, Basel II and Basel 2.5). On 26 June 2013 the Basel III legal framework was incorporated in the European legal order via Directive 2013/36 (CRD IV), which repeals Directives 2006/48 and 2006/49, and Regulation 575/2013 on prudential requirements for credit institutions and investment firms (CRR).
CRD IV was introduced into Spanish law through Law 10/2014 on the regulation, supervision and solvency of credit institutions, and its subsequent regulatory implementation via Royal Decree 84/2015 and Circular 2/2016 of the Bank of Spain, which completes its adaptation to Spanish law. This Circular largely repeals Circular 3/2008, on the calculation and monitoring of minimum capital (though, in the aspects covered by Circular 5/2008, on minimum capital and other mandatory reporting of information for mutual guarantee societies, the latter will remain in effect); and a section of Circular 2/2014, on the exercise of various regulatory options contained in the CRR. The CRR is directly applicable in Member States from 1 January 2014, and repeals all subordinate acts that entail additional capital requirements.
The CRR provides for a phased-in period that will allow institutions to adapt gradually to the new requirements in the European Union. The phased-in arrangements have been introduced into Spanish law through Bank of Spain Circular 2/2014 affecting both the new deductions from capital and the instruments and elements of capital that cease to be eligible as capital under the new regulation. In March 2016, the ECB published Regulation 2016/445/EU, adjusting certain timelines established in Bank of Spain Circular 2/2014, especially the calendar for (Deferred Tax Assets) DTAs. The capital conservation buffers provided for in CRD IV will also be phased in gradually, starting in 2016 and reaching full implementation in 2019.
The Basel regulatory framework is based on three pillars. Pillar 1 determines the minimum capital requirement and allows for the use of internal ratings and models to calculate risk-weighted exposures. The aim is to make regulatory requirements more sensitive to the risks actually incurred by financial institutions when carrying on their business activities. Pillar 2 establishes a system of supervisory review, aimed at improving banks’ internal risk management and capital adequacy assessment in line with their risk profile. Lastly, Pillar 3 deals with disclosure and market discipline.
Capital regulatory framework in force is being reviewed in order to reduce risk in the banking sector, introducing different Basel standards and integrating the loss absorption requirement into the European framework. Thus, on 23 November 2016, the European Commission released a draft of the new CRR and CRD IV incorporating different Basel standards, such as the Fundamental Review of the Trading Book for Market Risk, the Net Stable Funding Ratio (NSFR) for liquidity risk or the SA-CCR for calculation of the EAD by counterparty risk, interest rate risk in the banking book, as well as modifications related to the treatment of central counterparty entities, the MDA, the Pillar 2, the leverage ratio and the Pillar 3, among others. The most significant change is the implementation of the TLAC Term Sheet, established internationally by the Financial Stability Board (FSB) in the capital framework. Therefore, systemically important banks will have to comply with MREL/TLAC requirements under Pillar 1, while non-sistemically important banks need only comply with MREL under Pillar 2 that the resolution authority will decide on a case-by-case basis.
Additionaly, other elements of the resolution framework are examined, whose practical application has occurred this year for the first time due to the resolution of Banco Popular.
The Single Resolution Board published its MREL policy for the year 2017. With regard to the planning cycle of these resolutions, the Single Resolution Board is currently in a period of transition from the informative MREL targets to the establishment of bank-specific features requirements, applicable both in the single point of entry (SPE) and the multiple point of entry (MPE), and intended specially for the categorized as global systematically important banks (G-SIBs).
The 2017 MREL policy for the Single Resolution Board is based upon an approach of gradually achieving the target level over the next years. Shall this not be accomplished, it could be considered that the resolution of the entity is not possible. Additionally, with regard to the subordination requirement of eligible instruments for systematically important banks (G-SIBs), they must meet a minimum level of 13.5% of the RWAs plus the combined buffer requirement.
1.3.1. Regulatory changes in 2017The Basel III review concluded in 2017 after nearly three years on the table and the first resolution is now on trial in Europe, where negotiations are advancing on the review of the capital and resolution framework.
International frameworkOn 7 December, the Group of Governors and Heads of Supervision of the Central Banks (GHOS) approved the final framework for Basel III, after reaching agreement on how best to calibrate capital floors, which limit the capital savings generated from the use of internal models. This review seeks to ensure that the frameworks for calculating capital requirements in relation to credit, market and operational risk are more simple, readily comparable and risk-sensitive, while also reducing any variability in risk-weighted assets that is not justified with regard to the different risk profiles. The main aspects now agreed upon are as follows:
• The capital floors threshold, which has been set at 72.5% on an aggregate basis for all risks, subject to a maximum impact cap of 25% on RWAs by institution.
• A review of the standardised approach to calculating capital for credit risk, which now features the non-mechanistic reliance on external ratings for exposures to banks and companies and greater risk sensitivity for certain exposures.
• A review of the advanced approaches to calculating capital for credit risk for low default portfolios; sets limitations on the estimation of parameters through exposure floors; standardises the methodology for estimating risk parameters; and reviews treatment of risk mitigation techniques.
• A new standardised approach to calculating capital for operational risk, which combines size with indicators on past loss events. This new approach will replace internal AMA models and currently existing standardised approaches.
• The final calibration of the leverage ratio, which has been set at 3% for all institutions, while G-SIBs are subject to an additional surcharge of 50% of the G-SIB buffer (which depends on the bucket of systemic importance the bank falls within).

2017 Pillar 3 Disclosures 21
Main summary
Chapter summary
Enhanc. table
List of tables
• A review of the credit valuation adjustment (CVA), which eliminates internal models and reviews standardised approaches to bring them in line with the updated framework for market risk.
This final agreement will take effect on 1 January 2022, though there will be a phased-in period through to 2027 for the capital floors. The Basel Committee also announced that implementation of the new market risk framework (FRTB) will be put back to 1 January 2022 (initially envisioned for 2019).
The final framework makes significant improvements on the proposals initially raised by the Basel Committee. Santander holds a positive view of the final completion of this new framework, which will enhance certainty within the banking system on the requirements that entities must meet, while helping to reduce any unjustified variability among RWAs, thus diminishing credibility.
Taking into account the capital floors threshold established by Basel with our current capital consumption and the rest of the aspects contemplated in the new regulation, we consider that they will not have significant impacts on our solvency ratio.
The Basel Committee also released a discussion paper reviewing the treatment of sovereign debt through to March 2018. The main options raised in the paper involve additional disclosure requirements (Pillar 3) and capital surcharges (Pillar 1 and Pillar 2) for sovereign debt exposures except for exposures to central banks denominated in domestic currency (of the central bank) and for exposures to central banks in countries where monetary policy is centred on the exchange rate. However, the communication of the Basel Committee announcing this consultation acknowledges that no consensus has yet been reached on the need to make changes to the current treatment.
Meanwhile, the Basel Committee has continued to work on the following aspects in 2017:
• reviewing the methodology for identifying global systemically important banks. The first list of systemically important financial institutions, based on this new methodology, will be published in November 2019.
• reviewing the integration between the new accounting framework and the prudential framework on provisions following the entry into force of IFRS 9. Further consultations on this debate are expected throughout 2018.
For further details regarding IFRS9, please refer to chapter 5 >Risk Management Report > Section C.1.2.5 from Annual Report available on Santander Group's website
• elaboration of a new regulatory framework that establishes a preferred capital treatment for short term securitisations meeting STC (simple, transparent and comparable) requirements.
Turning to crisis management, the Financial Stability Board (FSB) and Basel have continued to address the key issues in 2017. Following successful completion in 2015 of the standard governing the total loss absorbing capacity (TLAC) needed to recapitalise a Global Systemically Important Bank (G-SIB) in the event of resolution, this year the FSB has published its Internal TLAC guidance (loss absorbing capacity for significant entities that form part of a resolution group), and two important consultations aimed at: (i) ensuring financing during resolution and (ii) guaranteeing completion of a bail-in process. Basel
published its final TLAC disclosure proposal and a new consultation is now expected in 2018.
In November 2017, the Financial Stability Board (FSB) updated the list of G-SIBs for 2019. Santander remains within the least systemic group of banks and is subject to the minimum additional capital surcharge for banks of systemic importance (1%).
European regulationThe European Banking Authority (EBA) continued to issue standards and guidelines implementing aspects of European capital requirements (CRR/CRD IV) and helping to guarantee harmonious i mplementation of minimum capital requirements within the European Union. These include the following regulatory initiatives: guidelines on uniform disclosure of IFRS 9 transitional agreements; discussion paper on the treatment of structural FX risk; consultation on significant risk transfer, risk retention and homogeneity of securitisations' underlying exposures; and updates to the guidelines on SREP, stress tests and IRRBB (interest rate risk in the banking book) in order to enhance the Pillar 2 framework.
Meanwhile, the EBA released the following documents as part of its work programme published in February 2016 aimed at reducing unjustified variability in capital consumption by different risk profiles, thus improving the homogeneity and comparability of capital ratios among banks:
• in January 2017, the final guidelines on the application of the definition of default in a bid to harmonise the definition of default across Europe.
• In March 2017, consultation paper on draft RTS on the specification of the nature, severity and duration of an economic downturn in order to estimate LGD (loss given default) and CCF (credit conversion factors).
• in November 2017, the final guidelines on the estimation of risk parameters (PD, LGD and treatment of defaulted assets).
On the subject of liquidity, following the 2016 consultations the EBA released its final proposals in 2017 with the aim of establishing the liquidity coverage ratio (LCR) and asset encumbrance disclosure requirements. The EBA is also expected to develop a set of standards to harmonise NSFR reporting requirements.
Work has also continued across Europe in 2017 to review the capital framework (CRR / CRD IV) and the resolution framework with the aim of the new capital framework entering into force before 1 January 2019 and being implanted in 2020-2021.
On the other hand, in December 2017, a new general regulatory framework for securitisations and a specific regulatory framework for STS (simple, transparent and standardised) securitisations were published. Furthermore, a new capital treatment for securitisations is established (modifying its actual treatment in CRR), along with preferred capital treatment for those securitisations meeting STS requirements. These modifications over the existing regulatory framework must be applied from 1 January 2019.
Meanwhile, the European Commission has yet to determine the equivalence of the jurisdictions of third countries, based on EBA questionnaires. The work had been put on hold in 2016 but was resumed in late 2017, with Argentina being one of the jurisdictions to undergo an assessment. When it comes to the qualification of CCPs, the Commission has extended the phased-in period until 15 June 2018.

2017 Pillar 3 Disclosures
1. INTRODUCTION
22
With respect to supervision, the supervisory activity conducted by the Single Supervisory Mechanism (SSM) in the framework of the Supervisory Review and Evaluation Process (SREP) is notable. In this area, Santander Group’s Joint Supervisory Team from European Central Bank worked tirelessly in 2016, holding over 100 meetings with the Bank, most of which were related to its monitoring and refinement.
Along with the intense agenda of supervision within the framework of the Supervisory Review and Evaluation Process (SREP), the SSM has made great strides towards the harmonisation of supervisory policies across countries, and in the transparency of their expectations.
Europe also continues to make progress in the implementation of the crisis management framework. The Single Resolution Mechanism (SRM, the second pillar of the Banking Union after the Single Supervisory Mechanism) has been operational since 1 January 2016. The Single Resolution Board has been working alongside national resolution authorities to develop the policies of the MREL (minimum requirement of eligible liabilities). Banks must meet this requirement following a phased-in period to last no longer than four years. The Single Resolution Board is expected to inform the Bank of its requirement in the first quarter of 2018.
Turning to the Single Resolution Fund managed by the Single Resolution Board, the period of gradual mutualisation will allow for a transition from the national resolution funds in place in several eurozone countries through to 2016, to the Single Resolution Fund, which will be fully implemented by 2024. The funding target of the Single Resolution Fund is 1% of covered deposits in 2024. The first year was calculated at 60% nationally (BRRD perimeter) and 40% across the euro area (SRM perimeter). In 2017, these percentages have been inverted, with 40% of funding in the BRRD perimeter and 60% within the SRM perimeter. Funding under the SRM perimeter will be steadily raised to reach 100% in 2024.
In October 2017, the Commission issued a release calling for the completion of the Banking Union. The measures it proposes include the need to reach an agreement in 2018 on the creation of a backstop for the Single Resolution Fund and Pillar 3 of the Banking Union: the European Deposit Insurance Scheme (EDIS). There are also plans to legislate a framework to create sovereign bond-baked securities (SBBS) in early 2018 and reduce NPL before the end of 2018.
Santander Group voices the concerns and thoughts of its corporate offices and local teams on matters relating to the financial sector where these affect business at the Group. The corporate and local public policy function, in coordination with the business units and support divisions concerned in each case, identifies the regulatory alerts and establishes Santander Group’s stance.
The main courses of action taken along these lines are as follows:
• Santander Group has been a keen participant in the main banking associations worldwide and in Europe, and in the main markets in which we operate. Among other assistance, it contributes inputs to the replies drawn up in connection with ongoing regulatory consultations.
• Santander Group has maintained proactive, constructive dialogue with policy-makers through the existing channels (hearings) and sends individual replies to official consultations on issues considered relevant to Santander Group.
• In particular, Santander Group has worked to consolidate and make known the sturdiness of our organisational model through subsidiaries that are fully independent when it comes to capital and liquidity. It also has the benefits of geographic diversification and recognition of the issuance of capital instruments from third countries and equivalence of the jurisdictions of third countries where the Bank operates. In addition, one of the Bank’s main objectives is for subsidiaries to adopt advanced return- and capital-based management systems via internal models, given the improvements in comprehensive risk management and adequacy in the calculation of capital these provide.

2017 Pillar 3 Disclosures 23
Main summary
Chapter summary
Enhanc. table
List of tables

2.1. Capital 252.1.1. Capital function 27
2.1.1.1. Organization 272.1.1.2. Capital governance 27
2.1.2. Capital management and adequacy
28
2.1.3. Capital management priorities in 2017
29
2.1.4. Capital targets 292.1.5. Capital Buffers and eligible
capital requirements30
2.1.5.1. Global Systemically Important Institutions
31
2.1.5.2. Domestic Systemically Important Institutions
33
2.2. Pillar 1 regulatory capital 332.2.1. Eligible capital 332.2.2. Capital requirements 36
2.2.2.1. Credit Risk 402.2.2.2. Credit risk –
Securitisations66
2.2.2.3. Market risk 752.2.2.4. Operational risk 78
2.2.3. Leverage ratio 80 2.3. Pillar 2 economic capital 82
2.3.1. RoRAC and value creation 832.3.2. Capital planning and stress
tests84
2.4. Recovery and resolution plans and special situation response framework
86
2.4.1. Viability Plans 862.4.2. Resolution plans 872.4.3. Special Situation Management Framework
88
2.5. Total Loss Absorbing Capacity (TLAC) y Minimum Required Elligible Liability (MREL)
88
CAPITAL
2

2017 Pillar 3 Disclosures 25
Main summary
Chapter summary
Enhanc. table
List of tables
2. Capital
2.1. CapitalCapital management and control at Santander Group is a fully transversal process that seeks to guarantee the Bank’s capital adequacy, while complying with regulatory requirements and maximising profitability. It is determined by the strategic objectives and by risk appetite set by the board of directors. To achieve this, the following policies have been established to shape the approach that the Group applies to capital management:
• Establish adequate capital planning, so as to meet current needs and provide the necessary resources to meet the needs of the business plans, regulatory requirements and the associated risks in the short and medium term, while maintaining the risk profile approved by the board.
• Ensuring that the Group and its companies maintain sufficient capital to cover requirements during stress scenarios due to the increase in risks as the macroeconomic climate deteriorates.
• Optimising capital use through appropriate allocation of capital among the businesses, based on the relative return on regulatory and economic capital and taking the risk appetite, growth and strategic objectives into account.
Santander Group maintains a very comfortable capital adequacy position well clear of the levels required by applicable regulations and by the European Central Bank.
TABLE 4. MAIN CAPITAL FIGURES AND CAPITAL ADEQUACY RATIOS
Millions of Euros
Fully loaded Phased-in
Concept Dec-17 Dec-16 Dec-17 Dec-16
Common Equity (CET1) 65,563 62,068 74,173 73,709
Tier 1 73,293 67,834 77,283 73,709
Total capital 87,588 81,584 90,706 86,337
Risk weighted assets 605,064 588,088 605,064 588,088
Ratio CET1 10.84% 10.55% 12.26% 12.53%
Ratio Tier 1 12.11% 11.53% 12.77% 12.53%
TOTAL CAPITAL RATIO 14.48% 13.87% 14.99% 14.68%
CAPITAL AND SOLVENCY RATIOS
2.372.34
2.22 2.15
1.270.98
0.51
10.84 10.55 12.26 12.53
Dec. 17Dec. 17 Dec. 16Dec. 16
Fully loaded Phased in
14.6814.9913.87
14.48
Capital ratio % Tier 2 Tier 1 CET1
Santander Group's main solvency ratios at 31 December 2017 are as shown in table 4. Phased-in ratios are calculated applying the transitory schedules for implementation of Basel III, whereas fully loaded ratios are calculated without applying any schedules, hence with the final regulation.
In fully-loaded terms CET1 in December stood at 10.84%, increasing by 29 basis points during the year and reaching the goal at year-end which was announced at the beginning of the year. The fully-loaded capital ratio was 14.48%, up by 61 basis points during the year.
2017 CET1 FULLY LOADED EVOLUTION
%
Dec
. 16
Ord
inar
y ge
nera
tion
Ban
co P
opul
ar
acqu
isit
ion
Cap
ital
in
crea
se
Peri
met
er
Ava
ilabl
e fo
r sa
le a
nd o
ther
s
Dec
. 17
10.55
1.14
0.53
-1.14-0.19 -0.05
10.84
+29b.p.

2. CAPITAL
26 2017 Pillar 3 Disclosures
The increase of 29 basis points in the year is mainly due to profit generation and risk assets management, which contribute to the ordinary generation in the year, that reaches 53 b.p. However, 19 b.p. from perimeter must be substracted (SAM operation/Allfunds and acquisition of participation in SC USA) and other 5 b.p. from various causes, among which the valuation of available for sale portfolios is found. The acquisition of Banco Popular did not entail any effects regarding the solvency ratio, since it was offset by the capital increase fulfilled in July 2017.
From a qualitative point of view, Santander Group has solid ratios suited to its business model, the structure of its balance sheet and its risk profile. Santander Group exceeds the 2018 minimum regulatory capital requirements for the total ratio by 284 basis points, taking into account the surpluses and shortfalls of AT1 y T2.
For further information see section 2.1.5 of the report
Santander Group is working towards a fully loaded CET1 ratio of over 11% in 2018.
Strategic principles of the capital function
Autonomy Solvency Efficiency
• Efficiency. The Group and its subsidiaries must roll out mechanisms to actively seek and promote an efficient use of capita and to ensure that the value created by an investment exceeds at least the cost of the capital invested. Capital is a scarce com-modity that must be used as efficiently as possible, given the high cost of generating capital, whether organically or through the markets. Subsidiaries must have ongoing monitoring mechanisms in place to opti-mise their capital consumption.
CENTRALISED MONITORING
• Centralised monitoring. The capital management model must ensure a holistic view, through a corporate environment of global coordination and review (every business, every geography). The first level of monitoring, by the local units themselves, is supplemented by the monitoring activity of the corporate units. One of the main ways the Group achieves this is by defining and applying standard policies, metrics, methodologies and tools across the Group, though these may be adapted accordingly to bring them in line with local regulations and supervisory requirements and to reflect the de-gree of progress made by each subsidiary.
• Autonomy. The Group's corporate struc-ture is based on a legally independent subsidiary model, each responsible for its own capital and liquidity. This provides advantages when raising funds and limits the risk of contagion, thus reducing systemic risk. Under this structure, sub-sidiaries are subject to two tiers of su-pervision and internal control: local and global. Each unit must raise and manage its own financial resources accordingly in order to maintain the required levels of capital at all times. Local units must have the necessary capital to carry on their activity autonomously and meet local regulatory requirements and the expec-tations of their local market.
• Solvency. The Group and its subsidiaries must ensure at all times that the structure and level of their capital is suitable in view of the risks to which they are exposed. Capital must be allocated accordingly so as to ensure the effective management of the risks assumed within the subsidiaries and it must be assigned proportionately among all those risks.

2017 Pillar 3 Disclosures 27
Main summary
Chapter summary
Enhanc. table
List of tables
2.1.1. Capital functionThe core principles provide the basic guidelines for the Group entities in managing, monitoring and controlling capital.
2.1.1.1. OrganisationThe organisational structure has been defined with a view to achieving compliance with the principles of capital management while ensuring that the relationship between each subsidiary and the corporation in this function facilitates the subsidiary’s financial autonomy, subject to strict monitoring coordinated at Group level.
Santander Group's risk management and control model is based on three lines of defence. The first line comprises the business functions or activities that assume or generate exposure to risk. Risks undertaken or generated within the first line of defence must be compatible with the risk appetite and the limit in place. To carry out its function, the first line of defence must have the resources to identify, measure, address and report the risks assumed. The second line of defence comprises the function of controlling and supervising risk, along with the compliance function. The second line is charged with effective control of risks and ensures that they are managed in accordance with the risk appetite defined.
Internal Audit is the third line of defence and the last layer of control, and regularly assesses policies, methods and procedures to ensure they are suitable and also checks they are operational.
The risk control function, the compliance function and the internal audit function are sufficiently separate and independent from each other and also regarding the other functions they control and supervise when carrying out their tasks. They likewise have access to the board of directors and/or to its committees at the highest level.
2.1.1.2. Capital governanceTo ensure the capital function operates properly when it comes to both decision-making and supervision and control, Santander Group has developed a structure of responsive and efficient governance bodies so as to ensure the involvement of all the areas concerned and the necessary involvement of senior management. Because of the Group’s hallmark subsidiary-based structure, the governance structure of the capital function must be adapted to preserve the subsidiaries’ capital autonomy, while allowing centralised monitoring and coordinated management at Group level. There are also various committees that have responsibilities at regional level and also for coordination at Group level. The local committees must report to the corporate committees as and when required on any relevant aspects of their activity that may affect capital so as to ensure proper coordination between the subsidiaries and the corporate centre.
Determine the minimum level of capital adequa-cy considered sufficient for the entity to operate satisfactorily. Promote efficient capital manage-ment by establishing minimum profitability re-quirements and allocating capital appropriately. Analyse and approve public information.
Pre-Board approval of the internal capital adequa-cy assessment process (ICAAP) and the disclosures on capital adequacy and capital (Pillar 3 Disclo-sures) to ensure that the content is sufficiently rel-evant and representative of the Group’s situation.
Statutory
Committees
Management and adequacy
Governance of the Capital function
Technical committee responsible for the supervision, approval and assessment of all factors related to the Group’s capital and solvency.
Oversee compliance with capital adequacy requirements.
Supervise and review the procedures established to ensure efficient capital management based on monitoring of advanced metrics and the review and validation of planning and stress tests.
Deploy and review the use of advanced approaches in the Group and approve the implementation of improvements and developments of the approaches.
Coordinate relations with supervisors and the flow of information to the market.
Intermediate and coordinate decisions regarding liquidity and capital.
Board of Directors
Board Risk Committee
Capital Committee
18Meetings held by the
Capital Committee in 2017

2. CAPITAL
28 2017 Pillar 3 Disclosures
2.1.2. Capital management and adequacyThe goal of capital management and adequacy at Santander Group is to guarantee the entity’s capital adequacy and maximise its profitability, while ensuring compliance with internal capital goals and regulatory requirements. Capital management is a fundamental strategic tool for decision making at both local and corporate level and serves to create a common framework of action by establishing uniform definitions of capital management criteria, policies, functions, metrics and processes.
The Group works with the following variables relating to the concept of capital:
KEY CAPITAL FIGURES
• Capital requirements: The minimum amount of capital the supervisory authority requires the entity to hold to safeguard its solvency, based on the amount of risk assumed, in terms of credit, market and operational risk.
• Eligible capital: The capital the regulator considers eligible to meet capital requirements. The main components of eligible capital are accounting capital and reserves.
The return (understood as net profit after tax) on internally required economic capital, Therefore, the higher the economic capital, the lower the RoRAC. For this reason, the Bank must demand a higher return from transactions or business units that consume more capital.
RoRAC takes the investment risk into account and so provides a risk-adjusted measure of return.
The use of RoRAC allows the Bank to better manage its activ-ities, assess the real risk-adjusted return of businesses and be more efficient in decision-making relating to investments.
Defined as the return (understood as net profit after tax) on a business’ risk-weighted assets.
The use of RoRWA allows the Bank to set up strategies to allocate regulatory capital and ensure the maximum return is obtained.
Any profit generated above and beyond the cost of economic capital.
The Bank will create value when the risk-adjusted return, meas-ured by RoRAC, is higher than its cost of capital. Otherwise value will be destroyed. It measures the risk-adjusted return in absolute terms (monetary units), supplementing the RoRAC result.
Average NPL losses expected by the entity over the course of an economic cycle. From the point of view of expected loss, defaults are considered a “cost” that could be eliminated or reduced through appropriate selection of borrowers.
• Internal capital requirements: The minimum amount of capi-tal that the Group needs with a specified level of probability to absorb unexpected losses deriving from its current exposure to all risks taken on by the entity (including risks additional to those contemplated under the regulatory capital require-ments).
• Available capital: The amount of capital the Group itself con-siders eligible, on management criteria, to meet capital needs.
The minimum return required by investors (shareholders) as compensation for the opportunity cost incurred and the risk as-sumed in investing their capital in the entity. This cost of capital represents a “cut-off rate” or “minimum return” to be achieved and allows comparisons to be made between the different busi-ness units and their efficiency to be assessed.
Regulatory measure that monitors the financial solidity and strength of the Entity by linking size and capital. This ratio is calculated dividing the Tier 1 by the leverage exposure, which takes into account the balance sheet exposure and adjustments due to derivatives, secured financing transactions (SFTs) and off-balance sheet items.
Regulatory capital Return on risk-adjusted capital (RoRAC)
Leverage ratio
Return on Risk Weighted Asset (RoRWA)
Value creation
Expected loss
Economic capital
Cost of capital

2017 Pillar 3 Disclosures 29
Main summary
Chapter summary
Enhanc. table
List of tables
The Group’s capital function is preformed at two levels:
• Regulatory capital: regulatory capital management is based on an analysis of the capital base, the capital adequacy ratios as defined by applicable regulations and the scenarios used in capital planning. The aim is for the capital structure to be as efficient as possible, in terms of both cost and compliance with regulatory requirements. Active capital management includes strategies for capital allocation and for efficient usage of business units, securitisation, asset sales and placements of capital instruments (preference shares, subordinated debt) and hybrid capital instruments.
• Economic capital: economic capital management is there to ensure that sufficient capital is available and assigned accordingly to cover all the risks to which the Group is exposed as a result of its business activity and according to its risk appetite. It also aims to optimise value creation at the Group and across all its business units. By effectively measuring the capital needed for a given business activity, together with the return on that business, the Group is able to optimise value creation by selecting those business activities that offer the best return on capital. This capital assignment process is carried out under different economic scenarios and with the level of capital adequacy decided by Santander Group in each case. The scenarios include those that are expected to occur and those that are far less likely though still plausible.
2.1.3. Capital management priorities in 2017Details of the most significant actions undertaken in 2017 are set out below.
Issues of financial instruments with the legal status of capitalBanco Santander S.A. effected two issues of contingent convertible bonds (CoCos) during the year for 750 million euros and 1,000 million euros in a bid to strengthen its AT1 capital.
Banco Santander S.A. carried out two issuances of subordinated debt in the first half of the year for a combined total of 1,150 million euros. Both placements are intended to enhance the total capital ratio by qualifying as Tier 2 capital.
Further, in December Banco Santander S.A. completed a placement of contingently redeemable perpetual bonds (Loyalty Bonds) offered to certain Santander Group customers affected by the resolution of Banco Popular and totalling 981 million euros. This placement had no impact on the Group’s capital ratios.
Following the acquisition of Banco Popular, Banco Santander announced a capital increase in July for a nominal sum of 729,116,372.50 euros. The rights issue was to be carried out by issuing and circulating 1,458,232,745 new common shares, all of the same series as those
As of 31 December 2017, Santander Group meets all the minimum capital requirements under current regulations.
currently in circulation and all conferring a pre-emptive subscription right on their holders. The new shares were issued at a face value of 0.50 euros plus a share premium of 4.35 euros per share, thus bringing the total price of the new shares to 4.85 euros per share and the total cash value of the capital increase (including both nominal and share premium) to 7,072,428,813.25 euros.
Dividend policy*Most of the Group’s quarterly remuneration for shareholders in 2017 was paid out in cash and it was announced that remuneration charged to 2017 earnings would be 0.22 euros distributed in four dividends: three cash dividends and one scrip dividend (Santander Dividendo Elección), the latter amounting to 0.04 euros per share. It was also announced that cash pay-outs this year and in the years following would account for 30-40% of profits, and shareholder remuneration would be in line with rising profits.
The targets were met in 2017, resulting in an effective dividend payment of 40% of profits and a 9% increase in the per-share cash dividend.
In December 2015, the European Central Bank issued a recommendation on dividend allocation policies applicable to all Eurozone credit entities as of 2016. The recommendation calls for conservative dividend policies and prudent assumptions and has been fully observed by Banco Santander S.A.
Last but not least, a number of restrictions on the payment of dividends have been imposed in certain regions as a result of new and stricter regulations on capital adequacy. That said, the Group currently has no knowledge of any practical or legal impediment to the transfer of funds from the subsidiaries to the parent of Santander Group in the form of dividends, loans or advances, repatriation of capital or other instruments beyond the dividend policy issued by the competent national authority of our Polish subsidiary (KNF), which applies to banks that hold a significant interest in mortgages denominated in foreign currency. Meanwhile, our subsidiary in the United States has passed the Comprehensive Capital Analysis Review (CCAR) process and a number of existing restrictions on dividend payments have now disappeared.
2.1.4. Capital targets
Santander Group continues to work towards a fully loaded CET1 ratio of over 11% in 2018.
2017
10.84%
2016
10.55%
2018E
>11%
FULLY LOADED CET1 CAPITAL EVOLUTION
%
2015
10.05%
20141
9.65%
Note 1: Pro-forma including Jan' 15 capital increase
* Dividends charged to the 2017 results are subject to approval of the Shareholders Meeting.

2. CAPITAL
30 2017 Pillar 3 Disclosures
The continuous improvements seen in the capital ratios is a product of the profitable growth strategy pursued by Santander Group .and a culture of active capital management across all levels of the organisation. Highlights:
• The reinforcement of teams dedicated to capital management and greater coordination with the Corporate Centre and local teams.
• All countries and business units have drawn up individual capital plans focused on achieving a business that maximises the return on capital.
• Greater weighting of capital as part of incentive schemes. Certain aspects relating to capital and returns on capital are now taken into account when setting the variable remuneration payable to members of the senior management.
• The relevant metrics include the fully-loaded CET1, capital contribution, or the return on risk-weighted assets (RoRWA).
• The qualitative aspects in question include the proper management of regulatory changes affecting capital, effective management of capital relating to business decisions, moving the capital plan towards the defined objective and effective capital allocation.
In tandem, the Group is continuing to develop a programme to ensure the continuous improvement of infrastructure, processes and methodologies supporting all aspects relating to capital. The aim here is to ensure more active management of capital, enable the Group to respond rapidly to the already numerous and still growing number of regulatory requirements and carry out all associated activities more efficiently.
2.1.5. Capital buffers and eligible capital requirementsSantander Group must comply, at all times, with the combined capital buffers requirement, defined as the total CET1 capital necessary to meet the following obligations:
• Capital conservation buffer (CCoB): mandatory for all entities and to be phased in from 1 January 2016. The buffer for banks in 2018 will therefore be 1.875%.
• Systemic buffers: a four-year phase-in period is provided for these buffers, applicable from 1 January 2016.
• Systemically Important Financial Institutions (SIFIs): for entities designated as systemically important, using a common methodology. Here, there are two different surcharges, with the largest buffer rate of the two being applicable:
1) G-SIB buffer (Global Systemically Important Banks): common methodology whereby banks are classified into buckets based on their systemic global risk.
2) D-SIB buffer (Domestic Systemically Important Banks).
• Systemic risk buffer (SRB): intended for entities with systemic importance that must possess additional loss-absorbing capacity. This buffer is discretionary and applies to all or some exposures of an entity (domestic and/or foreign risks, risks specific to certain business sectors, etc.), as determined by the authorities.
If the SRB covers all types of exposures, the greatest of the three systemic buffer rates will be applied. If the SRB only applies to a certain
type of exposure, the SRB buffer will be added to the greater of the other two systemic buffers (G-SIB or D-SIB).
• Countercyclical capital buffer (CCyB): the CCyB will be applied when the authorities deem that lending is growing excessively in an specific jurisdiction and it will be applied in order to constrain this excessive growth. This buffer is specifically calculated for each bank or group and consists of the weighted average of percentages of countercyclical buffers applied in regions in which the bank's relevant exposures are located. For applying this buffer, a four-year phase-in period applicable from 1 January 2016 has been established too.
The table below summarises the required regulatory rates based on the different capital buffers to be applied, along with the phased-in timeline and Banco Santander’s situation in 2018:
Applicable to Buffers (% RWAs) 2016 2017 2018 2019
All entities Conservation (CCoB)
0,625% 1,25% 1,875% 2,5%
Designated entities
G-SIB entities (1%-3,5%) (1)
25% del buffer
50% del buffer
75% del buffer
100% del buffer
D-SIB entities (2) 25% del buffer
50% del buffer
75% del buffer
100% del buffer
At discretion of competent national authority
Systemic risk (SRB) (3)
0%-5% 0%-5% 0%-5% 0%-5%
Countercyclical (CCyB) (4)
0%-0,625%
0%-1,25%
0% - 1,875%
0% - 2,5%
Consolidated combined buffer
CCoB + CCyB + Max (5) (G-SIB, D-SIB, SRB)
(1) According to the list of Global Sistemically Important Banks (G-SIBs) published by the FSB for 2018, it is demanded a total buffer of 1% for Santander (this means that 0.75% is required in 2018)
(2) Domestic Systemically Important Banks. The Bank of Spain requires a 1% buffer for Santander (this means that 0.75% is required in 2018).
(3) To Santander Group the requirement by this concept is of 0%.
(4) Applicable countercyclical buffer: a) Bank of Spain, first quarter of 2018: exposures located in Spain: 0% b) Exposures located in Norway, Sweden: 2%
(5) The maximum of the 3 buffers applies if the SRB buffer covers domestic and nondomestic exposures. Otherwise, the higher of G-SIB and D-SIB plus the SRB buffer applies.
The geographic distribution of relevant lending exposures for calculating the countercyclical capital buffer is shown in Appendix X available on the Santander Group website.
Access file2017 Pillar 3 Appendicesavailable on the Santander Group website
Capital requirementsThe decision on capital resulting from the Supervisory Review and Evaluation Process (SREP) under the European Central Bank’s (ECB) Single Supervisory Mechanism comprises a Pillar 2 Requirement (Pillar 2R) and Pillar 2 Guidance (Pillar 2G). Pillar 2R is binding, and failure to comply may have direct legal consequences for banks. Pillar 2G is not directly binding, and failure to comply has no bearing on the Maximum Distributable Amount (MDA) threshold. Moreover, Pillar 2G does not automatically trigger action by the ECB. However, the ECB does

2017 Pillar 3 Disclosures 31
Main summary
Chapter summary
Enhanc. table
List of tables
expect compliance with Pillar 2G at all times. If a bank is not compliant with Pillar 2G, the ECB will give careful consideration to the reasons and circumstances and may define additional supervisory control measures.
At the end of 2017, the ECB sent each bank the minimum prudential capital requirements for the following year. In 2018, Santander Group must report a phased-in Common Equity Tier 1 (CET1) ratio of at least 8.655% on a consolidated level. This requirement includes the Pillar 1 requirement (4.5%); the Pillar 2 requirement (1.5%); the capital conservation buffer (1.875%); the requirement due to its status as a global systemically important bank (0.75%) and the countercyclical capital buffer requirement (0.03% of CET1). Santander Group must also maintain a minimum capital ratio of 10.155% for phased-in T1, and a minimum total ratio of 12.155% for phased-in.
As of 31 December 2017, Banco Santander had a CET1 regulatory capital ratio of 12,26% and a total ratio of 14,99%
Regulatory ratiosDec. 2017
Regulatory requirements2018
REGULATORY CAPITAL
CET1
CET1
12.26%
8.655%
0.51%
2.00%
1.50%
0.03%
2.22%
0,.75%
1.875%
1.50%
4.50%
T1
T2
T2
AT1
CCy B3
G-SIB1
CCoB2
Pillar 2 Requirement
Pillar 1 minimum
Capital ratio(phased-in)
14.99%
Total capital12.155%
1. Global Systemically Important Banks buffer.
2. Capital conservation buffer.
3. Counter-cyclical capital buffer calculated using September 2017 data for requirement as of 1 January 2018.
2.1.5.1. Global Systemically Important InstitutionsSantander Group is one of the 30 institutions designated as global sistemically important institutions (G-SIIs).
The health of a global systemically important institution poses a risk to financial stability. The insolvency of a systemically important institution, or even just the expectation that it might become insolvent, is difficult to predict but could certainly undermine the financial system and even the real economy.
This warrants special prudential treatment, which has led to the introduction of specific capital buffer requirements for both global (G-SII) and domestic (D-SII) systemically important institutions.
This designation requires Santander Group to meet additional requirements mainly relating to the following:
• Its capital buffer (Santander Group is included in the group of banks with the smallest capital buffer of 1%)
• TLAC (Total Loss-Absorbing Capacity) requirements
• The requirement to publish relevant information more often than other banks
• Stricter regulatory requirements for the internal control bodies
• Special supervision
• Requirement to submit special reports to the supervisors
The Basel Committee and the Financial Stability Board decide what banks qualify as global systemically important institutions, using a method based on five indicators: size, cross-jurisdiction activity, interconnectedness with other financial institutions, substitutability of financial services/infrastructure and complexity (with each category given an equal weighting of 20%). This methodology is currently under review by the Basel Committee on Banking Supervision. The first list of global systemically important institutions based on this new methodology will be published in November 2019.

2. CAPITAL
32 2017 Pillar 3 Disclosures
TABLE 5. INDICATORS FOR SYSTEMICALLY IMPORTANT INSTITUTIONS
Category Individual indicator Rationale
Size Exposure used for the leverage ratio calculation The larger the bank, the greater its destabilising impact
Cross-jurisdictional activity Cross-jurisdictional assets This indicator is intended to capturea bank’s global footprint.
Cross-jurisdictional liabilities
Interconnectedness Intra-financial system assets A bank’s systemic impact is likely to be positively related to its interconnectedness Intra-financial system liabilities with other financial institutions.Intra-financial system liabilities
Securities outstanding
Substitutability/financialinstitution infrastructure
Assets under custody The systemic impact is likely to be greater if thebank’s activity is not substitutable by other banks.
Payments activity
Underwritten transactions in debt and equity
Complexity Notional amount of over-the-counter (OTC) derivatives The more complex a bank is, the greater are the costs and time needed for its resolution.
Level 3 assets
Trading and available-for-sale securities
The information needed to evaluate the indicators is requested yearly from banks whose leverage exposure exceeds 200,000 million Euros, or from any other banks at the supervisor’s discretion (in December 2016 a total of 76 banks were considered). All these institutions are then required to publish the information before 30 April of the following year.
The information is used to draw up a global indicator. The score obtained by each bank will determine the size of the capital buffer required of it, which is based on a set of buckets defined by the regulators (CET1 surcharge ranging from 1% to 3.5%).
In November 2017, the Financial Stability Board (FSB) published the list of global systemically important institutions based on December 2016 data. This list applies to 2019. Compliance with these requirements gives Santander Group greater solidity than its domestic peers. Santander Group is currently subject to a systemic buffer surcharge of 1%, which will become fully effective in 2019 (0.75% in 2018).
For more details regarding Quantitative Indicators access the file GSIBS indicadores cuantitativos, section Shareholders and Investors/Other presentations (April month) on the Santander Group website.
TABLE 6. GLOBAL SYSTEMICALLY IMPORTANT INSTITUTIONS
Capital buffer Entity
5 (-3.50%) (Empty)4 (-2.50%) JP Morgan Chase
3 (-2.00%)
Bank of AmericaBNP ParibasDeutsche BankHSBC
2 (-1.50%)
Bank of ChinaBarclaysBNP ParibasChina Construction BankGoldman SachsIndustrial and Commercial Bank of China LimitedMitsubishi UFJ FGWells Fargo
1 (-1.00%)
Agricultural Bank of ChinaBank of New York MellonCredit SuisseGroup Crédit AgricoleING BankMizuho FGMorgan StanleyNordeaRoyal Bank of CanadaRoyal Bank of ScotlandSantanderSociété GénéraleStandard CharteredState StreetSumitomo Mitsui FGUBSUnicredit Group

2017 Pillar 3 Disclosures 33
Main summary
Chapter summary
Enhanc. table
List of tables
2.1.5.2. Domestic Systemically Important InstitutionsWhen identifying Domestic Systemically Important Institutions (D-SIIs), Banco de España, according to the methodology established on Rule 14 of Circular 2/2016, applies a mix of guidelines based on size, importance, complexity (cross-jurisdiction activity) and degree of interconnectedness between the institutions concerned and the financial system. Banco de España conducts a yearly review of this classification and the following institutions are included on its list for 2018:
Santander Group appears on the lists of both global and domestic systemically important institutions. Banco de España, based on Rule 23 of Circular 2/2016, insists that the highest of the two buffers be applied. Since both buffers are the same for Banco Santander, the surcharge applicable in 2019 will be 1% (0.75% in 2018).
SYSTEMIC BUFFER
Domestic Systemically Important Institutions
0,25%0,75%
1%
BBVACaixabank BankiaSabadell
2.2. Pillar 1 regulatory capitalThe current regulatory framework for capital calculation is based on three pillars:
• Pillar 1 sets the minimum capital requirements for credit risk, market risk and operational risk, allowing internal ratings and models to be used. The aim is to make regulatory requirements more sensitive to the risks actually incurred by financial institutions when carrying on their business activities.
• Pillar 2 establishes a system of supervisory review, aimed at improving banks’ internal risk management and capital adequacy assessment in line with their risk profile.
• Pillar 3 is intended to enhance market discipline by developing a set of disclosure requirements that will allow market agents to appraise key information relating to the application of Basel II, capital, risk exposures, risk assessment processes and, by extension, the Bank’s capital adequacy.
2.2.1. Eligible capitalTotal eligible capital, after retained earnings, amounts to EUR 116,265, up EUR 10,287 million in the year, a 9.7% increase.
As a consequence of the acquisition of Banco Popular Español, S.A. and to strengthen and optimise the Bank's capital structure to provide adequate cover for that acquisition, on 3 July 2017 the Group communicated the resolution of the executive committee of Banco Santander, S.A. to increase the Bank's capital by EUR 7,072 million by issuing 1,458 million shares. In addition, on 1 November 2017, the Bank effected a rights issue of EUR 48 million under the Santander Scrip Dividend scheme, issuing 95,580,136 shares (0.6% of the share capital).
Valuation adjustments decreased by EUR 6,737 million, mainly due to the net impact of exchange rate fluctuations, offset by the decrease in risk-weighted assets due to exchange rate risk.
A reconciliation of accounting capital, which is the subject of the preceding paragraphs, to regulatory capital is shown below:

2. CAPITAL
34 2017 Pillar 3 Disclosures
TABLE 7. RECONCILIATION OF ACCOUNTING CAPITAL WITH REGULATORY CAPITAL
Millions of Euros
31 Dec. 2017 31 Dec. 2016
Subscribed capital 8,068 7,291
Share premium account 51,053 44,912
Reserves 52,577 49,244
Treasury shares -22 -7
Attributable profit 6,619 6,204
Approved dividend -2,029 -1,667
Shareholders' equity on public balance sheet 116,265 105,978
Valuation adjustments -21,777 -15,039
Non-controlling interests 12,344 11,761
Total equity on public balance sheet 106,832 102,700
Goodwill and intangible assets -28,537 -28,405
Eligible preference shares and participating securities 7,635 6,469
Accrued dividend -968 -802
Other adjustments -7,679 -6,253
Tier I (Phased-in) 77,283 73,709
The following table provides a breakdown of the Group’s eligible capital and a comparison with the previous year:
TABLE 8. ELIGIBLE CAPITAL
Millions of Euros
31 Dec. 2017 31 Dec. 2016
Common Equity Tier 1 74,173 73,709
Capital 8,068 7,291
(-) Treasury shares and own shares financed -22 -10
Share premium 51,053 44,912
Reserves 52,241 49,234
Other retained earnings -22,363 -14,924
Minority interests 7,991 8,018
Attributable profit net of dividends 3,621 3,735
Deductions -26,416 -24,548
Goodwill and intangible assets -22,829 -21,585
Others -3,586 -2,963
Additional Tier 1 3,110 –
Eligible instruments AT1 8,498 6,469
T1 excesses - subsidiaries 347 351
Residual value of intangibles -5,707 -6,820
Deductions -27 –
Tier II 13,423 12,628
Eligible instruments T2 9,901 9,039
Gen. funds and surplus loan loss prov. IRB 3,823 3,493
T2 excesses - subsidiaries -275 96
Others -26 0
Deductions 0 0
Total eligible capital 90,706 86,337

2017 Pillar 3 Disclosures 35
Main summary
Chapter summary
Enhanc. table
List of tables
Common equity tier 1 (CET1) capital comprises the elements of Tier 1 capital (applying prudential filters) and CET1 deductions after applying the threshold exemptions specified in the CRR. The CRR provides for a phased-in period that will give institutions time to adapt to the new requirements in the European Union. This phased-in applies to Santander Group under Regulation (EU) 2016/445 of the European Central Bank on the exercise of options and national discretions, published on 14 March 2016.
Without considering the phased-in schedule, CET1 is made up of:
• Subscribed share capital, which stood at EUR 8,068 million in December 2017.
• Other tier 1 capital items: (i) paid-up share premium; (ii) effective and disclosed reserves generated against profits and those amounts that are not taken to the income statement but are recorded under “Other reserves” (any item); (iii) other retained earnings, which includes certain valuation adjustments, primarily for exchange differences and for hedges of net investments in foreign operations.
• The paid-up portion of any non-controlling interests arising from the issue of ordinary shares by consolidated subsidiaries, subject to the limits set in the CRR.
• Profit net of dividends, which stood at EUR 3,621 million in December 2017.
• The prudential filters exclude any gain or loss on cash flow hedges. They also exclude gains or losses on liabilities and liabilities from derivatives valued at fair value resulting from changes in the institution's own credit standing.
• Deductions from CET1 items: treasury shares; current-year losses; goodwill and other intangible assets recognised in the balance sheet; deferred tax assets that rely on future earnings (subject to the limits set in the CRR); expected loss on equity investments; and defined benefit pension fund assets shown on the balance sheet.
Tier 1 capital comprises CET1 capital plus Additional Tier 1 (AT1) capital, including preferred securities issued by the Group less the deductions from AT1, consisting essentially of direct, indirect or synthetic holdings of own AT1 instruments and AT1 instruments of other financial sector entities.
Tier 2 capital comprises Tier 1 capital plus Tier 2 capital (T2 and include the following items, among others:
• Capital instruments and subordinated loans where the conditions laid down in the CRR are met.
• The carrying amount of the general provision for portfolios subject to standardised approach, up to a maximum of 1.25% of risk-weighted assets using the standardised approach.
• Any excess of the sum of impairment allowances and risk provisions for exposures calculated using the IRB approach over the expected losses thereon, up to a maximum of 0.6% of risk-weighted exposures calculated using the IRB approach.
• Tier 2 capital deductions, which primarily comprise the direct, indirect or synthetic holding of own Tier 2 capital instruments and Tier 2 instruments of other financial sector entities.
TABLE 9. REGULATORY CAPITAL. CHANGES
Millions of Euros
Core Tier 1 capital
Starting figure (31/12/2016) 73,709
Shares issued during the year and share premium account 6,917
Treasury shares and own shares financed -13
Reserves -728
Attributable profit net of dividends 3,621
Changes in other retained earnings -7,438
Minority interests -28
Decrease/(increase) in goodwill and other intangibles -1,244
Other deductions -624
Ending figure (31/12/2017) 74,173
Additional Tier 1 capital
Starting figure (31/12/2016) –
Eligible instruments AT1 2,029
T1 excesses - subsidiaries -4
Residual value of intangibles 1,112
Deductions -27
Ending figure (31/12/2017) 3,110
Capital Tier II
Starting figure (31/12/2016) 12,628
ELIGIBLE INSTRUMENTS T2 862
Gen. funds and surplus loan loss prov. IRB 331
T2 excesses - subsidiaries -371
Deductions -27
Ending figure (31/12/2017) 13,423
Deductions from total capital –
Final figure for total capital (31/12/2017) 90,706
Dec. 17
90,706
ELIGIBLE CAPITAL EVOLUTION
Millions of Euros
Dec. 16
86,337
Jun. 17*
92,283
87,274
Mar. 17 Sep. 17
92,714
*Jun-17: includes Banco Popular capital s increase.

2. CAPITAL
36 2017 Pillar 3 Disclosures
Credit risk Market risk Operational risk
CAPITAL REQUIREMENTS BY RISK TYPE
31 Dec. 2017
86%
4%
10%
Corporates Non-commercial mortgages Elegibles renewables Others Retail Equities Securitisations
50%
22%
2%
13%
7%1% 5%
DISTRIBUTION OF CAPITAL REQUIREMENTS FOR CREDIT RISK BY BASEL CATEGORY. IRB APPROACH
31 Dec. 2017
CHANGES IN RWA
Millions of Euros
Dec. 16
588,088
Jun. 17
630,130
597,117
Mar. 17 Sep. 17
622,541
Dec. 17
605,064
RWA FOR OPERTIONAL RISK
Millions of Euros
61,217
2017
61,084
2016
0.2%2016/2017
Total eligible capital rose EUR 4,369 million from 2016 to 2017, to EUR 90,706 million.
In addition to the above-mentioned movements in accounting capital, which explain the main changes in shares issued during the year, the changes in regulatory capital include the estimated cash dividend for 2017 (EUR 2,997 million), which brings attributable profit net of dividends to EUR 3,621 million.
Minority interests, at constant exchange rates, increased due mainly to profits retained in the period. Movements in "Other retained earnings” mainly reflect the above-mentioned valuation adjustments.
Goodwill reflects the impact of exchange rate movements, amortisation and corporate activity during the year.
The remaining deductions were impacted mainly by the phased-in of Basel III and the reduction of tax assets subject to deduction.
During 2017, eligible Tier 1 capital instruments increased due to new preference share issues in the amount of EUR 2,463 million.
During 2017, eligible Tier 2 capital instruments increased, primarily due to new subordinated debt issues in the amount of EUR 1,557 million.
2.2.2. Capital requirementsThis section gives details of capital requirements by risk type and portfolio (see Table 11) and by geography (see Table 12). Table 10 shows that capital requirements barely changed from 2016 to 2016, maintaining a Pillar I risk distribution similar to that of the prior year: credit risk 86%, market risk 4% and operational risk 10%.
Capital requirements for credit risk increased 3.7% compared to 2016 up to EUR 41,575 million. On the other hand, compared to the previous year, capital requirements for market risk fell 7.4% and those for operational risk were little changed.

2017 Pillar 3 Disclosures 37
Main summary
Chapter summary
Enhanc. table
List of tables
RWA FOR CREDIT RISK
Millions of Euros
519,686
2017
500,925
2016
3.7%2016/2017
RWA FOR MARKET RISK
Millions of Euros
24,161
2017
26,079
2016
-7.4%2016/2017
Shown below is a general overview of the total RWAs that comprise the denominator of the capital requirements by risk. The following sections provide additional breakdowns.
TABLE 10. OVERVIEW OF RWAs (OV1)
Millions of Euros
RWA RWA Capital
31 Dec. 2017 31 Dec. 2016 31 Dec. 2017
Credit risk (excluding CRR) 485,578 471,882 38,846
Of which standardised approach (SA) 280,082 271,519 22,407
Of which the foundation IRB (FIRB) approach 30,964 25,570 2,477
Of which the advanced IRB (AIRB) approach 158,777 153,605 12,702
Of which Equity IRB under the Simple riskweight or the IMA 15,755 21,187 1,260
CCR 14,667 13,867 1,173
Of which mark to market method (IRB) 8,529 9,308 682
Of which mark to market method (Standardised) 3,586 3,851 287
Of which risk exposure amount for contributions to the default fund of a CCP 313 313 25
Of which CVA 2,240 395 179
Settlement risk 1 1 0
Securitisation exposures in banking book (after cap) 3,678 2,234 294
Of which IRB approach 708 1,224 57
Of which IRB supervisory formula approach (SFA) 1,774 112 142
Of which standardised approach 1,196 898 96
Market risk 24,161 26,079 1,933
Of which standardised approach 9,702 11,864 776
Of which IMA 14,459 14,215 1,157
Operational risk 61,217 61,084 4,897
Of which standardised Approach 61,217 61,084 4,897
Amounts below the thresholds for deduction (subject to 250% risk weight) 15,762 12,941 1,261
Floor adjustment – – –
Total 605,064 588,088 48,405

2. CAPITAL
38 2017 Pillar 3 Disclosures
The following table shows capital requirements for credit risk.
TABLE 11. CAPITAL REQUIREMENTS FOR CREDIT RISK
Millions of Euros
31 Dec. 2017 31 Dec. 2016
Capital RWAs Capital RWAs
Credit Risk. IRB approach
Central governments and central banks 57 714 33 410
Institutions 739 9,232 628 7,853
Corporates 8,698 108,719 8,782 109,774
Retail portfolios 6,368 79,605 5,636 70,446
Residential mortgages 3,866 48,319 3,438 42,970
Qualifying revolving retail exposures 331 4,141 287 3,592
Other retail 2,172 27,144 1,911 23,884
Equities 1,260 15,755 1,695 21,187
Simple method 211 2,642 410 5,130
PD/LGD Method 499 6,243 764 9,555
Internal models 121 1,513 133 1,661
Exposiciones de renta variable sujetas a ponderaciones de riesgo 429 5,357 387 4,841
Securitisation positions or exposures 199 2,482 107 1,336
Total IRB approach 17,321 216,507 16,881 211,006
Credit risk. Standardised approach
Central governments and central banks 363 4,543 416 5,197
Regional governments and local authorities 18 222 37 466
Public sector entities and other non-profit public institutions 32 396 23 287
Multilateral development banks 0 4 – 1
International organisations 1 7 – –
Institutions 545 6,818 611 7,640
Corporates 5,933 74,157 6,189 77,357
Retail portfolios 7,802 97,527 7,351 91,884
Exposures secured by real estate property 3,154 39,424 3,135 39,191
Defaulted exposures 842 10,527 636 7,946
High-risk exposures 192 2,399 160 1,995
Covered bonds 36 456 34 429
Securitisation positions 96 1,196 72 898
Exposures to institutions and corporates with short-term credit ratings – 2 26 326
Exposures to collective investment schemes (CIS) 23 292 8 106
Equity 45 562 25 311
Other exposures 4,968 62,096 4,414 55,179
Total standardised approach 24,050 300,626 23,137 289,210
Total credit risk 41,371 517,133 40,017 500,216
* Includes counterparty risk excluding CVA and CCP.
As of 31 December 2017, Santander Group had no additional capital requirements arising from the floors set by Regulation (EU) No 575/2013 of the European Parliament and of the Council of 26 June 2013 on prudential requirements for credit institutions and investment firms, in Part Ten, Title 1.

2017 Pillar 3 Disclosures 39
Main summary
Chapter summary
Enhanc. table
List of tables
The following table shows capital requirements by geographical region:
TABLE 12. CAPITAL REQUIREMENTS BY GEOGRAPHICAL REGION
Millions of Euros
TOTAL Spain UKRest of Europe Brazil
Rest of Latin
America USARest of
world
Credit risk 39,529 11,344 6,264 7,951 4,963 4,412 4,503 92
Of which internal ratings-based (IRB) approach (*) 15,862 6,229 4,125 3,744 831 736 195 –
Central governments and Central BANKS 57 55 – – – 2 – –
Institutions 739 394 143 90 – 112 – –
Corporates – SME 8,698 4,253 1,306 1,489 831 622 195 –
of which: Corporates - Specialised Lending 1,422 555 550 197 – 121 – –
of which: Corporates – Other 5,748 2,931 545 842 831 403 195 –
Retail - Secured by real estate SME 101 42 0 59 – – – –
Retail - Secured by real estate non-SME 3,765 802 2,331 632 – – – –
Retail - Qualifying revolving 331 125 175 31 – – – –
Retail - Other SME 385 153 232 – – – –
Retail - Other non-SME 1,787 406 170 1,210 – – – –
Other non-credit-obligation assets – – – – – – – –
Of which standardised approach (SA) 22,407 3,986 2,118 4,191 4,054 3,671 4,308 79
Central governments or central banks 358 3 0 – 144 193 18 –
Regional governments or local authorities 18 4 0 5 1 6 1 –
Public sector entities 32 0 – 5 – 15 12 –
Multilateral Development Banks – – – – – – – –
International Organisations 1 1 – – – – – –
Institutions 482 98 25 48 78 70 162 1
Corporates 5,735 512 1,262 1,199 980 853 927 2
Retail 7,783 626 479 1,869 1,864 1,213 1,662 72
Secured by mortgages on immovable property 3,154 338 54 622 330 820 986 4
Exposures in default 842 297 32 116 155 165 77 1
Items associated with particular high risk 192 13 – 25 – 146 8 –
Covered bonds 36 – 33 3 – – – –
Claims on institutions and corporates with a short-term credit assessment 0 0 – – – – – –
Collective investments undertakings (CIU) 23 21 1 0 – – 0 –
Equity exposures 45 27 – 17 – 0 – –
Other items 3,705 2,046 232 280 502 190 454 0
Of which equity IRB 1,260 1,129 20 16 77 4 – 13
Under the PD/LGD method 211 115 11 12 67 4 – 2
Under internal models 499 465 10 4 10 0 – 11
Under the simple method 121 121 – – – – – –
Under exposures subject to risk weights 429 429 – – – – – –
Counterparty credit risk 491 157 173 48 36 41 14 21
Of which standardised approach 287 37 117 45 32 21 14 21
Of which: Risk exposure amount for contributions to the default fund of a CCP 25 13 11 – 0 0 – –
Of which: CVA 179 107 45 3 4 20 0 –
Settlement risk 0 0 – – – – – –
* Including counterparty credit risk

2. CAPITAL
40 2017 Pillar 3 Disclosures
TABLE 12. CAPITAL REQUIREMENTS BY GEOGRAPHICAL REGION (CONTD.)
Millions of Euros
TOTAL Spain UKRest of Europe Brazil
Rest of Latin
America USARest of
world
Securitisation exposures in banking book (after cap) 294 129 68 47 – 8 42 0
Of which IRB ratings-based approach (RBA) 57 57 – – – – – –
Of which IRB Supervisory Formula Approach (SFA) 142 68 36 38 – – – –
Of which Standardised approach (SA) 96 4 32 9 – 8 42 0
Market risk 1,933 1,103 333 29 147 306 15 –
Of which standardised approach (SA) 776 540 40 28 147 6 15 –
Of which internal model approaches (IMA) 1,157 563 293 0 – 300 – –
Operational risk 4,897 1,193 683 787 627 709 898 –
Of which Standardised Approach 4,897 1,193 683 787 627 709 898 –
Amounts below the thresholds for deduction (subject to 250% risk weight) 1,261 543 11 120 362 177 45 3
Floor adjustment – – – – – – – –
Total 48,405 14,470 7,532 8,982 6,135 5,653 5,517 116
2.2.2.1. Credit riskThe following table shows the main changes in capital requirements for credit risk:
TABLE 13. RWA FLOW STATEMENT OF CREDIT RISK EXPOSURES UNDER IRB (CR8)*
Millions of EurosRWA Capital
Starting figure (31/12/2016) 500,216 40,017
Asset size 4,677 374
Asset quality – –
Model updates -7,407 -593
Methodology and policy – –
Acquisitions and disposals 49,562 3,966
Foreign exchange movements -29,915 -2,393
Other – –
Ending figure (31/12/2017) 517,133 41,371
* Includes capital requirements of equity, securitisations and counterparty risk
(excluding CVA and CCP)
The increase in capital requirements for credit risk was due mainly to the incorporation of Popular Group in June, partly offset by the exchange rate effect, mainly in Brazil, the US and the UK.
Business growth was generally concentrated in Latin America and Consumer, partly offset by falls in the US and Spain.

2017 Pillar 3 Disclosures 41
Main summary
Chapter summary
Enhanc. table
List of tables
2.2.
2.1.
1. In
tern
al ra
ting
s-ba
sed
(IR
B) a
ppro
ach
The
tabl
es in
this
sec
tion
show
, for
eac
h bu
sine
ss s
egm
ent,
the
dist
ribut
ion
by ra
ting
grad
e (in
tern
al a
nd S
tand
ard
& P
oor’s
) of t
he
valu
e of
exp
osur
es, c
redi
t ris
k pa
ram
eter
s an
d ca
pita
l und
er th
e IR
B ap
proa
ch, d
istin
guis
hing
bet
wee
n fo
unda
tion
IRB
(FIR
B) a
nd a
dvan
ced
IRB
(AIR
B).
TA
BLE
14. A
I RB
APP
ROA
CH
. CEN
TRA
L B
AN
KS
AN
D C
ENTR
AL
GO
VER
NM
ENTS
Mill
ions
of E
uros
31 D
ec. 2
017
PD scale
S&P Levels
Original on-balance-sheet gross exposures
Off-balance-sheet exposures pre-CCF
Average CCF
EAD
Average PD
Number of obligors
Average LGD
Average maturity
RWA
RWA density
EL
Value adjustments and provisions
0.0
0 a
<0.
15A
AA
to B
BB+
871
7
27
32.8
5% 1,
743
0.0
4%14
45.3
7% 1,
561
452
25
.95%
0.3
-1
.6
0.15
a <
0.25
BBB+
to B
BB 2
27
0
100.
00
% 6
7 0.
15%
549
.99%
413
2
1 31
.43%
0.1
-0.3
0.25
a <
0.50
BBB
to B
B+ 2
6 –
0
0.
37%
150
.00
% 3
60
0
51.6
9% 0
.0
-0.0
0.50
a <
0.75
BB+
to B
B 7
36
28
23.3
0%
53
0.58
%3
29.6
6% 1,
761
38
71.0
3% 0
.1 -0
.5
0.75
a <
2.50
BB to
B+
759
9
3 37
.67%
91
1.40
%7
50.0
0%
1,79
3 14
4 15
9.14
% 0
.6
-3.8
2.50
a <
10.0
0B+
to B
- 3
30
4
12.8
0%
7
5.45
%3
81.9
2% 1,
067
2
1 30
8.21
% 0
.3
-1.8
10.0
0 a
<10
0.0
0B
- to
C 0
–
0
13
.50
%1
70.0
0%
750
0
34
5.85
% 0
.0
-0.0
100.
00
(def
ault)
D 5
8 –
5
8 10
0.0
0%
250
.00
% 1,
558
10
17.19
% 2
8.2
-28.
8
Tota
l 20
17 3
,00
7 8
52
32.9
8% 2
,019
3.
00
% 3
6 4
5.58
% 1,
536
686
34
.00
% 2
9.5
-36.
8
Tota
l 20
16 1,
971
285
4
2.25
% 1,
145
0.1
5% 2
9 4
5.4
3% 1,
707
410
35
.82%
0.8
-0
.5
86%
of t
he p
ortf
olio
is ra
ted
A+.
The
por
tfol
io's
aver
age
cons
umpt
ion
is 3
4%; h
owev
er, t
he a
vera
ge P
D h
as in
crea
sed.
Thi
s w
as d
ue to
the
defa
ult o
f a s
egm
ente
d cu
stom
er in
this
por
tfol
io in
San
tand
er S
A.
The
expo
sure
incr
ease
d by
76%
com
pare
d to
201
6 du
e to
incr
ease
d bu
sine
ss in
this
seg
men
t.

2. CAPITAL
42 2017 Pillar 3 Disclosures
TA
BLE
15. A
I RB
APP
ROA
CH
. IN
STIT
UTI
ON
S
Mill
ions
of E
uros
31 D
ec. 2
017
PD scale
S&P Levels
Original on-balance-sheet gross exposures
Off-balance-sheet exposures pre-CCF
Average CCF
EAD
Average PD
Number of obligors
Average LGD
Average maturity
RWA
RWA density
EL
Value adjustments and provisions
0.0
0 to
<0.
15A
AA
to B
BB+
26,
409
7,5
86
37.4
9% 2
5,78
0
0.0
5%10
9743
.48%
512
4
,431
17
.19%
5.6
-2
9.2
0.15
to <
0.25
BBB+
to B
BB 6
,559
6
12
32.8
7% 2
,988
0.
16%
600
44.4
8% 5
95
1,19
7 40
.08%
2.2
-1
1.4
0.25
to <
0.50
BBB
to B
B+ 4
,70
3 5
2 36
.60
% 7
46
0.38
%16
733
.05%
591
3
89
52.16
% 0
.9
-4.9
0.50
to <
0.75
BB+
to B
B 7
69
95
20.4
5% 4
26
0.65
%37
162
.15%
1,35
3 6
21
145.
92%
1.7
-9.1
0.75
to <
2.50
BB to
B+
4,0
22
28
18.4
5% 1,
136
1.62%
225
30.9
6% 8
34
811
71
.41%
5.2
-2
6.9
2.50
to <
10.0
0B+
to B
- 1,
046
16
5 72
.57%
792
2.
74%
5713
.84%
1,67
4 3
67
46.3
2% 3
.0
-15.
7
10.0
0 to
<10
0.0
0B
- to
C 11
9 1
44.8
8% 1
32.9
7%17
43.4
1% 1,
246
4
280.
17%
0.2
-1
.0
100.
00
(def
ault)
D 2
1 0
48
.33%
0
100.
00
%15
39.8
2% 1,
100
0
13
.64%
0.1
-0.2
Tota
l 20
17 4
3,6
49
8,5
40
37
.58%
31,
868
0.2
0%
2,5
49
42.
40
% 5
73
7,8
20
24.5
4%
18.
9 -9
8.4
Tota
l 20
16 4
2,93
0
8,9
83
36.5
6%
29,
717
0.2
2% 1,
897
43.
05%
66
8 7
,373
24
.81%
17.4
-1
8.7
The
port
folio
's av
erag
e co
nsum
ptio
n is
24.
54%
, 27
bp le
ss th
an in
20
16.
Its
expo
sure
incr
ease
d by
7.3
2%, c
ausi
ng R
WA
s to
rise
by
EUR
447
mill
ion.
With
rega
rd to
par
amet
ers,
the
PD im
prov
ed d
ue to
the
reca
libra
tion
of B
anks
' PD
in th
e la
st q
uart
er.

2017 Pillar 3 Disclosures 43
Main summary
Chapter summary
Enhanc. table
List of tables
TA
BLE
15. A
I RB
APP
ROA
CH
. IN
STIT
UTI
ON
S
Mill
ions
of E
uros
31 D
ec. 2
017
PD scale
S&P Levels
Original on-balance-sheet gross exposures
Off-balance-sheet exposures pre-CCF
Average CCF
EAD
Average PD
Number of obligors
Average LGD
Average maturity
RWA
RWA density
EL
Value adjustments and provisions
0.0
0 to
<0.
15A
AA
to B
BB+
26,
409
7,5
86
37.4
9% 2
5,78
0
0.0
5%10
9743
.48%
512
4
,431
17
.19%
5.6
-2
9.2
0.15
to <
0.25
BBB+
to B
BB 6
,559
6
12
32.8
7% 2
,988
0.
16%
600
44.4
8% 5
95
1,19
7 40
.08%
2.2
-1
1.4
0.25
to <
0.50
BBB
to B
B+ 4
,70
3 5
2 36
.60
% 7
46
0.38
%16
733
.05%
591
3
89
52.16
% 0
.9
-4.9
0.50
to <
0.75
BB+
to B
B 7
69
95
20.4
5% 4
26
0.65
%37
162
.15%
1,35
3 6
21
145.
92%
1.7
-9.1
0.75
to <
2.50
BB to
B+
4,0
22
28
18.4
5% 1,
136
1.62%
225
30.9
6% 8
34
811
71
.41%
5.2
-2
6.9
2.50
to <
10.0
0B+
to B
- 1,
046
16
5 72
.57%
792
2.
74%
5713
.84%
1,67
4 3
67
46.3
2% 3
.0
-15.
7
10.0
0 to
<10
0.0
0B
- to
C 11
9 1
44.8
8% 1
32.9
7%17
43.4
1% 1,
246
4
280.
17%
0.2
-1
.0
100.
00
(def
ault)
D 2
1 0
48
.33%
0
100.
00
%15
39.8
2% 1,
100
0
13
.64%
0.1
-0.2
Tota
l 20
17 4
3,6
49
8,5
40
37
.58%
31,
868
0.2
0%
2,5
49
42.
40
% 5
73
7,8
20
24.5
4%
18.
9 -9
8.4
Tota
l 20
16 4
2,93
0
8,9
83
36.5
6%
29,
717
0.2
2% 1,
897
43.
05%
66
8 7
,373
24
.81%
17.4
-1
8.7
The
port
folio
's av
erag
e co
nsum
ptio
n is
24.
54%
, 27
bp le
ss th
an in
20
16.
Its
expo
sure
incr
ease
d by
7.3
2%, c
ausi
ng R
WA
s to
rise
by
EUR
447
mill
ion.
With
rega
rd to
par
amet
ers,
the
PD im
prov
ed d
ue to
the
reca
libra
tion
of B
anks
' PD
in th
e la
st q
uart
er.
TA
BLE
16. A
IRB
APP
ROA
CH
. CO
RPO
RA
TES
Mill
ions
of E
uros
31 D
ec. 2
017
PD scale
S&P Levels
Original on-balance-sheet gross exposures
Off-balance-sheet exposures pre-CCF
Average CCF
EAD
Average PD
Number of obligors
Average LGD
Average maturity
RWA
RWA density
EL
Value adjustments and provisions
0.0
0 to
<0.
15A
AA
to B
BB+
73,
208
40,
101
39.8
6% 4
7,80
4 0.
08%
3,10
8 37
.14%
925
10
,713
22
.41%
15
-52
0.15
to <
0.25
BBB+
to B
BB 2
7,84
1 12
,519
33
.53%
21,1
78
0.23
% 5
,873
42
.88%
777
9
,735
45
.97%
21
-66
0.25
to <
0.50
BBB
to B
B+ 3
7,93
0
14,7
62
33.2
1% 2
8,17
2 0.
37%
12,13
5 43
.02%
731
15
,631
55
.48%
45
-136
0.50
to <
0.75
BB+
to B
B 2
3,19
2 6
,153
40.9
9% 13
,476
0.
65%
7,4
45
42.4
6% 6
82
9,6
86
71.8
8% 3
7 -1
15
0.75
to <
2.50
BB to
B+
30,
237
5,6
54
31.9
2% 2
2,75
9 1.
29%
37,
023
41
.71%
719
17
,226
75
.69%
121
-236
2.50
to <
10.0
0B+
to B
- 12
,255
2
,586
52
.86%
8,9
65
5.0
8% 12
,116
36.7
3% 9
16
9,9
26
110.
71%
165
-357
10.0
0 to
<10
0.0
0B
- to
C 2
,636
5
22
32.6
0%
1,88
6 20
.68%
3,8
49
35.4
4% 1,
00
3 3
,064
16
2.51
% 13
9 -2
61
100.
00
(def
ault)
D 13
,226
1,
550
33
.06%
12,18
5 10
0.0
0%
8,7
81
39.4
7% 1,
042
7
42
6.0
9% 4
,749
-4
,927
Tota
l 20
17 2
20,5
25
83,
847
37.5
2% 1
56,4
26
8.70
% 9
0,3
30
40
.23%
828
7
6,72
3 4
9.0
5% 5
,292
-6
,150
Tota
l 20
16 2
22,9
85
84
,525
37
.50
% 1
56,6
85
7.6
4%
77,
430
4
0.7
3% 8
40
8
2,26
7 52
.50
% 4
,712
-5
,896
30%
of t
he p
ortf
olio
is ra
ted
abov
e A
-. Th
e po
rtfo
lio d
imin
ishe
d sl
ight
ly a
nd
the
aver
age
RW d
eclin
ed d
ue to
the
impr
ovem
ent i
n se
veri
ty, a
slig
htly
sho
rter
av
erag
e m
atur
ity
than
in 2
016
and,
abo
ve a
ll, d
ue to
thre
e fa
ctor
s th
at im
pact
ed
PD:
• The
ent
ry o
f Ban
co P
opul
ar w
ith a
hig
h pe
rcen
tage
of N
PLs
in it
s SM
E po
rtfo
lio,
whi
ch in
crea
sed
the
NPL
ratio
and
hen
ce e
xpos
ure
with
PD
= 10
0
• The
dec
line
in b
usin
ess
in th
is p
ortf
olio
• A n
ew im
plem
enta
tion
of c
orpo
rate
PD
s th
at c
ause
a fa
ll in
RW
As
with
out a
dire
ct
impa
ct o
n av
erag
e PD
.
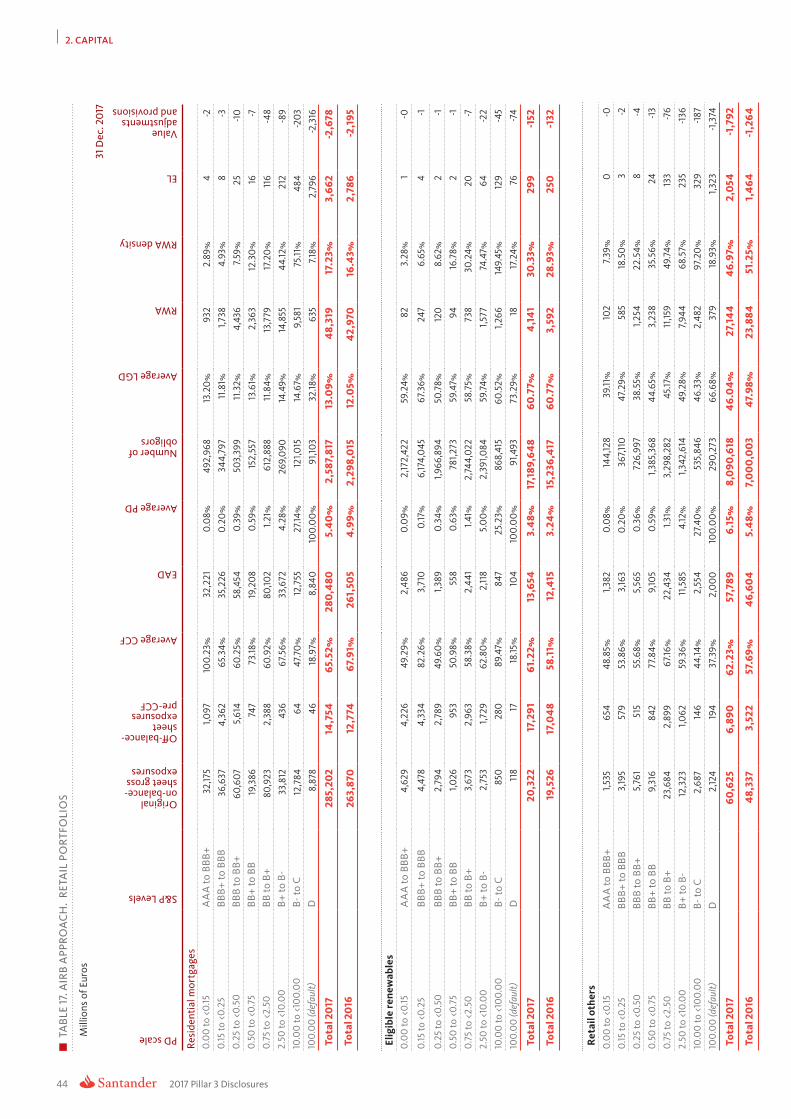
2. CAPITAL
44 2017 Pillar 3 Disclosures
TA
BLE
17. A
IRB
APP
ROA
CH
. R
ETA
IL P
OR
TFO
LIO
S
Mill
ions
of E
uros
31 D
ec. 2
017
PD scale
S&P Levels
Original on-balance-sheet gross exposures
Off-balance-sheet exposures pre-CCF
Average CCF
EAD
Average PD
Number of obligors
Average LGD
RWA
RWA density
EL
Value adjustments and provisions
Resi
dent
ial m
ortg
ages
0.0
0 to
<0.
15A
AA
to B
BB+
32,
175
1,0
97
100.
23%
32,
221
0.0
8% 4
92,9
68
13.2
0%
932
2.
89%
4
-2
0.15
to <
0.25
BBB+
to B
BB 3
6,63
7 4
,362
65
.34%
35,
226
0.20
% 3
44,7
97
11.8
1% 1,
738
4.93
% 8
-3
0.
25 to
<0.
50BB
B to
BB+
60,
607
5,6
14
60.2
5% 5
8,45
4 0.
39%
50
3,39
9 11
.32%
4,4
36
7.59
% 2
5 -1
0
0.50
to <
0.75
BB+
to B
B 19
,386
7
47
73.18
% 19
,20
8 0.
59%
152,
557
13.6
1% 2
,363
12
.30
% 16
-7
0.
75 to
<2.
50BB
to B
+ 8
0,92
3 2
,388
60
.92%
80,
102
1.21
% 6
12,8
88
11.8
4% 13
,779
17
.20
% 11
6 -4
8 2.
50 to
<10
.00
B+ to
B-
33,
812
436
67
.56%
33,
672
4.28
% 2
69,0
90
14.4
9% 14
,855
44
.12%
212
-8
9 10
.00
to <
100.
00
B- t
o C
12,7
84
64
47.7
0%
12,7
55
27.14
% 12
1,015
14
.67%
9,5
81
75.11
% 4
84
-20
3 10
0.0
0 (d
efau
lt)D
8,8
78
46
18.9
7% 8
,840
10
0.0
0%
91,1
03
32.18
% 6
35
7.18%
2,7
96
-2,3
16
Tota
l 20
17 2
85,2
02
14,7
54
65.5
2% 2
80,4
80
5.4
0%
2,5
87,8
17
13.0
9%
48,
319
17.2
3% 3
,662
-2
,678
Tota
l 20
16 2
63,8
70
12,7
74
67.9
1% 2
61,5
05
4.9
9%
2,2
98,0
15
12.0
5% 4
2,97
0
16.4
3% 2
,786
-2
,195
Elig
ible
rene
wab
les
0.0
0 to
<0.
15A
AA
to B
BB+
4,6
29
4,2
26
49.2
9% 2
,486
0.
09%
2,17
2,42
2 59
.24%
82
3.28
% 1
-0
0.15
to <
0.25
BBB+
to B
BB 4
,478
4
,334
82
.26%
3,7
10
0.17
% 6
,174,
045
67
.36%
247
6.
65%
4
-1
0.25
to <
0.50
BBB
to B
B+ 2
,794
2
,789
49
.60
% 1,
389
0.34
% 1,
966,
894
50.7
8% 12
0
8.62
% 2
-1
0.50
to <
0.75
BB+
to B
B 1,
026
9
53
50.9
8% 5
58
0.63
% 7
81,2
73
59.4
7% 9
4 16
.78%
2
-1
0.75
to <
2.50
BB to
B+
3,6
73
2,9
63
58.3
8% 2
,441
1.4
1% 2
,744
,022
58
.75%
738
30
.24%
20
-7
2.50
to <
10.0
0B+
to B
- 2
,753
1,
729
62.8
0%
2,11
8 5.
00
% 2
,391
,084
59
.74%
1,57
7 74
.47%
64
-22
10.0
0 to
<10
0.0
0B
- to
C 8
50
280
89
.47%
847
25
.23%
868
,415
60
.52%
1,26
6 14
9.45
% 12
9 -4
5
100.
00
(def
ault)
D 11
8 17
18
.15%
104
100.
00
% 9
1,493
73
.29%
18
17.2
4% 7
6 -7
4
Tota
l 20
17 2
0,3
22
17,2
91
61.2
2% 13
,654
3.
48%
17,1
89,6
48
60.7
7% 4
,14
1 30
.33%
299
-1
52
Tota
l 20
16 19
,526
17
,04
8 58
.11%
12,4
15
3.24
% 1
5,23
6,4
17
60.7
7% 3
,592
28
.93%
250
-1
32
Ret
ail o
ther
s 0.
00
to <
0.15
AA
A to
BBB
+ 1,
535
654
48
.85%
1,38
2 0.
08%
144,
128
39.11
% 10
2 7.
39%
0
-0
0.15
to <
0.25
BBB+
to B
BB 3
,195
579
53
.86%
3,16
3 0.
20%
367
,110
47
.29%
585
18
.50
% 3
-2
0.25
to <
0.50
BBB
to B
B+ 5
,761
5
15
55.6
8% 5
,565
0.
36%
726
,997
38
.55%
1,25
4 22
.54%
8
-4
0.50
to <
0.75
BB+
to B
B 9
,316
8
42
77.8
4% 9
,105
0.59
% 1,
385,
368
44.6
5% 3
,238
35
.56%
24
-13
0.75
to <
2.50
BB to
B+
23,
684
2,8
99
67.16
% 2
2,43
4 1.
31%
3,2
98,2
82
45.17
% 11
,159
49.7
4% 13
3 -7
6
2.50
to <
10.0
0B+
to B
- 12
,323
1,
062
59
.36%
11,5
85
4.12
% 1,
342,
614
49.2
8% 7
,944
68
.57%
235
-1
36
10.0
0 to
<10
0.0
0B
- to
C 2
,687
14
6 44
.14%
2,5
54
27.4
0%
535
,846
46
.33%
2,4
82
97.2
0%
329
-1
87
100.
00
(def
ault)
D 2
,124
194
37.3
9% 2
,00
0
100.
00
% 2
90,2
73
66.6
8% 3
79
18.9
3% 1,
323
-1,3
74
Tota
l 20
17 6
0,6
25
6,8
90
62.2
3% 5
7,78
9 6.
15%
8,0
90,6
18
46.
04
% 2
7,14
4
46.
97%
2,0
54
-1,7
92
Tota
l 20
16 4
8,33
7 3
,522
57
.69
% 4
6,60
4
5.4
8% 7
,00
0,0
03
47.
98%
23,
884
51
.25%
1,4
64
-1
,26
4

2017 Pillar 3 Disclosures 45
Main summary
Chapter summary
Enhanc. table
List of tables
TA
BLE
17. A
IRB
APP
ROA
CH
. R
ETA
IL P
OR
TFO
LIO
S
Mill
ions
of E
uros
31 D
ec. 2
017
PD scale
S&P Levels
Original on-balance-sheet gross exposures
Off-balance-sheet exposures pre-CCF
Average CCF
EAD
Average PD
Number of obligors
Average LGD
RWA
RWA density
EL
Value adjustments and provisions
Resi
dent
ial m
ortg
ages
0.0
0 to
<0.
15A
AA
to B
BB+
32,
175
1,0
97
100.
23%
32,
221
0.0
8% 4
92,9
68
13.2
0%
932
2.
89%
4
-2
0.15
to <
0.25
BBB+
to B
BB 3
6,63
7 4
,362
65
.34%
35,
226
0.20
% 3
44,7
97
11.8
1% 1,
738
4.93
% 8
-3
0.
25 to
<0.
50BB
B to
BB+
60,
607
5,6
14
60.2
5% 5
8,45
4 0.
39%
50
3,39
9 11
.32%
4,4
36
7.59
% 2
5 -1
0
0.50
to <
0.75
BB+
to B
B 19
,386
7
47
73.18
% 19
,20
8 0.
59%
152,
557
13.6
1% 2
,363
12
.30
% 16
-7
0.
75 to
<2.
50BB
to B
+ 8
0,92
3 2
,388
60
.92%
80,
102
1.21
% 6
12,8
88
11.8
4% 13
,779
17
.20
% 11
6 -4
8 2.
50 to
<10
.00
B+ to
B-
33,
812
436
67
.56%
33,
672
4.28
% 2
69,0
90
14.4
9% 14
,855
44
.12%
212
-8
9 10
.00
to <
100.
00
B- t
o C
12,7
84
64
47.7
0%
12,7
55
27.14
% 12
1,015
14
.67%
9,5
81
75.11
% 4
84
-20
3 10
0.0
0 (d
efau
lt)D
8,8
78
46
18.9
7% 8
,840
10
0.0
0%
91,1
03
32.18
% 6
35
7.18%
2,7
96
-2,3
16
Tota
l 20
17 2
85,2
02
14,7
54
65.5
2% 2
80,4
80
5.4
0%
2,5
87,8
17
13.0
9%
48,
319
17.2
3% 3
,662
-2
,678
Tota
l 20
16 2
63,8
70
12,7
74
67.9
1% 2
61,5
05
4.9
9%
2,2
98,0
15
12.0
5% 4
2,97
0
16.4
3% 2
,786
-2
,195
Elig
ible
rene
wab
les
0.0
0 to
<0.
15A
AA
to B
BB+
4,6
29
4,2
26
49.2
9% 2
,486
0.
09%
2,17
2,42
2 59
.24%
82
3.28
% 1
-0
0.15
to <
0.25
BBB+
to B
BB 4
,478
4
,334
82
.26%
3,7
10
0.17
% 6
,174,
045
67
.36%
247
6.
65%
4
-1
0.25
to <
0.50
BBB
to B
B+ 2
,794
2
,789
49
.60
% 1,
389
0.34
% 1,
966,
894
50.7
8% 12
0
8.62
% 2
-1
0.50
to <
0.75
BB+
to B
B 1,
026
9
53
50.9
8% 5
58
0.63
% 7
81,2
73
59.4
7% 9
4 16
.78%
2
-1
0.75
to <
2.50
BB to
B+
3,6
73
2,9
63
58.3
8% 2
,441
1.4
1% 2
,744
,022
58
.75%
738
30
.24%
20
-7
2.50
to <
10.0
0B+
to B
- 2
,753
1,
729
62.8
0%
2,11
8 5.
00
% 2
,391
,084
59
.74%
1,57
7 74
.47%
64
-22
10.0
0 to
<10
0.0
0B
- to
C 8
50
280
89
.47%
847
25
.23%
868
,415
60
.52%
1,26
6 14
9.45
% 12
9 -4
5
100.
00
(def
ault)
D 11
8 17
18
.15%
104
100.
00
% 9
1,493
73
.29%
18
17.2
4% 7
6 -7
4
Tota
l 20
17 2
0,3
22
17,2
91
61.2
2% 13
,654
3.
48%
17,1
89,6
48
60.7
7% 4
,14
1 30
.33%
299
-1
52
Tota
l 20
16 19
,526
17
,04
8 58
.11%
12,4
15
3.24
% 1
5,23
6,4
17
60.7
7% 3
,592
28
.93%
250
-1
32
Ret
ail o
ther
s 0.
00
to <
0.15
AA
A to
BBB
+ 1,
535
654
48
.85%
1,38
2 0.
08%
144,
128
39.11
% 10
2 7.
39%
0
-0
0.15
to <
0.25
BBB+
to B
BB 3
,195
579
53
.86%
3,16
3 0.
20%
367
,110
47
.29%
585
18
.50
% 3
-2
0.25
to <
0.50
BBB
to B
B+ 5
,761
5
15
55.6
8% 5
,565
0.
36%
726
,997
38
.55%
1,25
4 22
.54%
8
-4
0.50
to <
0.75
BB+
to B
B 9
,316
8
42
77.8
4% 9
,105
0.59
% 1,
385,
368
44.6
5% 3
,238
35
.56%
24
-13
0.75
to <
2.50
BB to
B+
23,
684
2,8
99
67.16
% 2
2,43
4 1.
31%
3,2
98,2
82
45.17
% 11
,159
49.7
4% 13
3 -7
6
2.50
to <
10.0
0B+
to B
- 12
,323
1,
062
59
.36%
11,5
85
4.12
% 1,
342,
614
49.2
8% 7
,944
68
.57%
235
-1
36
10.0
0 to
<10
0.0
0B
- to
C 2
,687
14
6 44
.14%
2,5
54
27.4
0%
535
,846
46
.33%
2,4
82
97.2
0%
329
-1
87
100.
00
(def
ault)
D 2
,124
194
37.3
9% 2
,00
0
100.
00
% 2
90,2
73
66.6
8% 3
79
18.9
3% 1,
323
-1,3
74
Tota
l 20
17 6
0,6
25
6,8
90
62.2
3% 5
7,78
9 6.
15%
8,0
90,6
18
46.
04
% 2
7,14
4
46.
97%
2,0
54
-1,7
92
Tota
l 20
16 4
8,33
7 3
,522
57
.69
% 4
6,60
4
5.4
8% 7
,00
0,0
03
47.
98%
23,
884
51
.25%
1,4
64
-1
,26
4
Ret
ail p
ortf
olio
s. P
rope
rty
mor
tgag
es.
24%
of m
ortg
age
expo
sure
is ra
ted
abov
e BB
B-. T
he a
vera
ge R
W in
th
is s
egm
ent i
ncre
ased
due
mai
nly
to th
e in
crea
se in
the
aver
age
PD
and
LGD
par
amet
ers.
Exp
osur
e in
crea
sed
as a
resu
lt of
the
purc
hase
of
Banc
o Po
pula
r, w
ith w
orse
cre
dit q
ualit
y in
this
seg
men
t.
Ret
ail p
ortf
olio
s. E
ligib
le re
new
able
s45
% o
f elig
ible
rene
wab
le e
xpos
ure
is ra
ted
abov
e BB
B-. T
he p
ortf
olio
's av
erag
e RW
incr
ease
d du
e m
ainl
y to
the
incr
ease
in it
s av
erag
e PD
.
Ret
ail o
ther
The
port
folio
's ex
posu
re in
crea
sed
by 2
4% a
s a
resu
lt of
the
Banc
o Po
pula
r acq
uisi
tion,
with
an
exte
nsiv
e po
rtfo
lio o
f sm
all l
egal
ent
ities
. Th
e pu
rcha
se o
f a p
ortf
olio
with
a h
ighe
r per
cent
age
of N
PLs
caus
ed
the
aver
age
PD to
incr
ease
whi
ch, t
oget
her w
ith th
e eff
ect o
f a fa
ll in
LG
D le
d to
a lo
wer
ave
rage
Ris
k W
eigh
ting
but w
ith a
n in
crea
se in
the
Expe
cted
Los
s in
this
cat
egor
y.
TA
BLE
18. F
IRB
APP
ROA
CH
. SO
VER
EIG
N (C
R6)
Mill
ions
of E
uros
31 D
ec. 2
017
PD scale
S&P Levels
Original on-balance-sheet gross exposures
Off-balance-sheet exposures pre-CCF
Average CCF
EAD
Average PD
Number of obligors
Average LGD
Average maturity
RWA
RWA density
EL
Value adjustments and provisions
0.0
0 to
<0.
15A
AA
a B
BB+
20
2 –
–
20
2 0.
03%
245
.00
% 9
00
2
8 13
.78%
0.0
2 –0
.14
Tota
l 20
17 2
02
–
– 2
02
0.0
3%2
45.
00
% 9
00
2
8 13
.78%
0.0
2 –0
.14
Tota
l 20
16 –
–
–
––
––
––
––
–
This
was
a n
ew p
ortf
olio
in 2
017,
with
all
its e
xpos
ure
in th
e to
p cr
edit
tran
che.
The
intr
oduc
tion
of th
is s
egm
ent r
esul
ted
from
the
appr
oval
of
the
sove
reig
n se
gmen
t in
Sant
ande
r Chi
le

2. CAPITAL
46 2017 Pillar 3 Disclosures
TA
BLE
19. F
IRB
APP
ROA
CH
INST
ITU
TIO
NS
Mill
ions
of E
uros
31 D
ec. 2
017
PD scale
S&P Levels
Original on-balance-sheet gross exposures
Off-balance-sheet exposures pre-CCF
Average CCF
EAD
Average PD
Number of obligors
Average LGD
Average maturity
RWA
RWA density
EL
Value adjustments and provisions
0.0
0 to
<0.
15A
AA
to B
BB+
4,8
25
1,55
5 35
.11%
3,8
17
0.0
6%32
944
.59%
454
7
21
18.9
0%
1.0
-5
.0
0.15
to <
0.25
BBB+
to B
BB 5
73
347
32
.53%
436
0.
20%
193
40.4
2% 7
92
195
44.6
0%
0.4
-1
.9
0.25
to <
0.50
BBB
to B
B+ 7
54
194
44.3
8% 6
47
0.38
%94
41.2
8% 8
97
40
0
61.8
6% 1.
0
-5.3
0.50
to <
0.75
BB+
to B
B 8
9 4
5 42
.05%
59
0.65
%44
44.8
8% 8
62
56
96.2
5% 0
.2
-0.9
0.75
to <
2.50
BB to
B+
56
55
20.2
1% 12
0.
91%
7944
.85%
469
10
86
.09%
0.0
-0
.3
2.50
to <
10.0
0B+
to B
- 3
8 3
5 21
.30
% 11
3.
89%
3445
.00
% 5
78
15
137.
06%
0.2
-1
.0
10.0
0 to
<10
0.0
0B
- to
C 0
0
20
.00
% 0
11
.67%
1 35
.00
% 9
00
0
18
5.16
% 0
.0
-0.0
100.
00
(Def
ault)
D 1
1 36
.33%
0
100.
00
% 4
39
.55%
913
-
- 0
.1 -0
.3
Alte
rnat
ive
trea
tmen
t 2
8 –
28
438
14
50
.00
% -
-
Tota
l 20
17 6
,365
2
,232
35
.07%
5,0
10
0.1
3% 1,
216
43.
55%
54
6 1,
412
28
.06
% 2
.9
-14
.6
Tota
l 20
16 3
,161
7
50
20.0
0%
2,5
60
0.0
9%
216
4
4.2
1% 4
14
479
18
.73%
1.1
-1.2
76%
of t
he p
ortf
olio
is ra
ted
abov
e A
-. Th
e po
rtfo
lio g
rew
by
96%
co
mpa
red
to 2
016,
due
mai
nly
to th
e Ba
nco
Popu
lar a
cqui
sitio
n, w
ith
its p
ortf
olio
of F
IRB
inst
itutio
ns a
nd th
e ap
prov
al o
f thi
s po
rtfo
lio in
Ba
nco
Sant
ande
r Chi
le. T
he P
D in
crea
sed
due
to th
e in
corp
orat
ion
of
Popu
lar's
bus
ines
s, w
ith in
ferio
r par
amet
ers.

2017 Pillar 3 Disclosures 47
Main summary
Chapter summary
Enhanc. table
List of tables
TA
BLE
20.
FIR
B A
PPRO
AC
H. C
OR
POR
ATE
S
Mill
ions
of E
uros
31 D
ec. 2
017
PD scale
S&P Levels
Original on-balance-sheet gross exposures
Off-balance-sheet exposures pre-CCF
Average CCF
EAD
Average PD
Number of obligors
Average LGD
Average maturity
RWA
RWA density
EL
Value adjustments and provisions
0.0
0 to
<0.
15A
AA
to B
BB+
4,7
67
2,18
0
48.8
3% 4
,515
0.
08%
101
44.9
4% 7
99
1,22
1 27
.04%
2
-6
0.15
to <
0.25
BBB
+ to
BBB
3,12
4 1,
248
22.9
5% 1,
983
0.20
%11
9244
.60
% 7
33
830
41
.84%
2
-6
0.25
to <
0.50
BBB
to B
B+
4,12
3 1,
401
22.14
% 2
,855
0.
39%
401
44.16
% 7
59
1,70
5 59
.73%
5
-16
0.50
to <
0.75
BB+
to B
B 2
,245
5
27
73.18
% 2
,051
0.
61%
942
42.7
3% 8
90
1,54
9 75
.52%
5
-16
0.75
to <
2.50
BB to
B+
5,6
32
1,70
5 36
.68%
4,3
65
1.39
%12
9443
.27%
780
4
,178
95.7
2% 2
6 -7
2
2.50
to <
10.0
0B
+ to
B-
4,0
15
688
50
.88%
3,6
01
4.0
2%28
9640
.65%
888
4
,054
11
2.59
% 5
9 -1
03
10.0
0 to
<10
0.0
0B
- to
C 2
36
44
74.0
1% 2
48
13.9
2%21
741
.71%
90
2 4
46
180.
05%
14
-28
100.
00
(def
ault)
D 1,
592
171
19.19
% 1,
251
100.
00
%19
243
.23%
893
–
–
5
41
-552
Trat
amie
nto
alte
rnat
ivo
583
4
3 5
62
2434
237
0
–
–
Tota
l 20
17 2
6,31
7 8
,00
8 38
.76
% 2
1,4
32
7.29
% 9
,669
4
3.35
% 8
15
14,2
21
67.0
1% 6
54
-798
Tota
l 20
16 16
,719
3
,718
67
.91%
15,
527
3.18
% 4
,563
4
3.24
% 8
74
9,1
81
59.1
3% 2
05
-267
53%
of t
he p
ortf
olio
is ra
ted
abov
e BB
B-. T
he p
ortf
olio
's av
erag
e PD
impr
oved
. Exp
osur
e in
crea
sed
by 3
8%, c
orre
spon
ding
to B
anco
Po
pula
r's c
ontr
ibut
ion
to th
ese
cate
gorie
s. T
his
dist
orte
d th
e po
rtfo
lio
com
pare
d to
the
prev
ious
yea
r, in
crea
sing
the
aver
age
cons
umpt
ion
due
to th
e hi
gher
ave
rage
PD
and
LG
D. M
oreo
ver,
the
high
NPL
ratio
ca
used
the
aver
age
expe
cted
loss
in th
is s
egm
ent t
o in
crea
se.

2. CAPITAL
48 2017 Pillar 3 Disclosures
The distribution of Exposures and average parameters by segments and geographical areas is shown below.
TABLE 21. EXPOSURE AND PARAMETERS BY SEGMENT AND GEOGRAPHY*
Millions of Euros
Central governments Institutions Corporates
Retail Mortgages Retail SME Retail Other
Retail Qualifying Revolving TOTAL
Santander Group
EAD net 2,220 36,878 177,858 276,792 10,578 50,899 13,654 568,879
Average LGD in % 45.53% 42.61% 40.60% 12.91% 39.66% 45.95% 60.77% 28.21%
Average PD in % 2.73% 0.19% 8.53% 4.97% 18.42% 5.90% 3.48% 6.06%
Continental Europe
EAD net 0 5,535 22,137 184,294 0 2,434 5,988 220,388
Average LGD in % 0.00% 44.06% 28.13% 10.00% 0.00% 88.00% 68.14% 15.12%
Average PD in % 0.00% 0.09% 1.91% 3.74% 0.00% 3.07% 3.49% 3.45%
UK
EAD net 2,019 26,082 120,112 92,498 10,578 48,464 7,666 307,419
Average LGD in % 45.58% 43.33% 42.06% 18.72% 39.66% 43.83% 55.01% 35.68%
Average PD in % 3.00% 0.14% 11.29% 7.42% 18.42% 6.04% 3.47% 8.34%
Latam
EAD net 202 5,261 31,870 – – – – 37,333
Average LGD in % 45.00% 37.50% 43.32% – – – – 42.51%
Average PD in % 0.03% 0.60% 3.67% – – – – 3.21%
Rest of world
EAD net – – 3,738 – – – – 3,738
Average LGD in % – – 44.76% – – – – 44.76%
Average PD in % – – 0.93% – – – – 0.93%
*Parameters without default
*EAD does not include neither equities nor specialised lending
The following diagram shows exposures using the IRB approach approved in December 2017 (excluding Specialised Lending), based on the internal credit quality associated with its external rating.
DISTRIBUTION OF IRB EXPOSURES ASSOCIATED WITH ITS EXTERNAL RATING
Millions of Euros
EAD excluding collaterals EAD including collaterals
AAA to AA AA- to A- BBB+ to BBB- BB+ to BB BB- to B+ B to B- CCC to C
33,795
192,960
24,440
5,831
D
26%
12%
28%
20%
23%
53,649
104,314
169,968
115,511
78,056
19,72924440
2,622
36,798
57,625
108,464 108,377

2017 Pillar 3 Disclosures 49
Main summary
Chapter summary
Enhanc. table
List of tables
For EAD distribution including guarantees, expected losses have been assigned to the different tranches of PD taking a LGD of 45% in each bucket. It shows that the risk profile of the whole portfolio improves significantly when factoring in guarantees, especially mortgage collateral.
TABLE 22. SPECIALISED LENDING (CR10)
Millions of Euros
31 Dec. 2017
Regulatory categories
Remainingmaturity
On-balance-sheet amount
Off-balance-sheet amount RW EAD RWA
Expected Loss
Category 1< 2.5 years 533 281 50% 429 213 –
>= 2.5 years 3,743 1,625 70% 3,629 2,510 14
Category 2< 2.5 years 4,201 1,962 70% 3,701 2,590 18
>= 2.5 years 10,356 6,544 90% 11,131 9,997 110
Category 3< 2.5 years 176 111 115% 187 215 5
>= 2.5 years 998 924 115% 1,216 1,391 34
Category 4< 2.5 years 67 93 250% 119 297 10
>= 2.5 years 223 336 250% 258 562 17
Category 5< 2.5 years 87 0 87 – 44
>= 2.5 years 329 339 436 – 218
Total< 2.5 years 5,064 2,447 4,524 3,315 77
>= 2.5 years 15,649 9,769 16,669 14,460 393
Exposure decreased by 4% compared to 2016, despite the Popular contribution having increased the exposure by EUR 1,900 million. The reduction was due to certain investment projects being included in a securitisation issued by Banco Santander S.A.

2. CAPITAL
50 2017 Pillar 3 Disclosures
TABLE 23. EQUITIES (CR10)
Millions of Euros
PD/RW tranches
31 Dec. 2017
Weighted average PD
Originalexposure EAD
EAD-weighted average LGD RWA EL/EAD RWA/EAD
PD/LGD Approach
1 0.09% 140 140 65.0% 98 0.06% 70%
2 0.14% 993 993 88.1% 1,171 0.12% 118%
3 0.21% 1,152 1,152 90.0% 1,682 0.19% 146%
4 0.33% 726 726 65.0% 917 0.21% 126%
5 2.76% 1,074 1,074 65.0% 2,376 1.79% 221%
Default 100% 4 4 65.0% – 65.00% –
Total 2017 0.99% 4,089 4,089 77,7% 6.243 0,67% 153%Total 2016 1.73% 5,380 5,380 75,7% 9.555 1,38% 178%Simple risk-weighted approach
190% – 891 891 – 1,693 0.80% 190%
290% – 77 77 – 222 0.80% 290%
370% – 196 196 – 727 2.40% 370%
Total 2017 1,164 1,164 2,642 – –Total 2016 1,613 1,613 – 5,130 – –
Internal models approach 2017 – 589 589 – 1,513 – 257%
Internal models approach 2016 – 657 657 – 1,661 – 253%
EquitiesDecember 2017 – 2,143 2,143 – 5,357 – 250%
Total 2017 – 7,985 7,985 – 15,755 – –Total 2016 – 7,649 7,649 – 16,346 – –
Note: for equities, EAD equals original exposures and off-balance sheet balance equals zero
In 2017, EAD declined, with a corresponding decrease in RWAs, due mainly to:
• Increase in the participation of Metrovacesa Suelo y Promoción, which meant that this participation was consolidated and therefore did not consume in Santander Group's consolidation perimeter. EAD in this perimeter reduced by EUR 809 million which consumed at 250%.
• Consolidation of the Metrovacesa Promoción y Arrendamiento participation within Metrovacesa Suelo y Promoción. This results in a fall in EAD of EUR 220 million.
The reduction in average RW is due to applying a LGD of 65% to the participations not traded on organised markets, which are held in the available for sale portfolio, as this is diversified.
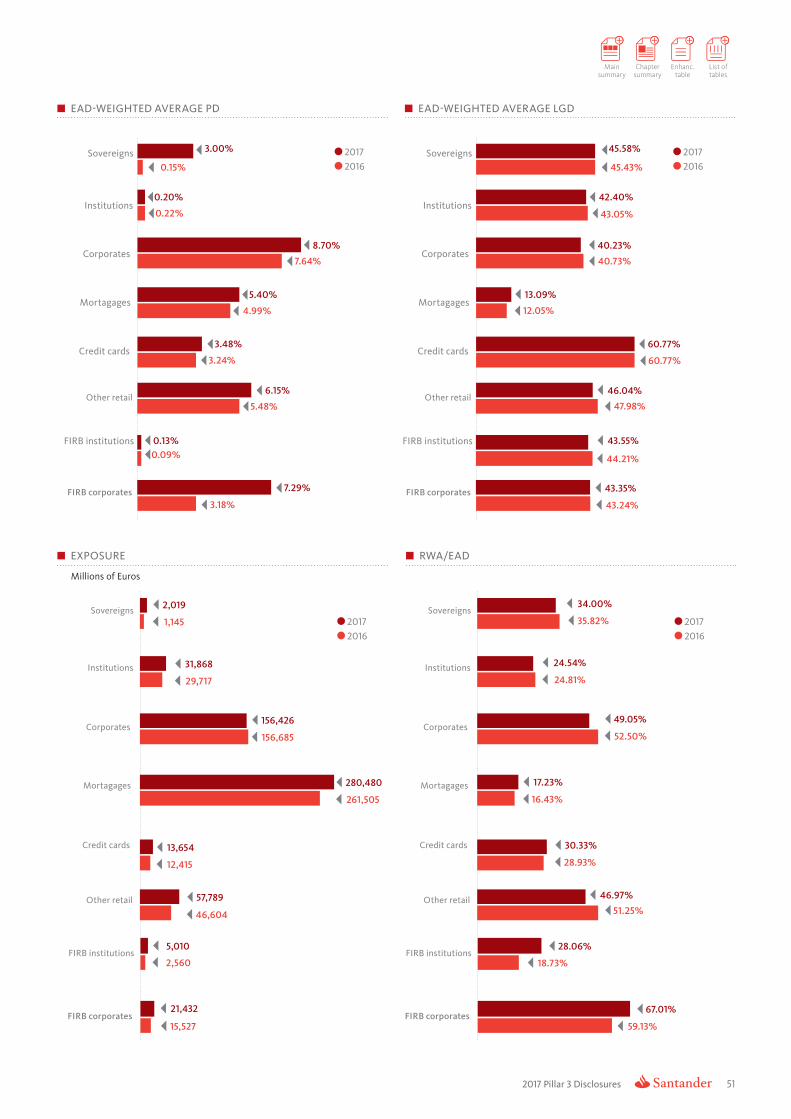
2017 Pillar 3 Disclosures 51
Main summary
Chapter summary
Enhanc. table
List of tables
EAD-WEIGHTED AVERAGE LGD
2017 2016
Other retail46.04%
47.98%
Corporates40.23%
40.73%
Mortagages13.09%
12.05%
Credit cards60.77%
60.77%
FIRB corporates 43.35%
43.24%
Sovereigns 45.58%
45.43%
Institutions42.40%
43.05%
FIRB institutions 43.55%
44.21%
EAD-WEIGHTED AVERAGE PD
2017 2016
Other retail6.15%
5.48%
Corporates8.70%
7.64%
Mortagages5.40%
4.99%
Credit cards3.48%
3.24%
FIRB corporates 7.29%
3.18%
Sovereigns 3.00%
0.15%
Institutions0.20%
0.22%
FIRB institutions 0.13%0.09%
EXPOSURE
Millions of Euros
Corporates
Other retail
Mortagages
Sovereigns
FIRB institutions
Institutions
Credit cards
FIRB corporates
2017 2016
RWA/EAD
Corporates
Other retail
Mortagages
Sovereigns35.82%
24.81%
52.50%
16.43%
28.93%
51.25%
18.73%
59.13%
34.00%
24.54%
49.05%
17.23%
30.33%
46.97%
28.06%
67.01%
FIRB institutions
Institutions
Credit cards
FIRB corporates
2017 2016
1,145
29,717
156,685
261,505
12,415
46,604
2,560
15,527
2,019
31,868
156,426
280,480
13,654
57,789
21,432
5,010

2. CAPITAL
52 2017 Pillar 3 Disclosures
2.2.2.1.2. Plan to deploy advanced internal models and supervisory approvalSantander Group remains committed to adopting the Basel II advanced internal ratings-based (AIRB) approach for virtually all its banks until more than 90% of net exposure in the loan portfolio has been covered by this approach. This approach will be applied progressively over the coming years. The commitment assumed with the supervisor means adapting the advanced models in the ten core markets in which Santander Group operates.
Santander Group continued to pursue this objective during 2017 through its plan to gradually implement the necessary technology platforms and methodological improvements to enable the progressive application of AIRB models for calculating regulatory capital at the rest of the Group’s units.
Santander Group has supervisory approval to use advanced approaches for calculating regulatory capital for credit risk in eight of its ten main markets: Spain, the United Kingdom, Portugal, some
portfolios in Germany, Mexico, Brazil, Chile, Nordics (Sweden, Finland and Norway), France and the United States.
Regulatory approvals obtained in 2017The strategy to implement Basel regulations at the Group focuses on the use of advanced approaches at the main American and European banks.
Authorization for the use of Slotting Criteria was obtained in 2017 for specialised lending and use of internal models for the Sovereign and Institutions portfolios (FIRB approach) of Chile, Mortgages and for most of the revolving credit of Santander Consumer Germany.
The following chart shows the percentage of IRB coverage by region:
IRB COVERAGE BY REGION
%
USA
4%
BRAZIL
23%MEXICO
49%
CHILE
12% SPAIN
81%
GERMANY
74%
PORTUGAL
81%
FRANCE
88%
NÓRDICS
42%UK
86%
Isolating sovereign bonds in local currency and non-financial assets, which are not subject to the internal model deployment plan, as of December 2017 Santander Group reports 60.2% of the EAD in IRB.

2017 Pillar 3 Disclosures 53
Main summary
Chapter summary
Enhanc. table
List of tables
In terms of geographical area, the main contributors are Spain (26%), the United Kingdom (23%), the global portfolio of companies in Chile, Brazil and the USA (3%), Portugal (3%), Germany (3%), Mexico (2%), Nordic countries (1%) and France (1%).
Of the remaining exposure, which is currently calculated using the standard method, 57% is subject to advanced model implementation plans, with the objective of obtaining supervisory approval, in order to calculate requirements of capital per IRB model for 90% of total exposure.
The remaining portfolios not included in the advanced model deployment plan are subject to analysis in order to assess the appropriateness of their integration into the plan; additionally, included in these other portfolios are the portfolios authorised by the supervisor to remain in permanent standard. The distribution of exposure to credit and counterparty risk according to the capital requirements calculation method is shown graphically below.
*To simplify: the 43% permanent STD includes both the permanent STD portfolios authorised by the regulator and those pending approval (candidates for permanent STD or roll out)
Roll out57%
IRB60%
STD40%
STD permanente*43 %
The medium-term objective of achieving a high degree of IRB model coverage in the main markets in which the Group operates is conditioned by the acquisition of new business as it has been during 2017 with the integration of the various established Popular units.
In addition, the combination of declining business in some standard portfolios, especially in the United States, United Kingdom and Brazil, coupled with an increase in business in some advanced model portfolios in Portugal and Spain (Popular integration) has contributed significantly to an increase in Degree of IRB coverage at a consolidated level. During 2017, exchange rate movements had a positive impact, especially the major rise of the euro against the US dollar, Brazilian real and Mexican peso, due to the ECB's monetary policy.

2. CAPITAL
54 2017 Pillar 3 Disclosures
The following table shows the internal models scope (AIRB or FIRB) of the different portfolios distributed by region:
TABLE 24. LIST OF AUTHORISED IRB MODELS BY LEGAL ENTITY
Country Company IRB portfolio (AIRB or FIRB)
UK Santander UK PLC Institutions, Corporates, Corporates SMEs, Corporates Project Finance, Mortgages, Qualifying Revolving, Other Retail.
Abbey National Treasury Services Institutions, Corporates, Corporates SMEs, Corporates Project Finance.
Abbey Covered Bonds LLP Institutions
Spain Banco Santander, S.A. Sovereigns, Institutions, Corporates, Corporates SMEs, Corporates Project Finance, Mortgages, Qualifying Revolving, Retail SMEs, Other Retail
Santander Factoring y Confirming, S.A. Institutions, Corporates, Corporates SMEs, Corporates Project Finance, Mortgages, Retail SMEs, Other Retail
Santander Lease, S.A. E.F.C. Institutions, Corporates Corporates SMEs, Mortgages, Retail SMEs, Other Retail
Santander Consumer, EFC, S.A. Corporates, Corporates SMEs, Qualifying Revolving, Other Retail.
Santander Consumer Finance, S.A. Corporates, Corporates SMEs, Qualifying Revolving, Other Retail.
Portugal Banco Santander Totta Institutions, Corporates, Corporates SMEs, Corporates Project Finance, Mortgages, Qualifying Revolving, Retail SMEs, Other Retail.
Brazil Banco Santander Brasil Corporates
Santander Brasil, EFC Corporates
Germany Santander Consumer Bank AG Corporates, Corporates SMEs, Mortages, Revolving and Other Retail
Mexico Banco Santander México Institutions, Corporates, Corporates SMEs, Corporates Project Finance
USA Santander Bank, National Associaction Corporates
France Société Financière de Banque - SOFIB Corporates, Corporates SMEs, Retail SMEs, Other Retail
Nordic countries Santander Consumer Bank A.S. Other Retail
Santander Consumer Finance OY Other Retail
Chile Banco Santander - Chile Sovereigns, Institutions and Corporates
The following table shows the Market Risk internal models (IMA) of the different portfolios distributed by geographies
TABLE 25. LIST OF AUTHORISED IMA MODELS BY LEGAL ENTITY
Country Legal entity IMA Portfolio Product
España Banco Santander, S.A. Trading book
Chile
Banco Santander - Chile Trading book
Santander Agente de Valores Limitada Trading book
Santander Investment Chile Limitada Trading book
Santander Corredores de Bolsa Limitada Trading book
MéxicoBanco Santander México Trading book
Casa de Bolsa Santander, S.A. de C.V. Trading book
Portugal Banco Santander Totta Trading book
Reino UnidoSantander UK PLC
Trading book less FX and specific interest rate risk
Abbey National Treasury ServicesTrading book less FX and specific interest rate risk

2017 Pillar 3 Disclosures 55
Main summary
Chapter summary
Enhanc. table
List of tables
As additional information, the chart below shows, for each of the unit portfolios, the scope of the supervisory approval for the method, covered by the Standardised approach, FIRB and AIRB, and the portion of portfolios that form part of the roll-out plan for Credit Risk, Counterparty Credit Risk and securisitations.
TABLE 26. BREAKDOWN OF EXPOSURE BY APPROACH TO CALCULATING CAPITAL EMPLOYED*
Millions of Euros 31 Dec. 2017
Total Santander Group
EAD** EAD AIRB EAD FIRB EAD STDOf which:
EAD roll out
1,281,690 € 558,998 € 47,837 € 674,855 € 226,963 €
*Including: credit risk + counterparty risk + securitisation risk (including sovereign local currency and ANF).
**Excluding: equity + DTAs + reconciliation adjustments + provisions + loans for acquisition of own stocks + financial participations.
Country Portfolio% EAD/
Total Group % AIRB % FIRB % STDOf which: % roll out
UK
Central governments and central banks 4.18% – – 4.18% –
Institutions 0.64% 0.43% – 0.21% –
Corporates 3.87% 1.25% 1.10% 1.53% 0.95%
Mortgages 14.22% 14.22% – 0.01% –
Retail 1.36% 0.65% – 0.71% 0.51%
Other exposures 0.57% – – 0.57% –
Default 0.22% 0.17% 0.02% 0.03% 0.02%
Securitisation positions 0.42% 0.28% – 0.14% –
Non-financial assets 0.18% – – 0.18% –
Total UK 25.66% 16.99% 1.12% 7.55% 1.48%
* UK Unit -SC UK
Country Portfolio% EAD/
Total Group % AIRB % FIRB % STDOf which: % roll out
Spain
Central governments and central banks 7.63% 0.15% – 7.48% –
Institutions 2.88% 1.85% 0.07% 0.96% 0.00%
Corporates 8.98% 6.97% 1.20% 0.81% 0.00%
Mortgages 6.53% 5.35% – 1.18% –
Retail 3.15% 2.09% – 1.06% 0.01%
Other exposures 0.57% – – 0.57% –
Default 1.71% 1.45% 0.10% 0.16% 0.00%
Securitisation positions 0.87% 0.87% – 0.00% –
Non-financial assets 0.29% – – 0.29% –
Total Spain 32.60% 18.72% 1.37% 12.51% 0.01%
*Spain SAN + Factoring and leasing + SC Spain + PSA Spain + Feci + Insurance Spain

2. CAPITAL
56 2017 Pillar 3 Disclosures
Country Portfolio% EAD/
Total Group % AIRB % FIRB % STDOf which: % roll out
Brazil
Central governments and central banks 3.89% – – 3.89% 0.14%
Institutions 0.25% – – 0.25% 0.12%
Corporates 2.60% 1.44% – 1.16% 1.08%
Mortgages 0.57% – – 0.57% 0.56%
Retail 2.52% – – 2.52% 2.25%
Other exposures 0.58% – – 0.58% –
Default 0.19% 0.06% – 0.14% 0.10%
Securitisation positions – – – – –
Non-financial assets 0.14% – – 0.14% –
Total Brazil 10.75% 1.49% – 9.26% 4.25%
Country Portfolio% EAD/
Total Group % AIRB % FIRB % STDOf which: % roll out
USA
Central governments and central banks 0.51% – – 0.51% –
Institutions 1.34% – – 1.34% 1.29%
Corporates 1.82% 0.29% – 1.53% 1.40%
Mortgages 1.41% – – 1.41% 1.41%
Retail 2.14% – – 2.14% 2.11%
Other exposures 0.29% – – 0.29% 0.02%
Default 0.07% – – 0.07% 0.07%
Securitisation positions 0.09% – – 0.09% –
Non-financial assets 0.41% – – 0.41% –
Total USA 8.09% 0.29% – 7.80% 6.30%
*SBNA - SC USA - N.Y. - Miami
Country Portfolio% EAD/
Total Group % AIRB % FIRB % STDOf which: % roll out
Chile
Central governments and central banks 0.46% – 0.02% 0.45% –
Institutions 0.18% – 0.17% 0.01% 0.01%
Corporates 0.93% 0.16% 0.03% 0.75% 0.63%
Mortgages 1.08% – – 1.08% 1.08%
Retail 0.70% – – 0.70% 0.67%
Other exposures 0.18% – – 0.18% 0.14%
Default 0.10% 0.01% – 0.10% 0.10%
Securitisation positions – – – – –
Non-financial assets 0.03% – – 0.03% –
Total Chile 3.67% 0.16% 0.21% 3.30% 2.62%
Chile + SC Chile

2017 Pillar 3 Disclosures 57
Main summary
Chapter summary
Enhanc. table
List of tables
Country Portfolio% EAD/
Total Group % AIRB % FIRB % STDOf which: % roll out
Mexico
Central governments and central banks 0.90% – – 0.90% –
Institutions 0.31% 0.09% 0.16% 0.07% –
Corporates 0.97% 0.46% 0.48% 0.03% –
Mortgages 0.39% – – 0.39% 0.30%
Retail 0.56% – – 0.56% 0.56%
Other exposures 0.04% – – 0.04% –
Default 0.04% 0.01% 0.01% 0.03% 0.02%
Securitisation positions 0.01% – – 0.01% –
Non-financial assets 0.02% – – 0.02% –
Total Mexico 3.24% 0.55% 0.64% 2.05% 0.88%
Country Portfolio% EAD/
Total Group % AIRB % FIRB % STDOf which: % roll out
Portugal
Central governments and central banks 0.66% – – 0.66% –
Institutions 0.18% 0.10% – 0.08% 0.02%
Corporates 0.86% 0.66% 0.09% 0.11% 0.06%
Mortgages 1.32% 1.16% – 0.16% 0.16%
Retail 0.35% 0.23% – 0.12% 0.02%
Other exposures 0.08% – – 0.08% –
Default 0.12% 0.09% – 0.02% 0.02%
Securitisation positions 0.00% 0.00% – – –
Non-financial assets 0.06% – – 0.06% –
Total Portugal 3.64% 2.24% 0.09% 1.31% 0.29%
Portugal + SC Portugal
Country Portfolio% EAD/
Total Group % AIRB % FIRB % STDOf which: % roll out
Poland
Central governments and central banks 0.63% – – 0.63% 0.00%
Institutions 0.05% – – 0.05% 0.04%
Corporates 0.76% – – 0.76% 0.31%
Mortgages 0.63% – – 0.63% 0.27%
Retail 0.63% – – 0.63% 0.35%
Other exposures 0.06% – – 0.06% –
Default 0.05% – – 0.05% 0.04%
Securitisation positions 0.00% – – 0.00% –
Non-financial assets 0.02% – – 0.02% –
Total Poland 2.81% – – 2.81% 1.02%
Poland + SC Poland + PSA Poland

2. CAPITAL
58 2017 Pillar 3 Disclosures
Country Portfolio% EAD/
Total Group % AIRB % FIRB % STDOf which: % roll out
Germany
Central governments and central banks 0.13% – – 0.13% –
Institutions 0.03% – – 0.03% –
Corporates 0.44% 0.14% – 0.30% 0.14%
Mortgages 0.34% 0.29% – 0.05% 0.05%
Retail 1.91% 1.53% – 0.37% 0.07%
Other exposures 0.02% – – 0.02% –
Default 0.04% 0.04% – 0.01% 0.00%
Securitisation positions 0.16% 0.16% – – –
Non-financial assets 0.00% – – 0.00% –
Total Germany 3.07% 2.16% – 0.91% 0.26%
SC Germany + PSA Germany
Country Portfolio% EAD/
Total Group % AIRB % FIRB % STDOf which: % roll out
Nordic countries
Central governments and central banks 0.02% – – 0.02% –
Institutions 0.03% – – 0.03% –
Corporates 0.05% – – 0.05% 0.04%
Mortgages – – – – –
Retail 1.07% 0.51% – 0.55% 0.54%
Other exposures 0.08% – – 0.08% –
Default 0.01% 0.01% – 0.01% 0.01%
Securitisation positions – – – – –
Non-financial assets 0.00% – – 0.00% –
Total Nordic countries 1.26% 0.52% – 0.75% 0.59%
SC Nordics: Sweden + Denmark + Finland + Norway
Country Portfolio% EAD/
Total Group % AIRB % FIRB % STDOf which: % roll out
France
Central governments and central banks 0.03% – – 0.03% –
Institutions 0.04% – – 0.04% –
Corporates 0.32% – 0.29% 0.03% –
Mortgages – – – – –
Retail 0.50% 0.47% – 0.02% –
Other exposures 0.02% – – 0.02% –
Default 0.02% 0.01% 0.01% 0.00% –
Securitisation positions – – – – –
Non-financial assets 0.00% – – 0.00% –
Total France 0.93% 0.48% 0.30% 0.14% –
PSA France

2017 Pillar 3 Disclosures 59
Main summary
Chapter summary
Enhanc. table
List of tables
Country Portfolio% EAD/
Total Group % AIRB % FIRB % STDOf which: % roll out
Rest of Europe
Central governments and central banks 0.08% – – 0.08% –
Institutions 0.11% – – 0.11% –
Corporates 0.23% – – 0.23% –
Mortgages 0.30% – – 0.30% –
Retail 0.89% – – 0.89% –
Other exposures 0.09% – – 0.09% –
Default 0.06% – – 0.06% –
Securitisation positions 0.00% – – 0.00% –
Non-financial assets 0.34% – – 0.34% –
Total Rest of Europe 2.08% – – 2.08% –
SC Benelux + SC Italy + SC Hungary + SC Austria + SC Holland + Ireland + GFA Europe + GFA Rest + GFA Spain + PSA Belgium + PSA Netherlands +
PSA Switzerland + PSA Italy + UCI
Country Portfolio% EAD/
Total Group % AIRB % FIRB % STDOf which: % roll out
Rest of America
Central governments and central banks 0.58% – – 0.58% –
Institutions 0.29% – – 0.29% –
Corporates 0.45% – – 0.45% –
Mortgages 0.12% – – 0.12% –
Retail 0.62% – – 0.62% –
Other exposures 0.05% – – 0.05% –
Default 0.02% – – 0.02% –
Securitisation positions – – – – –
Non-financial assets 0.06% – – 0.06% –
Total Rest of America 2.19% – – 2.19% –
*Paraguay + Uruguay + Puerto Rico + Peru + Panama + Colombia + Argentina + GFA America + SC Canada
Regulatory approvals obtained for other risksTurning to other risks explicitly envisaged in Basel Pillar 1, authorisation has been obtained in the case of market risk to use internal models for the cash trading business in the United Kingdom, Spain, Chile, Portugal and Mexico.
For further information on market risk, see section 2.2.2.3.
For operational risk, Santander Group currently uses the standardised approach for calculating regulatory capital, as set out in the CRR. In 2017, the European Central Bank granted authorisation for the Alternative Standardised Approach to be used to calculate consolidated capital requirements at Banco Santander Mexico, following the approval granted in 2016 in the case of Brazil.
For further information on operational risk, see section 2.2.2.4.
Supervisory validation processAs established by the European Parliament, the primary element of the banking union is the Single Supervisory Mechanism (SSM). Under this mechanism, direct banking supervision falls to the European Central Bank, thus ensuring that the largest European banks are independently supervised by just one entity and are subject to a set of standard regulations.
The second key element is the Single Resolution Mechanism (SRM), which is tasked with preparing for the worst-case scenario, meaning bank failure. The aim is to ensure that any such situation can be resolved in an orderly fashion and at a minimum cost for taxpayers. The focus on keeping taxpayers from bearing the cost of future bank resolutions led to a change in the underlying regulations, namely the Bank Recovery and Resolution Directive (BRRD). Under the BRRD, a bank’s shareholders and creditors will bear the brunt of resolution costs. Under certain circumstances, banks may also obtain supplementary financing from the recently-created Single Resolution Fund (SRF), which is financed by the banking sector. Both the SSM and the SRM are operational, although the SRM since 1 January 2016. The SRF is expected to meet its target funding level by 2023. Euro area member states automatically form part of the banking union, while adherence is voluntary for other member states.

2. CAPITAL
60 2017 Pillar 3 Disclosures
The European Central Bank has gradually been deploying its new structure and functions to effectively become the single European supervisor. The EBA will continue to actively collaborate in adapting regulations. Each body’s responsibilities are as follows:
INTERACTION Evaluation of balance sheets
Stress test Supervision manual
EDIS European
Deposit Insurance Scheme
SUPERVISORY VALIDATION PROCESS
SUPERVISION Application of the
single rulebook Micro-prudential
supervision Supervisory
practices
EU REGULATORY HARMONISATION Improvement of
convergence of supervisory practices in the EU-28
Development and interpretation of the single rulebook for the EU-28
ECB EBA
SRMSingle
Resoluton Mechanism
SSMSingle
Supervisory Mechanism
BRRD Bank Recovery and Resolution
Directives
A preparatory pre-assessment stage has now been added to the supervisory validation process. This involves the entity providing the supervisor, in advance, with the documentation it needs to assess whether the minimum requirements for continuing the formal validation process have been met. If the European Central Bank considers the entity to be initially ready, a request is sent and the supervisor begins a formal validation of the internal models. This validation process decides whether or not to authorise the use of advanced models for capital calculation.
The European supervisor has put in place a new governance process, involving the following steps:
• The Joint Supervisory Team (JST), consisting of a mixed team of experts, analyses the entity’s situation and issues a technical report to the ECB’s Supervisory Board.
• The Supervisory Board then submits its preliminary decisions to the Governing Council.
• The Governing Council then issues its final decision authorising or not the use of the internal models.
ECBis the
starting point
JSTanalyses and
prepares a preliminary
decision
Decision makingThe Supervisory Board submits its preliminary decisions to the Governing Council
JSTSub-Coordinators
Expert team
JST Coordinator
(ECB)

2017 Pillar 3 Disclosures 61
Main summary
Chapter summary
Enhanc. table
List of tables
The supervisor uses the documentation provided by the entity as the basis for its assessment of whether the minimum requirements for using advanced models have been met. This information must be sufficiently thorough and detailed to provide a third party with a clear idea of the entity’s rating systems, methodologies, technological infrastructure, capital calculation process and internal governance and must be able to replicate the outputs of the internal model. The unit itself is responsible for preparing this documentation, which forms part of the formal application required for the validation process established by the supervisors of entities seeking to implement advanced IRB models.
The supervisory validation process is made somewhat more complicated by the fact that multinational companies such as Santander are present in various countries and regions. This requires the involvement of supervisors from different jurisdictions, which are often subject to different laws and employ different criteria and timeframes. This sometimes hinders and slows joint decisions on the approval of IRB models with a consolidated scope and can also affect authorisations at a local level.
With regard to the supervisory validation processes being organised by the ECB across the euro area, there is currently no established timeframe for processing modifications of previously approved IRB models and responding to new requests for authorisation. However, Santander is aware that progress is being made and it expects requests will soon be answered more rapidly than is currently the case, especially when the nature of the changes does not require a detailed review of the model, unlike what happens when formal authorisation is requested for the use of advanced approaches for calculating regulatory capital with an IRB model for the first time.
Finally, it would be good to achieve international consensus on a maximum timeline for reviewing requests for authorisation of IRB models. This should not exceed six months, bearing in mind also all the governance required to draw up the requests.
Santander Group vision on internal modelsOne of Santander Group’s main corporate objectives is to enable its subsidiaries to become leading institutions in their markets, adopt the most advanced return- and capital-based management systems currently in existence, and put themselves in the best possible position to succeed in the new competitive environment, which is becoming increasingly complex and demanding.
In this way, Santander Group is convinced that internal models are crucial to achieving this objective, so abandoning these models and regressing to standardisation would be highly inadvisable and would be a backward step after the significant advances made in recent years. Using internal models makes it possible to improve risk management overall and adapt capital requirements more closely to reality.
Further progress at an international level is required to ensure there are no differences that might affect the competition and to guarantee an even playing field across all jurisdictions. Some adjustments still need to be made to the mechanisms underpinning the entire models-based system and it is essential to continue investing in their improvement and moreover the supervisory bodies must strengthen all the supervisory processes and the standardisation of criteria.
Targeted Review of Internal ModelsIn 2016 the European Central Bank (ECB) launched a review of internal regulatory capital models known as “TRIM” (Targeted Review of Internal Models) with the main aim of helping restore credibility, regulating any divergences of capital requirements that do not match the risk profile of the exposures, and standardising regulatory practices through better knowledge of the models. To this end, the supervisor has released a TRIM guide that aims to assess the reliability and comparability of internal models and their compliance with regulatory standards in accordance with the supervisory and compliance-related guidance. The aim here is to help improve the supervisory process by making it more efficient and homogeneous and ensuring that risks are duly modelled and capital requirements are calculated correctly.
In 2017, the TRIM exercise moved from the preparatory phase to the execution or on-site inspection phase, in which the ECB has been scrutinising the selected internal models at each institution with a scope of over 110 inspections across more than 50 institutions from 12 different countries (e.g. retail Mortgage and SME portfolios and market risk). During this on-site inspection, the ECB uses standard techniques and tools to assess compliance with prevailing regulations and ensure that the stringent supervisory expectations are consistently applied.
The inspection phase is due to continue in 2018 for market and counterparty risk models (at those institutions that have an approved internal model) and high-default credit risk, while the inspection phase is due to commence on low-default portfolio credit risk models; a process that may last until 2019.

2. CAPITAL
62 2017 Pillar 3 Disclosures
A breakdown of the different phases of the exercise is shown below:
OB
JEC
TIV
ED
ESC
RIP
TIO
N
Before missions During missions After missions
1 - PREPARATION PHASE 2 - TARGETED REVIEW PHASE2016 – Beginning of 2017 April 2017 – End of 2018 / Beginning 2019
Selection of targeted review models.
Create review handbooks.
Prepare and conduct surveys.
On-site interviews and collection of documentation.
Define model selection criteria and prepare model review methodology.
Finalize selection of models.
Information letter sent to institutions.
Data collection and tests requests to institutions prior to start of the missions.
Submission via secured Virtual Data Room (VDR) or directly on the bank’s equipment.
Model-specific reviews on-site (TRIMIs and TRIMIX) and data quality review.
On-site in-depth methodological review per portfolio.
Review of IT and data quality.
Collect and process data.
Meetings with different stakeholders.
Horizontal review and benchmarking across the industry.
Feedback and follow-up with the institutions:
Communicate findings of Targeted Review Phase (assessment report with facts and findings).
Monitoring and remediation of findings.
Concluding decisions after public consultation of the guide.
Consistency check of internal models across the industry.
On-site in-depth model reviews.
Horizontal reviews of selected models.
Remediation and monitoring of findings.
Refinement of the handbook.
2.2.2.1.3. Standard approach For the calculation of regulatory capital under the Standardised approach, Santander Group uses the external rating agencies designated as eligible by the Bank of Spain. The agencies used for the capital calculation as of 31 December 2017 are Fitch, Moody's, DBRS and Standard & Poor's.
Also, for the central government and central banks category, if the requirements of article 137 of the CRR are met, Santander Group uses the OECD's Country Risk Classification of the Participants to the Arrangement on Officially Supported Export Credits.
Different risk weights are applied to credit exposures, depending on the rating assigned by the credit rating agencies (e.g. Fitch, Moody's and Standard & Poor's for the segments approved under Part III, Title II, Chapter II of the CRR) or the minimum export insurance premium rating (e.g. OECD for the central government and central bank segment, as explained above).

2017 Pillar 3 Disclosures 63
Main summary
Chapter summary
Enhanc. table
List of tables
The assignment of weights according to credit ratings complies with the regulatory requirements, aligning the alphanumeric scale of each agency used with the credit quality steps set down in Chapter II, Section II of the CRR, as follows:
Credit qualitystep
S&P Moody's Fitch DBRS
1 AAA to AA- Aaa to Aa3 AAA to AA- AAA to AAL
2 A+ to A- A1 to A3 A+ to A- AH to AL
3 BBB+ to BBB- Baa1 to Baa3 BBB+ to BBB- BBBH to BBBL
4 BB+ to BB- Ba1 to Ba3 BB+ to BB- BBH to BBL
5 B+ to B- B1 to B3 B+ to B- BH to BL
6 Lower than B- Lower than B3 Lower than B- CCCH and lower
Credit qualitystep
Central governments and
central banks
Public sector entities
Institutions <= 3 months rated
Institutions > 3 months rated
Institutions not rated Companies
1 0% 20% 20% 20% 20% 20%
2 20% 50% 20% 50% 50% 50%
3 50% 100% 20% 50% 100% 100%
4 100% 100% 50% 100% 100% 100%
5 100% 100% 50% 100% 100% 150%
6 150% 150% 150% 150% 150% 150%
At present, Santander Group has no process in place for assigning the credit ratings of publicly issued securities to comparable assets that are not included in the trading book.
In accordance with art. 150 of the CRR, Santander Group always uses the Standardised approach for sovereign exposures denominated and funded in the Member State's local currency, applying a 0% risk weight.
The tables below show the value of the net exposure after impairment loss allowances after risk mitigation, by segment and credit quality grade. Guarantees are applied by reallocating exposures to the corresponding asset categories and risk weightings.

2017 Pillar 3 Disclosures
2. CAPITAL
64
TA
BLE
27.
STA
ND
AR
DIS
ED A
PPRO
AC
H (I
NC
LUD
ING
A B
REA
KD
OW
N O
F EX
POSU
RES
S PO
ST-C
ON
VER
SIO
N F
AC
TOR
AN
D P
OST
-MIT
IGA
TIO
N T
ECH
NIQ
UES
) (C
R5)
M
illio
ns o
f Eur
os
31 D
ec. 2
017
Risk
wei
ght 0%
2%
4%
10%
20%
35%
50%
70%
75%
100%
150%
250%
370%
1250%
Others
Deduc.
Total
Cen
tral
gov
ernm
ents
or c
entr
al b
anks
228
,030
–
–
–
13
7 –
2
,40
3 –
–
3
,246
–
–
–
–
–
–
2
33,8
16
Regi
onal
gov
ernm
ent o
r loc
al a
utho
riti
es 6
,938
–
–
–
3
50
–
0
–
–
152
0
–
–
–
–
–
7,4
40
Publ
ic s
ecto
r ent
itie
s 9
,264
–
–
–
8
40
–
14
–
–
221
–
–
–
–
–
–
10
,338
Mul
tila
tera
l dev
elop
men
t ban
ks 3
,110
–
–
–
–
–
–
–
–
–
–
–
–
–
–
–
3
,110
Inte
rnat
iona
l org
anis
atio
ns –
–
–
–
–
–
–
–
–
7
–
–
–
–
–
–
7
Inst
ituti
ons
540
–
–
–
18
,437
–
4
67
–
–
2,10
9 0
–
–
–
–
–
2
1,554
Cor
pora
tes
–
–
–
–
885
–
7
56
–
–
72,
564
20
0
–
–
–
–
–
74,
404
Reta
il –
–
–
–
–
–
–
–
13
6,17
3 –
–
–
–
–
–
–
13
6,17
3
Secu
red
by m
ortg
ages
on
imm
ovab
le p
rope
rty
–
–
–
–
–
68,
525
12,6
48
–
3,7
15
7,0
85
–
–
–
–
–
–
91,9
73
Expo
sure
s in
def
ault
–
–
–
–
–
–
–
–
–
7,6
46
1,92
0
–
–
–
–
–
9,5
67
Hig
her-
risk
cat
egor
ies
–
–
–
–
–
–
–
–
–
–
1,59
9 –
–
–
–
–
1,
599
Cov
ered
bon
ds –
–
–
2
,255
1,
151
–
–
–
–
–
–
–
–
–
–
–
3,4
06
Inst
ituti
ons
and
corp
orat
es w
ith
a sh
ort-
term
cre
dit a
sses
smen
t –
–
–
–
–
–
–
–
–
2
–
–
–
–
–
–
2
Col
lect
ive
inve
stm
ent u
nder
taki
ngs
–
–
–
–
584
–
–
–
–
12
–
–
–
–
9
7 –
6
94
Equi
ty –
–
–
–
–
–
–
–
–
5
62
–
–
–
–
–
–
562
Oth
er it
ems
22,
363
12
–
–
8,7
21
–
60
–
8
8 4
4,32
4 12
6
,357
–
–
–
–
8
1,937
Tota
l 2
70,2
45
12
–
2,2
55
31,
104
6
8,52
5 16
,34
8 –
13
9,97
6 13
7,92
9 3
,731
6
,357
–
–
9
7 –
6
76,5
80
The
follo
win
g ta
bles
det
ail t
he b
reak
dow
n of
cou
nter
part
y cr
edit
risk
expo
sure
s, c
alcu
late
d us
ing
the
stan
dard
ised
app
roac
h, b
y po
rtfo
lio
(cou
nter
part
y ty
pe) a
nd ri
sk w
eigh
ting
(by
risk
grad
e at
trib
uted
to th
e st
anda
rdis
ed a
ppro
ach)
:

2017 Pillar 3 Disclosures 65
Main summary
Chapter summary
Enhanc. table
List of tables
TA
BLE
28.
STA
ND
AR
DIS
ED A
PPRO
AC
H –
CC
R EX
POSU
RES
BY
REG
ULA
TORY
PO
RTF
OLI
O A
ND
RIS
K (C
CR
3)
M
illio
ns o
f Eur
os
31 D
ec. 2
017
Risk
wei
ght
0%
2%
4%
10%
20%
35%
50%
70%
75%
100%
150%
Deduc.
Total
Cen
tral
gov
ernm
ents
or c
entr
al b
anks
5,9
65
–
–
–
37
–
93
–
–
14
–
–
6,11
0
Regi
onal
gov
ernm
ent o
r loc
al a
utho
riti
es –
–
–
–
–
–
–
–
–
–
–
–
Publ
ic s
ecto
r ent
itie
s 5
08
–
–
–
0
–
–
–
–
–
–
–
50
9
Mul
tila
tera
l dev
elop
men
t ban
ks 2
1 –
–
–
–
–
7
–
–
–
–
–
2
8
Inte
rnat
iona
l org
anis
atio
ns –
–
–
–
–
–
–
–
–
–
–
–
–
Inst
ituti
ons
194
16,6
55
–
–
931
–
4
22
–
–
57
–
–
18,2
59
Cor
pora
tes
–
–
–
–
45
–
28
–
–
2,3
76
43
–
2,4
93
Reta
il –
–
–
–
–
–
–
–
3
14
–
–
–
314
Inst
ituti
ons
and
corp
orat
es w
ith
a sh
ort-
term
cre
dit a
sses
smen
t 2
–
–
–
–
–
–
–
–
–
–
–
2
Inst
ituti
ons
and
corp
orat
es w
ith
a sh
ort-
term
cre
dit a
sses
smen
t –
–
–
–
–
–
–
–
–
7
–
–
7
Oth
er it
ems
–
–
–
–
–
–
–
–
–
21
–
–
21
Tota
l 6
,690
16
,655
–
–
1,
014
–
5
51
–
314
2
,475
4
3 –
2
7,74
1

2017 Pillar 3 Disclosures
2. CAPITAL
66
2.2.2.2. Credit risk – Securitisations
2.2.2.2.1. Methodology for calculating risk-weighted exposures in securitisation activitiesSantander Group calculates regulatory capital under the securitisation approach only if the securitisation special purpose entity (SSPE) meets the regulatory conditions established in the CRR for significant risk transfer. Otherwise, capital is calculated for the securitised exposures as if they had never been securitised. Capital is also calculated for investment positions in securitisation funds originated by third parties.
Capital requirements for securitisation positions are calculated by applying the appropriate risk weight to the exposure value of each position, depending on the approach (standardised or IRB) used by the entity to calculate the risk-weighted exposure amounts of the securitised portfolio. If the entity uses both approaches for the various securitised exposures that make up the underlying portfolio, the method that applies to the predominant proportion of exposures in the portfolio is used.
Entities that use the standardised approach to calculate capital requirements apply the risk weights stipulated in the CRR (see table 29), based on the credit quality level assigned to the external credit ratings issued by eligible External Credit Assessment Institutions (ECAIs) for each securitisation or re-securitisation position:
TABLE 29. RW OF SECURITISATIONS FOR THE STANDARDISED APPROACH
Credit quality levelsShort-term
ratingsLong-term
ratingsSecuritisation
positionsResecuritisation
positions
1 A-1+, A-1 AAA to AA- 20% 40%
2 A-2 A+ to A- 50% 100%
3 A-3 BBB+ to BBB- 100% 225%
4 N/A BB+ to BB- 350% 650%
Other levels 1250% 1250%
Where no external credit rating is available, the entity assigns the weighted-average risk weight applied to securitised exposures, multiplied by the concentration ratio (lookthrough method). If the entity has insufficient information on the underlying portfolio, a risk weight of 1.250% is assigned.
Entities that adopt the IRB approach when calculating capital requirements use the external-ratings-based approach, applying the risk weights stipulated in the CRR (see tables 30 and 31). These weights ultimately depend on whether it is a securitisation or re-securitisation, whether it is the most senior position in the securitisation or not, the effective number of exposures (granularity of the underlying) and the credit quality level assigned to the external credit ratings issued by eligible ECAIs or the ratings inferred from each securitisation position. These risk weights are multiplied by 1.06 to calculate the risk-weighted exposure amounts, except for tranches that already have the maximum weighting of 1.250%.
Where no external credit rating is available but PD and LGD estimates are, the supervisory formula method may be used. The inputs for this method are tranche thickness, average capital charge and expected loss on the underlying (KIRB), the average LGD of the underlying an the effective number of exposures.

2017 Pillar 3 Disclosures 67
Main summary
Chapter summary
Enhanc. table
List of tables
As for the external ratings method, the relationship is as follows when the ratings are long-term:
TABLE 30. RWS OF SECURITISATIONS WITH LONG-TERM RATING (RBA-IRB APPROACH)
Credit quality levels Long-term ratings
Securitisation positions Resecuritisation positions
Senior trancheand effective no.
of positions >6
Effective no. ofpositions >6 and
junior trancheEffective no.
of positions <6 Senior tranche Junior tranche
1 AAA 7% 12% 20% 20% 30%
2 AA+, AA, AA- 8% 15% 25% 25% 40%
3 A+ 10% 18% 35% 35% 50%
4 A 12% 20% 35% 40% 65%
5 A- 20% 35% 35% 60% 100%
6 BBB+ 35% 50% 50% 100% 150%
7 BBB 60% 75% 75% 150% 225%
8 BBB- 100% 100% 100% 200% 350%
9 BB+ 250% 250% 250% 300% 500%
10 BB 425% 425% 425% 500% 650%
11 BB- 650% 650% 650% 750% 850%
Other levels and positions whitout a rating 1250% 1250% 1250% 1250% 1250%
While for securitisation positions with short-term external ratings the relationship is as follows:
TABLE 31. RWS OF SECURITISATIONS WITH SHORT-TERM RATING (RBA-IRB APPROACH)
Credit quality levels Long-term ratings
Securitisation positions Resecuritisation positions
Senior trancheand effective no.
of positions >6
Effective no. ofpositions >6 and
junior trancheEffective no.
of positions <6 Senior tranche Junior tranche
1 A-1+, A-1 7% 12% 20% 20% 30%
2 A-2 12% 20% 35% 40% 65%
3 A-3 60% 75% 75% 150% 225%
Other levels and positions whitout a rating 1250% 1250% 1250% 1250% 1250%

2017 Pillar 3 Disclosures
2. CAPITAL
68
The following table shows positions in securitisations with risk transfer and in investment and sponsoring positions on the banking book, based on the approach used to calculate regulatory capital.
TABLE 32. BREAKDOWN OF REPURCHASED POSITIONS IN SSPES WITH RISK TRANSFER, DISTRIBUTED BY FUNCTION AND APPROACH USED
Millions of Euros
31 dec.2017 31 Dec. 2016
On-balancesheet
amount de balance
Off-balancesheet
amount de balance EAD
EAD aftercapital
reductions RWA
On-balancesheet
amoun
Off-balancesheet
amount EAD
EAD aftercapital
reductions RWA
Originator – standardised approach 2,816 – 2,810 2,810 963 958 – 940 940 326
Originator – RBA approach 5,776 – 5,776 5,776 1,019 3,718 – 3,718 3,718 493
Originator – SFA approach 4,907 – 4,907 4,907 708 1,278 – 1,278 1,278 112
Total originator 13,499 – 13,493 13,493 2,690 5,954 – 5,936 5,936 931
Investor – standardised approach 360 – 360 360 233 981 – 981 981 572
Investor – RBA approach 4,264 1,775 6,039 6,039 729 5,113 442 5,555 5,555 705
Total investor 4,624 1,775 6,399 6,399 962 6,095 442 6,536 6,536 1,277
Sponsor – standardised approach – – – – – – – – – –
Sponsor – RBA approach – 40 40 40 26 – 40 40 40 26
Total sponsor – 40 40 40 26 – 40 40 40 26
Total 18,123 1,815 19,933 19,933 3,678 12,049 482 12,512 12,512 2,234
Of which: traditional securitisations 9,547 1,659 11,199 11,199 2,253 10,118 305 10,404 10,404 1,981
Of which: synthetic securitisations 8,577 157 8,733 8,733 1,425 1,931 177 2,108 2,108 253
Total 18,123 1,815 19,933 19,933 3,678 12,049 482 12,512 12,512 2,234
On and off-balance sheet totals before provisions and after outflows to other regulatory reports
EAD IRB (RBA & SFA): exposures net of collateral, before provisions and deductions and after outflows to other regulatory reports
EAD STD: exposures net of collateral, before deductions and after provisions and outflows to other regulatory reports
RWA IRB (RBA & SFA): after provisions, deductions and outflows to other regulatory reports and before application of the limi
RWA STD: after provisions, deductions and outflows to other regulatory reports and before application of the limit
It should be noted that for all securitisations which qualify for a risk weight of 1.250%, the entity has opted to calculate its risk-weighted exposures instead of deducting the exposure amount from equity. Accordingly, the EAD before and after the deductions is the same.
Table 32 shows a 59%% rise in exposure due both to the increase in exposures in securitisations originated by Santander and in investment positions in third parties. In 2017, five new securitisations with risk transfer were originated with the main goal of optimizing capital consumption.

2017 Pillar 3 Disclosures 69
Main summary
Chapter summary
Enhanc. table
List of tables
Meanwhile, securitisation positions in the trading book are eliminated from the regulatory capital calculation based on an internal market risk model and are included in the calculation of capital for specific risk, in accordance with art. 335 of the CRR. The correlation trading portfolio is also included among these positions. This portfolio consists of securitisation positions and nth-to-default derivatives that meet all the criteria stated in art. 338.1 of the CRR. Therefore, none of these positions are taken into consideration in the VaR spread and IRC calculation, although they are included in the interest rate VaR calculation (general risk). Capital requirements for these securitisation positions are calculated as if the positions were in the banking book, distinguishing between:
• Securitisation positions that are rated by an external rating agency, for which capital requirements are calculated using the external-ratings-based approach described above, and,
• Unrated securitisation positions, to which the risk weight resulting from the supervisory formula method is applied.
2.2.2.2.2. Securitisation funds with risk transferSantander Group, as an originator institution, retains positions in the funds with the transfer of risks issued by Group entities. The Group also acquires positions in SSPEs originated by non-Group entities and is the sponsor of one securitisation fund. The following tables contain information on the balances of securitisation positions purchased from third parties and retained in funds originated by Santander Group with risk transfer, both in the banking book and in the trading book.

2017 Pillar 3 Disclosures
2. CAPITAL
70
TABLE 33. AGGREGATE AMOUNT OF SECURITISATION POSITIONS PURCHASED AND RETAINED WITH RISK TRANSFER. BANKING BOOK IRB APPROACH
Millions of Euros
IRB approach.Distribution byexposure typeand risk weight
31 Dec. 2017
EAD RWA
Securitisations Resecuritisations Securitisations Resecuritisations
On-
bala
nce
shee
t ex
posu
res
Off
-bal
ance
shee
t and
deri
vati
veex
posu
res
On-
bala
nce
shee
t ex
posu
res
Off
-bal
ance
shee
t and
deri
vati
veex
posu
res
Tota
l
On-
bala
nce
shee
t ex
posu
res
Off
-bal
ance
shee
t and
deri
vati
veex
posu
res
On-
bala
nce
shee
t ex
posu
res
Off
-bal
ance
shee
t and
deri
vati
veex
posu
res
Tota
l
Investor positions
7-10% 3.618 1.044 – – 4.663 272 77 – – 348
12-18% 415 279 – – 693 73 43 – – 116
20-35% 106 396 5 – 507 35 110 1 – 146
40-75% 120 57 – – 176 74 45 – – 119
1250% 0,03 – – – 0,03 0,43 – – – 0,43
Total 4.259 1.775 5 – 6.039 454 275 1 – 729
Originator positions
7-10% 8.961 – – – 8.961 672 – – – 672
12-18% 835 – – – 835 110 – – – 110
20-35% 511 – – – 511 122 – – – 122
40-75% 233 – – – 233 185 – – – 185
100% 50 – – – 50 53 – – – 53
250% 2 – – – 2 6 – – – 6
425% 3 – – – 3 11 – – – 11
650% - 850% 1 – – – 1 4 – – – 4
1250% 89 – – – 89 562 – – – 562
Total 10.683 – – – 10.683 1.727 – – – 1.727
Sponsor positions
40-75% – – – 40 40 – – – 25 25
300% – – – 0 0 – – – 1 1
Total – – – 40 40 – – – 26 26
Total IRB approach 14.942 1.775 5 40 16.763 2.180 275 1 26 2.482
EAD IRB: exposures net of collateral, before provisions and deductions and after outflows to other regulatory reports
RWA IRB: after provisions, deductions and outflows to other regulatory reports and before application of the limit
With the IRB approach, more than 80% of the exposures have a risk weight lower than 10%, which is similar to previous year.
This portfolio distribution reflects the good quality of the investments made by Santander Group.

2017 Pillar 3 Disclosures 71
Main summary
Chapter summary
Enhanc. table
List of tables
TABLE 34. AGGREGATE AMOUNT OF SECURITISATION POSITIONS PURCHASED AND RETAINED WITH RISK TRANSFER. INVESTMENT PORTFOLIO STANDARDISED APPROACH
Millions of Euros
Standardisedapproach.Distribution byexposure typeand risk weight
31 Dec. 2017
EAD RWA
Securitisations Resecuritisations Securitisations ResecuritisationsO
n-ba
lanc
esh
eet
expo
sure
s
Off
-bal
ance
shee
t and
deri
vati
veex
posu
res
On-
bala
nce
shee
t ex
posu
res
Off
-bal
ance
shee
t and
deri
vati
veex
posu
res
Tota
l
On-
bala
nce
shee
t ex
posu
res
Off
-bal
ance
shee
t and
deri
vati
veex
posu
res
On-
bala
nce
shee
t ex
posu
res
Off
-bal
ance
shee
t and
deri
vati
veex
posu
res
Tota
l
Investor positions
40-75% 254 – – – 254 127 – – – 127
100% 106 – – – 106 106 – – – 106
1250% – – – – – – – – – –
Total 360 – – – 360 233 – – – 233
Originator positions
20-35% 2.614 – – – 2.614 523 – – – 523
40-75% 105 – – – 105 53 – – – 53
100% 60 – – – 60 60 – – – 60
350% 5 – – – 5 18 – – – 18
1250% 25 – – – 25 309 – – – 309
Total 2.810 – – – 2.810 963 – – – 963
Total STD approach 3.170 – – – 3.170 1.196 – – – 1.196
EAD STD: exposures net of collateral, before deductions and after provisions and outflows to other regulatory reports
RWA STD: after provisions, deductions and outflows to other regulatory reports and before application of the limit
Note: under the standardised approach, the investment positions with no rating, which use capital based on the average RW of the underlying asset multiplied by the concentration coefficient, are kept in the balance sheet
Within the standardised approach, we can see that 82% of the exposures have a risk weight equal or less than 35% (rating between AAA and AA-), which is a considerable increase in comparison with 2016 data and, once again, reflects the good quality of the investments made by Santander Group.

2017 Pillar 3 Disclosures
2. CAPITAL
72
TABLE 35. AGGREGATE AMOUNT OF SECURITISATION POSITIONS PURCHASED AND RETAINED. TRADING BOOK
Millions of Euros
ABS PORTFOLIO
31 Dec. 2017
Investor positions Originator positions Sponsor positions
Mark to market RWA
Mark to market RWA
Mark to market RWARBA approach
20-35% 93 22 4 1 – –
100% 0 0 – – – –
TOTAL ABS PORTFOLIO 93 22 4 1 – –
CORRELATION PORTFOLIO
RBA approach
100% – – – – – –
Supervisory formula method
FS – – – – – –
TOTAL CORRELATION PORTFOLIO – – – – – –
Total 93 22 4 1 – –
Note: the table does not include the RWA of short position correlation, since it does not consume capital.
In the trading portfolio, more than 99% of the Mark to Market have risk weight equal or less than 35% (rating above A-).
The following table gives a breakdown of the securitisation positions purchased or retained by securitised asset class and the Bank’s role in the securitisation.

2017 Pillar 3 Disclosures 73
Main summary
Chapter summary
Enhanc. table
List of tables
TABLE 36. SECURITISATION POSITIONS PURCHASED AND RETAINED WITH RISK TRANSFER BY EXPOSURE TYPE IN THE BANKING BOOK
Millions of Euros
31 Dec. 20 17 31 Dec. 2016
Exposure RWA Exposure RWAO
rigi
nato
r
Inve
stor
Spon
sor
Ori
gina
tor
Inve
stor
Spon
sor
Ori
gina
tor
Inve
stor
Spon
sor
Ori
gina
tor
Inve
stor
Spon
sor
Traditional securitisations 5,086 6,069 – 1,338 887 – 4,140 6,222 – 712 1,235 –
Residential mortgages 27 4,066 – 49 440 – 61 1,667 – 21 181 –
Commercial mortgages – – – – – – – – – – – –
Credit cards – 117 – – 12 – – 400 – – 90 –
Leasing – 38 – – 3 – – 97 – – 40 –
Loans to corporates or to SMEs treated as corporates – 1,008 – – 285 – – 3,262 – – 773 –
Consumer loans 5,058 411 – 1,290 44 – 4,079 185 – 691 17 –
Mortgage covered bonds – – – – – – – 93 – – 47 –
Securitisation positions – 54 – – 20 – – 61 – – 23 –
Others – 374 – – 82 – – 457 – – 64 –
Resecuritisations – 5 40 – 1 26 – 20 40 – 8 26
Securitisation positions – 5 40 – 1 26 – 20 40 – 8 26
Synthetic securitisations 8,408 326 – 1,351 74 – 1,814 294 – 219 34 –
Loans to corporates or to SMEs treated as corporates 2,717 – – 487 – – 1,278 – – 112 – –
Consumer loans 3,688 – – 555 – – 536 – – 107 – –
Others 2,003 326 – 309 74 – – 294 – – 34 –
Total 13,493 6,399 40 2,690 962 26 5,954 6,536 40 931 1,277 26
The table shows that more than 99% of the retained positions are in securitisations (not resecuritisations). In comparison with the previous year, the increase in originated positions is outstanding.
This increase is mainly due to five new securitisations with risk transfer originated in 2017 (three synthetic and two traditional).
Turning to originated securitisations with risk transfer, the following table shows the current situation of the underlying portfolio and the changes compared to 2016.
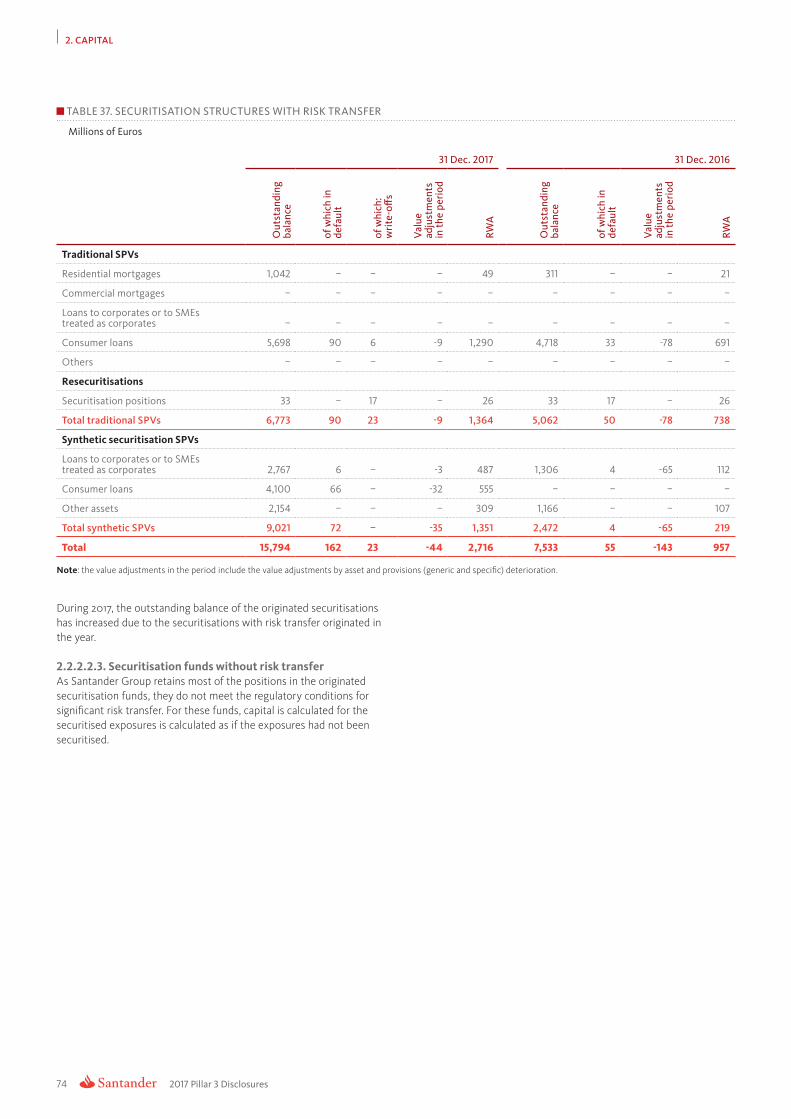
2017 Pillar 3 Disclosures
2. CAPITAL
74
TABLE 37. SECURITISATION STRUCTURES WITH RISK TRANSFER
Millions of Euros
31 Dec. 2017 31 Dec. 2016
Out
stan
ding
ba
lanc
e
of w
hich
in
defa
ult
of w
hich
: w
rite
-off
s
Val
ue
adju
stm
ents
in
the
peri
od
RWA
Out
stan
ding
ba
lanc
e
of w
hich
in
defa
ult
Val
ue
adju
stm
ents
in
the
peri
od
RWA
Traditional SPVs
Residential mortgages 1,042 – – – 49 311 – – 21
Commercial mortgages – – – – – – – – –
Loans to corporates or to SMEs treated as corporates – – – – – – – – –
Consumer loans 5,698 90 6 -9 1,290 4,718 33 -78 691
Others – – – – – – – – –
Resecuritisations
Securitisation positions 33 – 17 – 26 33 17 – 26
Total traditional SPVs 6,773 90 23 -9 1,364 5,062 50 -78 738
Synthetic securitisation SPVs
Loans to corporates or to SMEstreated as corporates 2,767 6 – -3 487 1,306 4 -65 112
Consumer loans 4,100 66 – -32 555 – – – –
Other assets 2,154 – – – 309 1,166 – – 107
Total synthetic SPVs 9,021 72 – -35 1,351 2,472 4 -65 219
Total 15,794 162 23 -44 2,716 7,533 55 -143 957
Note: the value adjustments in the period include the value adjustments by asset and provisions (generic and specific) deterioration.
During 2017, the outstanding balance of the originated securitisations has increased due to the securitisations with risk transfer originated in the year.
2.2.2.2.3. Securitisation funds without risk transferAs Santander Group retains most of the positions in the originated securitisation funds, they do not meet the regulatory conditions for significant risk transfer. For these funds, capital is calculated for the securitised exposures is calculated as if the exposures had not been securitised.

2017 Pillar 3 Disclosures 75
Main summary
Chapter summary
Enhanc. table
List of tables
The following table gives a breakdown, by type of underlying asset, of the outstanding balance of the securitised exposures in funds without risk transfer as of 31 December 2017:
TABLE 38. SECURITISATION STRUCTURES WITHOUT RISK TRANSFER
Millions of Euros
Fondos de titulización tradicionales
2017 2016
Outstanding balance Outstanding balanceTr
adit
iona
lse
curi
tisa
tion
s
Revo
lvin
gst
ruct
ures
Rese
curi
tisa
tion
s
Synt
heti
cse
curi
tisa
tion
s
Trad
itio
nal
secu
riti
sati
ons
Revo
lvin
gst
ruct
ures
Rese
curi
tisa
tion
s
Synt
heti
cse
curi
tisa
tion
s
Residential mortgages 39.157 – – – 45.622 – 21 383
Commercial mortgages 42 – – – – – – –
Credit cards 955 – – –
Finance leases 2.833 – – – 1.184 – – –
Loans to corporates or to SMEs treated as corporates 3.027 – – – 5.642 – – –
Consumer loans 41.394 – – – 40.212 – 242 –
Mortgage covered bonds – – – – 125 – – –
Receivables 1.111 1.111 – – 927 927 – –
Securitisation positions – – – – – – – 927
Others – – – – – – – –
TOTAL 88.519 1.111 – – 93.711 927 263 1.310
The underlying securitised assets in the SPVs originated by Santander Group continue to be comprised of residential mortgages and consumer loans. As observable in the previous table, the securitisation exposure with no risk transfer suffers a slight reduction with regard to 2016.
2.2.2.3. Market riskThis section provides more detailed information on changes in capital requirements for market risk through both internal and standardised models. The Group’s consumption of regulatory capital for market risk at the end of December 2017 breaks down as follows:
TABLE 39. REGULATORY CAPITAL REQUIREMENTS FOR MARKET RISK
Millions of Euros
31 Dec. 2017 31 Dec. 2016
Position risk - Trading book* - Standardised approach 331 310
Commodity Risk - Standardised approach 17 30
Specific risk in the correlation trading risk portfolio – 3
Currency risk - standardised approach 428 606
Position and currency risk - Trading book - Internal models 1,157 1,137
Spain* 563 611
UK 293 291
Chile 113 80
Portugal 0 0
Mexico 187 155
TOTAL 1,933 2,086
*Includes structural equity considered as business

2017 Pillar 3 Disclosures
2. CAPITAL
76
At year-end 2017 Grupo Santander had authorisation from the Bank of Spain for the use of the internal market risk model for the calculation of regulatory capital in the trading books of the units in Spain, Chile, Mexico and Portugal. The Group aims to gradually extend this approval to the rest of the units.
Consolidated regulatory capital under the internal market risk model for Grupo Santander is computed by summing the regulatory capital of the units that have the necessary approval from Bank of Spain. This is a conservative criterion when consolidating the Group’s capital, as it takes no account of the capital savings arising from the geographical diversification effect
As a result of this approval, regulatory capital of the trading activity for the perimeter concerned is calculated with advanced approaches, using VaR, Stressed VaR and IRC (incremental risk charge) as the fundamental metrics, in line with the new bank capital requirements under the Basel Accords and, specifically, the CRR.
The Group works closely with the Bank of Spain to extend the perimeter of authorisation of internal models (at geographical and operational level) and to analyse the impact of new requirements, in line with the documents published by the Basel Committee to strengthen the capital of financial institutions.
A breakdown of capital requirements in the units that use the internal model is shown below, by geography and component, at year-end:
TABLE 40. CAPITAL REQUIREMENTS FOR MARKET RISK. INTERNAL MODEL
Millions of Euros
31 Dec. 2017
CR (VaR) CR (SVaR) IRCRisk Not
in VaR Add-on TOTAL
Spain * 78 349 137 – – 563
United Kingdom** 34 196 – 7 56 293
Chile 35 77 2 – – 113
Portugal 0 0 – – – 0
Mexico 64 114 9 – – 187
TOTAL 211 736 147 7 56 1,157
* Includes Banesto and structural equity considered as business.
** UK counts with internal model approval since the last quarter of 2016.

2017 Pillar 3 Disclosures 77
Main summary
Chapter summary
Enhanc. table
List of tables
Changes in capital requirements and RWAs for market risk using approved internal models from 2016 to 2017 are shown below.
TABLE 41. MARKET RISK UNDER IMA APPROACH (MR2-A)
Millions of Euros
31 Dec. 2017
RWACapital
requirements
VaR (higher of values a and b) 2,869 230
Previous day’s VaR (Article 365(1) of the CRR (VaRt-1)) 711 57
Average of the daily VaR (Article 365(1)) of the CRR on each of the preceding 60 business days (VaRavg) x multiplication factor (mc) in accordance with Article 366 of the CRR 2,869 230
SVaR (higher of values a and b) 9,517 761
Latest SVaR (Article 365(2) of the CRR (SVaRt-1)) 2,183 175
Average of the SVaR (Article 365(2) of the CRR) during the preceding 60 business days (SVaRavg) x multiplication factor (ms) (Article 366 of the CRR) 9,517 761
IRC (higher of values a and b) 2,073 166
Most recent IRC value (incremental default and migration risks calculated in accordance with Article 370 and Article 371 of the CRR) 1,546 124
Average of the IRC number over the preceding 12 weeks 2,073 166
Comprehensive risk measure (higher of values a, b and c) – –
Most recent risk number for the correlation trading portfolio (Article 377 of the CRR) – –
Average of the risk number for the correlation trading portfolio over the preceding 12 weeks – –
8% of the own funds requirement in the standardised approach on the most recent risk number for the correlation trading portfolio (Article 338(4) of the CRR) – –
Other – –
Total 14,459 1,157
TABLE 42. RWA FLOW STATEMENTS OF MARKET RISK EXPOSURES UNDER IMA (MR2-B)
Millions of Euros31 Dec. 2017
VaRStressed
VaR IRCComprehensive
risk measure OtherTotal
RWAsTotal capital
requirements
RWAs Dec. 2016 2,370 6,751 4,259 – 835 14,215 1,137
Regulatory adjustment – – – – – – –
RWAs at the previous year (end of the day) 2,370 6,751 4,259 – 835 14,215 1,137
Movement in risk levels 265 2,445 –2,421 – –45 244 20
Model updates/changes – – – – – – –
Methodology and policy – – – – – – –
Acquisitions and disposals – – – – – – –
Foreign exchange movements – – – – – – –
Other – – – – – – –
RWAs at the end of the reporting period (end of the day) 2,635 9,196 1,838 – 790 14,459 1,157
Regulatory adjustment – – – – – – –
RWAs Dec. 2017 2,635 9,196 1,838 – 790 14,459 1,157
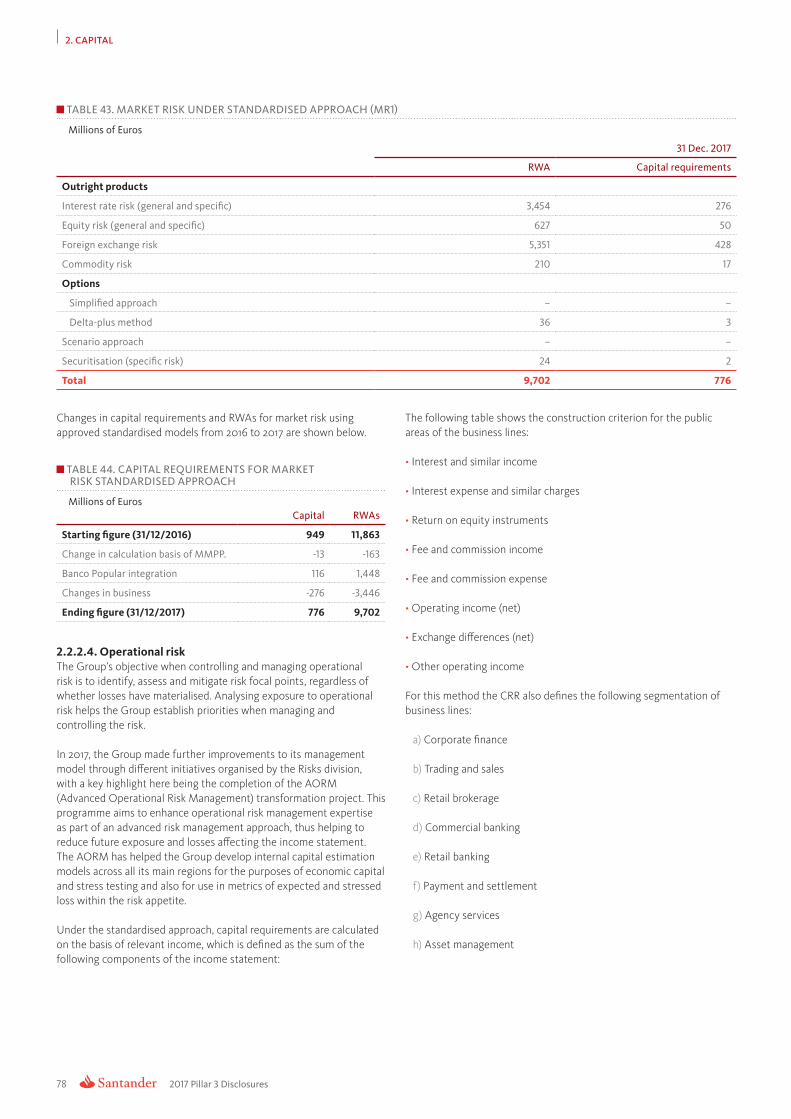
2017 Pillar 3 Disclosures
2. CAPITAL
78
TABLE 43. MARKET RISK UNDER STANDARDISED APPROACH (MR1)
Millions of Euros
31 Dec. 2017
RWA Capital requirements
Outright products
Interest rate risk (general and specific) 3,454 276
Equity risk (general and specific) 627 50
Foreign exchange risk 5,351 428
Commodity risk 210 17
Options
Simplified approach – –
Delta-plus method 36 3
Scenario approach – –
Securitisation (specific risk) 24 2
Total 9,702 776
Changes in capital requirements and RWAs for market risk using approved standardised models from 2016 to 2017 are shown below.
TABLE 44. CAPITAL REQUIREMENTS FOR MARKET RISK STANDARDISED APPROACH
Millions of EurosCapital RWAs
Starting figure (31/12/2016) 949 11,863
Change in calculation basis of MMPP. -13 -163
Banco Popular integration 116 1,448
Changes in business -276 -3,446
Ending figure (31/12/2017) 776 9,702
2.2.2.4. Operational riskThe Group’s objective when controlling and managing operational risk is to identify, assess and mitigate risk focal points, regardless of whether losses have materialised. Analysing exposure to operational risk helps the Group establish priorities when managing and controlling the risk.
In 2017, the Group made further improvements to its management model through different initiatives organised by the Risks division, with a key highlight here being the completion of the AORM (Advanced Operational Risk Management) transformation project. This programme aims to enhance operational risk management expertise as part of an advanced risk management approach, thus helping to reduce future exposure and losses affecting the income statement. The AORM has helped the Group develop internal capital estimation models across all its main regions for the purposes of economic capital and stress testing and also for use in metrics of expected and stressed loss within the risk appetite.
Under the standardised approach, capital requirements are calculated on the basis of relevant income, which is defined as the sum of the following components of the income statement:
The following table shows the construction criterion for the public areas of the business lines:
• Interest and similar income
• Interest expense and similar charges
• Return on equity instruments
• Fee and commission income
• Fee and commission expense
• Operating income (net)
• Exchange differences (net)
• Other operating income
For this method the CRR also defines the following segmentation of business lines:
a) Corporate finance
b) Trading and sales
c) Retail brokerage
d) Commercial banking
e) Retail banking
f) Payment and settlement
g) Agency services
h) Asset management

2017 Pillar 3 Disclosures 79
Main summary
Chapter summary
Enhanc. table
List of tables
Relevant incomeUnder the standardised approach, capital requirements are calculated as the simple average over the last three years of the summation, for each year, of the greater of zero and the sum of relevant income across each of the business lines, multiplied by the weight assigned to each business line.
The mathematical expression of these requirements will be as follows:
Where:
RI1-8 = Relevant income of each business line, with the appropriate sign, in accordance with the CRR
ß1-8 = Weight applicable to each business line, in accordance with the CRR
Obtaining data on relevant income, allocating it to the various business lines and calculating capital requirements is the responsibility of Financial Accounting and Control.
Santander Group obtains the figure for relevant income from the consolidated management information by business line. This information is generated from accounting data, the quality of which is assured by the SOX procedure, “Income statements and balance sheet preparation by business area”.
Consolidated management information is published quarterly in aggregate form and is the basis on which the businesses’ budgetary compliance is measured. It is prepared by the Management Control department, which regulates the business lines of all the Group’s units based on certain corporate criteria, which all units must apply when drawing up their management information.
a) Primary or geographical level:
a) Continental Europe: all retail and commercial banking businesses and Santander Global Corporate. Includes Spain, Santander Consumer Finance, Poland, Portugal and Asia.
b) UK
c) Latin America: all the Group’s activities through subsidiary banks and companies. Includes Chile, Uruguay, Peru, Mexico, Colombia, Argentina, Brazil and Paraguay.
d) United States
b) Secondary or business level: the activity of each operating unit is segmented by type of business, with segment reporting:
a) Retail and Commercial Banking: contains the customer banking businesses (except corporate banking, which are managed through global relationship models). In Latin America, Retail and Commercial banking includes financial management.
b) Global Banking & Markets: includes the Global Corporate Banking businesses; the Investment Banking and Markets businesses worldwide, including all treasury departments that have global management responsibilities for trading and distribution to customers; and the equities business.
In addition to the operating businesses, the Financial Management area includes the businesses of the financial and industrial holdings, the financial management of the parent company’s currency and interest rate risk structural position, and the management of liquidity and capital through issues and securitisations.
The following table shows the construction criterion for the public areas of the business lines:
Primary level - geographical criterion
Secondary level - Businness criterion
Financial Management
and Corporate InvestmentGlobal Banking and Markets
Commercial Banking
Commercial Banking
Commercial Banking
Commercial Banking
ContinentalEurope UK Latam USA
As a supplement to the Management Control area’s aggregated business unit-level information, Santander Group uses business area information broken down by segment, product, etc. to distribute relevant income among the business lines defined by the CRR.
Any difference between the total figure of relevant income and the Group’s published consolidated information is allocated to the business line with the highest regulatory capital consumption.
The following chart shows the distribution of capital by business line as of 31 December 2017.
70.4%
20%
3.75%0.59%
1.86% 2.80% 0.35% 0.24%
CAPITAL DISTRIBUTION BY BUSINESS LINE
%
Ret
ail B
anki
ng
Com
mer
cial
Ban
king
Trad
ing
and
sale
s
Bus
ines
s fin
anci
ng
Paym
ent a
nd
sett
lem
ent
Ass
et m
anag
emen
t
Age
ncy
serv
ices
Ret
ail m
edia
tion

2017 Pillar 3 Disclosures
2. CAPITAL
80
Shown below is the geographical distribution of capital for operational risk:
13%
15%
18%24%
4%
4%
14%
8%
GEOGRAPHICAL DISTRIBUTION OF CAPITAL FOR OPERATIONAL RISK
Brazil Rest of Latam USA Spain Portugal Poland UK Rest of Europe
TABLE 45. CHANGES IN CAPITAL REQUIREMENTS FOR OPERATIONAL RISK
Millions of Euros
Capital RWAs
Starting figure (31/12/2016) 4,887 61,084
Application of the ASA approach in Mexico -145 -1,810
Sale of the Allfunds company -8 -96
Management companies by global method 63 783
Incorporation Popular Spain 376 4,698
Incorporation Popular Portugal 25 314
Exchange rate effect -328 -4,102
Change in business 28 346
Ending figure (31/12/2017) 4,897 61,217
The standardised approach imposes higher capital requirements for financial institutions operating in jurisdictions with high net interest margins, which are often linked to a high sovereign credit spread but not necessarily with increased operational risk. To avoid this undesired effect, EU legislation (Regulation 575/2013/EU) provides for the use of the alternative standardised approach by businesses that meet certain conditions, subject to approval by the European Central Bank. This method uses a normalised indicator which is calculated by multiplying certain balances by 3.5% and thereby providing an average which is more in line with the bank's operational risk.
On 3 February 2016, the European Central Bank issued authorisation for the Alternative Standardised Approach to be used to calculate consolidated capital requirements for operational risk at Banco Santander Brasil SA.
Similarly, on 12 July 2017, the European Central Bank issued authorisation for the Alternative Standardised Approach to be used to calculate consolidated capital requirements for operational risk at Banco Santander México SA.
2.2.3. Leverage ratioBasel III established the leverage ratio as a non-risk-sensitive measure designed to limit the excessive growth of the balance sheet relative to available capital.
The ratio is calculated as the coefficient between Tier 1 divided by the leverage exposure. This exposure is calculated as the sum of the following components:
• Asset value, without derivatives and without elements considered as deductions in Tier 1 (for example, the loan balance is included but not goodwill).
• Off balance sheet accounts (primarily, guarantees, undrawn credit limits, letters of credit) weighted by the conversion factors of the standard credit risk method.
• Inclusion of the net value of derivatives (gains and losses against a single counterparty are netted, minus collateral - provided certain criteria are met) plus a surcharge for potential future exposure.
• A surcharge for the potential risk of security financing transactions.
• Finally, a surcharge is included for the risk of credit derivatives (CDS) in the unhedged part.
The following tables illustrate the ratios published by the Group since December 2016. They show that the bank's ratio is stable, and with an upward trend.
* Including the capital increase completed on 27 July 2017.
PHASED IN AND FULLY LOADED LEVERAGE RATIO
Dec. 16 Jun. 17*Mar. 17
5.4%5.3%
5.2%5.3%
5.0%5.0%5.0%5.0%5.0%
5.3%
Sep. 17 Dec. 17
Leverage ratio fully loaded
Leverage ratio phase in
BCBS revised the definition of the leverage ratio in 2017. In particular, a series of technical adjustments were made to the method for calculating total exposure (the denominator of the leverage ratio), mainly relating to exposure to derivatives and the treatment of off-balance sheet exposure.

2017 Pillar 3 Disclosures 81
Main summary
Chapter summary
Enhanc. table
List of tables
The final calibration of the leverage ratio was set at 3% for all institutions, while G-SIBs are subject to an additional surcharge of 50% of the G-SIB buffer (which depends on which systemic importance bucket the bank falls into).
Banks must implement the final definition of the leverage ratio and comply with the new calibration of the ratio (the additional surcharge for G-SIBs) from January 2022.
The Group’s leverage ratio as of 31 December 2017 was as follows:
TABLE 46. LEVERAGE RATIO
Millions of Euros31 Dec. 2017
Fully loaded Phased in
Tier 1 capital (phased-in) 73,293 77,283
Exposure 1,460,977 1,463,090
Leverage ratio 5.02% 5.28%
The following table gives a breakdown of the calculation of the ratio:
TABLE 47. LEVERAGE RATIO DETAILS
Millions of Euros
31 Dec. 2017
Item
AmountsConsol.
Balance SheetTo be
eliminatedTo be
includedLeverageexposure Comment
Derivatives 65.836 65.836 25.578 25.578 Replace book value with EAD
Securities financing transactions 51.418 3.784 55.201 A surcharge is added to this operations
Assets deducted in Tier 1 31.566 31.566 – Eliminated to avoid duplication
Rest of Assets 1.282.586 1.282.586 Fully included
Total Assets 1.431.406 97.402 29.362 1.363.365
Total Off-Balance-Sheet items 291.943 192.218 99.725Balances are weighted according to their risk
Total Exposure (denominator) 1.463.090
Tier 1 (numerator) 77.283
Levereage ratio 5.3% Minimum recommended 3%
The leverage ratio is calculated by the Group every month and presented to the Capital Committee and other governance bodies, thus ensuring adequate monitoring of the risk of excessive leverage at its most restrictive measurement: fully loaded. In addition, estimations are made of the leverage ratio at a three year time horizon under different macroeconomic scenarios, including scenarios of recession.
No significant change occurred in the ratio in 2017. The Tier 1 ratio increased slightly, growing in line with the leverage exposure, attributable to the increase in business and to exchange rate movements.
LRSum, LRCom, LRSpl and LRQua tables can be found on the Appendix IX, in the 2017 Pillar 3 Appendices file available on the Santander Group website.
For further details, access file 2017 Pillar 3 Appendices available on the Santander Group website.

2017 Pillar 3 Disclosures
2. CAPITAL
82
2.3. Pillar 2 - Economic capitalEconomic capital is the capital needed to support all business risks with a certain level of capital adequacy. It is sized according to an internal model. In our case the capital adequacy level is determined by our long-term rating target of ‘A’ (two notches above Spain’s rating), which means applying a confidence level of 99.95% (above the regulatory 99.90%) when calculating the necessary capital.
Santander’s economic capital model includes in its measurement all the significant risks incurred by the Group in its operations (concentration risk, structural interest risk, business risk, pensions risk and other risks beyond the sphere of Pillar 1 regulatory capital). Economic capital also incorporates the diversification effect which, in the case of Santander Group, due to its multinational nature and multi-business structure, is key when determining and properly understanding the risk and solvency profile of a multinational group like Santander Group.
Santander Group's business is carried on in multiple countries by means of a structure of legally distinct entities, with a variety of customer and product segments and exposure to different kinds of risk. This means that Santander Group's performance is less vulnerable to adverse situations in any of the specific markets, portfolios, customers or risks. Although economies are now highly globalised, economic cycles are not identical, nor are they as intense, in the different geographies. Groups with a global presence therefore benefit from steadier performance and greater robustness facing downturns in specific markets or portfolios, and this translates into lower risk. Hence the risk and the related economic capital which Santander Group sustains as a whole are less than the risk and capital of the sum of all the separate parts.
Meanwhile, and in contrast to regulatory criteria, Santander Group believes that certain intangible assets -such as deferred tax assets, goodwill and software- retain their value even in the hypothetical event of a resolution, given the geographical structure of Santander Group’s subsidiaries. As such, these assets are measured and their unexpected loss estimated as part of capital.
Economic capital is a key tool for the internal management and development of the Group’s strategy, both from the standpoint of assessing capital adequacy, as well as risk management of portfolios and businesses.
From the capital adequacy standpoint, the Group uses, in the context of Basel Pillar 2, its economic model for the capital adequacy self-assessment process (ICAAP). For this, the business development and capital needs are planned under a central scenario and alternative stress scenarios. The Group is assured in this planning of maintaining its capital adequacy targets even in adverse scenarios.
Economic capital metrics also enable risk-return objectives to be assessed, setting the prices of operations on the basis of risk, evaluating the economic viability of projects, units and lines of business, with the overriding objective of maximising the generation of shareholder value.
As a homogeneous measurement of risk, economic capital can be used to explain the risk distribution throughout the Group, putting in a metric comparable activities and different types of risk.
The economic capital requirement at December 2017 was 72,144 million euros, which means that available economic capital of 99,080 million euros contains a capital surplus of 26,936 million euros.
The table below sets out the available economic capital.
TABLE 48. AVAILABLE ECONOMIC CAPITAL
Millions of Euros31 Dec. 2017 31 Dec. 2016
Net capital and issue premium 59,098 52,196
Reserves and Retained earnings 55,862 52,967
Valuation adjustments (23,108) (16,116)
Minority interests 7,228 6,784
AVAILABLE ECONOMIC CAPITAL 99,080 95,831
Economic Capital required 72,144 72,632
Capital surplus 26,936 23,199
The main difference with respect to regulatory CET1 comes from the treatment of the goodwill, other intangible assets and DTAs, which we consider as another capital requirement instead of a deduction of available capital.
The distribution of economic capital needs by type of risk at December 2017 is as follows:
DISTRIBUTION OF ECONOMIC CAPITAL NEEDS
Dec. 2017
Market ALM interest Operational Business Material Assets Others Credit Goodwill
9%
39%
27% 4%4%4%
4%
9%
The table below sets out Santander Group’s distribution of economic capital needs by region and within each region by risk type, as of 31 December 2017.

2017 Pillar 3 Disclosures 83
Main summary
Chapter summary
Enhanc. table
List of tables
Santander GroupTotal requirements:
72,144
Corporate centre24,754
Total risks:
Goodwill: 77% Market: 12% DTAs: 10% Other: 1%
Continental Europe23,300
Total risks:
Credit: 55% Market: 13% Interest: 8% Operational: 8% Other: 16%
UK6,777
Total risks:
Credit: 58% Structural (pensions): 20% Operational: 8% Business: 6% Other: 8%
Latin America10,997
Total risks:
Credit: 66% Business: 10% Operational: 7% Interest: 6% Other: 11%
USA6,317
Total risks:
Credit: 60% Material asset: 10% Operational: 8% Intangible assets: 6% Business: 6% Other: 10%
Figures in Millions of Euros
DISTRIBUTION OF ECONOMIC CAPITAL NEEDS BY REGION
Distribution of economic capital among the main business areas reflects the diversified nature of the activity and risk of Santander Group. Continental Europe represents 49% of capital, Latin America (including Brazil) represents 23%, UK represents 14% and USA represents 13%.
Outside the operating areas, the corporate center assumes, mainly, the goodwill risk and risks related to structural exchange rate risk (risk related to holding of shares of subsidiaries abroad denominated in currencies other than euro).
The diversification benefit provided by the economic capital model, including both intra-risk (similar to geographic) and inter-risk diversification, amounts to approximately 30%.
2.3.1. RoRAC and value creationSantander Group has been using RoRAC methodology as part of its credit risk management process since 1993 in order to:
• Calculate the consumption of economic capital and the return on it at the Group’s business units, as well as segments, portfolios and customers, in order to facilitate the optimal assignment of economic capital.
• Measure the management of the Group’s units via budgetary monitoring of capital consumption and RoRAC.
• Analyse and fix prices in the decision-taking process for operations (admission) and customers (monitoring).
RoRAC methodology enables one to compare, on a like-for-like basis, the return on operations, customers, portfolios and businesses, identifying those that obtain a risk-adjusted return higher than the cost of the Group’s capital and aligning risk and business management in a bid to maximise value creation; the ultimate aim of the Group’s senior management.
The Group regularly assesses the level and performance of value creation (VC) and the risk-adjusted return (RoRAC) of its main business units. VC is the profit generated above the cost of the economic capital (EC) employed, and is calculated as follows:
VC = recurring profit – (average EC x cost of capital)
The profit used in this calculation is obtained by making the necessary adjustments to accounting profit so as to extract only the recurring profit that each unit generates in the relevant year of business.
The minimum return on capital that an operation must attain is determined by the cost of capital, which is the minimum required by shareholders. It is calculated objectively by adding the premium that shareholders demand for investing in the Group to the risk-free return. This premium depends essentially on the degree of volatility in the price of the Banco Santander share in relation to the market’s performance. The cost of capital in 2017 was 8.60% (versus 9.37% in 2016).
As well as reviewing every year the cost of the Group’s capital for the purposes of internal management, the cost of capital for each business unit is also estimated, taking into account the specific features of each market and on the assumption that all subsidiaries are autonomous when it comes to capital and liquidity. The aim here is to assess whether each business is capable of generating value individually.
While a positive return from an operation or portfolio means it is contributing to the Group’s profits, it is only creating shareholder value when that return exceeds the cost of capital.

2017 Pillar 3 Disclosures
2. CAPITAL
84
Value creation and RoRAC for the Group’s main business areas are as follows:
TABLE 49. RoRAC AND VALUE CREATION
Millions of Euros
31 Dec. 2017 31 Dec. 2016
Main segments RoRACValue
creation RoRACValue
creation
Continental Europe 19.7% 2,110 17.3% 1,426
UK 19.3% 764 20.2% 825
Latin America 41.8% 4,049 33.1% 2,879
US 8.9% 22 9.2% -13
Total businessUnits 23.9% 6,946 20.7% 5,117
2.3.2. Capital planning and stress testsStress tests on capital have assumed particular importance as a tool for dynamic assessment of the risks and capital adequacy of banks.
It is a forward-looking assessment, based on macroeconomic and idiosyncratic scenarios that are unlikely to materialise but are still plausible. To that end, it is necessary to have robust planning models, capable of transferring the impact defined in projected scenarios to the different elements that influence a bank’s capital adequacy.
The ultimate objective of the stress exercises is to carry out a full assessment of the risks and capital adequacy of banks, which enables possible capital requirements to be calculated in the event that they are needed because of banks’ failure to meet the capital objectives set, both regulatory and internally.
Internally, Santander Group has defined a process of capital stress and planning, not only to respond to the various regulatory exercises, but also as a key tool of the Bank’s management and strategy.
The goal of the internal stress and capital planning process is to ensure sufficient current and future capital, even in the event of adverse though plausible economic scenarios. Based on the Group’s initial situation (defined by its financial statements, capital base, risk parameters and regulatory ratios), the results are estimated for different business environments (including severe recessions as well as “normal” macroeconomic situations), and the Group’s capital adequacy ratios are obtained, generally for over a three-year period.
This process provides a comprehensive view of the Group for the time frame analysed and in each of the scenarios defined. It incorporates the metrics of regulatory capital, economic capital and available capital.
The structure of the process is shown below:
Macroeconomic scenarios Central and of recession Idiosyncratic: based on specific risks Multiyear time frame
Projection of volumes. Business strategy Spreads and cost of funding Commissions and operating costs Market shocks and operational losses Credit losses and provisions. PD and LGD PIT models
Consistent with the projected balance sheet Risk parameters (PD, LGD and EAD)
Capital base available. Profit and dividends Impact of regulations and regulatory requirements Capital and solvency ratios Compliance with capital objectives
In the event of not meeting objectives or regulatory requirements
Projection of the balance sheet and income statement
Projection of capital requirements
Solvency analysis
Action plan
1
2
3
4
5

2017 Pillar 3 Disclosures 85
Main summary
Chapter summary
Enhanc. table
List of tables
This structure helps to achieve the ultimate objective of capital planning by making it an element of strategic importance for the Group that:
• Ensures the capital adequacy of current and future capital, including in adverse economic scenarios.
• Enables comprehensive management of capital and incorporates an analysis of the specific impacts, facilitating their integration into the Group’s strategic planning.
• Enables capital to be used more efficiently.
• Supports the design of the Group’s capital management strategy.
• Facilitates communication with the market and supervisors.
The whole process is closely supervised and carried out with the maximum involvement of the senior management, under a framework that optimises governance and ensures that all component elements are subject to proper scrutiny, review and analysis.
One of the key elements in capital planning and stress analysis exercises, due to their particular importance in forecasting the income statement under defined stress scenarios, consists of calculating the provisions needed under these scenarios, mainly those to cover losses on the credit portfolio. Santander Group uses a methodology that ensures sufficient provisioning at all times to cover all credit losses forecast by its internal models of expected loss, based on the parameters of exposure at default (EAD), probability of default (PD) and loss given default (LGD).
This methodology is widely accepted and is similar to that used in the European Banking Authority’s (EBA) 2016 stress test, its previous exercises in 2011 and 2014, and the stress test of the Spanish banking sector conducted in 2012.
Lastly, the capital planning and stress analysis process culminates with an analysis of capital adequacy under the various scenarios to have been designed, over a defined time frame. The objective here is to assess capital adequacy and ensure the Group fulfils both the capital targets defined internally in addition to all regulatory requirements.
The capital adequacy process is described below:
Initial capital base
Changes in regulations
Final capital base
Dividend policies
Regulatory changes arising from Basel III that may modify both the capital base and the requirements
Stress capital requirements
Final capital requirements
Retained earnings
Changes in regulations
QUANTIFICATION OF CAPITAL ADEQUACY
11
++
+
2
2
2
In the event capital targets are not met, an action plan will be prepared, setting out the measures needed to be able to attain the desired minimum capital. These measures are analysed and quantified as part of the internal exercises, although they do not need to be implemented because Santander exceeds the minimum capital thresholds.
This internal process of capital stress and planning is conducted transversally across the entire Group, not only at consolidated level, but also locally at the Group’s units. These units use the capital stress and planning process as an internal management tool and to meet their local regulatory requirements.
Since the 2008 economic crisis Santander Group has undergone six stress tests, all of which demonstrated its strength and capital adequacy in the most extreme and severe macroeconomic scenarios. All the tests demonstrated that, mainly thanks to the Group’s business model and geographic diversification, Banco Santander would continue to generate profits for its shareholders and comply with the most demanding regulatory requirements.
In the first of these (CEBS 2010), Santander Group was the institution that reported the smallest impact on its capital adequacy ratio, with the exception of those banks that benefited from not distributing a dividend. In the second test, carried out by the EBA in 2011, Santander was not only one of the small group of banks that improved their capital adequacy in the stress scenario, but it also earned the highest profits.
In the stress exercises conducted by Oliver Wyman on Spanish banks in 2012 (top-down and then bottom-up), Banco Santander again showed its strength to face the most extreme economic scenarios with full capital adequacy. It was the only bank that improved its core capital ratio, with a surplus of more than 25,000 million euros over the minimum requirement.
Lastly, in the recent stress test carried out in 2014 by the European Central Bank, in conjunction with the European Banking Authority, Santander Group was the bank with the smallest impact on the adverse scenario among its international peers, with a capital surplus of approximately 20,000 million euros with respect to the minimum requirement.
The 2016 stress test marked a departure from previous tests by not insisting on a minimum level of capital. Instead, the results are to be used as a further input for the Supervisory Review and Evaluation Process (SREP). Santander Group was the bank that destroyed the least capital among its peers. The fully loaded CET1 capital ratio fell by 199 basis points (versus an average of -335 b.p.).
The results of the exercises have shown that Santander Group’s business model, based on retail and commercial banking and geographic diversification, renders it more sturdy when it comes to addressing worst-case international crisis scenarios.
As already mentioned, and in addition to the regulatory stress exercises, Santander Group has been conducting annual internal stress tests since 2008 as part of its capital self-assessment process (Pillar 2). All of these exercises have demonstrated Santander Group’s capacity to overcome the most difficult scenarios, both globally as well as in the main countries in which it operates.

2017 Pillar 3 Disclosures
2. CAPITAL
86
2017 EBA transparency exerciseIn 2017, the European Banking Authority carried out its transparency exercise, publishing information on risk-weighted assets, capital positions, capital adequacy and details of sovereign positions at December 2016 and June 2017, for 132 banks across 25 European countries. The purpose of the exercise was to promote transparency and a greater understanding of the capital positions and capital adequacy of European banks, thereby fostering market discipline and financial stability in the Union. It should be noted that the results do not include the capital increase effected by Santander Group in relation to its acquisition of Banco Popular, although the RWAs of the acquired bank are included. If we factor in the capital increase, the CET1 ratio would be 10.72%. The results demonstrate the comfortable capital position and capital adequacy of Santander Group, which leads its peers in many of the key metrics.
This report has been issued alongside the November 2017 report on European Union banking risks and vulnerabilities. The overall conclusion reached by the report is that banks have become more resilient thanks to the relatively benign macroeconomic and financial climate, improved levels of capital and asset quality and a slight upturn in profits. However, further work is needed when it comes to managing non-performing loans and the long-term sustainability of existing business models remains a challenge. Maintaining a robust technological infrastructure and ensuring operational resilience are also key priorities as we move forward.
2.4. Recovery and resolution plans and special situation response frameworkThis section sets out the main improvements made when it comes to crisis management at the Group, specifically the main developments in relation to viability and resolution plans and the Special Situation Management Framework.
2.4.1. Viability Plans
OverviewThe eighth version of the Corporate Viability Plan was prepared in 2017. The most relevant part of this plan addresses the measures the Bank would be able to rely on in order to fend off an extreme crisis unassisted.
The plan’s two primary objectives are firstly to ascertain the feasibility, effectiveness and credibility of the recovery measures it contains, and secondly to determine the suitability and fitness of the recovery indicators and the respective thresholds which, were they to be breached, would trigger the escalation process when making the right decisions in response to stress situations.
For these purposes, the Corporate Plan envisions different macroeconomic and/or financial crisis scenarios that include Group-relevant idiosyncratic and/or systemic events that could trigger the activation of the plan. The plan was also drawn up on the premise that, once deployed, there would be no extraordinary public financial support, as per Article 5(3) of Directive 2014/59/EU.
It should be noted that the plan is not a stand-alone instrument that bears no relationship with the other structural mechanisms in place to measure, manage and supervise the risk assumed by the Group. In actual fact, the plan includes the following tools, among others: the risk appetite framework (“RAF”), the risk appetite statement (“RAS”), the risk identification assessment process (“RIA”), the business continuity management system (“BCMS”), and the internal capital adequacy assessment process and the internal liquidity adequacy assessment process (“ICAAP” and “ILAAP”, respectively). The plan is also an integral part of the Group’s wider strategic plans.
Performance in 2017 Work continued during the year to improve existing infrastructure and processes, in line with the requirements and expectations of the European supervisor and reflecting best practices in the industry. These improvements include the following: (i) the chapter on “Strategic Analysis” now provides a more thorough and granular analysis of internal and external interdependencies; (ii) the “Governance” chapter now discusses the progress made in conducting stress tests, while also properly defining macroeconomic Early Warning Indicators (EWIs) and political risk for the Group’s main regions, which are regularly monitored at corporate level. It also describes the processes for drawing up, reviewing and approving the Corporate Plan and the Local Plans; (iii) the “Scenarios” chapter now incorporates two Systemic Scenarios (global and local) specifically designed for recovery in that they pursue the objective of breaching the red line for least one recovery indicator, which would potentially trigger the activation of the Corporate Plan. It also includes an analysis of the potential impacts on reputation of the idiosyncratic and systemic-local scenarios; (iv) the chapter on “Measures” now contains a full and more granular viability analysis of each measure, along with the assumptions underpinning the calibration of recovery capacity and the preparatory measures needed to ensure credible and timely execution of the measures.
The main conclusions drawn from the analysis of the 2017 Corporate Plan reveal that:
• There are no material interdependences between the Group’s regions.
• The measures in place guarantee a broad recovery capacity for all the scenarios contemplated in the plan. The Group’s geographic diversification model has proved to be an advantage from the point of view of viability.
• Each subsidiary has sufficient recovery capacity to exit a recovery situation unassisted, which enhances the resilience of the Group’s model based on subsidiaries that are independent in terms of capital and liquidity.
• The failure of any given subsidiary would not be considered sufficiently important to constitute a breach of the worst-case scenarios established for recovery indicators, triggering the deployment of the Corporate Plan.
• The Group has sufficient mitigation mechanisms in place to minimise any negative economic impact that might result from damage to its reputation under various stress scenarios.
It may therefore be inferred that the Group’s model and strategy of geographic diversification, based on a model of subsidiaries that are independent in terms of capital and liquidity, remains suitably resilient from a viability standpoint.

2017 Pillar 3 Disclosures 87
Main summary
Chapter summary
Enhanc. table
List of tables
1 Directive 2014/59/EU (EU Crisis Management Directive); current EBA regulations on recovery plans (EBA/RTS/2014/11, EBA/GL/2014/06 and EBA/GL/2015/02); EBA recommendations to the Commission on key lines of business and critical functions (EBA/op/2015/05); EBA regulation pending approval (EBA/CP/2015/01 on ITS templates for resolution plans); EBA regulation not directly related to recovery, but with significant implications in this field (EBA/GL/2015/03 on triggers for use of early intervention measures); and domestic Spanish regulations: Spanish Law 11/2015, on recovery and resolution of credit entities and investment services companies, and Royal Decree 1012/2015 implementing that Law.
2 FSB Key attributes of effective resolution regimes for financial institutions (15 October 2014, update of the first publication in October 2011), Guidelines on the identification of critical functions and critical shared services (15 July 2013) and Guidance on recovery triggers and stress scenarios (15 July 2013)
3 By way of an exception to the above, resolution plans in the United States are drawn up by the companies individually. In December 2015, Santander Group submitted its third version of local resolution plans, although the FRB and the FDIC announced that plans were not to be submitted for 2016 and 2017, as they were attaching remarks to the previous plans and starting work on guidelines for plans to be submitted in 2018.
4 Except for the two issuers of structured debt that represented 2 bn and 25 bn of total issues at December 2016 through issuer companies.
Regulation and governance The plan has been drawn up in accordance with the regulations applicable in the European Union1. The plan also embraces the non-binding recommendations emanating from international bodies such as the Financial Stability Board (FSB)2.
As with the previous versions, the Group’s new plan was presented to the Single Supervisor in September. From that time, the authority has a formal period of six months in which to send formal feedback on the plan.
The Group’s plan comprises both the Corporate Plan (relating to Banco Santander, S.A.) and the Local Plans for the main regions (United Kingdom, Brazil, Mexico, United States, Germany, Argentina, Chile, Poland and Portugal), which are attached to the Corporate Plan. Please note that in all regions apart from Chile are subject to local regulatory requirements in addition to the corporate requirement to draw up a Local Plan.
The board of directors of Banco Santander S.A. is ultimately responsible for approving the Corporate Plan, although its content and relevant data are first presented and discussed on the Bank’s primary management and control committees (risk supervision committee, regulation and compliance committee, global ALCO committee and capital committee). The Local Plans are also approved by the relevant local bodies, in close coordination at all times with the Group since these plans are attached to the Group’s wider Corporate Plan.
2.4.2. Resolution plansSantander Group continues to work alongside the competent authorities on preparing the resolution plans by supplying all the information required of it.
The competent authorities belonging to the Crisis Management Group (CMG) reached consensus on the strategy to be deployed for the resolution of Santander Group, called the “Multiple Point of Entry (MPE)”3.
This strategy is based on the legal and business structure of Santander Group and is structured into 9 “Resolution Groups”, all of which could be resolved independently without involving the other parts of the Group. This is in line with our model of subsidiaries that are autonomous with regard to capital and liquidity.
This implies that each resolution group should have a minimum level of eligible liabilities issued in the market by the entity identified as a resolution point of entry. The entities belonging to a resolution group which are not points of entry will need to meet an internal MREL requirement, i.e. eligible liabilities purchased by the entity which is the point of entry.
In March 2017, the Single Resolution Board (SRB) notified the Bank of the preferred resolution strategy and of the work priorities to enhance the resolvability of Santander Group.
The Group itself has made further progress on projects to improve resolvability by defining four main lines of action:
1) Ensuring the Group has a sufficient buffer of loss-absorbing instruments.
The Bank issued 13,000 million euros in senior non-preferred debt in 2017, with which absorb losses before any senior debt.
Moreover, and so as to avoid possible legal problems when resorting to a bail-in, all debt issue agreements now include a clause whereby the bond holder recognises that the resolution authority is entitled to effect the bail-in using their instruments.
Last but not least, and once again to avoid any possible legal uncertainty when using the placements for bail-in purposes, the issuer companies have been merged with the parent so as to ensure that the latter effectively becomes the direct issuer from 2018 onward4.
2) Ensuring the Group has reporting systems in place to guarantee rapid delivery of the necessary information in the event of resolution.
In 2017, the Group continued to work on automating its information on the liabilities that could be subject to a bail-in in the event of resolution.
Work is also ongoing to automate the rest of the information to be delivered to the resolution authority for the purpose of drawing up the Resolution Plan.
Both processes are expected to be fully automated in the first quarter of 2018.
Meanwhile, various projects are now under way create information repositories on:
1. Legal entities belong to Santander Group
2. Critical suppliers
3. Critical infrastructure
4. Financial contracts in accordance with article 71.7 of the BRRD
2017 Pillar 3 Disclosures
2. CAPITAL
88
3) Guaranteeing operational continuity in resolution situations
Operational continuity clauses in contracts with internal suppliers have been reinforced and the Group is currently analysing the clauses to include in contracts with external suppliers.
The Group’s main market infrastructures have also been asked to complete a survey to discover their policy should any member of that infrastructure be faced with resolution.
Last but not least, contingency plans are to be drawn up in 2018 to cover any situation whereby one of those infrastructures ceases to provide service to Santander Group in the event of resolution.
4) Fostering a culture of resolvability within the Group
The Group has been working here to increase the involvement of the senior management by making it the board’s responsibility to address matters relating to the resolvability of Santander Group and setting up a steering committee to specialise in matters relating to resolution.
The Group plans to develop further tools in 2018 in order to help identify potential impediments to resolution and to assess the impact of management decisions on the Bank’s resolvability.
It also plans to focus more on training and raising awareness of resolution across the entire organisation.
2.4.3. Special Situation Management FrameworkWhen it comes to the governance of crisis situations, the Special Situation Management Framework was formally approved and implemented in 2016 both at the corporation and across the main countries and regions of Santander Group.
It is a holistic framework governing special events or situations that differ from what is expected or what ought to emerge from the ordinary management of business and that could compromise business or trigger a serious downturn in the financial position of the entity or of Santander Group by straying too far from its risk appetite and limits.
The main features of this framework are as follows:
1) Defining a set of standardised crisis indicators.
2) Defining a traffic light system based on the extent of financial impairment or risk of financial impairment and consistent with the limits used for BAU management.
3) Defining the role of Crisis Management Director to coordinate the response to a crisis situation.
4) Defining escalating responsibilities for crisis events.
5) Creating a high-level crisis committee supported by a technical crisis committee.
Work continued throughout 2017 to implement the framework in a bid to achieve a uniform implementation across the main subsidiaries of Santander Group and to promote the adherence of new regions (Santander Spain, Santander Uruguay, etc.).
Further progress was also made during the year on developing tools to facilitate rapid and effective crisis management (such as by automating communications in special situations and setting up specific crisis rooms) and to raise awareness and increase the training of the Group’s human resources and governing bodies involved in escalating and managing this type of incident, mainly by preparing and conducting simulations known as war games.
2.5. Total Loss Absorbing Capacity (TLAC) and Minimum Required Eligible Liability (MREL)On 9 November 2015, the FSB published its final principles and term sheet containing an international standard to enhance the loss absorbing capacity of G-SIIs.
The final standard consists of an elaboration of the principles on loss absorbing and recapitalisation capacity of G-SIIs in resolution and a term sheet setting out a proposal for the implementation of these proposals in the form of an internationally agreed standard on total loss absorbing capacity (“TLAC”) for G-SIIs. Once implemented in the relevant jurisdictions, these principles and terms will form a new minimum TLAC standard for G-SIIs, and in the case of G-SIIs with more than one resolution group, each resolution group within the G-SII. The FSB will undertake a review of the technical implementation of the TLAC principles and term sheet by the end of 2019.
The TLAC principles and term sheet require a minimum TLAC requirement to be determined individually for each G-SII at the greater of (a) 16% of risk weighted assets as of 1 January 2019 and 18% as of 1 January 2022, and (b) 6% of the Basel III Tier 1 leverage ratio exposure measure as of 1 January 2019, and 6.75% as of 1 January 2022.
Furthermore, BRRD provides that Member States shall ensure that institutions meet, at all times, a minimum requirement for own funds and eligible liabilities (“MREL”). The MREL shall be calculated as the amount of own funds and eligible liabilities expressed as a percentage of the total liabilities and own funds of the institution. The MREL requirement was scheduled to come into force by January 2016. However, resolution authorities were given discretion to determine appropriate transitional periods to each institution.
The European Commission committed to review the existing MREL rules with a view to provide full consistency with the TLAC standard. The European Commission's proposals dated 23 November 2016 to amend BRRD and CRR aimed to implement the TLAC standard and to integrate the TLAC requirement into the general MREL rules thereby

2017 Pillar 3 Disclosures 89
Main summary
Chapter summary
Enhanc. table
List of tables
avoiding duplication from the application of two parallel requirements. As mentioned above, although TLAC and MREL pursue the same regulatory objective, there are, nevertheless, some differences between them in the way they are constructed.
The European Commission is proposing to integrate the TLAC standard into the existing MREL rules and to ensure that both requirements are met with largely similar instruments, with the exception of the subordination requirement, which will be institution-specific and determined by the resolution authority. Under these proposals, institutions such as Banco Santander would continue to be subject to an institution-specific MREL requirement (i.e., a "Pillar 2" add-on MREL Requirement), which may be higher than the requirement of the TLAC standard (which would be implemented as a "Pillar 1" MREL requirement for G-SIIs).
The European Commission’s proposals require the introduction of limited adjustments to the existing MREL rules ensuring technical consistency with the structure of any requirements for G-SIIs. In particular, technical amendments to the existing rules on MREL are needed to align them with the TLAC standard regarding, inter alia, the denominators used for measuring loss-absorbing capacity, the interaction with capital buffer requirements, disclosure of risks to investors, and their application in relation to different resolution strategies. Implementation of the TLAC/MREL Requirements is expected to be phased-in from 1 January 2019 (a 16% minimum TLAC requirement) to 1 January 2022 (an 18% minimum TLAC requirement).
The European Bank Resolution and Recovery Directive (BRRD), approved in July 2014, introduced the requirement for a buffer to absorb losses (MREL: Minimum Requirement of Eligible Liabilities. This requirement, which came into effect in 2016, is calculated for each institution by the resolution authority on the basis of an individualized analysis. Meanwhile, in November 2015 the FSB published the term sheet for TLAC (Total Loss Absorbing Capacity) with the same aim, to ensure that institutions have sufficient liabilities to absorb losses and to be recapitalized in case of resolution.
The rules of the TLAC term sheet are only applicable to systemic institutions (G-SIBs), while the MREL applies to over 6,000 European institutions. With the aim of avoiding the need for systemic institutions in Europe to comply with two regulatory requirements, the European Commission proposed that the European regulations should be revised to introduce the main features of the TLAC.
The result is therefore a single requirement with one methodology to be applied by the resolution authority, and common rules for the eligibility of liabilities. For the G-SIBs, the minimum set out in the term sheet (16%/18%) is introduced. They will have to be composed of subordinated liabilities, with the exception of a percentage of senior debt (2.5%-3.5%). For non-systemic institutions, the subordinated requirement will be determined by the resolution authority on a case-by-case basis.
Additionally, the European Commission's Proposals dated 23 November 2016 include a proposal for a European Directive amending BRRD that would create a new asset class of "non-preferred" senior debt that should only be bailed-in after capital instruments but before other senior liabilities. On 27 December 2017, Directive 2017/2399 of the European Parliament and of the Council of 12 December 2017 amending Directive 2014/59/EU as regards the ranking of unsecured debt instruments in insolvency hierarchy, was published in the Official Journal of the European Union. Before that, Royal Decree-law 11/2017, of 23 June, on urgent measures in financial matters created in Spain the new category of senior non-preferred debt.
The final texts are expected to be approved in 2018 and come into force in 2019.
During 2018 we expect the relevant authorities to inform us for the first time of the MREL requirement for the Group on the basis of the prevailing legislation (BRRD).
We believe that, with the senior preferred debt that we have issued and the funding plan, we are comfortably placed to meet these requirements.
From 2019, the minimum requirement established in the CRR will apply to us, though the resolution authority will be able to set higher levels based on resolvability considerations.

3.1. General aspects 91
3.2. Distribution of exposures 91
3.3. Internal rating systems 101
3.4. Rating assignment and parameter estimation process
103
3.5. Uses of the internal parameter estimates
115
3.6. Recognition of credit risk mitigation
115
3.7. Control of internal rating systems
116
3.7.1. Model Risk 116
3.7.2. Internal Audit 119
3.8. Impairment losses: influencing factors and comparative analysis
120
3.9. Backtesting of IRB parameters 1223.9.1. PD backtest 122
3.9.2. EAD Backtest 139
3.9.3. Backtest of Expected Loss and LGD (Santander Spain)
143
3.10. Counterparty risk 144
3.11. Credit risk mitigation techniques 1543.11.1. Netting policies and processes 154
3.11.2. Collateral management and valuation policies and processes
154
3.11.3. Personal guarantees and credit derivatives
156
3.11.4. Hedged exposure by type of guarantee
157
3.11.5. Central counterparty exposure 157
CREDIT RISK
3

2017 Pillar 3 Disclosures 91
Main summary
Chapter summary
Enhanc. table
List of tables
3. Credit risk
Santander Group applies on forward-looking management of all risks in a robust control environment, based on pillars aligned with Santander Group’s strategy and business model, thus ensuring maintenance of the risk profile within the levels set by risk appetite and other limits.
For further details on policies and objectives of risk management (CRR article 435) see chapters 3 and 5, sections A and C, on the Annual Report.
For further details see Chapters 3 and 5, sections A and C, on the 2017 Annual Report on the Santander Group website.
3.1. General aspectsCredit risk arises from the possibility of losses stemming from the failure of customers or counterparties to meet their financial obligations with Santander Group.
At Santander Group credit risk management is based on identifying, analysing, controlling and deciding on the risks incurred by Santander Group in its operations, ensuring the conjunction of the business plan, the credit policy on the basis of the risk appetite and of the necessary resources to achieve it. The business areas, senior management and the risk areas are all involved in the credit risk cycle.
Santander Group's profile is mainly retail, with credit risk diversified among the principal geographical areas in which it operates.
For further details see Chapter 5, section C.1. on the 2017 Annual Report on the Santander Group website.
3.2. Distribution of exposuresThis section contains information on the Group’s exposures to credit and dilution risk, broken down as follows:
• Regulatory capital calculation approach
• Exposure category
• Geographical area
• Business sector
• Residual maturity
It also contains information on defaulted exposures, impairment loss allowances, and provisions for contingent liabilities and commitments. The amounts shown in the tables in this section include the amounts for counterparty credit risk.
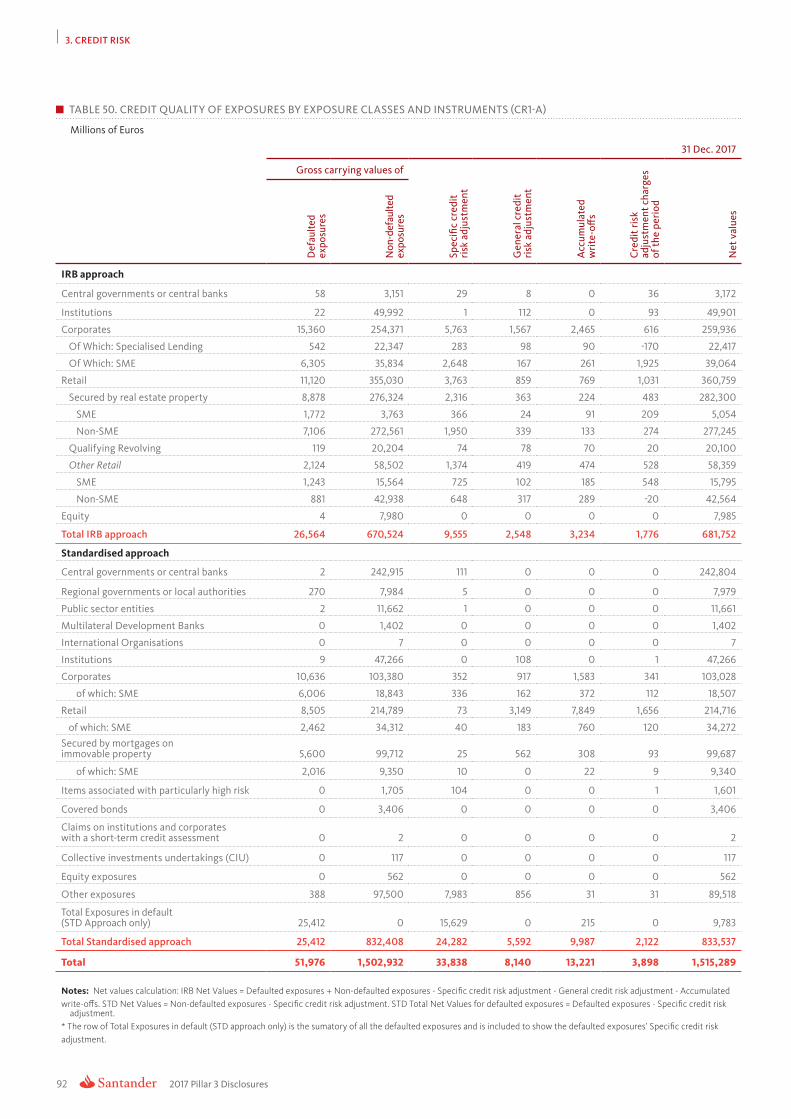
2017 Pillar 3 Disclosures
3. CREDIT RISK
92
TABLE 50. CREDIT QUALITY OF EXPOSURES BY EXPOSURE CLASSES AND INSTRUMENTS (CR1-A)
Millions of Euros
31 Dec. 2017
Gross carrying values of
Spec
ific
cred
it
risk
adj
ustm
ent
Gen
eral
cre
dit
risk
adj
ustm
ent
Acc
umul
ated
w
rite
-off
s
Cre
dit r
isk
adju
stm
ent c
harg
es
of th
e pe
riod
Net
val
ues
Def
aulte
d ex
posu
res
Non
-def
aulte
d ex
posu
res
IRB approach
Central governments or central banks 58 3,151 29 8 0 36 3,172
Institutions 22 49,992 1 112 0 93 49,901
Corporates 15,360 254,371 5,763 1,567 2,465 616 259,936
Of Which: Specialised Lending 542 22,347 283 98 90 -170 22,417
Of Which: SME 6,305 35,834 2,648 167 261 1,925 39,064
Retail 11,120 355,030 3,763 859 769 1,031 360,759
Secured by real estate property 8,878 276,324 2,316 363 224 483 282,300
SME 1,772 3,763 366 24 91 209 5,054
Non-SME 7,106 272,561 1,950 339 133 274 277,245
Qualifying Revolving 119 20,204 74 78 70 20 20,100
Other Retail 2,124 58,502 1,374 419 474 528 58,359
SME 1,243 15,564 725 102 185 548 15,795
Non-SME 881 42,938 648 317 289 -20 42,564
Equity 4 7,980 0 0 0 0 7,985
Total IRB approach 26,564 670,524 9,555 2,548 3,234 1,776 681,752
Standardised approach
Central governments or central banks 2 242,915 111 0 0 0 242,804
Regional governments or local authorities 270 7,984 5 0 0 0 7,979
Public sector entities 2 11,662 1 0 0 0 11,661
Multilateral Development Banks 0 1,402 0 0 0 0 1,402
International Organisations 0 7 0 0 0 0 7
Institutions 9 47,266 0 108 0 1 47,266
Corporates 10,636 103,380 352 917 1,583 341 103,028
of which: SME 6,006 18,843 336 162 372 112 18,507
Retail 8,505 214,789 73 3,149 7,849 1,656 214,716
of which: SME 2,462 34,312 40 183 760 120 34,272Secured by mortgages on immovable property 5,600 99,712 25 562 308 93 99,687
of which: SME 2,016 9,350 10 0 22 9 9,340
Items associated with particularly high risk 0 1,705 104 0 0 1 1,601
Covered bonds 0 3,406 0 0 0 0 3,406
Claims on institutions and corporates with a short-term credit assessment 0 2 0 0 0 0 2
Collective investments undertakings (CIU) 0 117 0 0 0 0 117
Equity exposures 0 562 0 0 0 0 562
Other exposures 388 97,500 7,983 856 31 31 89,518
Total Exposures in default (STD Approach only) 25,412 0 15,629 0 215 0 9,783
Total Standardised approach 25,412 832,408 24,282 5,592 9,987 2,122 833,537
Total 51,976 1,502,932 33,838 8,140 13,221 3,898 1,515,289
Notes: Net values calculation: IRB Net Values = Defaulted exposures + Non-defaulted exposures - Specific credit risk adjustment - General credit risk adjustment - Accumulatedwrite-offs. STD Net Values = Non-defaulted exposures - Specific credit risk adjustment. STD Total Net Values for defaulted exposures = Defaulted exposures - Specific credit risk
adjustment.* The row of Total Exposures in default (STD approach only) is the sumatory of all the defaulted exposures and is included to show the defaulted exposures’ Specific credit riskadjustment.

2017 Pillar 3 Disclosures 93
Main summary
Chapter summary
Enhanc. table
List of tables
TABLE 51. STANDARDISED APPROACH - CREDIT RISK EXPOSURE AND CRM EFFECTS (CR4)
Millions of Euros
31 Dec. 2017
Exposures before CCF and CRM Exposures post CCF and CRM RWAs and RWA density
On-balance-sheet amount
Off-balance-sheet amount
On-balance-sheet amount
Off-balance-sheet amount RWAs RWA density
Central governments or central banks 230,405 12,399 233,316 6,609 4,543 1.89%
Regional governments or local authorities 7,728 251 7,425 17 222 2.98%
Public sector entities 11,013 648 10,322 525 396 3.65%
Multilateral Development Banks 1,374 28 3,110 28 4 0.11%
International Organisations 7 0 7 0 7 –
Institutions 20,798 26,467 20,240 19,572 6,818 17.12%
Corporates 68,148 34,880 64,526 12,370 74,157 96.44%
Retail 138,400 76,316 134,020 2,467 97,527 71.45%
Secured by mortgages on immovable property 91,169 8,518 90,854 1,118 39,424 42.87%
Exposures in default 9,423 360 9,328 238 10,527 110.04%
Items associated with particularly high risk 1,599 2 1,599 0 2,399 150.00%
Covered bonds 3,406 0 3,406 0 456 13.38%
Claims on institutions and corporates with a short-term credit assessment 2 0 2 0 2 100%
Collective investments undertakings (CIU) 110 7 608 93 292 41.73%
Equity exposures 562 0 562 0 562 100%
Other exposures 76,040 13,477 79,380 2,578 62,096 75.77%
Total Standardised approach 660,184 173,353 658,705 45,616 299,430 42.51%
TABLE 51.b. IRB APPROACH - CREDIT RISK EXPOSURE AND CRM EFFECTS (CR4)
Millions of Euros
31 Dec. 2017
Exposures before CCF and CRM Exposures post CCF and CRM RWAs and RWA density
On-balance-sheet amount
Off-balance-sheet amount
On-balance-sheet amount
Off-balance-sheet amount RWAs RWA density
Central governments or central banks 1,947 1,262 1,939 281 714 32.16%
Institutions 41,689 8,325 32,886 3,992 9,232 25.03%
Corporates 169,186 100,545 163,490 35,561 108,719 54.62%
Of Which: Specialised Lending 20,204 2,685 20,204 989 17,774 83.87%
Of Which: SME 35,600 6,539 35,129 2,478 19,097 50.78%
Retail 327,189 38,961 327,381 24,541 79,605 22.62%
Secured by real estate property 270,449 14,754 270,813 9,667 48,319 17.23%
SME 5,363 171 5,348 85 1,262 23.23%
Non-SME 265,086 14,582 265,464 9,582 47,057 17.11%
Qualifying Revolving 3,031 17,291 3,068 10,586 4,141 30.33%
Other Retail 53,709 6,916 53,501 4,288 27,144 46.97%
SME 12,703 4,105 12,494 2,079 4,811 33.01%
Non-SME 41,007 2,812 41,007 2,209 22,334 51.68%
Equity 7,985 0 7,985 0 15,755 197.32%
Total IRB approach 547,996 149,092 533,681 64,375 214,025 35.79%
Note: Securitisations not included

2017 Pillar 3 Disclosures
3. CREDIT RISK
94
TABLE 52. NET AMOUNT OF EXPOSURES (CRB-B)
Millions of Euros
31 Dec. 2017
Net exposure at the end of the period
Average net exposure over the period
Central governments or central banks 3,172 2,955
Empresas 49,901 52,129
Corporates 259,936 263,152
Of Which: Specialised Lending 22,417 23,328
Of Which: SME 39,064 36,782
Retail 360,759 350,006
Secured by real estate property 282,300 275,512
SME 5,054 4,343
Non-SME 277,245 271,169
Qualifying Revolving 20,100 19,663
Other Retail 58,359 54,830
SME 15,795 13,642
Non-SME 42,564 41,188
Equity 7,985 8,554
Total IRB approach 681,752 676,795
Central governments or central banks 242,804 224,876
Regional governments or local authorities 7,979 8,480
Public sector entities 11,661 11,613
Multilateral Development Banks 1,402 1,497
International Organisations 7 2
Institutions 47,266 45,783
Corporates 103,028 104,254
of which: SME 18,507 14,961
Retail 214,716 213,716
of which: SME 34,272 32,643
Secured by mortgages on immovable property 99,687 102,338
of which: SME 9,340 13,518
Exposures in default 9,783 8,755
Items associated with particularly high risk 1,601 1,551
Covered bonds 3,406 3,669
Claims on institutions and corporates with a short-term credit assessment 2 3
Collective investments undertakings (CIU) 117 776
Equity exposures 562 1,025
Other exposures 89,518 82,260
Total Standardised approach 833,537 810,597
Total 1,515,289 1,487,392
Note: Securitisations not included
The Group’s average EAD increased by 9.1%, mainly due to the growth of exposure in the categories of central governments or central banks and retailers under the standard method and to the increase of the EAD in the corporate and retailers segments under the IRB method.
The following graph shows the distribution, by geographical area, of Santander Groups’s exposure to credit and dilution risk.

2017 Pillar 3 Disclosures 95
Main summary
Chapter summary
Enhanc. table
List of tables
TABLE 53. GEOGRAPHICAL BREAKDOWN OF EXPOSURES (CRB-C)
Millions of Euros
31 Dec. 2017
Original exposure Spain UK BrazilContinental
EuropeRest of Latam EEUU
Rest of world Total
IRB approach
Central governments or central banks 2,620 116 – 6 202 266 – 3,209
Institutions 25,670 9,585 – 4,447 6,040 3,802 470 50,014
Corporates 139,548 41,620 21,463 31,963 17,684 17,328 126 269,731
Retail 113,810 196,363 – 55,934 2 42 – 366,150
Equity 7,088 131 571 106 27 – 63 7,985
Total IRB approach 288,735 247,814 22,034 92,455 23,955 21,437 658 697,088
Standardised approach
Central governments or central banks 93,622 52,290 47,792 21,406 22,545 4,674 588 242,915
Regional governments or local authorities 6,889 1 18 690 351 35 0 7,984
Public sector entities 1,034 0 1,199 1,724 429 7,277 0 11,662
Multilateral Development Banks 0 1,273 0 121 7 0 0 1,402
International Organisations 7 0 0 0 0 0 0 7
Institutions 12,393 9,178 4,638 4,075 5,152 11,695 135 47,266
Corporates 11,393 21,536 14,734 23,573 14,819 17,024 300 103,380
Retail 28,230 17,135 56,935 40,871 36,552 33,811 1,255 214,789
Secured by mortgages on immovable property 11,896 1,055 9,326 18,238 24,889 34,201 106 99,712
Exposures in default 11,170 667 4,797 3,833 2,960 1,956 27 25,412
Items associated with particularly high risk 106 0 0 315 1,218 67 0 1,705
Covered bonds 0 2,980 0 426 0 0 0 3,406
Claims on institutions and corporates with a short-term credit assessment 2 0 0 0 0 0 0 2
Collective investments undertakings (CIU) 97 10 7 2 0 2 0 117
Equity exposures 343 0 0 216 3 0 0 562
Other exposures 47,875 8,483 14,696 6,307 10,862 9,256 20 97,500
Total SA approach 225,057 114,609 154,140 121,799 119,786 119,997 2,432 857,820
Total 513,792 362,422 176,175 214,254 143,741 141,435 3,089 1,554,908
Note: figures reflect the original exposure (CR-IRB column 20, CRSA column 10). Securitisations not included.
The geographical distribution of standard portfolios is concentrated mainly in Brazil, Continental Europe and Spain. The most important segments remain central administrations (with strong presence in Spain, the United Kingdom and Brazil), retailers and corporates, which have a prominent presence in the UK and Continental Europe (excluding Spain).
Regarding the IRB portfolios, most of the exposure is concentrated in retailers and corporates segments from Spain and UK.
EXPOSURES BY GEOGRAPHICAL AREA
Spain UK Brazil Continental Europe Rest of Latam USA
33%
23%12%
14%
9%
9%

2017 Pillar 3 Disclosures
3. CREDIT RISK
96
TA
BLE
54.
CO
NC
ENTR
ATI
ON
OF
EXPO
SUR
ES B
Y IN
DU
STRY
OR
CO
UN
TER
PAR
TY T
YPES
(CR
B-D
)
M
illio
ns o
f Eur
os
31 D
ec. 2
017
Ori
gina
l exp
osur
e
Real estate activities
Professional Services
Accommodation and food service activities
Construction
Manufacturing
Other services
Other Retail (Individuals)
Primary Sector
PublicSector
Utilities
Transport and storage
Total
IRB
App
roac
h
Cen
tral
gov
ernm
ents
or c
entr
al b
anks
00
00
649
00
2,33
20
223
53,
209
Inst
ituti
ons
6212
810
466
933
,241
9772
14,0
201,5
8127
1250
,014
Cor
pora
tes
27,0
1846
,066
24,5
4741
,162
40,8
6946
12,8
505,
443
25,8
8429
,291
16,5
5426
9,73
1
Reta
il21
3,83
27,
807
3,12
34,
693
6,50
512
2,52
11,7
191,4
432,
587
193
1,726
366,
150
Equi
ty2,
019
132
522
4,85
10
6335
928
06
597,
985
Tota
l IR
B ap
proa
ch24
2,93
154
,00
228
,10
046
,546
86,1
1512
2,66
414
,70
623
,597
30,3
3129
,739
18,3
5669
7,0
88
Stan
dard
ised
App
roac
h
Cen
tral
gov
ernm
ents
or c
entr
al b
anks
00
01
739
00
241,
215
095
54
242,
915
Regi
onal
gov
ernm
ents
or l
ocal
aut
hori
ties
0
00
041
10
7,62
231
80
27,
984
Publ
ic s
ecto
r ent
itie
s31
042
514
30
410
,384
2961
940
611
,662
Mul
tila
tera
l Dev
elop
men
t Ban
ks0
00
01,4
020
00
00
01,4
02
Inte
rnat
iona
l Org
anis
atio
ns0
00
07
00
00
00
7
Inst
ituti
ons
151
696
5124
645
,317
298
5245
337
2447
47,2
66
Cor
pora
tes
5,55
518
,865
7,80
513
,368
31,8
322,
075
4,56
74,
522
5,83
95,
073
3,87
910
3,38
0
Reta
il60
714
,354
4,68
95,
267
4,78
516
9,71
15,
397
4,61
22,
198
604
2,56
421
4,78
9
Secu
red
by m
ortg
ages
on
imm
ovab
le p
rope
rty
22,3
966,
237
4,0
973,
278
11,6
6041
,882
2,68
54,
183
1,362
420
1,510
99,7
12
Expo
sure
s in
def
ault
1,092
2,0
09
8,79
11,0
611,1
599,
027
770
433
437
241
392
25,4
12
Item
s as
soci
ated
wit
h pa
rtic
ular
ly h
igh
risk
350
01,
234
011
29
00
00
01,7
05
Cov
ered
bon
ds0
00
03,
406
00
00
00
3,40
6
Cla
ims
on in
stitu
tion
s an
d co
rpor
ates
wit
h a
shor
t-te
rm c
redi
t ass
essm
ent
00
00
20
00
00
02
Col
lect
ive
inve
stm
ents
und
erta
king
s (C
IU)
00
00
117
00
00
00
117
Equi
ty e
xpos
ures
00
00
562
00
00
00
562
Oth
er e
xpos
ures
157
2,37
811
1,588
68,7
232,
883
6318
,574
940
1,410
772
97,5
00
Tota
l sta
ndar
dise
d ap
proa
ch30
,340
44,
540
26,7
2124
,815
170
,00
722
5,88
613
,538
291,
591
11,4
609,
347
9,57
685
7,82
0
Tota
l27
3,27
198
,54
154
,821
71,3
6125
6,12
234
8,55
028
,24
331
5,18
84
1,79
139
,086
27,9
321,
554
,90
8
Not
e: o
rigin
al e
xpos
ure
is s
how
n (C
R-IR
B co
lum
n 20
, CRS
A c
olum
n 10
). Se
curit
isat
ions
not
incl
uded

2017 Pillar 3 Disclosures 97
Main summary
Chapter summary
Enhanc. table
List of tables
In order to simplify the exposures analysis, some sectors have been grouped (from 19 to 11) based on its representability:
• Primary sector: Agriculture, forestry and fishing; Mining and quarrying.
• Utilities: Electricity, gas, steam and air conditioning supply; Water supply.
• Trade, Accommodation and Accommodation: Accommodation and food service activities; Wholesale and retail trade.
• Professional Services: Professional, scientific and technical activities; Administrative and support service activities.
• Other services: Information and communication; education; arts, entertainment and recreation; Other services.
• Public sector: Public administration and defense, compulsory social security; human health services and social work activities.
For the Standard Approach the business sectors with greater exposure are: individuals, public sector and other services. As for IRB, the sectors with the highest exposure are: real estate activities; individuals and other services.
TABLE 55. MATURITY OF EXPOSURES (CRB-E)
Millions of Euros
Original exposure
31 Dec. 2017
On demand <= 1 yearr > 1 year <=
5 years > 5 yearsNo stated
maturity Total
IRB Approach
Central governments or central banks 0 285 2,923 0 0 3,209
Institutions 107 24,580 24,192 1,019 115 50,014
Corporates 482 92,096 144,109 28,143 4,901 269,731
Retail 4,856 13,651 114,609 226,322 6,711 366,150
Equity 0 0 7,985 0 0 7,985
Total IRB approach 5,446 130,612 293,819 255,485 11,727 697,088
Standardised Approach
Central governments or central banks 53,102 102,980 35,394 46,168 5,271 242,915
Regional governments or local authorities 0 2,150 3,636 2,194 5 7,984
Public sector entities 0 2,084 905 8,633 39 11,662
Multilateral Development Banks 0 49 734 618 0 1,402
International Organisations 0 7 0 0 0 7
Institutions 1,516 23,180 7,641 13,916 1,012 47,266
Corporates 2,923 33,698 45,870 17,623 3,266 103,380
Retail 14,113 74,537 91,658 29,572 4,909 214,789
Secured by mortgages on immovable property 6,524 9,194 18,259 65,669 66 99,712
Exposures in default 424 12,141 4,298 8,249 300 25,412
Items associated with particularly high risk 45 428 531 701 0 1,705
Covered bonds 426 540 1,733 707 0 3,406
Claims on institutions and corporates with a short-term credit assessment 2 0 0 0 0 2
Collective investments undertakings (CIU) 0 0 117 0 0 117
Equity exposures 0 0 0 0 562 562
Other exposures 847 52,826 14,247 8,042 21,539 97,500
Total standardised approach 79,923 313,814 225,022 202,091 36,970 857,820
Total 85,369 444,426 518,841 457,576 48,697 1,554,908
Note: original exposure is shown (CR-IRB column 20, CRSA column 10). Securitisations not included

2017 Pillar 3 Disclosures
3. CREDIT RISK
98
In the distribution of standard exposure maturities, the terms of less than one year and between one and five have the highest degree of exposure.
In the distribution of exposure maturities in IRB models the terms between one year and five and over five are those with the highest percentage of exposure.
The following two tables show all exposures by counterparty type and geographical area.
TABLE 56. CREDIT QUALITY OF EXPOSURES BY INDUSTRY OR COUNTERPARTY TYPE (CR1-B)
Millions of Euros
31 Dec. 2017
Gross carrying values of1Credit risk
adjustment charges of the period3 Net values4
Non performing exposures
Performing exposures
Agriculture, forestry and fishing 426 8,016 254 8,188
Mining and quarrying 309 5,040 219 5,130
Manufacturing 2,134 39,242 1,265 40,111
Electricity, gas, steam and air conditioning supply 619 15,331 323 15,627
Water supply 76 1,412 48 1,441
Construction 6,336 32,462 3,072 35,726
Wholesale and retail trade 3,037 57,495 2,121 58,411
Transport and storage 522 15,308 393 15,436
Accommodation and food service activities 944 8,828 279 9,493
Information and communication 139 8,354 99 8,394
Real estate activities 2,171 25,192 2,130 25,233
Professional, scientific and technical activities 625 13,198 308 13,516
Administrative and support service activities 578 11,073 429 11,222
Public administration and defence, compulsory social security 2 183 1 184
Education 111 3,102 93 3,120
Human health services and social work activities 398 7,371 187 7,582
Arts, entertainment and recreation 85 1,339 36 1,387
Other services 713 16,942 559 17,095
Total2 19,224 269,885 11,815 277,294
1) Only on balance.
2) Only loans to non-financial companies.
3) Includes: All provisions + accumulated fair value changes due to credit risk.
4) Net values = Non-performing exposures + Performing exposures - Credit risk adjustments charges of the period.

2017 Pillar 3 Disclosures 99
Main summary
Chapter summary
Enhanc. table
List of tables
TABLE 57. CREDIT QUALITY OF EXPOSURES BY GEOGRAPHY (CR1-C)
Millions of Euros
31 Dec. 2017
Gross carrying values of
Credit risk adjustment charges
of the period1 Net values2Non performing
exposuresPerforming
exposures
Spain 19,289 402,435 8,683 413,041
European Union ex Spain 9,373 592,805 5,857 596,321
EEUU and Puerto Rico 2,205 155,123 3,636 153,692
Rest of OCDE 2,969 132,738 2,007 133,701
LatAm (no OCDE) 5,522 191,811 4,850 192,483
Rest of world 163 19,724 93 19,795
Total 39,521 1,494,637 25,125 1,509,032
Note:
Table includes: on balance sheet exposure of loans,fixed income and on demand balances in central banks and credit institutions. Off balance sheet exposure included.
1) Includes: All provisions + accumulated fair value changes due to credit risk (all figures are on balance sheet exposure).
2) Net Values = Non-performing Exposures + Performing Exposures - Credit risk adjustment charges of the period. Off balance adjustments (not included) amount to € 617 Mn.
The following table shows the volume of NPLs and debt restructurings.
TABLE 58. NON-PERFORMING AND FORBORNE EXPOSURES (CR1-E)
Millions of Euros
31 Dec. 2017
Gross carrying values of
Gross carrying amount of performing and non-performing exposures
Accumulated impairment and provisions and negative fair value
adjustments due to credit risk
Collaterals and financial
guarantees received
Of w
hich
: per
form
ing
but p
ast d
ue >3
0 d
ays
and
<=90
day
s
of w
hich
: per
form
ing
forb
orne
Of which non-performingOn performing
exposures
On non-performing
exposures
On
nonp
erfo
rmin
g ex
posu
res
of w
hich
: for
born
e ex
posu
res
of w
hich
: im
pair
ed
of w
hich
: fo
rbor
ne
of w
hich
: fo
rbor
ne
of w
hich
: fo
rbor
ne
Debt securities 148,276 0 88 1,017 995 765 -32 0 -729 -552 57 57
Loans and advances 1,047,304 10,425 29,091 37,177 34,894 20,139 -7,945 -2,371 -16,475 -8,696 14,539 25,334
Off-balance sheet exposures 291,943 0 466 1,326 0 18 -346 0 -271 0 521 32
Total 1,487,523 10,425 29,645 39,521 35,890 20,922 -8,323 -2,371 -17,475 -9,248 15,116 25,423

2017 Pillar 3 Disclosures
3. CREDIT RISK
100
The following table shows the annual change in impairment losses on financial assets.
TABLE 59. CHANGES IN STOCK OF GENERAL AND SPECIFIC CREDIT RISK ADJUSTMENTS (CR2-A)
Millions of Euros
Accumulated Specific credit risk adjustment
Accumulated General credit risk adjustment
Opening balance 15,895 9,179
Increases due to amounts set aside for estimated loan losses during the period 17,640 1,818
Decreases due to amounts reversed for estimated loan losses during the period -5,870 -2,691
Decreases due to amounts taken against accumulated credit risk adjustments -13,589 0
Transfers between credit risk adjustments 63 -127
Impact of exchange rate differences -730 -716
Business combinations, including acquisitions and disposals of subsidiaries 4,192 683
Other adjustments -396 -321
Closing balance 17,204 7,824
Recoveries on credit risk adjustments recorded directly to the statement of profit or loss 1,625 –
Specific credit risk adjustments recorded directly to the statement of profit or loss – –
Previously written-off assets recovered in 2017 amounted to EUR 1,625 million.
The following table shows the lending stock and debt instruments classified as non-performing between the close of the previous year and the year in progress.

2017 Pillar 3 Disclosures 101
Main summary
Chapter summary
Enhanc. table
List of tables
TABLE 60. CHANGES IN STOCK OF NON-PERFORMING AND IMPAIRED LOANS AND DEBT SECURITIES (CR2-B)
Millions of Euros
Gross carrying value non-performing exposures
Opening balance 34,284
Loans and debt securities that have non-performing or impaired since the last reporting period 1 8,925
Returned to performing status –
Amounts written off -13,570
Other changes 8,556
Closing balance 38,194
1): Figures are referred to net new non-performing
The following table shows the age of exposures with past due balances, by product type.
TABLE 61. AGEING OF PAST-DUE OF EXPOSURES (CR1-D)
Millions of Euros
Gross carrying values
≤ 30 days> 30 days ≤
60 days> 60 days ≤
90 days> 90 days ≤
180 days> 180 days
≤ 1 year > 1 year
Loans 18,134 6,755 3,669 5,336 4,873 15,015
Debt Securities – – – – – 0
Total exposures 18,134 6,755 3,669 5,336 4,873 15,015
Notes: The trading portfolio is not included. Not including non-performing or loans considered doubtful for subjective reasons
3.3. Internal rating systemsSince 1993 the Group has been using its own internal rating and scoring models to measure the credit quality of customers and transactions. Each rating or score indicates a probability of default, measured on the basis of the Bank’s historical default experience (except in the case of low default portfolios). More than 400 internal rating models are used in the Group’s credit approval and risk monitoring process.
Global rating tools are used for the Global Corporate Banking segments, namely Corporate, GCB, Sovereign, Financial Institutions and Specialised Lending, which are managed centrally at Group level in terms of rating assignment and risk monitoring. The rating these tools assign to each customer is obtained using an expert-judgment model, which relies on an analyst’s opinion, supported by a quantitative or automatic module based on balance sheet ratios or macroeconomic variables.
In the global models, the quantitative module is calibrated using the market price of credit default swaps. A model is constructed that relates the market-implied probability of default (PD) extracted from the CDS spreads to country macroeconomic data or company balance sheet data. Consequently, this data can be used to estimate PD even for entities for which no liquid CDS quotes are available.
The analyst takes this information as a reference but will revise and adjust it to obtain the final rating, which therefore is decisively expert judgment-based. Occasionally, as in the case of CGB Corporate, the rating is also adjusted where the company belongs to a group from which it receives explicit support.
For the Corporates and Institutions segment (including SMEs with the highest turnover), the parent of Santander Group has established a single methodology for constructing a rating in each country. In this case the rating is determined by an automatic module which uses initial analyst input and which may or may not be supplemented at a later stage. The automatic module determines the rating in two phases: a quantitative phase and a qualitative phase. The qualitative phase is based on a corrective questionnaire, which allows the analyst to modify the automatic score by a limited number of rating points. Santander Group is moving towards a new rating methodology that aims to incorporate all available information (internal behaviour, external sources, etc.) in a more structured manner, so as to statistically assign a weight to the (automatic) objective score and the (expert) subjective score in accordance with a customer’s characteristics and analyst’s view of its capacity to add value, thus simplifying and improving the assignment of ratings.
Customer ratings are reviewed at periodic intervals to take account of new available information. Ratings are reviewed more frequently when certain automatic alerts are triggered and in the case of customers placed on special watch. The rating tools themselves are also reviewed in order to fine-tune the ratings they generate.
For the Retail segment (Natural Persons and SMEs), the Group has scoring tools that automatically assign a score to transactions submitted for approval.

2017 Pillar 3 Disclosures
3. CREDIT RISK
102
These credit approval systems are supplemented by behavioural rating models, which provide greater predictability of the risks assumed and are used not only when accepting new risks but also when monitoring risks setting limits.
The models committee has approved the following mapping between internal ratings and probabilities of default for the global portfolios.
TABLE 62. MAPPING OF INTERNAL RATINGS AND PD
Global Corporate Banking Banks Financial institutions non banks
Rating PD Rating PD Rating PD
9.3 0.008% 9.3 0.008% 9.3 0.002%
9.2 0.008% 9.2 0.009% 9.2 0.002%
9.0 0.010% 9.0 0.011% 9.0 0.003%
8.5 0.017% 8.5 0.018% 8.5 0.006%
8.0 0.029% 8.0 0.030% 8.0 0.012%
7.5 0.049% 7.5 0.050% 7.5 0.024%
7.0 0.083% 7.0 0.083% 7.0 0.050%
6.5 0.140% 6.5 0.138% 6.5 0.103%
6.0 0.236% 6.0 0.229% 6.0 0.212%
5.5 0.397% 5.5 0.378% 5.5 0.437%
5.0 0.668% 5.0 0.624% 5.0 0.900%
4.5 1.122% 4.5 1.030% 4.5 1.853%
4.0 1.879% 4.0 1.694% 4.0 3.814%
3.5 3.128% 3.5 2.776% 3.5 7.853%
3.0 5.166% 3.0 4.515% 3.0 16.169%
2.5 8.415% 2.5 7.264% 2.5 33.289%
2.0 13.418% 2.0 11.483% 2.0 45.000%
1.5 20.723% 1.5 17.687% 1.5 45.000%
1.0 30.600% 1.0 26.248% 1.0 45.000%
These PDs are applied consistently across the Group, in line with the global management of these portfolios. As can be seen, the PD assigned to any given internal rating is not exactly the same in different portfolios. Regulatory requirements demand differentiated PD calibration.

2017 Pillar 3 Disclosures 103
Main summary
Chapter summary
Enhanc. table
List of tables
3.4. Rating assignment and parameter estimationMeasuring the credit risk of a transaction involves calculating both the expected and the unexpected loss on the transaction. The unexpected loss is the basis for the calculation of both regulatory and economic capital and refers to a very high, albeit improbable, level of loss that is not considered a recurring cost but must be absorbed by capital. Measuring risk involves two separate steps: estimating the risk, and then assigning the credit risk parameters: PD, LGD and EAD.
PD, or probability of default, estimates the likelihood that a customer or a contract will default within 12 months. The PD used for regulatory capital is long-term, or "through-the-cycle" PD, which is not conditioned to a specific point in the cycle.
The default event being modelled is based on the definition given in article 178 of the Capital Requirements Regulation of the European Central Bank1 , which considers that default is defined for a customer/contract when at least one of the following circumstances arises:
• The institution considers there is a reasonable doubt that the obligor will not pay its credit obligations in full.
• The customer/contract is past due more than 90 days on any material credit obligation.
The event to be modelled in corporate portfolios is customer default, whereas PD is estimated on the basis of the contract in retail portfolios.
Calculations of PD are based on the entity’s own internal experience, i.e. on past observations of defaults in ratings or scorings.
LGD or Loss Given Default is defined as the mathematical expectation of the percentage of economic loss in the event of a default event. Calculations of LGD are based on internal data concerning income and expense incurred by the institution during the recovery process once the default event has arisen, discounted at the date of commencement of default.
The LGD calculated to determine regulatory capital is “downturn” LGD, i.e. considered for a worst-case scenario in the economic cycle.
In addition to the estimation of downturn LGD to be used for normal operations, a specific loss estimate is made for operations in default. This is determined using LGD and ELBE (Expected Loss Best Estimate) parameters. ELBE attempts to provide, at any given time, the best estimate of economic loss based mainly on the time during which the operation has been in default, with due regard to the prevailing economic situation, while LGD for transactions in default is increased by any further unexpected losses that may be reported during the recovery period.
Last but not least, EAD, or exposure at default, is calculated, meaning the value of the debt at the time of default. For lending products or any product with no off-balance sheet amount, EAD equals the balance of the transaction plus any interest accrued but not yet payable. For facility type products, however, it is necessary to estimate any future drawdowns that will be made between the present time and the eventual future default event. It is for this reason that the CCF or Credit Conversion Factor is calculated, which shows the percentage of the balance not currently utilised (off-balance sheet amount) that would be utilised at the time of default.
Past information on portfolios is essential for estimating regulatory parameters, as established in the EU Regulation itself (Regulation (EU) no 575/2013) . The minimum data periods to be used in estimates is five or seven years, depending on the parameter and the portfolio. The Bank has an internal data model containing past information on portfolios, which is subject to review by the internal supervisory divisions (Validation and Audit) and by the supervisory authorities.
The method used to estimate the credit risk parameters will be updated accordingly in accordance with the Guidelines on PD estimation, LGD estimation and treatment of defaulted assets, as well as the Guidelines and RTS relating to the definition of default so as to incorporate the requirements and interpretations deriving from these articles.
As already mentioned, for regulatory purposes observations of frequency of default and the associated losses must be averaged out over an entire economic cycle, in the case of PD, or represent a downturn situation in the case of LGD or EAD.
It is for this reason that recent observations are not directly comparable to regulatory parameters, and backtesting exercises should be treated with due caution. We will see in section 3.9 that the default frequencies recently observed are below regulatory PDs in regions with growth rates above the average for the cycle. Conversely, in regions where economic growth falls short of the average, default observations may exceed regulatory PDs.
In certain portfolios (known as low default portfolios) there is so little default experience that alternative approaches to parameter estimation must be adopted.
Notes 1 and 2: Regulation (EU) No 575/2013 of the European Parliament and of the Council of 26 June 2013 on prudential requirements for credit institutions and investment firms.

2017 Pillar 3 Disclosures
3. CREDIT RISK
104
Low default portfolios: GCB Corporates; Banks; Non-Bank Financial Institutions; and Central GovernmentsEstimates of PD and LGD in low default portfolios rely chiefly on studies performed by external rating agencies, which reflect the pooled experience of the large numbers of entities and countries rated by the agencies. These databases contain in-depth historical information to help identify complete economic cycles and analyse downturn situations.
The definition of default employed by the agencies is subjected to a detailed comparison against regulatory requirements. Even if this does not produce a perfect match, the process has sufficient items in common to enable it to be used.
For PD, the agencies do not directly report TTC estimates, but rather the number of annual default observations. The observations are averaged out over an economic cycle by external ratings in order to obtain the TTC PD. This TTC PD is assigned to all counterparties with external ratings, which later helps to calibrate the internal rating. Therefore, the PD will not depend on the counterparty's external rating, but on its internal rating, and may also be applied to customers with no external rating.
The parameters estimated for global portfolios are the same for all the Group's units. Thus, a financial institution with a rating of 8.5 will have the same PD, regardless of the unit in which the exposure is booked.
Corporates (including SMEs, specialised lending and receivables)For portfolios of customers that have an account manager assigned to them, the estimation is based on the entity's own internal experience. The PD is calculated for customers by observing new NPLs in the portfolio and relating these to the ratings assigned to the customers concerned. To this end, long-run observed default frequencies are calculated for a rating or a group of ratings, and are adjusted to the average PD observed for each portfolio over a complete economic cycle.
In contrast to low default portfolios, Corporates portfolios have specific rating systems in each Group unit, requiring specific PD calibrations in each case.
In Corporates portfolios, LGD is calculated on the basis of observed recoveries of defaulted transactions. This calculation takes into account not only the cash inflows and outflows associated with the recovery process but also the timing of these flows, so as to calculate their present value, as well as the direct and indirect costs of recovery. LGD estimates used for regulatory purposes must be downturn LGD estimates. The existence of major variables (known as “drivers”) is modelled to explain the emergence of different LGDs for different groups of operations. The main drivers employed are the age of operations, whether or not collateral has been furnished, type of collateral, its loan-to-value, etc. These explanatory variables must be of statistical significance and make good business sense. Estimated ELBE and LGD are also calculated for operations in default.
Lastly, EAD, or exposure at default, is estimated by comparing the percent utilisation of committed facilities at the time of default and in normal circumstances, in order to estimate the extent to which customers make more use of their credit facilities as they approach default. To estimate the CCF, information on past defaults is gathered from databases and the balance situation (on and off the balance sheet) is compared between the time of default and previous occasions when the downturn in customers' credit quality had yet to be observed.
Retail portfoliosIn portfolios where customers do not have an account manager assigned to them but are treated on a pooled or standardised basis, PDs are also estimated based on the entity's internal experience, although the data unit for assigning PDs is the transaction, not the customer.
PDs are calculated by observing new NPLs and relating each new NPL to the score assigned to the transaction at the time of approval or, for transactions beyond a certain age, to the customer rating. As with the Corporates portfolios, LGD is calculated on the basis of an observed recovery process, adjusted to downturn conditions. Estimated ELBE and LGD are also calculated for operations in default. The EAD estimation is also similar to that of Corporates.
The risk parameters for retail portfolios must be estimated separately for each entity, country and segment and need to be reviewed at least once a year.
The parameters are then assigned to the transactions recorded on each unit's balance sheet, so as to calculate the expected losses and capital requirements associated with the unit's exposure.

2017 Pillar 3 Disclosures 105
Main summary
Chapter summary
Enhanc. table
List of tables
The following tables provide a summary of the parameter models used in the different regions.
TABLE 63. IRB PARAMETER MODELS BY REGION
Global models
31 Dec. 2017
Compo-nent Portfolio
No. of significantmodels Portfolio RWA
Thousands of Euros
Description of model and methodology
No. of years of loss data
Basel category
Regulatoryfloors applied
Nº Description
PD Corporates 1 - PD Corporates 40,238Model which uses the equivalent agency rating and relates the internal rating with the ODF (S&P) through a regression model
>10
Corporates PD > 0.03%
IFIs 2 - PD Banks- PD Non-Bank IFIs
8,796 Corporates, Financial Institutions
PD > 0.03%
Sovereign 1 PD Sovereign 714 Sovereign No
LGD Corporates 1 LGD Corporates 40,238
Models based on reports published by Moody's and S&P
>10
Corporates 45%
IFIs 2 - LGD Banks- LGD Non-Bank IFIs
8,796 Corporates, Financial Institutions
45%
Sovereign 1 LGD Sovereign 714 Sovereign No
EAD Corporates, IFIs no Bancos
1 EAD Corporates and non-bank IFIs
43,468
Modelled based on: internal cases of default and default proxies
1-5
Corporates, Financial Institutions
EAD must be at least equal to the current utilisation of the balance at account level
Project Finance 1 EAD Project Finance
16,464 Specialised Lending, Sovereign
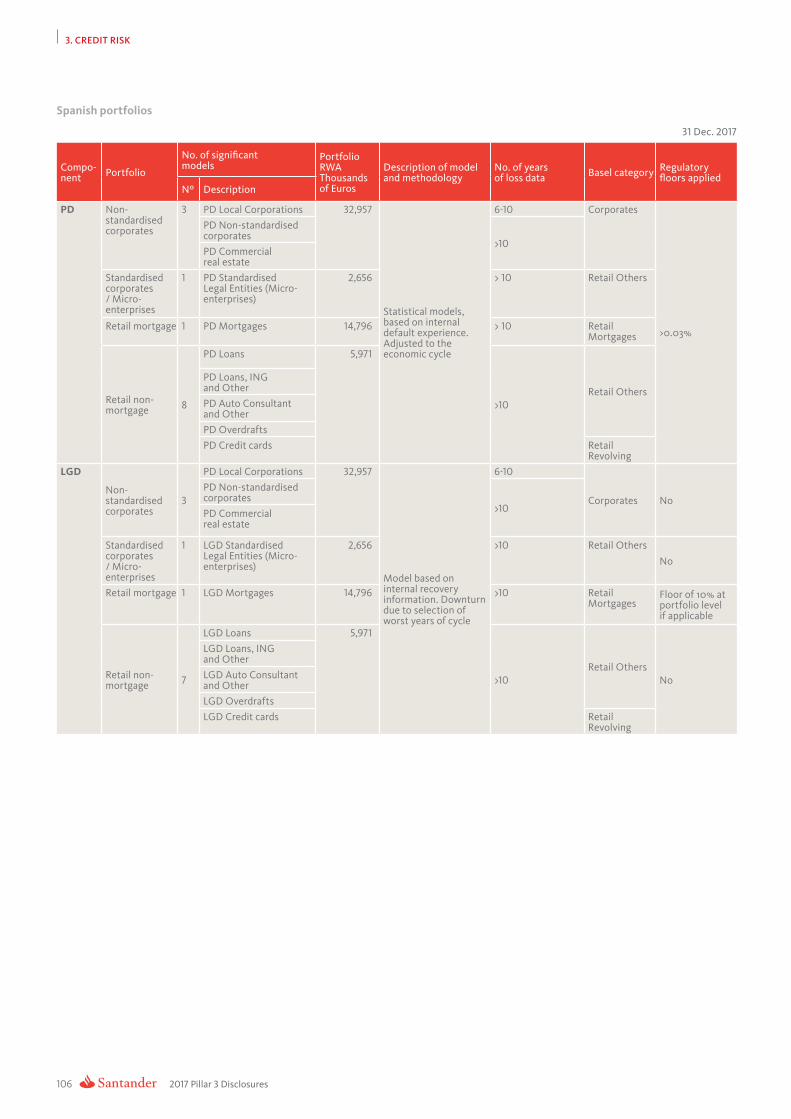
2017 Pillar 3 Disclosures
3. CREDIT RISK
106
Spanish portfolios
31 Dec. 2017
Compo-nent Portfolio
No. of significantmodels
Portfolio RWAThousands of Euros
Description of model and methodology
No. of years of loss data Basel category Regulatory
floors appliedNº Description
PD Non-standardised corporates
3 PD Local Corporations 32,957
Statistical models, based on internal default experience. Adjusted to the economic cycle
6-10 Corporates
>0.03%
PD Non-standardised corporates
>10PD Commercial real estate
Standardised corporates / Micro-enterprises
1 PD Standardised Legal Entities (Micro-enterprises)
2,656 > 10 Retail Others
Retail mortgage 1 PD Mortgages 14,796 > 10 Retail Mortgages
Retail non-mortgage 8
PD Loans 5,971
>10Retail Others
PD Loans, ING and OtherPD Auto Consultant and OtherPD OverdraftsPD Credit cards Retail
RevolvingLGD
Non-standardised corporates
3
PD Local Corporations 32,957
Model based on internal recovery information. Downturn due to selection of worst years of cycle
6-10
Corporates NoPD Non-standardised corporates
>10PD Commercial real estate
Standardised corporates / Micro-enterprises
1 LGD Standardised Legal Entities (Micro-enterprises)
2,656 >10 Retail Others
No
Retail mortgage 1 LGD Mortgages 14,796 >10 RetailMortgages
Floor of 10% at portfolio level if applicable
Retail non-mortgage 7
LGD Loans 5,971
>10Retail Others
No
LGD Loans, ING and OtherLGD Auto Consultant and OtherLGD OverdraftsLGD Credit cards Retail
Revolving

2017 Pillar 3 Disclosures 107
Main summary
Chapter summary
Enhanc. table
List of tables
Spanish portfolios (contd.)
31 Dec. 2017
Compo-nent Portfolio
No. of significantmodels
Portfolio RWAThousands of Euros
Description of model and methodology
No. of years of loss data Basel category Regulatory
floors appliedNº Description
EAD
Non-standardised corporates
3 EAD Local Corporations 32,957
Statistical model, in which the internal balance information observed in default is used to obtain a CCF
>10
Corporates
EAD must be at least equal to the current utilisation of the balance at account level
EAD Non-standardised corporates
EAD Commercial real estate
Standardised corporates / Micro-enterprises
1 EAD Standardised Legal Entities (Micro-enterprises)
2,656 Retail Others
Retail
2 EAD Loans 20,767 Retail Others
EAD Credit Cards Retail Revolving

2017 Pillar 3 Disclosures
3. CREDIT RISK
108
UK portfolios
31 Dec. 2017
Compo-nent Portfolio
No. of significantmodels
Portfolio RWAThousands of Euros
Description of model and methodology
No. of years of loss data Basel category Regulatory
floors appliedNº Description
PD Mortgages 1 Mortgages 29,132 Statistical model which produces a PD that is scaled to a cycle average
>10 Retail Mortgages
PD > 0.03%
Consumer 1 Consumer 2,130 Statistical model which produces a PD that is scaled to a cycle average
6 - 10 Retail Others PD > 0.03%
Overdrafts 1 Overdrafts 2,192 Observed default rates segmented in statistical score bands, scaled to a long-term average
6 - 10 Retail Revolving
PD > 0.03%
Social Housing
1 Social Housing 783 Expert judgment rating model
N/A Low default portfolio
Corporates PD > 0.03%
A&L Models (FIRB)
2 - MRA- Credit Edge
5,967 Statistical rating model for Corporates
>10 Corporates PD > 0.03%
A&L Modelos (Slotting)
3 - IPRE- Object Finance- Project Finance
1,105 Slotting criteria N/A Corporates N/A
LGD Mortgages 1 Mortgages 29,132 Loss estimates and writeoff probability based on internal data, stressed to a downturn situation
1 - 5 Retail Mortages
LGD> 10% at portfolio level
Consumer 1 Consumer 2,130 Loss estimates and writeoff probability based on a regression, with expert judgment where appropriate
1 - 5 Retail Others No
Overdrafts 1 Overdrafts 2,192 Loss estimates and writeoff probability based on internal data, using a long-term average
1 - 5 Retail Revolving
No
Social Housing
1 Social Housing 783 Estimate based on data on the realisable value of the collateral
N/A Low default portfolio
Corporates No
A&L Models (FIRB)
2 - MRA- Credit Edge
5,967 Foundation IRB >10 years (only Corporates)
Corporates No
A&L Modelos (Slotting)
3 - IPRE- Object Finance- Project
Finance
1,105 Slotting criteria N/A Corporates N/A

2017 Pillar 3 Disclosures 109
Main summary
Chapter summary
Enhanc. table
List of tables
UK portfolios (contd.)
31 Dec. 2017
Compo-nent Portfolio
No. of significantmodels
Portfolio RWAThousands of Euros
Description of model and methodology
No. of years of loss data Basel category Regulatory
floors appliedNº Description
EAD Mortgages 1 Mortgages 29,132 Long-term CCD estimates applied to on- and off-balance sheet totals
6 - 10 Retail Mortgages
EAD must be at least equal to the current utilisation of the balance at account level
Consumer 1 Consumer 2,130 Regression model 6 - 10 Retail Others
Overdrafts 1 Overdrafts 2,192 Long-term CCD estimates applied to on- and off-balance sheet totals
6 - 10 Retail Revolving
Social Housing
1 Social Housing 783 Estimate based on data N/A Low default portfolio
Corporates
A&L Models (FIRB)
2 - MRA- Credit Edge
5,967 Foundation IRB >10 years (only Corporates)
Corporates
A&L Modelos (Slotting)
3 - IPRE- Object Finance- Project Finance
1,105 Slotting criteria >10 years (only Corporates)
Corporates

2017 Pillar 3 Disclosures
3. CREDIT RISK
110
Portuguese portfolios
31 Dec. 2017
Compo-nent Portfolio
No. of significantmodels
Portfolio RWAThousands of Euros
Description of model and methodology
No. of years of loss data
Basel category Regulatoryfloors applied
Nº Description
PD Non-standardised corporates
3 - Corporates- Chambers- Real estate developers
3,694
Statistical model, based on internal data which calibrates the scoring model, performing a cyclical adjustment.
>10
Corporates
PD > 0.03%
Standardised corporates
2 - Private individual- Legal entity
330 Retail Others
Retail mortgage 1 Retail mortgage
3,296 Retail Mortgages
Retail non-mortgage
3 - Credit Cards- Consumer- Other Retail
600 Retail Revolving and others
LGD Non-standardised corporates
3 - Corporates- Chambers- Real estate developers
3,694
Statistical model, based on internal recovery data. Downturn period based on the cycle’s worst years.
6 - 10
Corporates
No
Standardised corporates
2 - Private individuals- Legal entities
330 Retail Others
Retail mortgage 1 Retail mortgage
3,296 Retail Mortgages
Retail non-mortgage
1 Retail non-mortgage
600 Retail Revolving and others
EAD Non-standardised corporates
3 - Corporates- Chambers- Real estate developers
3,694
Statistical model, in which the internal balance information observed in default is used to obtain a CCF
6 - 10
Corporates
EAD must be at least equal to the current utilisation of the balance at account level
Standardised corporates
2 - Private individuals- Legal entities
330 Retail Others
Retail 1 Retail 3,896 Retail Revolving and others

2017 Pillar 3 Disclosures 111
Main summary
Chapter summary
Enhanc. table
List of tables
Mexican portfolios
31 Dec. 2017
Compo-nent Portfolio
No. of significantmodels
Portfolio RWAThousands of Euros
Description of model and methodology
No. of years of loss data Basel category Regulatory
floors applied
Nº
PD Non-standardised corporates
1 3,017
Statistical model, based on internal default experience. Adjusted to the economic cycle
6 - 10 Corporates
PD > 0.03%
State and municipal governments and public bodies
1 437 Institutions
Real state developers 1 572 Corporates
LGD Non-standardised corporates
1 3,017 Statistical model, based on internal recovery data
6 - 10 Corporates
No
State and municipal governments and public bodies
1 437 In accordance with Appendix 18 of the current General Provisions Applicable to Credit Institutions (Single Banking Circular)
N/A(For this portfolio default observations are not used)
Institutions
Real state developers 1 572 Statistical model, based on internal recovery data
6 - 10 Corporates
EAD State and municipal governments and public bodies, non-standardised corporates and commercial real estate
1 4,026 A prudential proxy has been used because the available balance in these lending operations is not recorded. Specific CCF for technical and financial guarantees and letters of credit
6 - 10 Corporates/Institutions
No
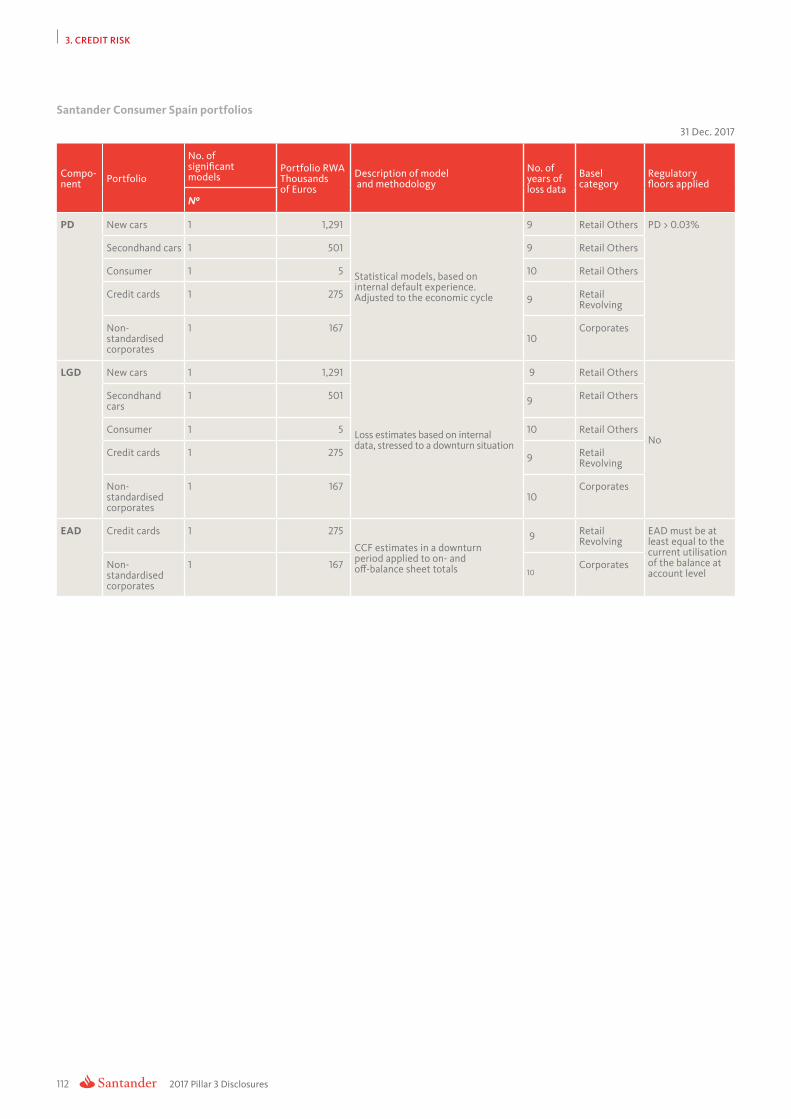
2017 Pillar 3 Disclosures
3. CREDIT RISK
112
Santander Consumer Spain portfolios
31 Dec. 2017
Compo-nent Portfolio
No. of significantmodels
Portfolio RWAThousands of Euros
Description of model and methodology
No. of years of loss data
Basel category
Regulatoryfloors applied
Nº
PD New cars 1 1,291
Statistical models, based on internal default experience. Adjusted to the economic cycle
9 Retail Others PD > 0.03%
Secondhand cars 1 501 9 Retail Others
Consumer 1 5 10 Retail Others
Credit cards 1 275 9 Retail Revolving
Non-standardised corporates
1 16710
Corporates
LGD New cars 1 1,291
Loss estimates based on internal data, stressed to a downturn situation
9 Retail Others
No
Secondhandcars
1 501 9 Retail Others
Consumer 1 5 10 Retail Others
Credit cards 1 275 9 Retail Revolving
Non-standardised corporates
1 16710
Corporates
EAD Credit cards 1 275
CCF estimates in a downturn period applied to on- and off-balance sheet totals
9 Retail Revolving
EAD must be at least equal to the current utilisation of the balance at account level
Non-standardised corporates
1 16710
Corporates
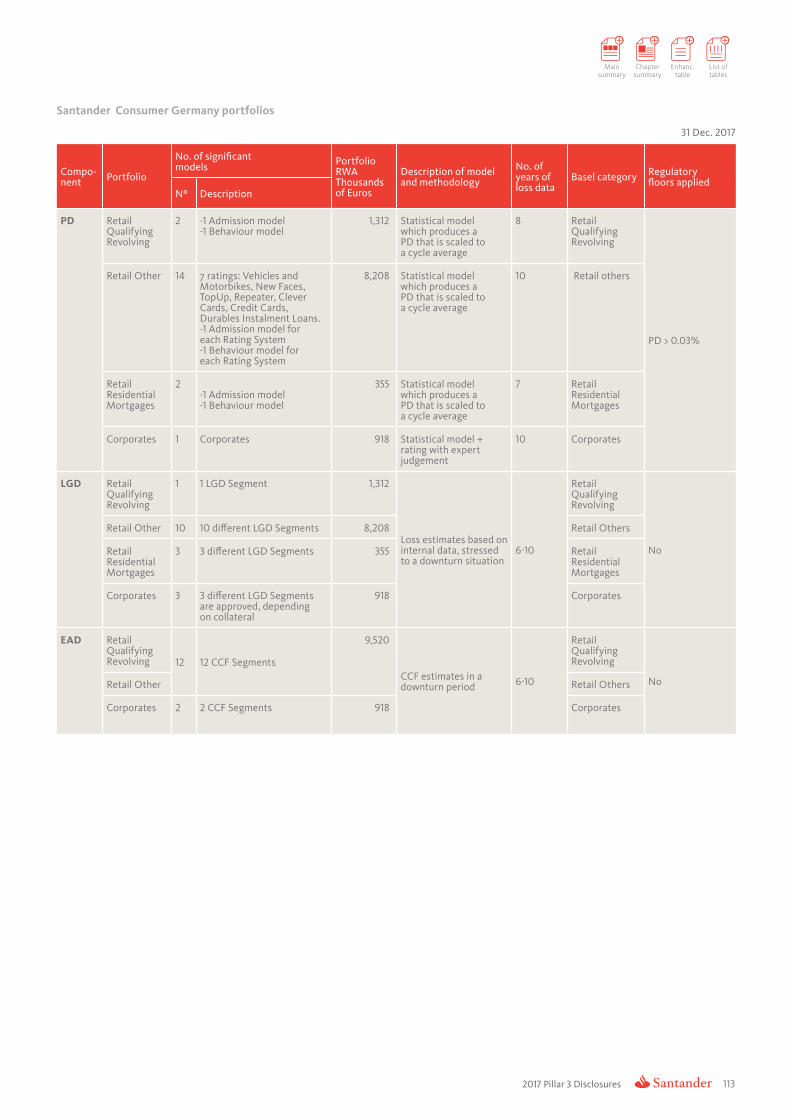
2017 Pillar 3 Disclosures 113
Main summary
Chapter summary
Enhanc. table
List of tables
Santander Consumer Germany portfolios
31 Dec. 2017
Compo-nent Portfolio
No. of significantmodels Portfolio
RWAThousands of Euros
Description of model and methodology
No. of years of loss data
Basel category Regulatoryfloors applied
Nº Description
PD Retail Qualifying Revolving
2 -1 Admission model-1 Behaviour model
1,312 Statistical model which produces a PD that is scaled to a cycle average
8 Retail Qualifying Revolving
PD > 0.03%
Retail Other 14 7 ratings: Vehicles and Motorbikes, New Faces, TopUp, Repeater, Clever Cards, Credit Cards, Durables Instalment Loans. -1 Admission model for each Rating System-1 Behaviour model for each Rating System
8,208 Statistical model which produces a PD that is scaled to a cycle average
10 Retail others
Retail Residential Mortgages
2-1 Admission model-1 Behaviour model
355 Statistical model which produces a PD that is scaled to a cycle average
7 Retail Residential Mortgages
Corporates 1 Corporates 918 Statistical model + rating with expert judgement
10 Corporates
LGD Retail Qualifying Revolving
1 1 LGD Segment 1,312
Loss estimates based on internal data, stressed to a downturn situation
6-10
Retail Qualifying Revolving
No
Retail Other 10 10 different LGD Segments 8,208 Retail Others
Retail Residential Mortgages
3 3 different LGD Segments 355 Retail Residential Mortgages
Corporates 3 3 different LGD Segments are approved, depending on collateral
918 Corporates
EAD Retail Qualifying Revolving 12 12 CCF Segments
9,520
CCF estimates in a downturn period 6-10
Retail Qualifying Revolving
NoRetail Other Retail Others
Corporates 2 2 CCF Segments 918 Corporates

2017 Pillar 3 Disclosures
3. CREDIT RISK
114
Nordic countries porfolios
31 Dec. 2017
Compo-nent Portfolio
No. of significantmodels
Portfolio RWAThousands of Euros
Description of model and methodology
No. of years of loss data Basel category Regulatory
floors applied
Nº
PD Auto PP Norway
1 1,274
Statistical model which produces aPD that is scaled to a cycle average. 5 Retail Others PD > 0.03%Auto PP
Sweden1 904
Auto PP Finland
1 917
LGD Auto PP Norway
1 1,274
Loss estimates based on internal data,stressed to a downturn situation. 5 Retail Others NoAuto PP
Sweden1 904
Auto PP Finland
1 917
EAD Auto PP Noruega
1 1,274
N/A - Retail Others NoAuto PP Suecia
1 904
Auto PP Finlandia
1 917
PSA France portofios
31 Dec. 2017
Compo-nent Portfolio
No. of significantmodels Portfolio RWA
Thousands of Euros
Description of model and methodology
No. of years of loss data
Basel category
Regulatoryfloors applied
Nº Description
PD Retail 1 Individuals 3,097
Statistical model generating a PD long-run based on 5 years of losses. 1 - 5
Retail Others
PD > 0.03%
Companies with balance sheet
1 Companies with balance sheet
Retail Others
Companies without balance sheet
1 Companies without balance sheet
Retail Others
Corporate Dealers
1 Corporate Dealers
2,542 Corporates
Corporates Fleet
1 Wholesale Fleet 656 Corporates
LGD Retail 1 Individuals 3,097 Model based on internal recovery information, stressed to a downturn situation.
> 10 Retail Others
N/ACorporate Dealers
1 Consumer 2,542 Foundation IRB. N/A Corporates
Corporates Fleet
1 Overdraft 656 Foundation IRB. N/A Corporates
EAD Retail 1 Individuals 3,097 Long-term CCF estimations applied to both On/Off Balance sheet balances.
6 - 10 Retail OthersEAD must be at least equal to the current utilisation of the balance at account level.
Corporate Dealers
1 Consumer 2,542 Foundation IRB. N/A Corporates
Corporates Fleet
1 Overdraft 656 Foundation IRB. N/A Corporates

2017 Pillar 3 Disclosures 115
Main summary
Chapter summary
Enhanc. table
List of tables
The use of economic capital figures in determining management compensation and setting capital and RoRAC-related targets for the business units further reinforces the integration of economic capital in management.
Moreover, and for the purpose of adopting IFRS9 on provisions, parameter estimates are used when calculating provisions for credit risk.
For further details regarding IFRS9, please refer to Chapter 5, Section C.1.2.5 from 2017 Annual Report available on the Santander Group website.
3.6. Recognition of credit risk mitigationWhen calculating regulatory capital, credit risk mitigation techniques affect the value of the risk parameters used to determine capital. Identifying and valuing the security associated with the contracts is key here and a distinction is drawn between type of guarantee: collateral and personal guarantees. This mitigation process is carried out whenever the validity of the guarantee has been checked and it is believed they may be enforced. The mitigation process is described in the following section.
Firstly, in portfolios where PD is assigned at customer level, personal guarantees are assessed. Personal guarantees affect the final PD value by effectively replacing the counterparty’s PD under the transaction with the guarantor’s PD. Here, we compare the Risk Weight (RW) of the transaction obtained by applying the customer’s PD with the RW of the transaction calculated by employing the guarantor’s PD. The final PD is the one that generates the lowest RW value.
Secondly, the existence of any associated collateral is verified.for all transaction types (retail and non-retail). Under the IRB approach, the existence of collateral impacts the final value of the LGD used to calculate the capital. The process also factors in potentially significant factors such as product type and transaction balance. In the case of mortgage collateral, the LGD of the transaction will depend on the loan-to-value (LTV) ratio, as well as the length of time the loan has remained on the Bank’s balance sheet.
Mitigation with collateral is carried by securing part of the EAD with one or more guarantees. Accordingly, the final LGD on the transaction will be the average LGD obtained by adding the LGD of each guarantee divided by the amount covered by the guarantee, to the original LGD divided by the part of the exposure not secured by guarantees. This sum is then divided by the full original exposure and the result is the final adjusted LGD.
3.5. Uses of the internal parameter estimatesOne major application of the PD, LGD and EAD credit risk parameters is to determine minimum capital requirements within the CRR framework.
The CRR states that said parameters and their associated metrics, including expected and unexpected loss, are to be used not only for regulatory purposes but also for internal credit risk management.
In Santander Group, the internal credit risk parameter estimates are used in a variety of management tools, including pre-classifications, economic capital allocation, RoRAC (return on risk-adjusted capital) calculation, stress testing, and scenario analyses, the results of which are reported to senior management through various internal committees.
When analysing scenarios, a relationship is established between the credit risk parameters and variables reflecting the economic situation, such as unemployment, GDP growth, interest rates, and so on. This relationship can then be used to estimate credit risk in different macroeconomic scenarios, especially in stress situations.
The pre-classification tool is used to assign limits to customers based on their risk characteristics. In the Santander Global Corporate Banking (SGCB) segment, limits are set not only in terms of exposure but also in terms of economic capital, which is calculated using the credit risk parameters. Under the pre-classification policy every approved transaction “uses” a certain amount of the assigned maximum exposure, depending on the transaction’s risk characteristics such as term and collateral. This system ensures that the credit approval policy remains flexible yet rigorous in terms of risk control.
Through the calculation and allocation of economic capital, all the different types of risks arising from the lending business are integrated in a single measurement, combining credit risk measurement with the measurement of other risks, including market, operational, business and on-balance-sheet interest rate risk. The economic capital allocation at the business unit level provides a view of the distribution of risk by business activity and geographical area, taking the benefits of diversification into account. By relating economic capital to financial results, it is possible to calculate the risk-adjusted return (RoRAC), which can be compared with the cost of capital to get an idea of how each unit contributes to value creation at Santander Group.
The credit risk parameters are needed for these calculations, and although the parameter values used for economic capital purposes do not coincide exactly with those used for regulatory purposes, the estimation and allocation methodology is comparable and the same databases are used in both cases.

2017 Pillar 3 Disclosures
3. CREDIT RISK
116
3.7. Internal rating system controlA fundamental part of the process carried out by Santander Group to implement advanced models entails establishing robust control and review mechanisms by the Internal Validation and Internal Audit Areas so as to efffectively monitor and validate the valuation models and their integration in risk management, risk parameters, integrity and quality of information, documentation of the capital calculation process, governance, risk model, technological environment, etc.
The functional segregation model applicable to Santander Group involves a model with diffferent levels of control structured around three lines of defence with an organizational structure and independent, clearly defined functions:
• 1st line (Model Owner and Methodology),
• 2nd line (Model Risk, Internal Validation, Capital Risk, and Risk Control and Supervision Units) and
• 3rd line (Internal Audit).
This separate organizational and functional structure ensures the compliance with the regulatory requirements established in the IRB models:
a) Existence of a strong governance model.
b) Existence, separation and independence of the Risk Control and Supervision, Internal Validation and Internal Audit areas.
c) Independent annual reviews by Internal Validation and Internal Audit.
d) Communication processes with Management which ensure all associated risks are reported.
e) Especific analysis of the rating systems by the capital risk function
3.7.1. Model riskSantander Group has wide experience in the use of models to help make all kinds of decisions, especially risk management decisions.
A model is defined as a system, approach or quantitative method that applies theories, techniques and statistical, economic, financial and mathematical facts to transform input data into quantitative estimates. Models are simplified representations of real-world relationships between characteristics, values and observed facts. This simplification allows for focusing attention on specific aspects considered to be the most important for the application of a given model.
The use of models exposes the Bank to model risk, which is defined as the potential adverse consequences of decisions based on incorrect, inadequate or improperly used models.
According to this definition, the sources of this risk are as follows:
• the model itself, due to the use of incorrect or incomplete data, or due to the modelling method used and its implementation in systems.
• improper use of the model
Model risk may result in financial loss, inappropriate commercial or strategic decisions or damage to the Group’s reputation.
Santander Group has been working on the definition, management and control of model risk in recent years, and in 2015 a specific department was set up within its Risks division to control this risk.
Management and control functions are performed at both the Corporate Centre and at the Group’s main companies and entities. These functions are governed by the model risk framework, which applies standardised principles, responsibilities and processes across the entire Group and addresses aspects relating to organisation, governance, management and validation of models, among other matters.
The model risk control committee, chaired by he Deputy Chief Risk Officer, is the collegiate body tasked with supervising and controlling model risk at Santander Group. The purpose of the committee is to effectively control model risk, while advising the head of the risk function (Chief Risk Officer) and the risk control committee and ensuring that model risk is monitored and remains within the Group’s risk appetite approved by the board of directors. This process requires the committee to identify and track both existing and emerging model risk and determine its impact on the Group’s risk profile.
The model approval sub-committee is largely responsible for authorising use of the models. There is currently a system in place for delegating powers whereby models with the least relative importance are approved locally and reported periodically to the model approval sub-committee.
The senior management at Santander Group possesses in-depth knowledge of the more important models. It also regularly monitors model risk through a set of reports that provide a consolidated view of the risk and enable the right decisions to be taken.
The task of managing and controlling model risk is structured around a set of processes spanning the model’s life cycle. The following diagram shows the various phases of the model life cycle at Santander Group.

2017 Pillar 3 Disclosures 117
Main summary
Chapter summary
Enhanc. table
List of tables
Model identification
Model planningModel
development
Model validation
Model approval
Model implementation
and use
Model monitoring and control
1
23
4
5
67
1. IdentificationAs soon as a model is identified, it must be included within the model risk control process.
To ensure proper management of model risk, a complete and exhaustive inventory of all models in use is essential.
Santander Group keeps a centralised inventory, created on the basis of a uniform taxonomy for all models used at the various business units. The inventory contains all relevant information on each of the models, enabling all of them to be properly monitored according to their relevance. One of the key pieces of information contained in the inventory is its tier, which determines how the model should be managed. The tier reflects the model’s level of relevance, both in quantitative terms and in view of other unquantifiable criteria.
The inventory enables transversal analyses to be conducted on the information (by geographic area, model type, importance, etc.), thus facilitating the task of making strategic decisions in relation to the models.
2. PlanningThis phase involves all parties involved in the model’s life cycle (owners and users, developers, validators, data providers, technology, etc.) and priorities are agreed upon for all models to be developed, reviewed and implemented over the year.
Model planning takes place each year at each of the Group’s main units. The planning is approved by local governance bodies and then validated at the Corporate Centre.
3. DevelopmentThis is essentially the model’s construction phase, based on the needs laid down in the models plan and the relevant information provided by specialists.
Most of the models used by Santander Group are developed by internal methodology teams, though some models are also acquired from external providers. In both cases, development takes the form of a standard process defined by the corporation for the entire Group. This effectively guarantees the quality of the models used for decision-making.
4. Independent validationIndependent model validation is not only a regulatory requirement in certain cases, but also a key element to ensure the proper management and control of model risk at Santander Group.
The Group has therefore set up a specialised unit that is fully independent of both developers and users. This unit issues an expert opinion on the fitness for purpose of the internal models and a set of conclusions on their robustness, utility and effectiveness. The validation opinion takes the form of a score that summarises the model risk associated with the model.
Internal validation brings all models within the model risk control process, ranging from the models used in the risk function (models for credit risk, market risk, structural or operational risk, models for economic and regulatory capital risk, models for provisions, stress test models, etc.) to other types used in different functions that support decision making.
The scope of the validation extends not only to the more theoretical or methodological aspects, but also technological systems and the quality of the data relied on to ensure their effectiveness. All relevant aspects are typically included in the management process: controls, reporting, uses, involvement of the senior management, etc.
This corporate internal validation environment at Santander Group is fully aligned with the internal validation criteria of advanced models emanating from the Group’s various supervisors. This maintains the criterion of a separation of functions for units developing and using the models (first line of defence), internal validation units (second line of defence) and internal audit (third line of defence) as the ultimate layer of control, checking the effectiveness of the function and its compliance with internal and external policies and procedures, and commenting on its level of effective independence.
5. ApprovalBefore being implemented and used, a model must be submitted for approval at the relevant bodies, in accordance with the internal regulations in effect and approved delegation processes.
6. Implementation and useIn this phase the newly developed model is implemented within the system in which it is to be used. As already mentioned, the implementation phase is another possible source of model risk, and it is therefore essential that tests are conducted by technical units and the owners of the model so as to certify that it has been implemented in accordance with the methodological definition and to check that it functions as expected.
7. Monitoring and controlModels must be regularly reviewed to ensure that they continue to function correctly and that they remain fit for purpose. If they are not, they must be adapted or redesigned accordingly.

2017 Pillar 3 Disclosures
3. CREDIT RISK
118
In addition, control teams ensure that model risk is being managed in accordance with the principles and standards laid down in the model risk framework and related internal rules and regulations.
GovernanceThe Model Risk Management Framework stipulates that the body taking responsibility for authorizing risk management models to be used is the Models Committee. Each business unit has a Models Committee which takes responsibility for decisions concerning approval of the local usage of these models when the approval of the Corporate Models Committee has been secured. Under the current policy, all models submitted to a Models Committee must have an internal validation report.
The following table summarizes the scores assigned to the credit risk models as a result of Internal Validation’s review of credit risk parameters and rating models during 2017.
PD
51 %
37 %
8% 4 %
Low Moderate-low Moderate Moderate-high High
LGD
23 %
62 %
1 %14 %
Low Moderate-low Moderate Moderate-high High
EAD
49 %26 %
8 %
17 %
Low Moderate-low Moderate Moderate-high High
SCORING
11 %
36 %
5 %
48 %
Low Moderate-low Moderate Moderate-high High
RATING
14 %23 %
63 %
Low Moderate-low Moderate Moderate-high High
The quality of the model is shown by its final rating, which indicates the model’s risk on the following scale:
1) Low: model is used correctly and performs adequately. The quality of the data used in developing the model is good. The methodology employed complies with the defined standards and best practices. The documentation on regulatory aspects and processes relating to the model is clear and complete. Any deficiency is immaterial and does not affect the model’s performance.
2) Moderate-low: model is used correctly and performs adequately. The assumptions used in developing the model are reasonable. There are aspects that need to be improved but they are not crucial or material. There are not thought to be any problems affecting implementation and use of the model. The benefits of any changes to the model must be considered in relation to the costs of the changes.
3) Moderate: model is used correctly and performs adequately. The assumptions used in developing the model are reasonable. There are aspects of the model that need to be improved. Any deficiencies should be made good in the medium term or based on a cost-benefit analysis.
4) Moderate-high: there are deficiencies in the model’s performance or use. The model’s assumptions, the quality of the data in the development sample or the model’s predictions are questionable. It is highly advisable that certain shortcomings be remedied or plans be made to remedy them in the short term, before the model is implemented or used. Other alternatives in the development to mitigate model risk should be considered.
5) High: the model is not performing properly, the model is not being used for its intended purpose or the model’s assumptions are incorrect. Certain aspects must be corrected immediately. It is inadvisable to implement or use the model as presented.

2017 Pillar 3 Disclosures 119
Main summary
Chapter summary
Enhanc. table
List of tables
3.7.2. Internal AuditInternal Audit is part of the third line of defence. The analysis carried out by this independent team covers five main areas of activity:
1) Reviewing compliance with the Group’s internal governance model and the model required by the regulators, while verifying the Group’s organisational structure and set of committees allow for sound management of IRB models and the calculation of regulatory capital.
2) Managing models and their adequacy and integration. Analysing compliance with requirements for managing model life cycles so as to identify and minimise the risks associated with building and using models and making them part of the management and also determining the sufficiency of the controls in place.
3) Seeing to it that the risk is correctly managed, while verifying the consistency and integrity of databases and the mode construction process. Reviewing the reporting control environment and the quality and integrity of the data contained in Basel databases (corporate datamart).
4) Reviewing the capital calculation and reporting process.
5) Analysing the technical aspects and applications of the technological environment. Examining the robustness, reliability and security of the infrastructure and processes that support the estimation of parameters and the calculation of capital within the “BDR-Corporate Calculation Engine”.
After finishing its review, Internal Audit issues a report containing recommendations and observations arising from the review process signed by the unit and/or areas involved. These will stipulate a deadline in which to submit the relevant action and resolution plans. The auditors and the affected areas both regularly monitor that the improvements are carried out. Please note that the IRB model review reports are submitted directly to senior management at Santander Group and are available to supervisors (European Central Bank, Banco de España and other local supervisors).
Internal Audit also reports at the same time to the Group’s autonomous audit committee on those recommendations that have not been suitably implemented so that the underlying causes can be examined and their implementation effectively enforced. Last but not least, Internal Audit remains in direct contact with the supervisors and does so completely independently of the Risk Control and Supervision functions.
Resolution and monitoring
Senior managementUnit’s directionGroup’s audit and compliance committee
Available to:Regulators
{{
Reported to
Senior ManagementUnit’s direction
Available to:RegulatorsGroup’s audit and compliance committee
{{
Reported to:
Review:
Governance, models, integration in management, data bases, capital calculation and technological environment
Recommendation's signature
By heads and timeframes for compliance
Report publication
Action plans preparation
1
2
34
5

2017 Pillar 3 Disclosures
3. CREDIT RISK
120
3.8. Impairment losses: influencing factors and comparative analysisIn addition to the advanced approaches described above (details of which are given in the section on economic capital), other standard metrics are employed to help ensure prudent and effective credit risk management based on an assessment of losses on the portfolios.
Credit risk is continuously monitored through holistic processes that provide early warning of any incidents that might affect the credit quality of either customers or portfolios and allow the Group to prepare and take specific steps (pre-defined or ad hoc) to correct any deviation that might negatively impact the Group.
To measure and control the cost of credit risk at Santander Group, the following key metrics are used, among others:
• Cost of Credit: obtained by dividing credit risk provisions net of NPL recoveries over 12 months by average lending to customers, gross, as shown on the balance sheet in those same 12 months. Monitoring and controlling this metric reveals a direct relationship between the Group’s risk appetite and that of its units, allowing it to achieve a medium-low risk profile. The task of monitoring this metric implicitly involves monitoring net insolvency allowances (specific net allowances - recovery of NPLs).
• EL (expected loss): estimation, at a specific point of time, of the economic loss the current portfolio is expected to sustain during the following year. It is a further business cost that must be reflected in the transaction price.
• NPLV (non-performing loans variation plus net write-offs). It is the final balance less the initial balance of NPLs for the period under consideration, plus NPLs for the period, less written-off assets recovered during that period. It shows the change in the NPL rate over a period, discounting NPLs and factoring in recoveries. It is effectively an advance aggregate measure that allows the Group to react accordingly to any deterioration it may observe in the NPL rate. NPLV and its component parts are key inputs in the monitoring process.
• The recovery function also includes the management of non-productive assets (NPAs) relating to portfolios of restructured loans, doubtful loans, NPLs and foreclosed assets. Here, the Bank is able to use accelerated reduction mechanisms for these portfolios, such as by selling portfolios of loans or foreclosed assets.
These metrics allow for the permanent and systematic analysis and control of the Group’s credit risk and allow it to be monitored in terms of its adherence to reference budgets, limits and standards. The effects of future external events or strategic decisions taken internally can also be evaluated.
While these metrics measure the same reality and therefore converge in the long term, differences may exist at certain points in time and these become especially significant at the start of a change of cycle. These differences may be down to applicable accounting law and regulations (mortgages, for example, have a slower coverage and write-off timeline than consumer loans), shifting policies (such as coverage or write-off), changes in portfolio composition, doubtful assets acquired from new investees, changes in accounting law (such as IFRS 9), sales of portfolios, etc.

2017 Pillar 3 Disclosures 121
Main summary
Chapter summary
Enhanc. table
List of tables
The main figures for credit risk at December 31th 2017 arising from business with customers are shown below.
TABLE 64.KEY FIGURES OF CREDIT RISK ARISING FROM ACTIVITY WITH CUSTOMERS
Credit risk with customers1
(Millions of euros)Non-performing loans
(Millions of euros)NPL ratio
(%)
2017 2016 2015 2017 2016 2015 2017 2016 2015
Continental Europe 337,768 331,706 321,395 15,184 19,638 23,355 4.50 5.92 7.27
Spain 172,176 172,974 173,032 8,120 9,361 11,293 4.72 5.41 6.53
Santander Consumer Finance 92,589 88,061 76,688 2,319 2,357 2,625 2.50 2.68 3.42
Portugal 32,816 30,540 31,922 1,875 2,691 2,380 5.71 8.81 7.46
Poland 24,391 21,902 20,951 1,114 1,187 1,319 4.57 5.42 6.30
UK 247,625 255,049 282,182 3,295 3,585 4,292 1.33 1.41 1.52
Latin America 165,683 173,150 151,302 7,462 8,333 7,512 4.50 4.81 4.96
Brazil 83,076 89,572 72,173 4,391 5,286 4,319 5.29 5.90 5.98
Mexico 28,939 29,682 32,463 779 819 1,096 2.69 2.76 3.38
Chile 40,406 40,864 35,213 2,004 2,064 1,980 4.96 5.05 5.62
Argentina 8,085 7,318 6,328 202 109 73 2.50 1.49 1.15
US 77,190 91,709 90,727 2,156 2,088 1,935 2.79 2.28 2.13
Puerto Rico 2,944 3,843 3,924 210 274 273 7.13 7.13 6.96
Santander Bank 44,237 54,040 54,089 536 717 627 1.21 1.33 1.16
SC USA 24,079 28,590 28,280 1,410 1,097 1,034 5.86 3.84 3.66
Total Group (excl. Popular) 832,655 855,510 850,909 28,104 33,643 37,094 3.38 3.93 4.36
Banco Popular 88,313 9,492 10.75
Total Group 920,968 855,510 850,909 37,596 33,643 37,094 4.08 3.93 4.36
Coverage ratio(%)
Net ASR provisions2 (Millions of euros)
Cost of credit(% /risk)3
2017 2016 2015 2017 2016 2015 2017 2016 2015
Continental Europe 58.0 60.0 64.2 995 1,342 1,975 0.32 0.44 0.68
Spain 45.9 48.3 48.1 513 585 992 0.33 0.37 0.62
Santander Consumer Finance 101.4 109.1 109.1 266 387 537 0.30 0.47 0.77
Portugal 59.1 63.7 99.0 -12 54 72 -0.04 0.18 0.29
Poland 68.2 61.0 64.0 137 145 167 0.62 0.70 0.87
UK 32.0 32.9 38.2 205 58 107 0.08 0.02 0.03
Latin America 84.8 87.3 79.0 4,973 4,911 4,950 3.17 3.37 3.36
Brazil 92.6 93.1 83.7 3,395 3,377 3,297 4.36 4.89 4.50
Mexico 97.5 103.8 90.6 905 832 877 3.08 2.86 2.91
Chile 58.2 59.1 53.9 462 514 567 1.21 1.43 1.65
Argentina 100.1 142.3 194.2 159 107 148 1.85 1.72 2.15
US 170.2 214.4 225.0 2,780 3,208 3,103 3.42 3.68 3.66
Puerto Rico 55.2 54.4 48.5 73 96 85 2.22 2.58 2.12
Santander Bank 102.2 99.6 114.5 116 120 64 0.25 0.23 0.13
SC USA 212.9 328.0 337.1 2,590 2,992 2,954 9.84 10.72 10.97
Total Group (excl. Popular) 70.8 73.8 73.1 8,997 9,518 10,108 1.12 1.18 1.25
Banco Popular4 48.7 114 0.23
Total Group 65.2 73.8 73.1 9,111 9,518 10,108 1.07 1.18 1.25
1. Includes gross lending to customers, guarantees and documentary credits.
2. Recovered written-off assets (EUR 1,621 million).
3. Cost of credit = loan-loss provisions twelve months / average lending.
4. Provisions carried out since the Bank's acquisition in June 2017.

2017 Pillar 3 Disclosures
3. CREDIT RISK
122
Risk is diversified among the main regions where the Group operates3: Continental Europe (41%), UK (30%), Latin America (20%) and the US (9%), with a suitable balance between mature and emerging markets.
Credit risk with customers fell by 3% in 2017, considering an unchanged perimeter, mainly due to the US, Brazil and UK (as a result of exchange rate effects). Growth in local currency was generalised across all units with the exception of the United States and Spain.
These levels of lending, together with lower non-performing loans (NPLs) of EUR 28,104 million (-16% vs. 2016) reduced the Group’s NPL ratio to 3.38% (-55 b.p. against 2016).
For coverage of these NPLs, the Group recorded provisions of EUR 8,997 million (-5.5% vs. December 2016), after deducting write-off recoveries. This fall is materialised in a decrease in the cost of credit to 1.12% (6 b.p. less than the previous year).
Total loan-loss allowances were EUR 19,906 million, bringing the Group’s coverage ratio to 71%. It is important to bear in mind that this ratio is affected downwards by the weight of mortgage portfolios (particularly in the UK and Spain), since by having collateral, less provisions are required.
Note 3: Popular not included.
Note 4: Simple average of PD assigned to the clients (Non-standardised) or operations (rest of segments) who share same regulatory PD range.
3.9. Backtesting of IRB parameters3.9.1. PD backtestThe aim of the PD backtest is to assess the suitability of regulatory PDs by comparing them with the Observed Default Frequencies (ODFs) during the most recent period.
The most important of Retail and Commercial Banking's IRB portfolios were selected:
• Santander Spain: Individualised Corporates, Mortgages, Consumer, Cards and Loans to Individuals.
• Santander Totta: Corporates and Mortgages
• Santander UK: Personal mortgages
• Santander Consumer Spain: Corporates, Cards, Consumer and Auto New
• Santander Consumer Germany: Corporates, Mortgages, Retail Qualifying Revolving, other Retail
• Santander Consumer Nordics: Finland, Norway and Sweden auto private persons.
• Santander Mexico: Corporates.
For each portfolio, regulatory PD buckets are established and for each of these the average PD assigned for regulatory capital purposes is compared with the ODF. To observe defaults, a sample of transactions and customers that were not in default at a reference date is selected, and the rate of new NPLs among this sample over the subsequent 12-month period is observed.
Regulatory PD is a through-the-cycle (TTC) PD, meaning a long-term average that is not tied to any particular point in the cycle. Default frequency, in contrast, is observed at a particular point in time (2017). Given the different nature of these two measurements, the comparison cannot be used to test the predictive capacity of the regulatory PDs, but it can be useful to gauge the size of the cycle adjustment used to determine TTC PD.
To complete the analysis, the observed default frequency is also compared with the point-in-time (PIT) PD, which is influenced by the cyclical situation of the observation period. This comparison can be used to test the slope of the PD curve against the observed NPL frequency in each rating band.
In some of the following charts do not show the first PD bucket. This first band may include some very high values because it includes transactions under special situations (cure, irregular etc.). Including it would therefore distort the scale of the charts and contaminate the assessment of the most populated PD bands.
The charts below summarise the information in the portfolios that were analysed.

2017 Pillar 3 Disclosures 123
Main summary
Chapter summary
Enhanc. table
List of tables
CORPORATES ODF VS. PD
Corporate portfolios are showing volatile behaviour due to the low number of defaults. Nevertheless, a significant pattern can be seen in all geographies. These portfolios present, to a greater or lesser extent, PD TTC levels that are higher than the default frequencies observed in 2017. This is a reflection of the currently favourable economic situation, as new defaults are either below or quite near average levels of the cycle. As an exception to this behaviour, the Mexico portfolio shows certain ODFs that are slightly higher than the estimated TTC PDs.
6
0%
20%
10%
SC SPAIN NON-STANDARDISED
21 43
ODF PD PIT PD TTC
0.00%
2.00%1.80%1.60%1.40%
1.00%0.80%0.60%0.40%0.20%
1.20%
SC GERMANY CORPORATES
21 3
ODF PD PIT PD TTC
SANTANDER TOTTA CORPORATES
1 2 30%
20%
15%
10%
5%
ODF PD PIT PD TTC
0%
5%
10%
MEXICO CORPORATES
1 2 3
ODF PD PIT PD TTC
5
SPAIN CORPORATES
210%
8%
6%
4%
2%
12%
10%
43
ODF PD PIT PD TTC

2017 Pillar 3 Disclosures
3. CREDIT RISK
124
Mortgages shows a similar performance to corporates: new NPLs are typically lower than the cycle average. A case in point here is the UK, where TTC PDs are well above the ODFs. Given the ongoing economic recovery in Spain, the ODF series is well above the average levels representing long-term PDs.
MORTGAGES ODF VS. PD
SPAIN RETAIL MORTGAGES
210.00%0.10%0.20%
0.50%0.40%0.30%
0.80%0,.70%0.60%
4 5 63
ODF PD PIT PD TTC
UK RETAIL MORTGAGES
1 2 3 4 5 60%
5%
10%
15%
20%ODF PD PIT PD TTC
SANTANDER TOTTA RETAIL MORTGAGES
1 2 3 4 5 6 7 80.0%
0.5%
1.0%
1.5%
2.0%
2.5%
3.0%
3.5% ODF PD PIT PD TTC

2017 Pillar 3 Disclosures 125
Main summary
Chapter summary
Enhanc. table
List of tables
CONSUMER AND CREDIT CARDS ODF VS. PD
21 4 53
SC SPAIN RETAIL OTHERS
0%
10%
15%
5%
SPAIN CONSUMER LOANS
210%
2%
1%
5%
4%
3%
4 5 6 7 8 93
SC GERMANY RETAIL OTHERS
210.0%
1.8%1.6%1.4%
1.0%0.8%0.6%0.4%0.2%
1.2%
3 4
SC GERMANY RETAIL QUALIFYING REVOLVING
310.0%
0.5%
1.0%
1.5%
2.0%
2
SPAIN CREDIT CARDS
210%
8%6%4%2%
14%12%10%
4 53
SC SPAIN CREDIT CARDS
210%
20%
30%
10%
4 5 6 7 83
SC SPAIN AUTO-NEW
210%
5%
4%
3%
2%
1%
4 5 6 7 83
SC SPAIN AUTO-USED
210%
5%
6%
4%
3%
2%
1%
4 5 63
ODF PD PIT PD TTC ODF PD PIT PD TTC
ODF PD PIT PD TTC ODF PD PIT PD TTC
ODF PD PIT PD TTC ODF PD PIT PD TTC
ODF PD PIT PD TTC ODF PD PIT PD TTC

2017 Pillar 3 Disclosures
3. CREDIT RISK
126
In the consumer finance and cards portfolios, the situation is relatively similar to that seen in Corporates and Mortgages. In Spain, these portfolios show the same convergence already seen between the OD series and the average PD levels of the cycle, coming in slightly below the TTC PDs. In Santander Consumer (Germany, Spain and Nordics), TTC PDs remain above observed defaults, particularly in the highest PD buckets.
SC NORWAY AUTO PRIVATE PERSONS
1 2 3 4 5 6 7 80%
15%
10%
5%
20%
25%
30%
SPAIN CREDITS
210%
8%
6%
4%
2%
12%
10%
4 53
SC SWEDEN AUTO PRIVATE PERSONS
1 2 3 4 50%
2%
4%
6%
8%
SC FINLAND AUTO PRIVATE PERSONS
1 2 3 4 50%
5%
10%
15%
20%
ODF PD PIT PD TTC
ODF PD PIT PD TTC
ODF PD PIT PD TTC
ODF PD PIT PD TTC

2017 Pillar 3 Disclosures 127
Main summary
Chapter summary
Enhanc. table
List of tables
As noted, corporate portfolios are showing the highest degree of volatility due to relatively low number of defaults. This reflected in the very wide confidence intervals in all cases except Spain. For Santander Consumer Spain, Santander Consumer Germany and Mexico, ODFs are very centrally located within confidence intervals. While narrower intervals are generated in Spain and at Totta, with greater volatility of ODFs around those intervals, ODFs are close to the lower limit of the confidence interval, especially in buckets of better credit quality.
Complementary to the above analyses, confidence intervals have been calculated for the PIT PD and the upper and lower limits of the forecasts have been compared with the defaults actually observed. The larger the number of transactions considered, the narrower the intervals, thus reflecting the greater accuracy of the estimates.
CORPORATES ODF VS. LIMIT
SANTANDER TOTTA CORPORATES
1 2 3 40%2%
16%14%12%10%
8%6%4%
ODF Lower Limit Upper Limit
ODF Lower Limit Upper Limit
ODF Lower Limit Upper Limit
ODF Lower Limit Upper Limit
ODF Lower Limit Upper Limit
SC SPAIN NON-STANDADISED
210%
30%
25%
20%
10%
5%
15%
43
SCF GERMANY DEALERS
210%
1.2%
1%
0.8%
0.4%
0.2%
0.6%
3
MEXICO CORPORATES
1 2 30%
5%
10%
SPAIN CORPORATES
210%
8%
6%
4%
2%
10%
4 5 63

2017 Pillar 3 Disclosures
3. CREDIT RISK
128
In mortgages, the intervals are very narrow due to the high number of transactions. In all cases, FDOs typically concentrate around the defined confidence intervals apart from the occasional lower credit quality bucket, which are generally slightly below the lower limit.
MORTGAGES ODF VS. LIMIT
SPAIN RETAIL MORTGAGES
210.00%
0.20%
0.40%
0.60%
0.80%
1.00%
4 5 63
SANTANDER TOTTA RETAIL MORTGAGES
2 3 4 5 6 7 8 90.0%0.2%0.4%0.6%0.8%
1.0%1.2%1.4%1.6%1.8%2.0%
UK RETAIL MORTGAGES
1 2 3 4 5 60%
1%
2%
3%
4%
5%
6%
7%
ODF Lower Limit Upper Limit ODF Lower Limit Upper Limit
ODF Lower Limit Upper Limit

2017 Pillar 3 Disclosures 129
Main summary
Chapter summary
Enhanc. table
List of tables
CONSUMER AND CREDIT CARDS ODF VS. LIMIT
SC SPAIN CREDIT CARDS
210%
6%
9%
12%
15%
3%
4 5 6 7 83
SC SPAIN RETAIL OTHERS
210%
2%
3%
4%
5%
1%
4 53
SC SPAIN AUTO-USED
210%
4%
3%
2%
1%
4 5 63
SCF GERMANY RETAIL QUALIFYING REVOLVING
210%
0.2%
1.2%
1%
0.8%
0.6%
0.4%
3
SPAIN CREDIT CARDS
210%
8%
6%
4%
2%
10%
4 53
SC SPAIN AUTO-NEW
210%
4%
3%
2%
1%
4 5 6 7 83
SPAIN CONSUMER LOANS
210%
2%
1%
6%
4%
5%
3%
4 5 6 7 8 93
SC SPAIN RETAIL OTHERS
210%
8%
6%
4%
2%
10%
4 53
ODF Lower Limit Upper Limit ODF Lower Limit Upper Limit
ODF Lower Limit Upper Limit ODF Lower Limit Upper Limit
ODF Lower Limit Upper Limit ODF Lower Limit Upper Limit
ODF Lower Limit Upper Limit ODF Lower Limit Upper Limit

2017 Pillar 3 Disclosures
3. CREDIT RISK
130
CONSUMER AND CREDIT CARDS ODF VS. LIMIT (CONTD.)
Confidence intervals are typically narrow among the rest of the retail portfolios, especially in the cards portfolio in Spain due to the high number of transactions. As an exception, intervals are wide in the revolving retail portfolio of Santander Consumer Germany and the ODF values are concentrated in those intervals. For the rest of the Santander Consumer Germany portfolios, ODFs are somewhat above the upper limit in the high tranches of PD, although they fall back within the interval in the lower PDs. For the credit facility portfolio in Spain, ODFs are located around the upper limit, mainly for those tranches presenting the best credit quality. In the case of the Loans Spain portfolio, ODFs oscillate around both limits where the higher PD tranches are slightly below the confidence interval.
However, ODFs of the portfolios of Santander Consumer Nordics tend to align with the lower limit, and even below it in some cases.
Intervals are slightly wider for the Santander Consumer Spain and the Santander Spain credit facility portfolio, where in general the ODFs appear more centred, albeit in certain cases oscillating between the lower and upper limits.
SC NORWAY AUTO PRIVATE PERSONS
1 2 3 4 5 6 7 80%
15%
10%
5%
20%
25%
SC SWEDEN AUTO PRIVATE PERSONS
1 2 3 4 50%
2%
3%
1%
4%
6%
5%
SC FINLAND AUTO PRIVATE PERSONS
1 2 3 4 50%
1%
2%
3%
4%
5%
6%
SC GERMANY RETAIL OTHERS
1 2 3 40%
0.1%
0.2%
0.3%
0.4%
0.5%
0.6%ODF Lower Limit Upper Limit ODF Lower Limit Upper Limit
ODF Lower Limit Upper Limit ODF Lower Limit Upper Limit
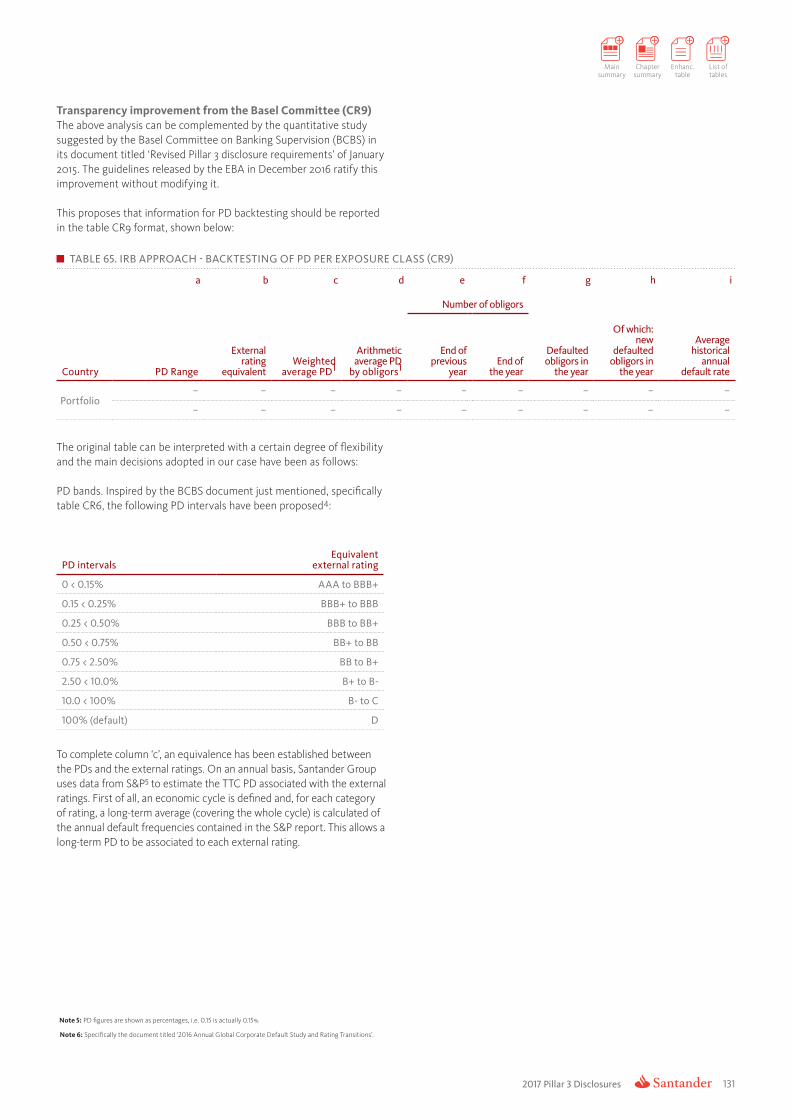
2017 Pillar 3 Disclosures 131
Main summary
Chapter summary
Enhanc. table
List of tables
Transparency improvement from the Basel Committee (CR9)The above analysis can be complemented by the quantitative study suggested by the Basel Committee on Banking Supervision (BCBS) in its document titled ‘Revised Pillar 3 disclosure requirements’ of January 2015. The guidelines released by the EBA in December 2016 ratify this improvement without modifying it.
This proposes that information for PD backtesting should be reported in the table CR9 format, shown below:
TABLE 65. IRB APPROACH - BACKTESTING OF PD PER EXPOSURE CLASS (CR9)
a b c d e f g h i
Country PD Range
External rating
equivalentWeighted
average PD1
Arithmetic average PD
by obligors1
Number of obligors
Defaulted obligors in
the year
Of which: new
defaulted obligors in
the year
Average historical
annual default rate
End of previous
yearEnd of
the year
Portfolio– – – – – – – – –
– – – – – – – – –
The original table can be interpreted with a certain degree of flexibility and the main decisions adopted in our case have been as follows:
PD bands. Inspired by the BCBS document just mentioned, specifically table CR6, the following PD intervals have been proposed4:
PD intervals Equivalent
external rating
0 < 0.15% AAA to BBB+
0.15 < 0.25% BBB+ to BBB
0.25 < 0.50% BBB to BB+
0.50 < 0.75% BB+ to BB
0.75 < 2.50% BB to B+
2.50 < 10.0% B+ to B-
10.0 < 100% B- to C
100% (default) D
To complete column ‘c’, an equivalence has been established between the PDs and the external ratings. On an annual basis, Santander Group uses data from S&P5 to estimate the TTC PD associated with the external ratings. First of all, an economic cycle is defined and, for each category of rating, a long-term average (covering the whole cycle) is calculated of the annual default frequencies contained in the S&P report. This allows a long-term PD to be associated to each external rating.
Note 5: PD figures are shown as percentages, i.e. 0.15 is actually 0.15%
Note 6: Specifically the document titled ‘2016 Annual Global Corporate Default Study and Rating Transitions’.

2017 Pillar 3 Disclosures
3. CREDIT RISK
132
Columns ‘d’ and ‘e’ contain the average regulatory PD at the date in question (December 2017), calculated by weighting by exposure (column ‘c’) and unweighted (column ‘d’). By way of example, the figures for UK mortgages are shown below.
TABLE 65. IRB APPROACH - BACKTESTING OF PD PER EXPOSURE CLASS (CR9)
UK PD rangeExternal rating
equivalentWeighted
average PDArithmetic average
PD by obligors
Retail - Residential mortgage exposures
0 < 0.15% AAA to BBB+ 0.08% 0.08%
0.15 < 0.25% BBB+ to BBB 0.20% 0.20%
0.25 < 0.50% BBB to BB+ 0.39% 0.40%
0.50 < 0.75% BB+ to BB 0.58% 0.59%
0.75 < 2.50% BB to B+ 1.29% 1.28%
2.50 < 10.0% B+ to B- 4.99% 5.12%
10.0 < 100% B- to C 32.13% 32.72%
100% (default) D 100% 100%
It can be seen here that there is no major difference between the average exposure-weighted PD and the simple average in each band, indicating that exposure is distributed fairly uniformly among the different transactions. This result is quite typical of retail portfolios, but may be less so in the case of corporate portfolios, where certain borrowers may have significant exposures. Nevertheless, and as can be seen in the results shown in due course, the corporate portfolios (of SAN Spain, Mexico and Santander Consumer) do not reveal any appreciable differences either.
The following column (Number of obligors) is divided into two, which contain the number of borrowers (or transactions in the case of retail portfolios) at two different dates: December 2016 (column ‘e’) and December 2017 (column ‘f’). The intention is to detect migrations of customers/transactions between PD bands, though sometimes the migration is due more to a recalibration of regulatory models than to the actual dynamics of the rating system.
TABLE 65. IRB APPROACH - BACKTESTING OF PD PER EXPOSURE CLASS (CR9)
UK PD range External rating equivalent
Number of obligors
End of previous year
End of the year
Retail - Residential mortgage exposures
0 < 0.15% AAA to BBB+ 71,750 63,760
0.15 < 0.25% BBB+ to BBB 165,968 184,032
0.25 < 0.50% BBB to BB+ 326,690 306,329
0.50 < 0.75% BB+ to BB 113,989 77,911
0.75 < 2.50% BB to B+ 393,524 422,530
2.50 < 10.0% B+ to B- 167,003 162,171
10.0 < 100% B- to C 72,965 65,707
100% (default) D 20,865 18,409

2017 Pillar 3 Disclosures 133
Main summary
Chapter summary
Enhanc. table
List of tables
Continuing with the example of UK mortgages, no significant migrations can be seen between tranches; just a slight decline in portfolio volumes. However, average PD remains stable in all bands.
The original BCBS table proposes two columns (‘g’ and ‘h’), which we preferred to merge into one, to report information on those transactions or customers that entered into default in 2017 across the different regulatory PD bands. In line with the calculation of column ‘i’, here we took the borrowers at the end of the previous financial year (see the first column ‘f’) and observed which of these entered into default in 2016. In fact, if we divide the new NPLs by the initial customers for each rating band, we obtain the first of the five values for the annual default rate required for column ‘i’.
TABLE 65. IRB APPROACH - BACKTESTING OF PD PER EXPOSURE CLASS (CR9)
UK PD rangeExternal rating
equivalentDefaulted obligors
in the yearNew defaulted
obligors in the year
Retail - Residential mortgage exposures
0 < 0.15% AAA to BBB+ 164 0.21%
0.15 < 0.25% BBB+ to BBB 337 0.22%
0.25 < 0.50% BBB to BB+ 651 0.26%
0.50 < 0.75% BB+ to BB 441 0.35%
0.75 < 2.50% BB to B+ 1,493 0.47%
2.50 < 10.0% B+ to B- 1,705 1.35%
10.0 < 100% B- to C 8,169 14.30%
100% (default) D
From a backtesting point of view, column ‘i’ is very important, as it averages the default rates observed in each of the past five years for each PD band. Comparing column ‘i’ with columns ‘b’ and ‘c’ gives us an idea of how well our regulatory PDs match actual experience over the medium term.
As will be seen in the following tables, which reproduce table CR9 for a set of the Group’s significant portfolios, in general regulatory PDs are fairly similar to actual default rates, though the following divergences should be noted:
In general, regulatory PDs are higher than actual default rates. However, there are some exceptions to this rule. For example, Mortgage and Corporate portfolios in Spain. This is because the adjustment applied to obtain regulatory TTC PDs covers a longer period than the last five years and also includes very high default rates which occurred in the crises of the early 1990s.
In the case of Mortgages and Corporates in Spain, the situation in recent years is a product of the economic crisis, which has taken actual default rates above their cyclical averages, although if we compare these results with those reported in previous years, we can begin to discern a convergence towards mid-range values in the cycle. In retail, however, the situation is similar to that of the portfolios of Germany or the UK, with observed rates below the cyclical averages. These are portfolios with a higher rotation which, together with stricter credit policies, have brought down observed delinquency rates.

2017 Pillar 3 Disclosures
3. CREDIT RISK
134
The following tables contain all the information on a significant number of Santander Group’s portfolios.
TABLE 65. IRB APPROACH - BACKTESTING OF PD PER EXPOSURE CLASS (CR9)
UK PD rates
External rating
equivalentWeighted
average PD
Arithmetic average PD by obligors
Number of obligors
Defaulted obligors
in the year
Average historical
annual default rate
End of previous
yearEnd of
the year
Retail - Bank Accounts
0 < 0.15% AAA to BBB+ 0.03% 0.03% 732,511 735,905 121 0.02%
0.15 < 0.25% BBB+ to BBB 0.17% 0.17% 4,653,542 4,792,314 1,845 0.05%
0.25 < 0.50% BBB to BB+ 0.32% 0.32% 360,743 425,522 335 0.14%
0.50 < 0.75% BB+ to BB 0.68% 0.68% 601,264 628,270 1,414 0.26%
0.75 < 2.50% BB to B+ 1.41% 1.40% 1,389,478 1,455,951 5,746 0.55%
2.50 < 10.0% B+ to B- 5.23% 5.13% 1,387,114 1,486,686 20,130 2.07%
10.0 < 100% B- to C 24.09% 24.12% 604,155 612,873 55,761 11.74%
100% (default) D 100% 100% 55,946 37,063 – –
Unsecured Personal Loans
0 < 0.15% AAA to BBB+ 0.10% 0.10% 53 3,063 – –
0.15 < 0.25% BBB+ to BBB 0.20% 0.20% 527 86,620 1 0.08%
0.25 < 0.50% BBB to BB+ 0.50% 0.50% 2,672 102,974 2 0.16%
0.50 < 0.75% BB+ to BB – – 33,372 – 83 0.29%
0.75 < 2.50% BB to B+ 1.16% 1.16% 225,592 69,149 1,344 0.77%
2.50 < 10.0% B+ to B- 4.02% 4.04% 88,611 74,791 2,953 3.12%
10.0 < 100% B- to C 21.45% 21.74% 6,870 15,272 2,328 30.53%
100% (default) D 100% 100% 3,598 3,500 – –
Retail - Residential mortgage exposures
0 < 0.15% AAA to BBB+ 0.08% 0.08% 71,750 63,760 164 0.21%
0.15 < 0.25% BBB+ to BBB 0.20% 0.20% 165,968 184,032 337 0.22%
0.25 < 0.50% BBB to BB+ 0.39% 0.40% 326,690 306,329 651 0.26%
0.50 < 0.75% BB+ to BB 0.58% 0.59% 113,989 77,911 441 0.35%
0.75 < 2.50% BB to B+ 1.29% 1.28% 393,524 422,530 1,493 0.47%
2.50 < 10.0% B+ to B- 4.99% 5.12% 167,003 162,171 1,705 1.35%
10.0 < 100% B- to C 32.13% 32.72% 72,965 65,707 8,169 14.30%
100% (default) D 100% 100% 20,865 18,409 – –

2017 Pillar 3 Disclosures 135
Main summary
Chapter summary
Enhanc. table
List of tables
TABLE 65. IRB APPROACH - BACKTESTING OF PD PER EXPOSURE CLASS (CR9)
SC SPAIN PD ratesExternal rating
equivalentWeighted
average PD
Arithmetic average PD by obligors
Number of obligors
Defaulted obligors
in the year
Average historical
annual default rate
End of previous
yearEnd of
the year
Retail
0 < 0.15% AAAa A- 0.07% 0.07% 69,707 55,382 95 0.13%
0.15 < 0.25% A- a BBB+ 0.19% 0.19% 1,098,889 1,127,525 1450 0.08%
0.25 < 0.50% BBB+ a BBB- 0.37% 0.38% 1,081,688 1,025,946 746 0.07%
0.50 < 0.75% BBB- a BB+ 0.54% 0.56% 167,432 251,940 188 0.09%
0.75 < 2.50% BB+ a BB- 1.47% 1.42% 429,466 435,329 1242 0.29%
2.50 < 10.0% BB- a B- 5.40% 4.90% 259,595 288,152 3389 1.86%
10.0 < 100% B- a C 25.66% 28.56% 111,707 113,848 10989 13.70%
100% (default) D 100% 100% 17,378 18,325 – –
Other retail
0 < 0.15% AAA a A- – – 1315 – 1 0.13%
0.15 < 0.25% A- a BBB+ 0.18% 0.18% 6,823 13,854 4 0.10%
0.25 < 0.50% BBB+ a BBB- 0.31% 0.32% 24,976 25,527 12 0.17%
0.50 < 0.75% BBB- a BB+ 0.53% 0.54% 28,043 27,473 38 0.34%
0.75 < 2.50% BB+ a BB- 1.50% 1.44% 162,459 174,168 608 0.85%
2.50 < 10.0% BB- a B- 3.84% 4.40% 137,988 161,797 1,507 2.39%
10.0 < 100% B- a C 34.28% 33.05% 40,170 27,867 4,549 20.90%
100% (default) D 100% 100% 11,350 10,377
Corporates
0.15 < 0.25 BBB+ to BBB 0.23% 0.23% – 364 1 0.08%
0.50 < 0.75 BB+ to BB – – 380 – – 0.76%
0.75 < 2.50 BB to B+ 1.22% 1.22% – 184 1 0.14%
2.50 < 10.0 B+ to B- 4.94% 4.93% 324 346 7 6.34%
10.0 < 100 B- to C 16.11% 19.04% 12 38 2 18.46%
100% (default) D 100% 100% 19 15 – –

2017 Pillar 3 Disclosures
3. CREDIT RISK
136
TABLE 65. IRB APPROACH - BACKTESTING OF PD PER EXPOSURE CLASS (CR9)
SPAIN PD ratesExternal rating
equivalentWeighted
average PD
Arithmetic average PD by obligors
Number of obligors
Defaulted obligors
in the year
Average historical
annual default rate
End of previous
yearEnd of
the year
Retail - mortgages
0 < 0.15% AAA to BBB+ 0.08% 0.07% 310,174 303,741 125 0.08%
0.15 < 0.25% BBB+ to BBB 0.19% 0.19% 80,553 77,774 103 0.26%
0.25 < 0.50% BBB to BB+ 0.36% 0.36% 68,774 64,937 162 0.48%
0.50 < 0.75% BB+ to BB 0.62% 0.62% 12,307 39,658 43 1.27%
0.75 < 2.50% BB to B+ 1.35% 1.33% 71,896 68,521 588 1.68%
2.50 < 10.0% B+ to B- 4.49% 4.53% 33,126 29,957 1,115 7.12%
10.0 < 100% B- to C 24.42% 23.94% 25,090 21,044 5,178 25.80%
100% (default) D 100% 100% 29,637 28,299 – –
Retail - Other retail
0 < 0.15% AAA to BBB+ 0.09% 0.08% 104,047 70,355 50 0.09%
0.15 < 0.25% BBB+ to BBB 0.20% 0.19% 20,083 69,949 37 0.19%
0.25 < 0.50% BBB to BB+ 0.34% 0.35% 104,187 123,956 199 0.16%
0.50 < 0.75% BB+ to BB 0.61% 0.62% 80,042 50,095 280 0.63%
0.75 < 2.50% BB to B+ 1.72% 1.62% 241,019 315,631 2427 1.51%
2.50 < 10.0% B+ to B- 4.67% 4.56% 214,947 194,911 5530 2.57%
10.0 < 100% B- to C 27.25% 31.32% 205,332 222,611 44,079 18.96%
100% (default) D 100% 100% 105,138 126,576 – –
Corporates
0 < 0.15% AAA to BBB+ 0.10% 0.08% 109 272 – 0.36%
0.15 < 0.25% BBB+ to BBB 0.21% 0.21% 2408 1506 2 0.22%
0.25 < 0.50% BBB to BB+ 0.34% 0.34% 5474 4682 6 0.21%
0.50 < 0.75% BB+ to BB 0.62% 0.62% 77 4361 – 0.47%
0.75 < 2.50% BB to B+ 1.44% 1.49% 11,432 14,084 58 1.38%
2.50 < 10.0% B+ to B- 5.51% 5.20% 5,966 4,657 148 5.85%
10.0 < 100% B- to C 23.42% 20.05% 1,790 1,125 216 20.79%
100% (default) D 100% 100% 704 747 – –
Cards
0 < 0.15% AAA to BBB+ 0.09% 0.10% 830,870 1,331,368 540 0.04%
0.15 < 0.25% BBB+ to BBB 0.19% 0.19% 157,455 248,775 114 0.09%
0.25 < 0.50% BBB to BB+ 0.39% 0.38% 112,894 65,902 294 0.22%
0.50 < 0.75% BB+ to BB 0.64% 0.64% 61,562 93,860 233 0.29%
0.75 < 2.50% BB to B+ 1.52% 1.51% 338,813 425,851 1,539 0.64%
2.50 < 10.0% B+ to B- 4.78% 4.76% 201,956 316,577 5,169 2.55%
10.0 < 100% B- to C 32.25% 30.04% 37,730 70,700 8,033 18.49%
100% (default) D 100% 100% 14,326 17,397 – –

2017 Pillar 3 Disclosures 137
Main summary
Chapter summary
Enhanc. table
List of tables
TABLE 65. IRB APPROACH - BACKTESTING OF PD PER EXPOSURE CLASS (CR9)
SANTANDER TOTTA PD rates
External rating equivalent
Weighted average PD
Arithmetic average PD by obligors
Number of obligors
Defaulted obligors
in the year
Average historical
annual default rate
End of previous
yearEnd of
the year
Cards
0 < 0.15% AAA to BBB+ 0.14% 0.13% 135,741 85 132 0.13%
0.15 < 0.25% BBB+ to BBB 0.23% 0.22% 36,540 6,242 39 0.15%
0.25 < 0.50% BBB to BB+ 0.39% 0.37% 42,006 70,976 117 0.34%
0.50 < 0.75% BB+ to BB 0.60% 0.60% 13,851 941 20 0.40%
0.75 < 2.50% BB to B+ 1.49% 1.59% 82,931 244,584 584 1.17%
2.50 < 10.0% B+ to B- 5.18% 5.51% 99,277 105,189 2,898 3.60%
10.0 < 100% B- to C 31.00% 31.53% 21,438 29,089 3,481 18.77%
100% (default) D 100% 100% 8,511 9,301 – –
Corporates
0 < 0.15% AAA to BBB+ 0.08% 0.08% 40 41 – –
0.15 < 0.25% BBB+ to BBB 0.16% 0.16% 18 18 – –
0.25 < 0.50% BBB to BB+ 0.35% 0.35% 650 716 1 0.30%
0.50 < 0.75% BB+ to BB 0.63% 0.63% 62 40 – –
0.75 < 2.50% BB to B+ 1.39% 1.43% 2,547 2,619 9 0.65%
2.50 < 10.0% B+ to B- 5.86% 5.77% 1,425 1,433 45 2.51%
10.0 < 100% B- to C 33.08% 28.26% 239 214 38 20.22%
100% (default) D 100% 100% 474 415 – –
Retail - Other retail
0 < 0.15% AAA to BBB+ 0.03% 0.03% 7,709 12 11 0.08%
0.15 < 0.25% BBB+ to BBB 0.21% 0.18% 7,542 3,003 9 0.11%
0.25 < 0.50% BBB to BB+ 0.44% 0.44% 18,064 56,898 24 0.30%
0.50 < 0.75% BB+ to BB 0.64% 0.62% 31,102 10,877 91 0.31%
0.75 < 2.50% BB to B+ 1.68% 2.03% 222,665 208,081 1,004 0.57%
2.50 < 10.0% B+ to B- 5.20% 5.32% 93,319 82,997 2,743 3.34%
10.0 < 100% B- to C 29.01% 36.99% 63,469 64,564 12,541 19.06%
100% (default) D 100% 100% 47,759 42,602 – –
Retail - mortgages
0 < 0.15% AAA to BBB+ 0.09% 0.09% 106,237 106,291 55 0.13%
0.15 < 0.25% BBB+ to BBB 0.21% 0.21% 41,812 41,967 43 0.31%
0.25 < 0.50% BBB to BB+ 0.37% 0.37% 43,604 45,234 83 0.48%
0.50 < 0.75% BB+ to BB 0.60% 0.60% 18,608 19,124 50 0.24%
0.75 < 2.50% BB to B+ 1.26% 1.29% 32,613 32,262 207 1.35%
2.50 < 10.0% B+ to B- 5.08% 5.19% 28,549 29,751 516 3.79%
10.0 < 100% B- to C 28.94% 28.94% 17,460 14,798 2,818 19.55%
100% (default) D 100% 10,964 9,442 – –
Retail - SMEs
0 < 0.15% AAA to BBB+ 0.03% 0.03% 22 19 – –
0.15 < 0.25% BBB+ to BBB 0.21% 0.21% 176 99 2 1.14%
0.25 < 0.50% BBB to BB+ 0.30% 0.31% 1,654 1,679 6 0.47%
0.50 < 0.75% BB+ to BB 0.67% 0.66% 60 44 – 0.43%
0.75 < 2.50% BB to B+ 1.30% 1.47% 20,128 23,389 146 1.05%
2.50 < 10.0% B+ to B- 4.71% 4.85% 10,007 12,900 258 2.94%
10.0 < 100% B- to C 26.33% 29.25% 16,571 13,879 2,131 12.38%
100% (default) D 100% 100% 9,325 7,222 – –

2017 Pillar 3 Disclosures
3. CREDIT RISK
138
TABLE 65. IRB APPROACH - BACKTESTING OF PD PER EXPOSURE CLASS (CR9)
MEXICO PD ratesExternal rating
equivalentWeighted
average PD
Arithmetic average PD by obligors
Number of obligors
Defaulted obligors
in the year
Average historical annual
default rate
End of previous
yearEnd of
the year
Corporates
0 < 0.15% AAA to BBB+ – – – – – –
0.15 < 0.25% BBB+ to BBB – – – – – –
0.25 < 0.50% BBB to BB+ 0.38% 0.38% 42 38 3 0.38%
0.50 < 0.75% BB+ to BB – – – – – –
0.75 < 2.50% BB to B+ 1.21% 1.21% 3,026 3,130 21 1.23%
2.50 < 10.0% B+ to B- 3.49% 3.49% 252 197 29 5.34%
10.0 < 100% B- to C 24.20% 24.20% 21 12 1 26.41%
100% (default) D 100% 100% 79 70 – –
SC GERMANY PD ratesExternal rating
equivalentWeighted
average PD
Arithmetic average PD by obligors
Number of obligors
Defaulted obligors
in the year
Average historical annual
default rate
End of previous
yearEnd of
the year
Corporates
0 < 0.15% AAA to BBB+ – – – – – –
0.15 < 0.25% BBB+ to BBB 0.23% 0.23% 269 269 – 0.19%
0.25 < 0.50% BBB to BB+ 0.35% 0.35% 490 553 – –
0.50 < 0.75% BB+ to BB 0.55% 0.55% 417 391 1 0.13%
0.75 < 2.50% BB to B+ 1.64% 1.55% 3,174 3,060 18 0.50%
2.50 < 10.0% B+ to B- 4.20% 4.49% 737 621 18 2.62%
10.0 < 100% B- to C 22.39% 25.20% 111 135 4 3.14%
100% (default) D 100% 100% 36 44 – –
Other retail
0 < 0.15% AAA to BBB+ 0.08% 0.08% 50,187 45,821 15 0.03%
0.15 < 0.25% BBB+ to BBB 0.20% 0.20% 157,789 147,777 139 0.09%
0.25 < 0.50% BBB to BB+ 0.35% 0.35% 457,633 446,819 514 0.12%
0.50 < 0.75% BB+ to BB 0.55% 0.55% 948,281 924,393 1,565 0.16%
0.75 < 2.50% BB to B+ 1.27% 1.28% 1,586,365 1,516,060 8,839 0.54%
2.50 < 10.0% B+ to B- 4.55% 4.50% 538,868 505,652 16,681 2.67%
10.0 < 100% B- to C 34.49% 30.72% 232,596 117,487 23,147 17.18%
100% (default) D 100% 100% 83,702 73,891 – –
Retail Qualifying Revolving
0 < 0.15% AAA to BBB+ 0.09% 0.1% 6 2 – –
0.15 < 0.25% BBB+ to BBB 0.23% 0.2% 2,440 2,175 1 0.14%
0.25 < 0.50% BBB to BB+ 0.35% 0.3% 2,560 1,127 2 0.16%
0.50 < 0.75% BB+ to BB 0.55% 0.5% 4,871 1,535 1 0.12%
0.75 < 2.50% BB to B+ 1.39% 1.4% 193,560 134,734 655 0.58%
2.50 < 10.0% B+ to B- 4.56% 5.0% 35,379 26,105 686 3.56%
10.0 < 100% B- to C 27.75% 27.1% 22,404 17,377 3,135 17.14%
100% (default) D 100% 100% 11,327 8,115 – –
Retail - Residential mortgages
0 < 0.15% AAA to BBB+ 0.08% 0.08% 11,286 9,854 2 0.03%
0.15 < 0.25% BBB+ to BBB 0.19% 0.19% 42,132 38,574 23 0.09%
0.25 < 0.50% BBB to BB+ 0.35% 0.35% 14,124 13,298 10 0.14%
0.50 < 0.75% BB+ to BB 0.55% 0.55% 7,024 6,542 8 0.23%
0.75 < 2.50% BB to B+ 1.19% 1.18% 6,084 5,202 32 0.62%
2.50 < 10.0% B+ to B- 4.37% 4.37% 730 580 22 3.11%
10.0 < 100% B- to C 32.17% 31.19% 689 432 63 11.04%
100% (default) D 100% 100% 864 826 – –

2017 Pillar 3 Disclosures 139
Main summary
Chapter summary
Enhanc. table
List of tables
TABLE 65. IRB APPROACH - BACKTESTING OF PD PER EXPOSURE CLASS (CR9)
SC NORDICS PD ratesExternal rating
equivalentWeighted
average PD
Arithmetic average PD by obligors
Number of obligors
Defaulted obligors
in the year
Average historical
annual default rate
End of previous
yearEnd of
the year
Nordics - NorwayAuto individuals
0 < 0.15% AAA to BBB+ – – – – – –
0.15 < 0.25% BBB+ to BBB – – – – – –
0.25 < 0.50% BBB to BB+ 0.3% 0.3% 53,000 55,317 208 0.27%
0.50 < 0.75% BB+ to BB 0.6% 0.6% 42,905 44,403 350 0.68%
0.75 < 2.50% BB to B+ 1.4% 1.4% 59,291 57,569 793 1.02%
2.50 < 10.0% B+ to B- 5.8% 5.9% 18,548 22,569 631 2.99%
10.0 < 100% B- to C 23.0% 23.2% 14,886 18,362 1,914 21.75%
100% (default) D 100.0% 100.0% 4,064 4,646
Nordics - SwedenAuto individuals
0 < 0.15% AAA to BBB+ – – – – – –
0.15 < 0.25% BBB+ to BBB – – – – – –
0.25 < 0.50% BBB to BB+ – – – – – –
0.50 < 0.75% BB+ to BB – – – – – –
0.75 < 2.50% BB to B+ 0.9% 0.9% 93,406 106,239 260 0.42%
2.50 < 10.0% B+ to B- 3.4% 3.4% 28,463 32,602 330 1.40%
10.0 < 100% B- to C 67.5% 67.2% 319 328 130 56.62%
100% (default) D 100.0% 100.0% 333 368 – –
Nordics - FinlandAuto individuals
0 < 0.15% AAA to BBB+ – – – – – –
0.15 < 0.25% BBB+ to BBB – – – – – –
0.25 < 0.50% BBB to BB+ – – – – – –
0.50 < 0.75% BB+ to BB 0.6% 0.6% 14,148 16,297 30 0.19%
0.75 < 2.50% BB to B+ 1.4% 1.4% 71,764 89,647 329 0.53%
2.50 < 10.0% B+ to B- 4.9% 4.9% 13,137 15,700 248 2.14%
10.0 < 100% B- to C 26.4% 26.6% 10,082 11,557 827 20.45%
100% (default) D 100.0% 100.0% 625 891 – –
3.9.2. EAD backtestTo test Credit Conversion Factors (CCF), the balance at which transactions defaulted was compared with the regulatory EAD assigned 12 months prior to the default occurring.
The ratio of estimated EAD to actual EAD, known as the 'coverage ratio', gives an idea of the accuracy of the EAD estimate.
The following tables and diagrams provide a comparison between estimated EAD and actual EAD for the following portfolios with committed limits.
· Cards and Loans for Individualised and Standardised Corporates of Santander Spain;
· Cards and Loans to individuals of Santander Spain;
· United Kingdom mortgages; and
· Cards and Credit facilities of Standardised Corporates of Santander Totta.
The data is broken down by the percentage utilisation of the facility, as this is the main driver used in estimating CCF and, therefore, in assigning EAD.

2017 Pillar 3 Disclosures
3. CREDIT RISK
140
% UsedDefaulted
balanceAllocated
EADCoverage
ratio
0% 37 55 148%
(0%,20%] 46 65 143%
(20%,40%] 49 55 113%
(40%,60%] 19 26 137%
(60%,90%] 39 38 98%
>90% 78 97 125%
TOTAL 268 336 126%
% UsedDefaulted
balanceAllocated
EADCoverage
ratio
0% 90 193 213.5%
(0%,20%] 115 157 136.8%
(20%,40%] 86 81 93.2%
(40%,60%] 141 109 76.9%
(60%,90%] 247 272 110.1%
>90% 721 819 113.5%
TOTAL 1,400 1,631 116.3%
% UsedDefaulted
balanceAllocated
EADCoverage
ratio
[0%,60%] 3,941 2,802 71%
(60%,80%] 1,181 1,285 109%
(80%,95%] 3,627 3,615 100%
>95% 181,843 199,954 110%
TOTAL 190,592 207,656 109%
% UsedDefaulted
balanceAllocated
EADCoverage
ratio
[0%,60%] 1,750 1,891 108%
(60%,80%] 1,078 1,247 116%
(80%,95%] 3,254 3,210 99%
>95% 31,157 32,913 106%
TOTAL 37,239 39,261 105%
BACKTEST EAD SPAIN. NON STANDARDISED CORPORATES CREDIT
Thousands of Euros Defaulted balance Allocated EAD
0%0
20406080
100120
0%,20% 20%,40% 40%,60% 60%,90% >90%% used
BACKTEST EAD SPAIN. STANDARDISED CORPORATES CREDIT CARDS
Thousands of Euros Defaulted balance Allocated EAD
0%0
200400600800
1.000
0%,20% 20%,40% 40%,60% 60%,90% >90%% used
BACKTEST EAD SPAIN. NON STANDARDISED CORPORATES CREDITS
Thousands of Euros Defaulted balance Allocated EAD
0%, 60%0
50100150
200250
60%,80% 80%,95% >95%
% used
BACKTEST EAD SPAIN. STANDARDISED CORPORATES CREDITS
Thousands of Euros Defaulted balance Allocated EAD
0%, 60%0
10
20
30
40
60%,80% 80%,95% >95%
% used

2017 Pillar 3 Disclosures 141
Main summary
Chapter summary
Enhanc. table
List of tables
% UsedDefaulted
balanceAllocated
EADCoverage
ratio
0% 900 2,500 278%
(0%,20%] 612 693 113%
(20%,40%] 576 567 98%
(40%,60%] 963 932 97%
(60%,90%] 3,594 3,515 98%
>90% 18,862 18,908 100%
Total 25,507 27,115 106%
% UsedDefaulted
balanceAllocated
EADCoverage
ratio
[0%,60%] 450 378 84%
(60%,80%] 573 604 105%
(80%,95%] 562 621 110%
>95% 13,959 15,227 109%
Total 15,544 16,830 108%
% Used Defaulted balanceAllocated
EADCoverage
ratio
[0%,90%] 4 4 98%
>90 % 20 22 107%
TOTAL 24 26 105%
% Used Defaulted balanceAllocated
EADCoverage
ratio
0% 4 15 396%
(0%,95%] 145 186 128%
>95 % 32 31 94%
TOTAL 181 232 128%
BACKTEST EAD SPAIN RETAIL CREDIT CARDS
Thousands of Euros Defaulted balance Allocated EAD
0%0
15
10
5
20
0%,20% 20%,40% 40%,60% 60%,90% >90%% used
BACKTEST EAD SPAIN. RETAIL CREDITS
Thousands of Euros Defaulted balance Allocated EAD
0
15
10
5
20
0%, 60% 60%,80% 80%,95% >95%
% used
BACKTEST EAD PORTUGAL. STANDARDISED CORPORATES CREDIT LINES
Thousands of Euros
Defaulted balance Allocated EAD
0
5
10
15
20
25
>90%0%,90%
% used
4 4
2022
BACKTEST EAD PORTUGAL. STANDARDISED CORPORATES CREDIT CARDS
Thousands of Euros
Defaulted balance Allocated EAD
020406080
100120140160180
200
>95%0% 0%,95%% used
4
32
145
1531
286

2017 Pillar 3 Disclosures
3. CREDIT RISK
142
BACKTEST EAD UK. MORTGAGES
Thousands of Euros
Defaulted balance Allocated EAD
020,00040,00060,00080,000100,00
120,000140,000
Total5,650 - 11,3000 - 5,650 11,300+
% used
Drawn balance Defaulted balanceAllocated
EADCoverage
ratio
0 - 5.650 76,028 79,020 104%
5.650 - 11.300 6,127 6,670 109%
11.300+ 27,796 46,452 167%
Total 109,951 132,142 120%
Note: not included mortages without undrawn balance.
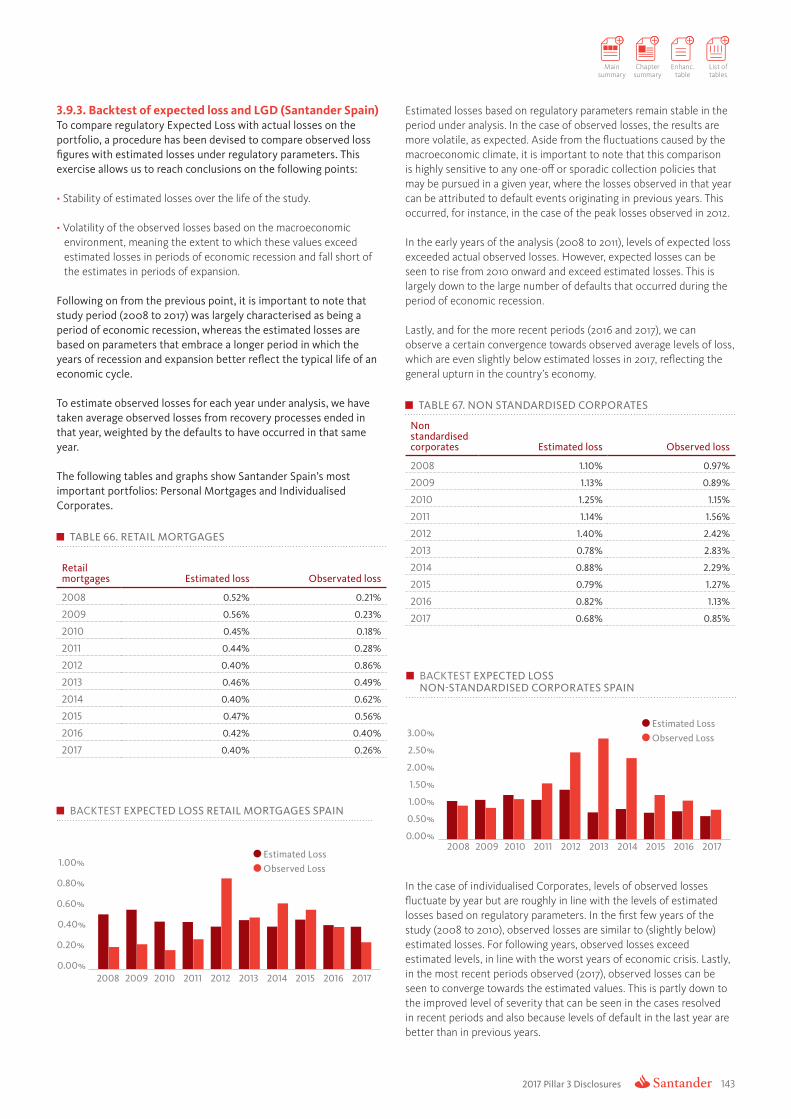
2017 Pillar 3 Disclosures 143
Main summary
Chapter summary
Enhanc. table
List of tables
3.9.3. Backtest of expected loss and LGD (Santander Spain)To compare regulatory Expected Loss with actual losses on the portfolio, a procedure has been devised to compare observed loss figures with estimated losses under regulatory parameters. This exercise allows us to reach conclusions on the following points:
• Stability of estimated losses over the life of the study.
• Volatility of the observed losses based on the macroeconomic environment, meaning the extent to which these values exceed estimated losses in periods of economic recession and fall short of the estimates in periods of expansion.
Following on from the previous point, it is important to note that study period (2008 to 2017) was largely characterised as being a period of economic recession, whereas the estimated losses are based on parameters that embrace a longer period in which the years of recession and expansion better reflect the typical life of an economic cycle.
To estimate observed losses for each year under analysis, we have taken average observed losses from recovery processes ended in that year, weighted by the defaults to have occurred in that same year.
The following tables and graphs show Santander Spain’s most important portfolios: Personal Mortgages and Individualised Corporates.
TABLE 66. RETAIL MORTGAGES
Retail mortgages Estimated loss Observated loss
2008 0.52% 0.21%
2009 0.56% 0.23%
2010 0.45% 0.18%
2011 0.44% 0.28%
2012 0.40% 0.86%
2013 0.46% 0.49%
2014 0.40% 0.62%
2015 0.47% 0.56%
2016 0.42% 0.40%
2017 0.40% 0.26%
BACKTEST EXPECTED LOSS RETAIL MORTGAGES SPAIN
Estimated Loss Observed Loss
1.00%
0.80%
0.60%
0.40%
0.20%
0.00%2008 2009 2010 2011 2012 2013 2014 2015 2016 2017
Estimated losses based on regulatory parameters remain stable in the period under analysis. In the case of observed losses, the results are more volatile, as expected. Aside from the fluctuations caused by the macroeconomic climate, it is important to note that this comparison is highly sensitive to any one-off or sporadic collection policies that may be pursued in a given year, where the losses observed in that year can be attributed to default events originating in previous years. This occurred, for instance, in the case of the peak losses observed in 2012.
In the early years of the analysis (2008 to 2011), levels of expected loss exceeded actual observed losses. However, expected losses can be seen to rise from 2010 onward and exceed estimated losses. This is largely down to the large number of defaults that occurred during the period of economic recession.
Lastly, and for the more recent periods (2016 and 2017), we can observe a certain convergence towards observed average levels of loss, which are even slightly below estimated losses in 2017, reflecting the general upturn in the country’s economy.
TABLE 67. NON STANDARDISED CORPORATES
Non standardised corporates Estimated loss Observed loss
2008 1.10% 0.97%
2009 1.13% 0.89%
2010 1.25% 1.15%
2011 1.14% 1.56%
2012 1.40% 2.42%
2013 0.78% 2.83%
2014 0.88% 2.29%
2015 0.79% 1.27%
2016 0.82% 1.13%
2017 0.68% 0.85%
3.00%
2.50%
2.00%
1.50%
1.00%
0.00%
0.50%
BACKTEST EXPECTED LOSS NON-STANDARDISED CORPORATES SPAIN
Estimated Loss Observed Loss
2008 2009 2010 2011 2012 2013 2014 2015 2016 2017
In the case of individualised Corporates, levels of observed losses fluctuate by year but are roughly in line with the levels of estimated losses based on regulatory parameters. In the first few years of the study (2008 to 2010), observed losses are similar to (slightly below) estimated losses. For following years, observed losses exceed estimated levels, in line with the worst years of economic crisis. Lastly, in the most recent periods observed (2017), observed losses can be seen to converge towards the estimated values. This is partly down to the improved level of severity that can be seen in the cases resolved in recent periods and also because levels of default in the last year are better than in previous years.

2017 Pillar 3 Disclosures
3. CREDIT RISK
144
3.10. Counterparty riskChapter 6 of the CRR (Regulation (EU) No 575/2013) describes counterparty credit risk as the risk a counterparty to a transaction could default before the final settlement of the transaction’s cash flows. It includes the following transaction types: derivative instruments, repurchase agreements, securities or commodities lending, long settlement transactions and margin lending transactions.
Counterparty risk in Santander Group is controlled using an integrated system that provides real-time information on exposures to any counterparty, product or maturity and in any Group unit as a percentage of the agreed limits.
For the measurement of exposure (ECR or credit risk equivalent), there are two methodologies: a Mark to Market (MtM) methodology (replacement cost in the case of derivatives), plus an add-on for potential future exposure, and another methodology for certain regions and some products, which includes a calculation of exposure using Monte Carlo simulation.
The capital at risk or unexpected loss, i.e. the loss which, once the expected loss is subtracted, constitutes the economic capital, net of guarantees and recoveries, is also calculated.
The exposures are recalculated at market close, adjusting all transactions to their new time horizon. The potential future exposure is adjusted and mitigation measures (netting, collateral, etc.) are applied, so that the exposures can be checked on a daily basis against the limits approved by senior management.
As regards collateral management, derivative transactions subject to collateral agreements are marked to market daily and the parameters agreed in the collateral agreement are applied, giving an amount of collateral to be called from, or returned to, the counterparty.
The counterparty that receives the margin call checks the valuation, at which point discrepancies may arise.
A monitoring committee (discrepancies committee) meets weekly to analyse transactions in which significant discrepancies have been detected. The committee includes representatives from Collateral Management, Market Risk, Wholesale Risk, Risk Approval for Financial Institutions and GCB Counterparty Risk.
Currently, most collateral is posted and received in cash. However, the current market trend shows that the use of non-cash collateral is increasing. Santander Group is taking this trend into account in its active collateral management.
Furthermore, any correlation there may be between the increase in exposure to a customer and the customer’s solvency is controlled by ensuring that the related derivative transactions are for hedging and not speculative purposes.
In derivatives, where most collateral is in cash, there is practically no risk of adverse effects arising from correlations between the collateral and the collateral provider. Any adverse effects arising from correlations in non-cash collateral are immaterial since issuances from the same counterparty and its subsidiaries are excluded from the collateral eligibility policies.
In regard to wrong way risk (WWR), the criterion used by Santander for calculating the credit exposure to derivatives with specific WWR (i.e. the deterioration in counterparty credit quality is directly correlated to the decline in market value of the underlying) is very conservative, given than the exposure to the derivatives with WWR resembles the exposure to a basic financing. In very specific exceptions, with the aim of providing incentives for short-term transactions, with customers with a good rating, liquid underlying and which include collateralisation mechanisms in the derivatives, a decision may be taken to calculate a stressed credit exposure of the derivative.
The Corporate Centre is working to develop a method for measuring and managing both specific and generic adverse correlation risk and a system of governance.
It is estimated that in the event the Group’s credit rating was downgraded and the Group required to post additional collateral the impact of that collateral would be relatively limited. This is because the Group’s credit rating affects only a small percentage of its current collateral agreements. In the event of a hypothetical one-notch downgrade in the parent’s credit rating, it is estimated that the resulting impact of the collateral it would have to post would be 209 million euros.
The information in the tables below relates exclusively to exposures subject to counterparty risk. All of the exposure is mark-to-market.
TABLE 68. TOTAL EXPOSURE TO COUNTERPARTY RISK
Millions of Euros
31 Dec. 2017 31 Dec. 2016
Total 34,460 39,875
Of which: derivatives 23,894 26,875
The above table does not include exposures with central counterparty entities to a sum of 14,680 million Euros.
The following table contains information on the gross positive fair value of the derivative contracts, the potential future exposure, the effect of netting and collateral agreements, and the final exposure value.

2017 Pillar 3 Disclosures 145
Main summary
Chapter summary
Enhanc. table
List of tables
TABLE 69. DERIVATIVES EXPOSURE*
Millions of Euros
31 Dec. 2017 31 Dec. 2016
Gross positive fair value of contracts (public balance sheet scope) 65,780 82,420
Gross positive fair value of contracts (non-public balance sheet scope) 65,836 82,498
Netting benefits 48,187 61,343
Netted fair value after netting effect 17,649 21,155
Collateral held 7,688 11,483
Netted fair value after netting effect and collateral held 9,961 9,672
Regulatory net add-on 13,932 17,203
EAD 23,894 26,875
*Does not include CCPs
The net positions of the 10 largest counterparties, after discounting received collateral, account for 35.46% of the Group’s total derivatives exposure.
The following table contains information on the gross positive fair value of the derivative contracts, the potential future exposure, the effect of netting and collateral agreements, and the final exposure value.
DERIVATIVES EXPOSURE BY PRODUCT
Interest rate Exchange rate Fixed rent Equity Raw materials Credit Others
23%
51%
19%
1%2%
1%3%
DERIVATIVES EXPOSURE BY CATEGORY
Sovereign Institutions Corporates Retail
4%2%
57%
37%
Spain UK Rest of Europe USA Latam Others
DERIVATIVES EXPOSURE BY GEOGRAPHY
17%
34%23%
8%
12%
6%
Does not include repos
AAA AA A BBB BB B Rest
DERIVATIVES EXPOSURE BY RATING
48%
4%
19%
6%
4%1%
18%
Does not include repos
Does not include reposDoes not include repos

2017 Pillar 3 Disclosures
3. CREDIT RISK
146
In 2017 derivative transactions were concentrated in counterparties with high credit quality, so that 71% of the exposure was to counter-parties rated A or better.
The distribution by type of counterparty was 57% institutions and 37% corporates.
As regards the geographic distribution, 34% of the exposure was accounted for by UK counterparties (mainly Santander UK’s operations) and, among the other country groupings, mostly by Spain (17%), rest of Europe (24%), the US (8%) and Latin America (12%).
The following table shows exposure to counterparty risk based on the calculation methodology employed.
TABLE 70. ANALYSIS OF THE COUNTERPARTY CREDIT RISK (CCR) EXPOSURE BY APPROACH (CCR1)*
Millions of Euros
31 Dec. 2017
Notional
Replacement cost/ Current market value
Potential future
exposure EEPE Multiplier
EAD post
CRM RWA
Mark to market 125,553 33,291 34,460 12,115
Original exposure – – –
Standardised approach – – – –
Internal Model Method (for derivatives and SFTs) – – – –
Financial collateral simple method (for SFTs) – –
Financial collateral comprehensive method (for SFTs) – –
VaR for SFTs – –
Total 12,115
*Does not include CCPs
The following table shows the effects of netting agreements and collateral for exposure to counterparty risk.
TABLE 71. IMPACT OF NETTING AND COLLATERAL HELD ON EXPOSURE VALUES (CCR5-A)*
Millions of Euros
31 Dec. 2017
Gross positive fair value or net carrying
amount Add-on Netting benefitsNetted current
credit exposure Collateral heldNet credit exposure
Derivatives 17,938 6,113 11,958 12,093 2,455 9,637
SFTs 17,934 3,350 10,590 10,694 3,553 7,141
Cross-product netting 89,681 23,828 40,205 73,303 55,621 17,682
Total 125,553 33,291 62,754 96,090 61,630 34,460
*Does not include CCPs

2017 Pillar 3 Disclosures 147
Main summary
Chapter summary
Enhanc. table
List of tables
The following table shows exposure to counterparty credit risk (does not include CCPs) by counterparty region, category and rating, among other information.
TABLE 72. IRB - CCR EXPOSURES BY PORTFOLIO AND PD SCALE (CCR4)
Millions of Euros
BRAZIL PD scale
31 Dec. 2017
a b c d e f g
EADpost CRM
Average PD
Number of obligors
Average LGD
Average maturity RWA
RWA density
AIRB. Corporates
0.00 to < 0.15% 239 0.10% 4 45.00% 2.24 76 31.83%
0.15 to < 0.25% 52 0.24% 1 45.00% 1.16 21 41.27%
0.25 to < 0.50% 61 0.41% 1 45.00% 1.63 38 62.36%
0.50 to < 0.75% 32 0.68% 1 45.00% 1.66 26 80.99%
0.75 to < 2.50% 4 1.25% 2 45.00% 1.00 4 93.31%
2.50 to < 10.00% 6 3.19% 1 45.00% 0.03 7 116.84%
10.00 to < 100% 26 13.64% 1 45.00% 0.03 57 218.69%
100% (default) – – – – – – –
Subtotal 419 1.10% 11 45.00% 1.80 229 54.53%
Total 419 1.10% 11 45.00% 1.80 229 54.53%
CHILE PD scale
a b c d e f g
EADpost CRM
Average PD
Number of obligors
Average LGD
Average maturity RWA
RWA density
AIRB. Corporates
0.00 to < 0.15% 96 0.09% 5 45.00% 0.91 19 20.11%
0.15 to < 0.25% 41 0.24% 7 45.00% 1.33 18 43.25%
0.25 to < 0.50% 1 0.41% 3 45.00% 3.68 1 89.02%
0.50 to < 0.75% 13 0.68% 3 45.00% 3.88 15 112.54%
0.75 to < 2.50% – – – – – – –
2.50 to < 10.00% – – – – – – –
10.00 to < 100% – – – – – – –
100% (default) – – – – – – –
Subtotal 151 0.19% 18 45.00% 1.30 53 34.82%
FIRB. Institutions
0.00 to < 0.15% 743 0.06% 30 45.00% 1.18 146 19.65%
0.15 to < 0.25% 10 0.21% 5 45.00% 2.50 5 50.89%
0.25 to < 0.50% 4 0.37% 7 45.00% 2.50 4 84.45%
0.50 to < 0.75% – 0.67% 1 45.00% 2.50 – 83.72%
0.75 to < 2.50% – 1.38% 2 45.00% 2.50 – 117.63%
2.50 to < 10.00% – – – – – – –
10.00 to < 100% – – – – – – –
100% (default) – – – – – – –
Subtotal 757 0.07% 45 45.00% 1.20 155 20.44%
Total 908 0.09% 63 45.00% 1.22 207 22.83%

2017 Pillar 3 Disclosures
3. CREDIT RISK
148
TABLE 72. IRB - CCR EXPOSURES BY PORTFOLIO AND PD SCALE (CCR4)
Millions of Euros
MEXICO PD scale
31 Dec. 2017
a b c d e f g
EADpost CRM
Average PD
Number of obligors
Average LGD
Average maturity RWA
RWA density
FIRB. Institutions0.00 to < 0.15% 823 0.07% 36 45.00% 2.50 261 31.67%
0.15 to < 0.25% 71 0.23% 10 45.00% 2.50 42 59.47%
0.25 to < 0.50% 2 0.39% 5 45.00% 1.01 1 52.67%
0.50 to < 0.75% 0.2 0.64% 2 45.00% 2.20 0.1 86.07%
0.75 to < 2.50% – – – – – – –
2.50 to < 10.00% – – – – – – –
10.00 to < 100% – – – – – – –
100% (default) – – – – – – –
Subtotal 895 0.08% 53 45.00% 2.50 304 33.91%
FIRB. Corporates0.00 to < 0.15% 225 0.11% 29 45.00% 2.50 81 35.92%
0.15 to < 0.25% 8 0.24% 11 45.00% 2.50 5 56.59%
0.25 to < 0.50% 30 0.41% 11 45.00% 2.50 22 73.65%
0.50 to < 0.75% 1 0.67% 17 45.00% 2.46 1 91.69%
0.75 to < 2.50% 6 0.91% 1 45.00% 2.50 7 104.08%
2.50 to < 10.00% – – – – – – –
10.00 to < 100% – – – – – – –
100% (default) – – – – – – –
Subtotal 271 16.88% 69 45.00% 2.50 115 42.51%Total 1,166 10.06% 122 45.00% 2.50 419 35.91%
AIRB. Institutions
0.00 to < 0.15% – – – – – – –
0.15 to < 0.25% – – – – – – –
0.25 to < 0.50% – – – – – – –
0.50 to < 0.75% – – – – – – –
0.75 to < 2.50% 10 2.41% 8 45.00% 3.78 14 145.28%
2.50 to < 10.00% – – – – – – –
10.00 to < 100% – – – – – – –
100% (default) – – – – – – –
Subtotal 10 2.41% 8 45.00% 3.78 14 145.28%
AIRB. Corporates0.00 to < 0.15% – – – – – – –
0.15 to < 0.25% – – – – – – –
0.25 to < 0.50% 5 0.30% 75 40.83% 3.05 3 53.58%
0.50 to < 0.75% – – – – – – –
0.75 to < 2.50% 10 1.28% 1.533 40.83% 3.05 9 91.04%
2.50 to < 10.00% 1 5.18% 135 40.83% 3.92 2 143.43%
10.00 to < 100% 0 24.20% 5 40.83% 3.42 0 244.69%
100% (default) 0.1 100% 18 40.83% 2.10 – –
Subtotal 17 1.63% 1.766 40.83% 3.11 14 82.43%Total 27 1.91% 1.774 42.34% 3.35 28 105.18%

2017 Pillar 3 Disclosures 149
Main summary
Chapter summary
Enhanc. table
List of tables
TABLE 72. IRB - CCR EXPOSURES BY PORTFOLIO AND PD SCALE (CCR4)
Millions of Euros
PORTUGAL PD scale
31 Dec. 2017
a b c d e f g
EADpost CRM
Average PD
Number of obligors
Average LGD
Average maturity RWA
RWA density
AIRB. Institutions0.00 to < 0.15% 19 0.04% 4 45.00% 4.0 7 37.19%
0.15 to < 0.25% – – – – – – –
0.25 to < 0.50% 1 0.39% 1 45.00% 1.0 0 52.63%
0.50 to < 0.75% – – – – – – –
0.75 to < 2.50% – – – – – – –
2.50 to < 10.00% – – – – – – –
10.00 to < 100% – – – – – – –
100% (default) – – – – – – –
Subtotal 20 0.05% 5 45.00% 3.91 7.53 37.67%
AIRB. Corporates0.00 to < 0.15% 9 0.11% 8 45.01% 1.00 5 52.87%
0.15 to < 0.25% 1 0.24% 3 45.00% – 0 52.79%
0.25 to < 0.50% 8 0.36% 40 47.39% 2.70 6 75.58%
0.50 to < 0.75% 99 0.68% 2 45.00% – 119 120.46%
0.75 to < 2.50% 107 2.29% 65 47.42% 4.19 174 162.93%
2.50 to < 10.00% 1 4.79% 23 47.54% 4.11 1 140.39%
10.00 to < 100% 0 14.02% 4 47.54% – 0 274.07%
100% (default) – – 1 – – – –
Subtotal 224 1.42% 90.00 46.25% 4.59 305 136.13%Total 244 1.31% 95 46.14% 4.54 313 128.07%
UKEAD
post CRMAverage
PDNumber of
obligorsAverage
LGDAverage maturity RWA
RWA density
AIRB. Institutions0.00 to < 0.15% 4,346 0.05% 91 44.05% 2.21 1,222 9.09%
0.15 to < 0.25% 385 0.21% 20 44.48% 0.94 168 19.57%
0.25 to < 0.50% 20 0.38% 13 46.31% 2.36 17 71.37%
0.50 to < 0.75% 2 0.64% 7 47.96% 1.84 1 81.27%
0.75 to < 2.50% – – – – – – –
2.50 to < 10.00% – – – – – – –
10.00 to < 100% – – – – – – –
100% (default) – – – – – – –
Subtotal 4,752 0.07% 131 44.10% 0.48 1,409 10.23%
AIRB. Corporates0.00 to < 0.15% 1,611 0.09% 56 42.51% 4.04 680 19.06%
0.15 to < 0.25% 185 0.24% 10 46.82% 4.69 157 71.93%
0.25 to < 0.50% 27 0.41% 12 47.26% 1.82 18 46.34%
0.50 to < 0.75% 21 0.68% 2 46.63% 4.73 27 166.68%
0.75 to < 2.50% – – – – – – –
2.50 to < 10.00% – – – – – – –
10.00 to < 100% – – – – – – –
100% (default) – – – – – – –
Subtotal 1,845 0.11% 80.00 43.06% 0.48 882 26.42%Total 6,597 0.08% 212.00 43.81% 2.66 2,291 13.74%

2017 Pillar 3 Disclosures
3. CREDIT RISK
150
TABLE 72. IRB - CCR EXPOSURES BY PORTFOLIO AND PD SCALE (CCR4)
Millions of Euros
SAN SPAIN PD scale
31 Dec. 2017
a b c d e f g
EADpost CRM
Average PD
Number of obligors
Average LGD
Average maturity RWA
RWA density
AIRB. Sovereign0.00 to < 0.15% 175 0.03% 7 40.02% 0.68 11 6.43%
0.15 to < 0.25% 0.1 0.15% 1 40.00% 4.68 0 52.72%
0.25 to < 0.50% – – – – – – –
0.50 to < 0.75% – – – – – – –
0.75 to < 2.50% – – – – – – –
2.50 to < 10.00% – – – – – – –
10.00 to < 100% – – – – – – –
100% (default) – – – – – – –
Subtotal 175 0.03% 8 40.02% 0.69 11 6.45%
AIRB. Institutions0.00 to < 0.15% 7,861 0.06% 474 44.55% 0.41 985 12.53%
0.15 to < 0.25% 408 0.23% 318 44.65% 0.23 141 34.54%
0.25 to < 0.50% 137 0.39% 284 44.03% 0.16 59 43.45%
0.50 to < 0.75% 58 0.65% 33 43.41% 0.51 36 63.07%
0.75 to < 2.50% 510 1.38% 33 42.45% 0.33 426 83.60%
2.50 to < 10.00% 5 4.01% 4 44.91% 0.03 7 145.89%
10.00 to < 100% 1 44.70% 2 41.90% 4.01 2 257.23%
100% (default) 0 100% 1 39.80% 0.03 0 13.68%
Subtotal 8,978 0.15% 1,149 44.42% 0.39 1,657 18.45%
AIRB. Corporates0.00 to < 0.15% 1,633 0.07% 247 45.00% 2.17 390 23.88%
0.15 to < 0.25% 269 0.23% 264 34.11% 2.51 184 68.34%
0.25 to < 0.50% 337 0.38% 701 32.34% 2.39 261 77.37%
0.50 to < 0.75% 197 0.65% 298 35.19% 3.41 211 107.23%
0.75 to < 2.50% 76 1.22% 989 17.89% 2.52 78 102.43%
2.50 to < 10.00% 180 4.15% 212 33.63% 4.86 299 166.81%
10.00 to < 100% 3 16.73% 23 26.00% 3.48 5 196.63%
100% (default) 21 100% 104 0.30% 4.14 0 0.03%
Subtotal 2,715 1.26% 2,838 39.76% 2.53 1,428 52.60%
AIRB. Retail0.00 to < 0.15% – – – – – – –
0.15 to < 0.25% – – – – – – –
0.25 to < 0.50% – – – – – – –
0.50 to < 0.75% – – – – – – –
0.75 to < 2.50% 19 0.99% 595 29.00% 0.54 6 31.22%
2.50 to < 10.00% – – – – – – –
10.00 to < 100% 14 11.59% 722 40.00% 2.45 9 64.48%
100% (default) 7 100% 112 40.00% 4.94 1 13.75%
Subtotal 40 21.73% 1,429 34.75% 1.97 16 39.89%Total 11,908 0.48% 5,424 43.26% 0.89 3,112 26.13%

2017 Pillar 3 Disclosures 151
Main summary
Chapter summary
Enhanc. table
List of tables
TABLE 72. IRB - CCR EXPOSURES BY PORTFOLIO AND PD SCALE (CCR4)
Millions of Euros
POPULAR PD scale
31 Dec. 2017
a b c d e f g
EADpost CRM
Average PD
Number of obligors
Average LGD
Average maturity RWA
RWA density
FIRB. Institutions0.00 to < 0.15% 131 0.10% 24 45.00% 2.50 54 41.46%
0.15 to < 0.25% 2 0.20% 3 45.00% 2.50 1 49.47%
0.25 to < 0.50% 17 0.39% 1 45.00% 2.50 11 65.80%
0.50 to < 0.75% – – – – – – –
0.75 to < 2.50% – – – – – – –
2.50 to < 10.00% – 2.51% 1 45.00% 2.50 – 129.56%
10.00 to < 100% – – – – – – –
100% (default) – – – – – – –
Subtotal 150 0.13% 29 45.00% 2.50 66 44.29%
FIRB. Corporates0.00 to < 0.15% 0.4 0.15% 3 45.00% 1.27 0.1 28.34%
0.15 to < 0.25% 3 0.21% 2 45.00% 1.90 1 41.27%
0.25 to < 0.50% 17 0.40% 12 45.00% 2.40 11 65.20%
0.50 to < 0.75% 0.1 0.57% 1 45.00% 0.24 – 49.47%
0.75 to < 2.50% 2 0.88% 10 45.00% 2.18 2 80.30%
2.50 to < 10.00% 1 2.53% 3 45.00% 2.50 1 129.86%
10.00 to < 100% – – – – – – –
100% (default) – – – – – – –
Subtotal 24 0.49% 31 45.00% 2.29 15 64.91%Total 173 0.18% 60 45.00% 2.47 82 47.10%
AIRB. Corporates0.00 to < 0.15% 1 0.12% 19 32.26% 1.50 0.2 15.39%
0.15 to < 0.25% 3 0.19% 28 34.10% 1.45 1 21.83%
0.25 to < 0.50% 10 0.35% 48 32.11% 1.38 3 34.45%
0.50 to < 0.75% 3 0.60% 32 32.63% 0.78 1 40.04%
0.75 to < 2.50% 7 1.50% 54 32.38% 1.44 4 61.13%
2.50 to < 10.00% 2 3.96% 21 32.07% 2.63 2 105.22%
10.00 to < 100% – – – – – –
100% (default) 1 100% 8 40.74% 1.48 – 1.13%
Subtotal 27 4.11% 211 32.75% 1.44 12 43.82%
AIRB. Retail0.00 to < 0.15% 1 0.08% 147 34.95% – 0.1 6.04%
0.15 to < 0.25% 1 0.20% 181 36.07% – 0.1 12.03%
0.25 to < 0.50% 1 0.41% 139 36.45% – 0.2 19.03%
0.50 to < 0.75% 0.4 0.60% 76 34.54% – 0.1 22.31%
0.75 to < 2.50% 3 1.46% 285 36.26% – 1 33.24%
2.50 to < 10.00% 1 4.75% 130 33.85% – 1 39.98%
10.00 to < 100% – 12.21% 12 39.56% – – 57.61%
100% (default) – – – – – – –
Subtotal 7 1.49% 970 35.51% – 2 25.13%Total 35 3.55% 1,181 33.34% 1,13 14 39.82%

2017 Pillar 3 Disclosures
3. CREDIT RISK
152
TABLE 72. IRB - CCR EXPOSURES BY PORTFOLIO AND PD SCALE (CCR4)
Millions of Euros
USA PD scaleEAD
post CRMAverage
PDNumber of
obligorsAverage
LGDAverage maturity RWA
RWA density
AIRB. Corporates0.00 to < 0.15% 1 0.06% 6 45.00% 1.29 0.2 17.00%
0.15 to < 0.25% 1 0.24% 2 45.00% 1.00 0.3 39.00%
0.25 to < 0.50% 7 0.41% 1 45.00% 1.08 4 55.00%
0.50 to < 0.75% 2 0.68% 2 45.00% 4.49 2 121.00%
0.75 to < 2.50% 11 1.15% 2 45.00% 1.25 10 94.00%
2.50 to < 10.00% – – – – – – –
10.00 to < 100% 1 24.33% 1 45.00% 1.21 2 272.00%
100% (default) – – – – – – –
Subtotal 22 1.38% 14 45.00% 1.43 18 81.63%
Total 22 1.38% 14 45.00% 1.43 18 81.63%
The following table shows the value adjustment for counterparty credit risk (Credit Value Adjustment or CVA), while differentiating between the standardised approach and the advanced approach.
TABLE 73. CREDIT VALUATION ADJUSTMENT (CVA) CAPITAL CHARGE (CCR2)
Millions of Euros
31 Dec. 2017
Exposure value RWA
Total portfolios subject to the Advanced Method
(i) VaR component (including the 3×multiplier)
(ii) Stressed VaR component (including the 3×multiplier)
All portfolios subject to the Standardised Method 13,166 2,240
Based on Original Exposure Method – –
Total subject to the CVA capital charge 13,166 2,240
*Figures applying 1 year floor.
Since the close of this year, a 1-year floor is being considered in all operations (regardless of whether these operations are collateralized or not). This change implies an increase in the maturity parameter, for which the calculated RWA is increased.
Credit derivatives activitySantander Group uses credit derivatives to hedge lending transactions, as an agent for customers trading in financial markets, and in its own trading operations. The Group’s credit derivatives activity is small compared to that of its peers and is conducted within a sound environment of internal controls and operational risk minimisation.
Credit derivatives risk is controlled through a broad set of limits, including value at risk (VaR), nominal value per rating grade, credit spread sensitivity per rating grade and name, recovery rate sensitivity and correlation sensitivity. Jump-to-default risk limits are set by individual name, geographical area, sector and liquidity.
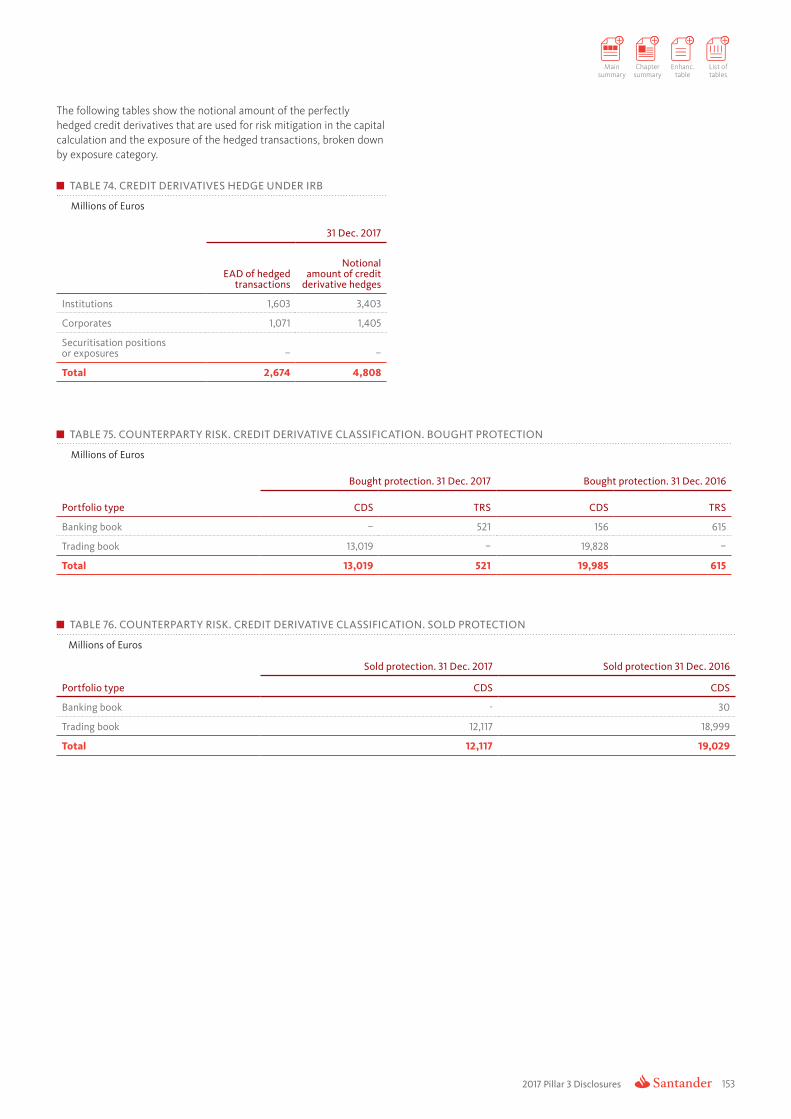
2017 Pillar 3 Disclosures 153
Main summary
Chapter summary
Enhanc. table
List of tables
The following tables show the notional amount of the perfectly hedged credit derivatives that are used for risk mitigation in the capital calculation and the exposure of the hedged transactions, broken down by exposure category.
TABLE 74. CREDIT DERIVATIVES HEDGE UNDER IRB
Millions of Euros
31 Dec. 2017
EAD of hedged transactions
Notional amount of credit
derivative hedges
Institutions 1,603 3,403
Corporates 1,071 1,405
Securitisation positions or exposures – –
Total 2,674 4,808
TABLE 75. COUNTERPARTY RISK. CREDIT DERIVATIVE CLASSIFICATION. BOUGHT PROTECTION
Millions of Euros
Portfolio type
Bought protection. 31 Dec. 2017 Bought protection. 31 Dec. 2016
CDS TRS CDS TRS
Banking book – 521 156 615
Trading book 13,019 – 19,828 –
Total 13,019 521 19,985 615
TABLE 76. COUNTERPARTY RISK. CREDIT DERIVATIVE CLASSIFICATION. SOLD PROTECTION
Millions of Euros
Portfolio type
Sold protection. 31 Dec. 2017 Sold protection 31 Dec. 2016
CDS CDS
Banking book - 30
Trading book 12,117 18,999
Total 12,117 19,029

2017 Pillar 3 Disclosures
3. CREDIT RISK
154
The following table shows the impact of the credit derivatives used as mitigation techniques in RWAs.
TABLE 77. EFFECT ON RWA OF CREDIT DERIVATIVES USED AS CRM TECHNIQUES (CR7)*
31 Dec. 2017
Pre-credit derivatives RWAs Actual RWAs
Exposures under Foundation IRB
Central governments or central banks 28 28
Institutions 4,482 4,145
Corporates - SME 5,581 5,581
Corporates - Specialised Lending 6,474 6,474
Corporates - Other 26,252 26,222
Exposures under Advanced IRB
Central governments or central banks 686 686
Institutions 4,945 4,842
Corporates - SME 18,554 18,554
Corporates - Specialised Lending 11,300 11,300
Corporates - Other 40,834 40,834
Retail - Secured by real estate SME 11,281 11,281
Retail - Secured by real estate nonSME 37,038 37,038
Retail - Qualifying revolving 4,141 4,141
Retail - Other SME 7,918 7,918
Retail - Other non-SME 19,226 19,226
Equity IRB 15,755 15,755
Other non credit-obligation assets 0 0
Total 214,495 214,025
*Does not include CCPs
3.11. Credit risk mitigation techniquesSantander Group applies various forms of credit risk mitigation based on customer type and product type, among other factors. As we will see below, some are inherent in specific operations (such as real estate collateral) while others apply to a series of transactions (such as netting and collateral).
The various mitigation techniques can be grouped into the following categories:
3.11.1. Netting policies and processesNetting involves offsetting gains and losses on multiple transactions of the same type under the umbrella of a master agreement such as ISDA or similar (CSA, OSLA, ISMA, GMRA, etc.).
Market gains and losses on derivative transactions entered into with a given counterparty are offset against one another, so that if the counterparty defaults, the settlement figure is a single net amount, rather than a large number of positive and negative amounts relating to the individual transactions entered into with that counterparty.
An important feature of a master netting agreement is that it entails a single legal obligation, encompassing all the transactions covered by the agreement. This is what makes it possible to offset the risks (calculation methodology explained in chapter 3.10) of all the transactions covered by the agreement with a given counterparty.
3.11.2. Collateral management and valuation policies and processesCollateral is property pledged by a customer or third party to secure the guaranteed obligation.
Collateral assets may be:
• Financial: cash, security deposits, gold, etc.
• Non-financial: real estate (residential or commercial), movable property.
For risk approval purposes, repayment capacity matters most during the decision-making process, although the Group may still insist on any collateral or personal guarantees it deems appropriate. Only collateral that meets the minimum qualitative requirements specified in the Basel agreements is taken into account for regulatory capital calculation purposes.

2017 Pillar 3 Disclosures 155
Main summary
Chapter summary
Enhanc. table
List of tables
The different types of security will be:
1. Pledge guarantee / financial assets: debt securities, equity instruments or other financial assets received as security.
A very significant type of collateral is the financial collateral, which consists of instruments with economic value and high liquidity that are deposited or transferred by one party in favour of another in order to guarantee or reduce any counterparty credit risk arising from portfolios of risk-bearing transactions between the two.
There are many different types of collateral arrangement, but whatever form the collateral may take, the ultimate aim, as in netting, is to reduce counterparty risk.
Transactions backed by collateral are marked to market periodically (usually daily) and the parameters defined in the collateral agreement are applied to the net result, so as to obtain an amount of collateral (usually cash) to be called from, or returned to, the counterparty.
The table below shows the reasonable value of collaterals applied in counterparty risk mitigation:
TABLE 78. COMPOSITION OF COLLATERAL FOR EXPOSURES TO COUNTERPARTY CREDIT RISK (CCR5-B)
Millions of Euros
31 Dec. 2017
Collateral used in derivative transactions Collateral used in SFTs
Fair value of collateral received Fair value of posted collateralFair value
of collateral received
Fair value of posted collateralSegregated Unsegregated Segregated Unsegregated
Cash - domestic currency 1 5,087 - -4,624 14,100 23,121
Cash - other currencies 17 6,221 - 2,168 5,604 9,053
Domestic sovereign debt - 584 - -169 28,238 25,419
Other sovereign debt - 110 79 -558 14,537 7,424
Government agency debt - 9 - - - -
Corporate bonds - - - - 2,774 4,835
Shares - - - - 12,523 1,917
Other collateral 1 - - - - -
Total 19 12,011 79 -3,183 77,776 71,769
2. Real estate mortgage charge: real estate assets in transactions secured with a mortgage charge, whether ordinary or for the maximum amount. Assets are periodically revalued to reflect actual market values for the different types of property. This reappraisal process meets all the requirements prescribed by the regulator.
3. Other security interests: guarantees over property other than those just described.
When applying mitigation techniques, Santander Group adheres to the minimum requirements established by European regulations and the Group’s own credit and capital frameworks and implementing regulations, especially the Policy for Managing Guarantees. Briefly, these involve monitoring:
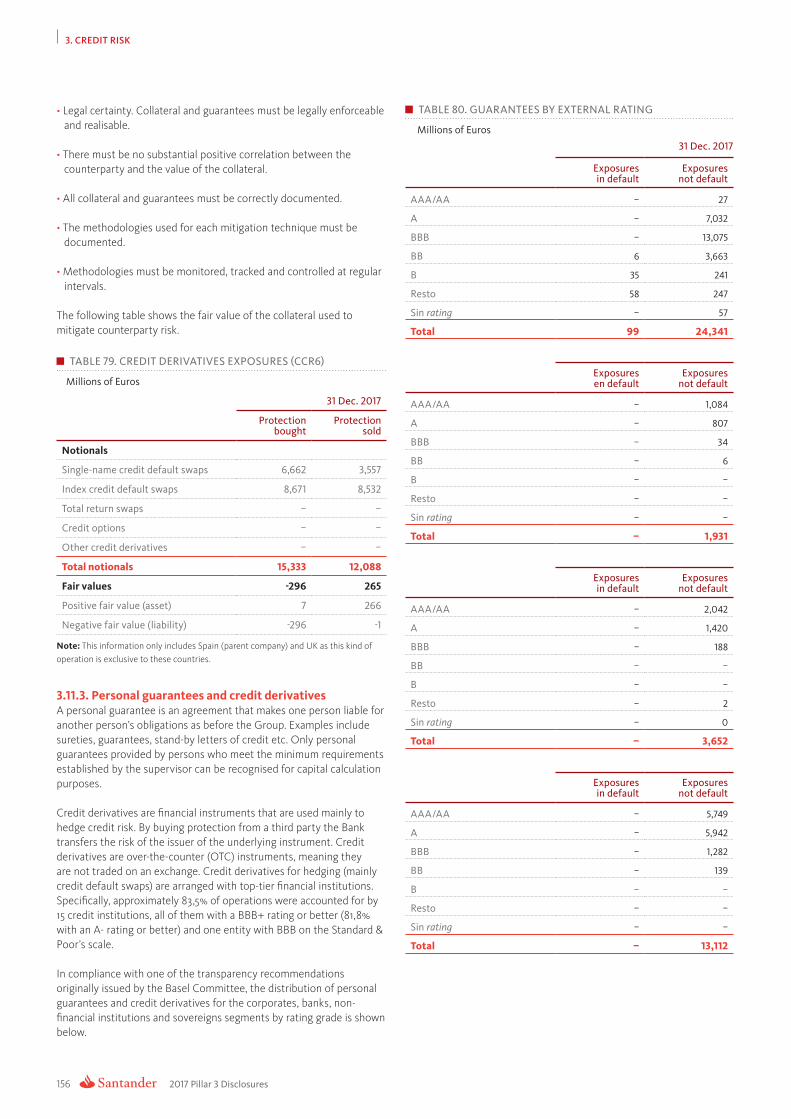
2017 Pillar 3 Disclosures
3. CREDIT RISK
156
• Legal certainty. Collateral and guarantees must be legally enforceable and realisable.
• There must be no substantial positive correlation between the counterparty and the value of the collateral.
• All collateral and guarantees must be correctly documented.
• The methodologies used for each mitigation technique must be documented.
• Methodologies must be monitored, tracked and controlled at regular intervals.
The following table shows the fair value of the collateral used to mitigate counterparty risk.
TABLE 79. CREDIT DERIVATIVES EXPOSURES (CCR6)
Millions of Euros
31 Dec. 2017
Protectionbought
Protectionsold
Notionals
Single-name credit default swaps 6,662 3,557
Index credit default swaps 8,671 8,532
Total return swaps – –
Credit options – –
Other credit derivatives – –
Total notionals 15,333 12,088
Fair values -296 265
Positive fair value (asset) 7 266
Negative fair value (liability) -296 -1
Note: This information only includes Spain (parent company) and UK as this kind of operation is exclusive to these countries.
3.11.3. Personal guarantees and credit derivativesA personal guarantee is an agreement that makes one person liable for another person’s obligations as before the Group. Examples include sureties, guarantees, stand-by letters of credit etc. Only personal guarantees provided by persons who meet the minimum requirements established by the supervisor can be recognised for capital calculation purposes.
Credit derivatives are financial instruments that are used mainly to hedge credit risk. By buying protection from a third party the Bank transfers the risk of the issuer of the underlying instrument. Credit derivatives are over-the-counter (OTC) instruments, meaning they are not traded on an exchange. Credit derivatives for hedging (mainly credit default swaps) are arranged with top-tier financial institutions. Specifically, approximately 83,5% of operations were accounted for by 15 credit institutions, all of them with a BBB+ rating or better (81,8% with an A- rating or better) and one entity with BBB on the Standard & Poor’s scale.
In compliance with one of the transparency recommendations originally issued by the Basel Committee, the distribution of personal guarantees and credit derivatives for the corporates, banks, non-financial institutions and sovereigns segments by rating grade is shown below.
TABLE 80. GUARANTEES BY EXTERNAL RATING
Millions of Euros
31 Dec. 2017
Exposuresin default
Exposures not default
AAA/AA – 27
A – 7,032
BBB – 13,075
BB 6 3,663
B 35 241
Resto 58 247
Sin rating – 57
Total 99 24,341
Exposures en default
Exposures not default
AAA/AA – 1,084
A – 807
BBB – 34
BB – 6
B – –
Resto – –
Sin rating – –
Total – 1,931
Exposuresin default
Exposures not default
AAA/AA – 2,042
A – 1,420
BBB – 188
BB – –
B – –
Resto – 2
Sin rating – 0
Total – 3,652
Exposuresin default
Exposures not default
AAA/AA – 5,749
A – 5,942
BBB – 1,282
BB – 139
B – –
Resto – –
Sin rating – –
Total – 13,112

2017 Pillar 3 Disclosures 157
Main summary
Chapter summary
Enhanc. table
List of tables
3.11.4. Hedged exposure by type of guaranteeThe tables below show the original hedged exposure by collateral type and exposure category for cases where the collateral could be used to reduce capital requirements.
TABLE 81. CREDIT RISK MITIGATION TECHNIQUES - OVERVIEW (CR3)
Millions of Euros.
31 Dec. 2017
Exposures unsecured – Carrying
amountExposures to
be securedExposures secured
by collateralExposures secured by
financial guaranteesExposures secured
by credit derivatives
Total IRB exposures (after CCFs) 274,866 315,207 311,335 3,872 –
of which: default 13,358 11,081 11,011 70 –
Total STD exposures 815,007 4,197 2,383 1,814 –
of which: default 9,708 8 8 – –
TABLE 82. IRB APPROACH. CREDIT RISK MITIGATION TECHNIQUES: CREDIT DERIVATIVES AND PERSONAL GUARANTEES
Millions of Euros
Original exposures covered by different guarantee types and risk categories
31 Dec. 2017 31 Dec. 2016
Financial guarantees Personal guarantees Financial guarantees Personal guarantees
IRB approach
Central administrations and banks – 1,901 – 1,894
Institutions – 13,425 151 9,596
Corporates 3,999 24,275 4,582 21,038
Retail – 1,429 – 270
Total 3,999 41,030 4,733 32,799
3.11.5. Central counterparty exposureThe following tables show central counterparty exposure following risk mitigation techniques.
Santander Group does not have a specific policy on treating limits and collaterals at central counterparty entities. For more information on both management policies please consult the relevant sections in this document (3.10 Counterparty risk) and the Annual Report.
For further details see Chapter 5, sections C.1.5.3 and C.1.4.1. on the 2017 Annual Report on the Santander Group website.

2017 Pillar 3 Disclosures
3. CREDIT RISK
158
TABLE 83. EXPOSURES TO CENTRAL COUNTERPARTIES (CCPS) (CCR8)
Millions of Euros
31 Dec. 2017
EAD (post-CRM) RWA
Exposures to QCCPs (total) 14,680 557
Exposures for trades at QCCPs (excluding initial margin and default fund contributions); of which 13,883 541
(i) OTC derivatives 4,885 98
(ii) Exchange-traded derivatives 381 8
(iii) Securities financing transactions 5 –
(iv) Netting sets where cross-product netting has been approved 8,611 435
Segregated initial margin – –
Non-segregated initial margin 3,849 77
Pre-funded default fund contributions 398 313
Alternative calculation of own funds requirements for exposures – –
Exposures to non-QCCPs (total) – –
*For standardised information, the exposure for trades at QCCPs includes the non-segregated initial margin

2017 Pillar 3 Disclosures 159
Main summary
Chapter summary
Enhanc. table
List of tables

4.1. Basic theoretical considerations on securitisation
161
4.2. Securitisation accounting policies
162
4.3. Management of Santander Group's securitisation activities
162
4.3.1. Santander Group's securitisation objectives and management
162
4.3.2. Role of Santander Group in the securitisation activity
162
4.3.3. Inherent risks of Santander Group’s securitisation activity
164
4.3.4. Securitisation activity in Santander Group
164
SECURITISATIONS
4

2017 Pillar 3 Disclosures 161
Main summary
Chapter summary
Enhanc. table
List of tables
4. Securitisations
This chapter describes the basic concepts relating to securitisations, summarises the goals and functions of the securitisation management activity at Santander Group and provides details of the Group’s securitisation activity.
4.1. Basic theoretical considerations on securitisationAt Santander Group, securitisation is given the treatment stipulated in chapter five of the CRR. In assessing the characteristics of a transaction to determine whether it involves securitisation and must therefore be treated as per said chapter, both the legal form and the economic substance of the transaction are taken into consideration.
In accordance with the CRR, the following concepts will be interpreted having regard to the regulatory definitions given below:
Securitisation: financial transaction or mechanism that takes the credit risk associated with an exposure or pool of exposures and divides it up into tranches with the following characteristics:
a. Payments in the transaction or mechanism are dependent upon the performance of the securitised exposure or pool of exposures.
b. The subordination of tranches determines the distribution of losses during the life of the transaction or mechanism.
Securitisation position: an exposure to a securitisation. For these purposes, the providers of credit risk protection with respect to positions in a given securitisation are considered to hold positions in that securitisation.
Tranche: contractually established segment of the credit risk associated with an exposure or pool of exposures such that each position in the segment entails a risk of credit loss greater or less than a position of the same amount in each other such segment, without taking into account credit protection provided by third parties directly to the holders of positions in the segment or in the other segments. For these purposes, all securitisation positions either form a part of a tranche or constitute a tranche themselves. Accordingly, the following types of tranches can be defined:
• First-loss tranche: this tranche is given a weighting of 1.250%.
• Mezzanine tranche: this is the tranche, other than the first-loss tranche, that ranks below the most senior position in the securitisation and below any position in the securitisation assigned a credit rating of 1 in the case of securitisations under the standardised approach or a rating of 1 or 2 in the case of securitisations under the IRB approach.
• Senior tranche: any tranche that is neither a first-loss nor a mezzanine tranche. Within the senior tranche, the super senior tranche is the top tranche in the priority of payments, without taking into account for these purposes any amounts owed under interest rate or currency derivatives, brokerage charges or similar payments.
Traditional securitisation: a securitisation involving the economic transfer of the securitised exposures to a securitisation special purpose entity (SSPE) that issues securities. This can be accomplished by the transfer of ownership of the securitised exposures from the originator or through sub-participation, which, for these purposes, includes the subscription of mortgage participation certificates, mortgage transfer certificates and similar securities by the SSPE. The securities issued by the SPV do not represent payment obligations of the originator.
Synthetic securitisation: type of securitisation whereby the transfer of risk is achieved by the use of credit derivatives or guarantees and the exposures being securitised remain exposures of the originator.
Re-securitisation: type of securitisation whereby the risk associated with a pool of underlying exposures is divided into tranches and at least one of the underlying exposures is a securitisation position.
Asset-backed commercial paper (ABCP) programme: a programme of securitisations in which the securities issued predominantly take the form of commercial paper maturing within one year or less.
Investing institution: any institution or party other than the originator or sponsor who maintains a securitisation position.
Originator: means an entity which:
a. itself or through related entities, directly or indirectly, was involved in the original agreement which created the obligations or potential obligations of the debtor or potential debtor giving rise to the exposure being securitised; or
b. purchases a third party’s exposures for its own account and then securitises them.
Sponsor: institution other than the originator that establishes and manages an asset-backed commercial paper programme, or other securitisation scheme that purchases exposures from third-party entities and to which liquidity or credit facilities or other credit enhancements are generally granted.

2017 Pillar 3 Disclosures
4. SECURITISATIONS
162
4.2. Securitisation accounting policiesThe rule for derecognising securitised assets is the same as the standard that generally applies when derecognising financial assets. The accounting treatment of transfers of financial assets depends on the extent to which the risks and rewards associated with the transferred assets are transferred to third parties:
1. Where substantially all the risks and rewards are transferred to third parties, e.g. in asset securitisations in which the transferor neither retains subordinated debt nor grants any credit enhancement to the new holders, the transferred financial assets are derecognised and any rights or obligations retained or created in the transfer are recognised simultaneously. The result is recognised in the accounts.
2. Where substantially all the risks and rewards associated with the transferred financial asset are retained (as in securitisations in which subordinated debt or some other type of credit enhancements are retained that absorb substantially all of the expected losses for the transferred asset or the probable variation of its net cash flows), the transferred financial asset is not derecognised and continues to be measured by the same criteria as before the transfer. The following is also recognised in the accounts:
a. An associated financial liability in an amount equal to the consideration received, thereafter measured at amortised cost, unless the requirements for classification as liabilities at fair value through profit or loss are met, in which case it is measured at fair value.
b. The income from the financial asset that has been transferred but not derecognised and any expense incurred on the new financial liability, without netting.
3. Where substantially all the risks and rewards associated with the transferred financial asset are neither transferred nor retained, e.g. in securitisations in which the transferor takes on subordinated debt or some other type of credit enhancement for a portion of the transferred asset and thus significantly but not substantially reduces its exposure to the variation in the present value of future net cash flows, the following distinction is made:
a. Where the transferor does not retain control, the transferred financial asset is derecognised and any right or obligation retained or created in the transfer is recognised.
b. Where the transferor retains control of the transferred financial asset, it continues to recognise the transferred financial asset on its balance sheet for an amount equal to its exposure to possible changes in value and recognises a financial liability associated with the transferred financial asset. The net amount of the transferred asset and associated liability is the amortised cost of the rights and obligations retained, if the transferred asset is measured at amortised cost, or the fair value of the rights and obligations retained, if the transferred asset is measured at fair value.
Accordingly, financial assets are only derecognised when the rights to the cash flows they generate expire or when substantially all the inherent risks and rewards have been transferred to third parties and when substantially all the risks and rewards are neither transferred nor retained but control of the assets is transferred.
There have been no changes with respect to the previous year in the methods, assumptions and key data used to assess securitised exposures.
There is no specific accounting treatment for synthetic securitisations or assets awaiting securitisation.
4.3. Management of Santander Group’s securitisation activity4.3.1. Santander Group’s securitisation objectives and managementThrough its securitisation activity Santander Group aims to:
• Manage and diversify its credit risk: securitisation transactions and the subsequent sale of the securitisation bonds in the market serve to reduce the credit risk concentrations that can arise naturally from the Group’s commercial activity. The effective transfer of risks achieved through these transactions enables the Group to optimise its credit risk exposure and contributes to value creation by reducing the Bank’s need to retain own funds.
• Obtain liquidity: securitisation enables the Group to mobilise its balance sheet by transforming illiquid assets into liquid assets and obtain wholesale funding by selling or collateralising those transformed assets. Also, the retained securitisation positions can be used as collateral for discounting at the ECB.
• Diversify funding sources: the liquidity obtained from securitisation allows the Group to diversify its funding sources in terms of duration and product.
• Optimise capital consumption: five new securitisations were originated in 2017, all involving a significant transfer of risk.
Each year, based on the liquidity plan and taking into account certain prudential limits on raising short-term market funding, Santander Group establishes an yearly issue and securitisation plan for each subsidiary/global business. This task is carried out by financial management.
4.3.2. Role of Santander Group in the securitisation activitySantander Group’s role in the securitisation process is mainly that of originator of the underlying assets being securitised. Nevertheless, in addition to originating the underlying payments, the Group also plays a role in servicing the loans and granting subordinated loans. It also acts as counterparty, when needed, to the interest rate swap agreement for the SSPE that acquires the loans.
Santander Group also acts as an investor, acquiring positions in SSPEs originated by non-Group entities and/or retaining a portion of the positions originated by the Bank itself.

2017 Pillar 3 Disclosures 163
Main summary
Chapter summary
Enhanc. table
List of tables
Santander Group is sponsor of a securitisation transaction whose underlying consists of loans granted by various financial institutions to SSPEs of mortgage-backed bonds to cover the reserve fund.
Santander Group also structures and places its own securitisations, as it does for third parties, and leads and promotes new structures in different jurisdictions for both funding and risk transfer purposes. This activity is situated in the context of a revival of securitisation as a tool for channelling credit to the real economy, with a special focus on SMEs.
The following diagram depicts the geographical distribution of Santander Group’s securitisation activity as of 31 December 2017.
Note: the information on the securitisation positions of the investment and trading portfolio of Santander Group is included. In originator activity, Rest includes Austria (0.3%), the Netherlands (0.3%), Norway (0.3%), Poland (0.6%) y Sweden (0.5%).
Note: the information on the securitisation positions of the investment and trading portfolio of Santander Group is included. In investor activity, Rest includes Luxembourg (0.1%), Austria (0.2%), Finland (0.1%), Ireland (0.2%), Mexico (0.2%), the Netherlands (0.4%), Norway (0.3%), Poland (0.2%), Sweden (0.1%) y Brazil (0.2%).
ORIGINATOR ACTIVITY INVESTOR ACTIVITY
9.52%
90.42%
0.06%
Investor Originator Sponsor
10%2% Germany Spain France UK Finland Italy Portugal USA Rest
51%4%
10%
1%3%2%
17% 12%
60%
4 %
13 %
5 %2 %
2 %2%
Germany Spain France UK Italy Portugal USA Rest
DISTRIBUTION OF THE GROUP’S SECURITISATION FUNCTION AND DISTRIBUTION BY COUNTRY OF ORIGINATION OR INVESTMENT POSITION

2017 Pillar 3 Disclosures
4. SECURITISATIONS
164
As indicated in the graph, originator activity accounts for more than 90% of Santander Group securitisation activity, with investment activity accounting for 9.52% and sponsoring accounting for 0.06% (the latter being concentrated in Spain).
88% of the volume of securitisations originated by Santander Group is concentrated Spain, the United States, Germany and the United Kingdom.
On the investment side, 93% of acquisitions of investment positions are concentrated in the United Kingdom (55%) and Spain (38%) as shown in the next graph.
Furthermore, regarding the distribution of positions by country from the debtor, it can be seen that 59.79% of the final risk is in Spain, 12.83% is in the United Kingdom (because the positions that are invested from the United Kingdom are located in the same), 12.39% in Germany and the rest are essentially distributed throughout Europe, as it can be seen in the investor activity graph on the previous page:
GEOGRAPHICAL DISTRIBUTION OF INVESTMENT ACTIVITY BY COUNTRY OF THE END DEBTOR OF THE TRANSACTION
Spain Portugal UK Mexico USA
38%
1%55%
2% 4%
4.3.3. Inherent risks of Santander Group’s securitisation activityWhile securitisation offers advantages in terms of lower funding costs and better risk management, it exposes investors to certain inherent risks. Santander Group is not exposed to any additional risk by acting as originator or sole investor in any given SSPE. In fact, doing so reduces liquidity risk by transforming illiquid assets (originated loans) into liquid assets (securitisation bonds). When Santander Group acts as originator and as one of the investors in the issue, it is subject to the following risks:
• Credit risk: the risk that borrowers will fail to meet their contractual obligations in due time and form, with the consequent impairment of the underlying assets backing the securitisation positions. Credit risk is assessed by external credit rating agencies, which assign ratings to the securitisation positions. At Santander Group, the maximum exposure in the banking book is limited by rating (AAA, AA, A, BBB, BB) and by type of underlying. In addition, the Group continuously monitors published data on default of the underlying, credit quality of the originator and mandatory minimum ratios and ratings in the structure, as well as data on granularity, geographical distribution and type of underlying.
• Pre-payment risk: the risk of early repayment of all or part of the assets underlying the securitisation, so that the securitisation positions mature before the contractual maturity date of the underlyings. The calculation of the average life, return and duration of the securitisation positions is subject, among other things, to assumptions about the rate at which the underlying loans will be prepaid, which may vary. This risk is practically non-existent at Santander Group as the contractual maturity of the securities issued is usually longer than that of any underlying.
• Basis risk: this risk arises when there is a mismatch between the interest rates or maturities of the securitised assets and those of the securitisation positions. At Santander Group this risk is usually hedged with swaps.
• Exchange rate risk: comes into play in securitisations where the securitised assets and the securitisation positions are denominated in a different currencies. At Santander Group, the risk arising from the currency mismatch between the underlying and the issue is usually hedged in the structure via a swap. The risk to PnL assumed in non-euro bonds is managed by the Active Credit Portfolio Management (ACPM) area.
• Liquidity risk: is diminished through the securitisation process, whereby naturally illiquid assets are transformed into debt securities that can be traded on exchanges. In some securitisations, however, such as those which issue commercial paper, liquidity risk is still significant and is manifested in the need to cover potential timing mismatches between interest payments on the underlying assets and payments of interest on the securities. At Santander Group this risk tends to be very small and is mitigated by liquidity lines included in the structure. The liquidity risk associated with bond positions is also managed by establishing maximum holding periods.
4.3.4. Securitisation activity at Santander GroupSantander Group originated five securitisations in 2017 with the aim of achieving a significant transfer of risk.
Furthermore, Santander Group originates and holds positions in traditional securitisation funds whose underlying portfolios are composed mainly of mortgages, consumer loans and corporate loans. The Group is also the originator of five synthetic securitisation funds (three originated in 2017) whose underlying assets comprise project finance loans refinancing two funds in one case; loans to SMEs in two of the cases; loans to corporates in one other case; and commercial mortgage loans in the last case.
For each of these traditional structures, and no matter the underlying product, Santander Group is awarded a rating by one or more of the following external rating agencies: Standard & Poor’s, Moody’s, Fitch, DBRS and Scope. Where a traditional securitisation is placed on the market, the Group obtains ratings from at least two of those agencies. For two of the synthetic securitisations, two external ratings have been requested.
As for investment activity, Santander Group holds positions in securitisation funds originated by entities outside Santander Group whose underlying assets mainly comprise corporate loans, SME loans and mortgages As Santander Group limits its maximum exposure by rating (AAA,AA, A, BBB, BB), it does not commonly employ hedging techniques to mitigate the risk.
Monitoring changes in associated risk:
• Securitisation positions originated: periodic monitoring is the responsibility of the different securitisation fund managers (Trustees/Management companies) that prepare regular reports containing an update of the rating performance of the bonds’ underlying portfolios.
• Inverse securitisation positions: published NPL metrics (90+, default, recoveries) and prepayments are monitored regularly using specialised software, which additionally checks whether the established rating-based limits are being met.

2017 Pillar 3 Disclosures 165
Main summary
Chapter summary
Enhanc. table
List of tables
The processes mentioned above serve to monitor changes in credit and market risks of both securitisation and re-securitisation exposures.
The performance of the underlying assets particularly affects the duration of the tranches and it is unlikely that this will affect the principal bearing in mind the high levels of subordination and continuous monitoring.
The following tables show the distribution, by type of underlying asset, of the securitisation positions issued and repurchased by Santander Group as originator, as investor and as sponsor as of 31 December 2017, in both the banking book and trading portfolio.
As of 31 December 2017, there are no assets awaiting securitisation.
The following table shows new securitisations by type of securitisation and type of exposure being securitised.
TABLE 84. SECURITISATION POSITIONS PURCHASED OR RETAINED. BANKING BOOK
Million of Euros
31 dec. 2017 31 dec. 2016
Originator Investor Sponsor Originator Investor Sponsor
Issu
edpo
siti
ons
Reta
ined
posi
tion
s
Purc
hase
dpo
siti
ons
Purc
hase
dpo
siti
ons
Issu
edpo
siti
ons
Reta
ined
posi
tion
s
Purc
hase
dpo
siti
ons
Purc
hase
dpo
siti
ons
Traditional securitisations
Residential mortgages 30,976 23,974 4,066 – 37,552 23,285 1,667 –
Commercial mortgages 75 36 – – – – – –
Credit cards 468 468 117 – – – 400 –
Finance leases 2,713 1,231 38 – 1,224 391 97 –Loans to corporates or to SMEs treated as corporates 3,510 2,722 1,008 – 7,198 6,181 3,262 –
Consumer loans 44,351 21,413 411 – 41,707 14,606 185 –
Receivables 3,449 3,449 – – 2,156 2,156 93 –
Mortgage covered bonds – – 54 – 110 – – –
Others – – 374 – – – 518 –
Resecuritisations
Residential mortgages – – – – 14 – – –
Commercial mortgages – – – – – – – –
Loans to corporates or to SMEs treated as corporates – – – – – – – –
Others – – 5 40 123 – 20 40
Synthetic securitisations
Residential mortgages – – – – 4 – – –
Commercial mortgages – – – – – – – –Loans to corporates or corporates-SMEs 2,954 2,717 – – 1,381 1,278 – –
Consumer loans 3,936 3,688 – – – – – –
Others 2,293 2,003 326 – 1,622 1,192 294 –
Total 94,725 61,701 6,399 40 93,089 49,088 6,536 40

2017 Pillar 3 Disclosures
4. SECURITISATIONS
166
The following table shows the exposure of all securitisations in the banking book, distinguishing between wholesale and retail underlying.
TABLE 85. SECURITISATION EXPOSURES IN THE BANKING BOOK (SEC1)
Millions of Euros
31 Dec. 2017
Bank acting as originator Bank acting as sponsor Bank acting as investor
Trad
itio
nal
Synt
heti
c
Subt
otal
Trad
itio
nal
Synt
heti
c
Subt
otal
Trad
itio
nal
Synt
heti
c
Subt
otal
Retail (total) 45,855 3,688 49,543 – – – 4,594 – 4,594
Residential mortgages 23,974 – 23,974 – – – 4,066 – 4,066
Credit card 468 – 468 – – – 117 – 117
Other retail exposures 21,413 3,688 25,101 – – – 411 – 411
Resecuritisation – – – – – – – – –
Wholesales (total) 7,438 4,720 12,158 40 – 40 1,479 326 1,805
Corporate loans 510 935 1,445 – – – 360 – 360
Commercial mortgage 36 – 36 – – – – – –
Finance leases and receivables 1,231 – 1,231 – – – 38 – 38
Other wholesale exposures 5,661 3,785 9,445 – – – 1,076 326 1,402
Resecuritisation – – – 40 – 40 5 – 5
Total 53,293 8,408 61,701 40 – 40 6,074 326 6 399
* The securitisation portfolio has been considered as a whole (positions bought and retained).
The previous table shows that regardless of the role played by the Bank, the securitisation portfolio is predominantly focused on retail.
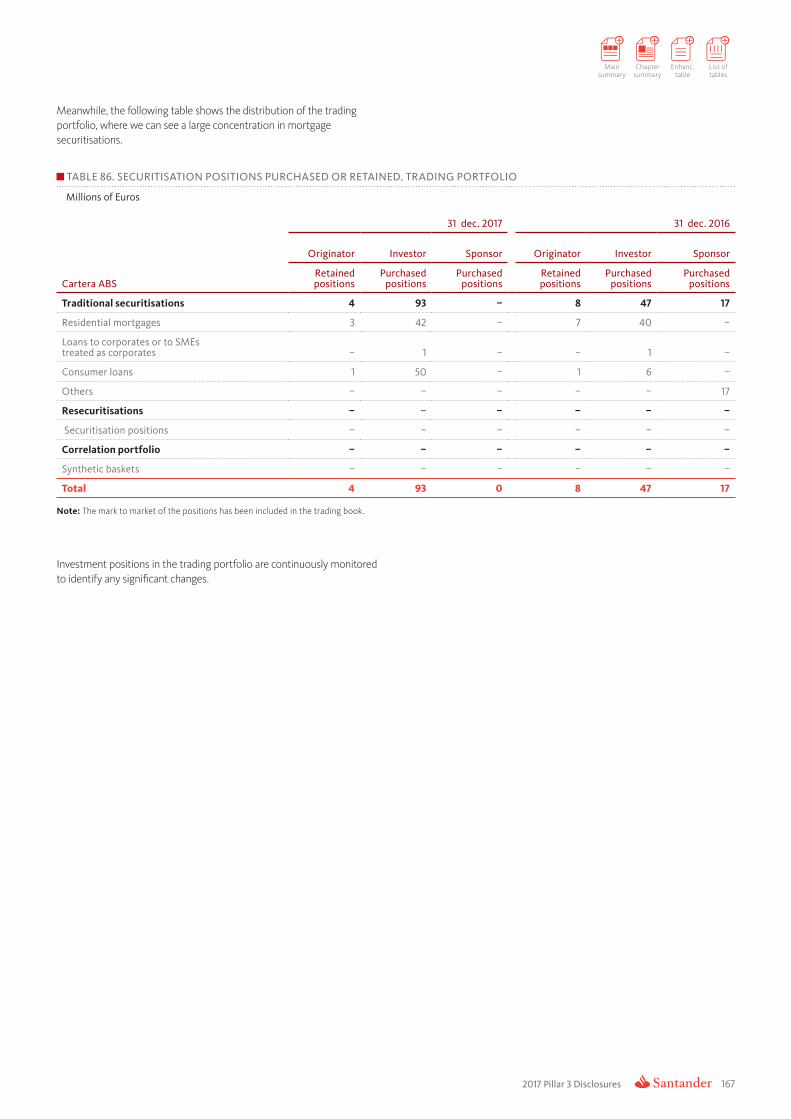
2017 Pillar 3 Disclosures 167
Main summary
Chapter summary
Enhanc. table
List of tables
Meanwhile, the following table shows the distribution of the trading portfolio, where we can see a large concentration in mortgage securitisations.
TABLE 86. SECURITISATION POSITIONS PURCHASED OR RETAINED. TRADING PORTFOLIO
Millions of Euros
Cartera ABS
31 dec. 2017 31 dec. 2016
Originator Investor Sponsor Originator Investor Sponsor
Retainedpositions
Purchasedpositions
Purchasedpositions
Retainedpositions
Purchasedpositions
Purchasedpositions
Traditional securitisations 4 93 – 8 47 17
Residential mortgages 3 42 – 7 40 –
Loans to corporates or to SMEs treated as corporates – 1 – – 1 –
Consumer loans 1 50 – 1 6 –
Others – – – – – 17
Resecuritisations – – – – – –
Securitisation positions – – – – – –
Correlation portfolio – – – – – –
Synthetic baskets – – – – – –
Total 4 93 0 8 47 17
Note: The mark to market of the positions has been included in the trading book.
Investment positions in the trading portfolio are continuously monitored to identify any significant changes.
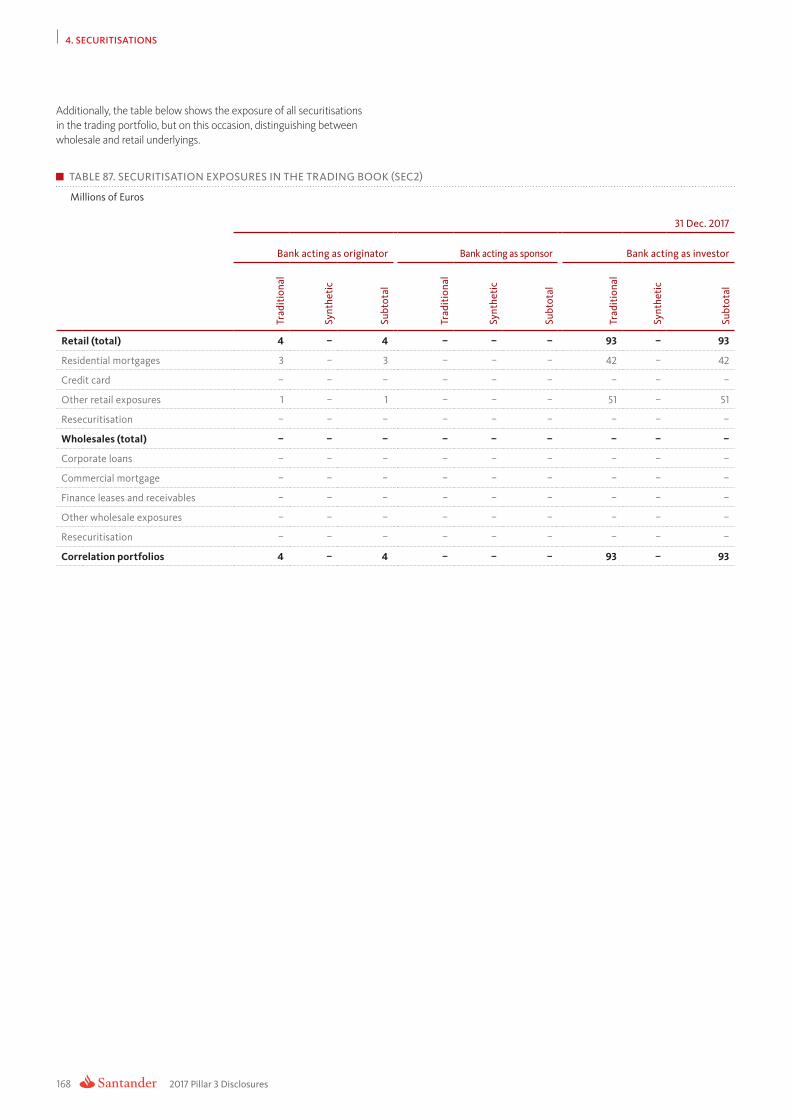
2017 Pillar 3 Disclosures
4. SECURITISATIONS
168
Additionally, the table below shows the exposure of all securitisations in the trading portfolio, but on this occasion, distinguishing between wholesale and retail underlyings.
TABLE 87. SECURITISATION EXPOSURES IN THE TRADING BOOK (SEC2)
Millions of Euros
31 Dec. 2017
Bank acting as originator Bank acting as sponsor Bank acting as investor
Trad
itio
nal
Synt
heti
c
Subt
otal
Trad
itio
nal
Synt
heti
c
Subt
otal
Trad
itio
nal
Synt
heti
c
Subt
otal
Retail (total) 4 – 4 – – – 93 – 93
Residential mortgages 3 – 3 – – – 42 – 42
Credit card – – – – – – – – –
Other retail exposures 1 – 1 – – – 51 – 51
Resecuritisation – – – – – – – – –
Wholesales (total) – – – – – – – – –
Corporate loans – – – – – – – – –
Commercial mortgage – – – – – – – – –
Finance leases and receivables – – – – – – – – –
Other wholesale exposures – – – – – – – – –
Resecuritisation – – – – – – – – –
Correlation portfolios 4 – 4 – – – 93 – 93

2017 Pillar 3 Disclosures 169
Main summary
Chapter summary
Enhanc. table
List of tables
The following table shows securitisations originated by Santander Group with the highest outstanding balance as of 31 December 2017.
TABLE 88. INVENTORY OF ORIGINATED SECURITISATIONS WITH LARGEST OUTSTANDING BALANCE
Millions of Euros
Securitisation fund
Balance issued 31 Dec. 2017 Repurchased balance 31 Dec. 2017
On-balance sheet exposures
Off
-bal
ance
she
etex
posu
res
TYPE Seni
ortr
anch
es
Mez
zani
netr
anch
es
Firs
t-lo
sstr
anch
es
Seni
ortr
anch
es
Mez
zani
netr
anch
es
Firs
t-lo
sstr
anch
es
RMBS Santander 3 Residential mortgages 3,538 – 1,882 3,538 – 1,882 –
FTA Santander 2 Receivables 2,280 – 1,169 2,280 – 1,169 –
Star 2016-1 Consumer loans 3,076 200 50 3,076 – 50 –
SC Germany Auto 2014-2 Consumer loans 2,895 – 135 2,895 – 135 –
Langton securities 2008 SPV
Residential mortgages 1,926 – 728 1,926 – 728 –
IM GBP Empresas VII
Loans to corporates or to SMEs treated as corporates 1,825 – 729 1,825 – 729 –
RMBS Santander 4 Residential mortgages 1,800 – 738 1,304 – 738 –
RMBS Santander 2 Residential mortgages 1,673 – 798 1,673 – 798 –
Renew project finance clo 2017-1 Other assets 1,646 527 120 1,646 357 1 –
Holmes master issuer PLC 2000 SPV
Residential mortgages 1,729 – 437 157 – 437 157
SC Germany Auto 2016-2 Consumer loans 1,440 – 75 1,440 – 75 –
Auto ABS French Loans Master Consumer loans 1,101 – 133 1,101 – 133 –
Santander hipotecario 3
Residential mortgages 188 786 251 188 710 243 15
Golden Bar Stand Alone 2016-1 Consumer loans 902 143 78 902 143 78 –
RED ONE
Loans to corporates or to SMEs treated as corporates 863 101 70 863 72 – –
GoldenBar2015-1 Consumer loans – 1,000 – – 1,000 – –
Sant prime auto issuances notes trust 2017-C Consumer loans 829 133 38 829 95 13 –

2017 Pillar 3 Disclosures
4. SECURITISATIONS
170
Prov
ided
bel
ow is
a b
reak
dow
n of
all
secu
ritisa
tions
in th
e ba
nkin
g bo
ok to
geth
er
with
its c
orre
spon
ding
cap
ital c
onsu
mpt
ion
arra
nged
by
RW in
terv
al (r
isk w
eigh
t) an
d ca
lcul
atio
n m
etho
d em
ploy
ed w
hen
Sant
ande
r G
roup
act
s as o
rigin
ator
or s
pons
or.
TA
BLE
89.
SEC
UR
ITIS
ATI
ON
EXP
OSU
RES
IN T
HE
BA
NK
ING
BO
OK
AN
D A
SSO
CIA
TED
REG
ULA
TORY
CA
PITA
L R
EQU
IREM
ENTS
(BA
NK
AC
TIN
G A
S O
RIG
INA
TOR
OR
SPO
NSO
R) (S
EC3)
31 D
ec. 2
017
Val
ue o
f the
exp
osur
e (b
y RW
inte
rval
)V
alue
of t
he e
xpos
ure
(by
regu
lato
r met
hod)
RWA
(by
regu
lato
r met
hod)
Cap
ital
requ
irem
ent a
fter
cei
ling
<= 20% RW
> 20% to 50% RW
> 50% to 100% RW
> 100%to 1,250% RW
1,250% RW
IRB RBA
IRB SFA
SA
1,250%
IRB RBA
IRB SFA
SA
1,250%
IRB RBA
IRB SFA
SA
1,250%
Tota
l exp
osur
e 12
,831
2
35
34
3 7
6 4
9 5
,793
4
,90
7 2
,810
2
4
74
5 7
08
963
3
00
6
0
57
77
24
Trad
itio
nal s
ecur
itis
atio
n 4
,70
6 18
8 17
4 9
4
9 3
,790
–
1,
312
24
436
–
6
29
30
0
35
–
50
2
4
Of w
hich
, sec
urit
isat
ion
4,7
06
148
173
9
49
3,7
49
–
1,31
2 2
4 4
10
–
629
3
00
3
3 –
5
0
24
Of w
hich
, ret
ail u
nder
lyin
g 4
,70
6 14
8 17
3 9
4
9 3
,749
–
1,
312
24
410
–
6
29
30
0
33
–
50
2
4
Of w
hich
, who
lesa
le u
nder
lyin
g –
–
–
–
–
–
–
–
–
–
–
–
–
–
–
–
–
Of w
hich
, res
ecur
itis
atio
n –
4
0
0
–
–
40
–
–
–
2
6 –
–
–
2
–
–
–
Of w
hich
, pre
fere
nce
–
–
–
–
–
–
–
–
–
–
–
–
–
–
–
–
–
Of w
hich
, non
-pre
fere
nce
–
40
0
–
–
4
0
–
–
–
26
–
–
–
2
–
–
–
Synt
heti
c se
curi
tisa
tion
8,1
25
46
169
67
–
2,0
03
4,9
07
1,49
8 –
3
09
70
8 3
34
–
25
57
27
–
Of w
hich
, sec
urit
isat
ion
8,12
5 4
6 16
9 6
7 –
2
,00
3 4
,90
7 1,
498
–
30
9 7
08
334
–
2
5 5
7 2
7 –
Of w
hich
, ret
ail u
nder
lyin
g 3
,638
–
–
5
0
–
–
3,12
6 5
62
–
–
443
11
2 –
–
3
5 9
–
Of w
hich
, who
lesa
le u
nder
lyin
g 4
,487
4
6 16
9 17
–
2
,00
3 1,
781
935
–
3
09
266
2
22
–
25
21
18
–
Of w
hich
, res
ecur
itis
atio
n –
–
–
–
–
–
–
–
–
–
–
–
–
–
–
–
–
Of w
hich
, pre
fere
nce
–
–
–
–
–
–
–
–
–
–
–
–
–
–
–
–
–
Of w
hich
, non
-pre
fere
nce
–
–
–
–
–
–
–
–
–
–
–
–
–
–
–
–
–

2017 Pillar 3 Disclosures 171
Main summary
Chapter summary
Enhanc. table
List of tables
TA
BLE
90.
SEC
UR
ITIS
ATI
ON
EXP
OSU
RES
IN T
HE
BA
NK
ING
BO
OK
AN
D A
SSO
CIA
TED
R
EGU
LATO
RY C
API
TAL
REQ
UIR
EMEN
TS (B
AN
K A
CTI
NG
AS
INV
ESTO
R) (S
EC4)
31 D
ec. 2
017
Val
ue o
f the
exp
osur
e (b
y RW
inte
rval
)V
alue
of t
he e
xpos
ure
(by
regu
lato
r met
hod)
RWA
(by
regu
lato
r met
hod)
Cap
ital
requ
irem
ent a
fter
cei
ling
<= 20% RW
> 20% to 50% RW
> 50% to 100% RW
> 100%toa 1,250% RW
1250% RW
IRB RBA
IRB SFA
SA
1,250%
IRB RBA
IRB SFA
SA
1250%
IRB RBA
IRB SFA
SA
1,250%
Tota
l exp
osur
e5,
617
537
246
–0
6,0
39–
360
072
9–
233
058
–19
0
Trad
itio
nal s
ecur
itis
atio
n5,
447
381
245
–0
5,71
4–
360
065
5–
233
052
–19
0
Of w
hich
, sec
urit
isat
ion
5,44
238
124
5–
05,
708
–36
00
654
–23
30
52–
190
Of w
hich
, res
ecur
itis
atio
n4,
424
7397
––
4,59
4–
––
496
––
–40
––
–
Of w
hich
, pre
fere
nce
1,018
308
148
–0
1,114
–36
00
157
–23
30
13–
190
Of w
hich
, non
-pre
fere
nce
5–
––
–5
––
–1
––
–0
––
–
Of w
hich
, pre
fere
nce
5–
––
–5
––
–1
––
–0
––
–
Of w
hich
, non
-pre
fere
nce
––
––
––
––
––
––
––
––
–
Synt
heti
c se
curi
tisa
tion
169
156
1–
–32
6–
––
74–
––
6–
––
Of w
hich
, sec
urit
isat
ion
169
156
1–
–32
6–
––
74–
––
6–
––
Of w
hich
, ret
ail u
nder
lyin
g–
––
––
––
––
––
––
––
––
Of w
hich
, who
lesa
le u
nder
lyin
g16
915
61
––
326
––
–74
––
–6
––
–
Of w
hich
, res
ecur
itis
atio
n–
––
––
––
––
––
––
––
––
Of w
hich
, pre
fere
nce
––
––
––
––
––
––
––
––
–
Of w
hich
, non
-pre
fere
nce
––
––
––
––
––
––
––
––
–
The
prev
ious
tabl
e re
flect
s tha
t nea
rly 9
5% o
f the
secu
ritisa
tions
in w
hich
Sa
ntan
der G
roup
inve
sts b
elon
g to
ent
ities
whe
re c
apita
l req
uire
men
ts
are
calc
ulat
ed u
nder
the
adva
nced
IRB
mod
els.
This
is m
ainl
y th
e ca
se o
f Sa
ntan
der S
pain
and
San
tand
er U
K. O
n th
e ot
her h
and,
the
stan
dard
ised
appr
oach
is re
leva
nt in
the
US
and
Mex
ico.

2017 Pillar 3 Disclosures
4. SECURITISATIONS
172
Finally, in its securitisation activity, both as originator and as investor, Santander Group complies with the economic interest retention required under chapter five of CRR and with the control policy and procedure requirements for all SPVs created after January 1, 2011. Accordingly, for all securitisation originated since January 1, 2011, Santander Group:
• Constantly retains a net economic interest of no less than 5%.
• Makes available to investors all the necessary information to ensure the risks of the investment are fully known before purchase and to allow the performance of the investment to be monitored on a regular basis. This information includes details of the risk criteria applied to the securitised exposures, which in all cases are the same as for the non-securitised exposures in the originator’s balance sheet.
Similarly, for investor positions in securitisations originated since January 1, 2011, Santander Group:
• Carries out due diligence to ensure that the investment risks are known before purchase and to be able to monitor the performance of the investment on a regular basis.
• Checks that the originator of the securitisations retains a net economic interest of no less than 5%.
As Santander Group complies with these requirements, no capital surcharge is applied.
Santander Group’s securitisation activity during 2017Out of the total issues carried out in 2017, Santander Group retains 35% of the securitisation positions.
The accompanying table gives a breakdown of initial balance of the securitisation positions issued and retained by Santander Group in 2017 on their date of origination.
TABLE 91. INITIAL BALANCE OF SECURITISATION FUNDS IN 2017, BY TYPE OF SECURITISED ASSET
Millions of Euros
Type of underlying asset
31 dec. 2017 31 dec. 2016
Securitised exposures at the origination date
Repurchased balance
Securitised exposures at the origination date
Repurchased balance
Traditional securitisations
Residential mortgages 805 161 960 296
Credit Cards 519 468 – –
Leasing 2,380 895 640 230
Loans to corporates or to SMEs treated as corporates 510 510 – –
Consumer loans 14,475 2,238 18,156 7,708
Synthetic securitisations
Loans to corporates or SMEs 1,962 1,820 1,166 536
Others 2,293 2,003 – –
TOTAL 22,944 8,095 20,922 8,771
This originator activity was concentrated in Spain (26.92%) and the United States (53.35%). The new securitisations originated during 2017 are summarized in the accompanying table. For further information, see Appendix VIII, which includes the list of special purpose vehicles within the scope of regulatory consolidation.
In 2017, Santander Group originated 27 securitisations whose underlying portfolios comprised consumer loans (67.9% of total issues), loans to companies or SMEs (10.8%), other assets (10%), leasing (5,6%), residential mortgages (3,5%) and credit cards (2,3%). More detail about this securitisations is provided by the following table:
Access file2017 Pillar 3 Appendicesavailable on the Santander Group website.

2017 Pillar 3 Disclosures 173
Main summary
Chapter summary
Enhanc. table
List of tables
TABLE 92. LIST OF NEW SECURITISATIONS ORIGINATED IN 2017, ORGANISED BY COUNTRY AND ORIGINATING INSTITUTION AND ORDERED BY INITIAL ISSUE VOLUME
Name of securitisation Type of underlying asset Originator Initial issue Country
IM GBP Leasing 3 Consumer loans BANCO POPULAR 1.100.000
Spain
Renew project finance CLO 2017-1 Other assets BANCO SANTANDER 2.293.393
FT Pymes magdalena Loans to corporates or to SMEs treated
as corporates
BANCO SANTANDER 950.000
FTA-Prado IV Residential mortgages UCI 390.000
FTA-Prado V Residential mortgages UCI 415.000
IM GBP Consumo I Loans to corporates or to SMEs treated
as corporates
BANCO POPULAR 510.000
Wizink Master credit cards Credit cards BANCO POPULAR 518.800
6.177.193 26,92%
SC Germany Auto 2017-1 Consumer loans SC GERMANY 600.000Germany
SC Germany Consumer 2017-1 Consumer loans SC GERMANY 850.0001.450.000 6,32%
SCF RAHOITUSPALVELUT KIMI VI DAC Consumer loans SC NORDICS 699.492 Nordics699.492 3,05%
Auto ABS French LT Leases Master Consumer loans PSA FRANCE 350.000 France350.000 1,53%
HCUK Auto Funding 2017-1Ltd Consumer loans HYUNDAI CAPITAL UK LTD
169.066
UK
HCUK Auto Funding 2017-2ltd Consumer loans HYUNDAI CAPITAL UK LTD
169.066
Motor 2017-1PLC Consumer loans SC UK 674.912
Red One Loans to corporates or to SMEs treated
as corporates
ABBEY NATIONAL TREASURY
SERVICES PLC
1.012.446
2.025.489 8,83%DRIVE Auto Receivables Trust 2017-1 Consumer loans SC USA 1.152.898
USA
DRIVE Auto Receivables Trust 2017-2 Consumer loans SC USA 984.284
DRIVE Auto Receivables Trust 2017-3 Consumer loans SC USA 1.279.706
Santander Drive Auto Receivables Trust 2017-1 Consumer loans SC USA 1.020.608
Santander Drive Auto Receivables Trust 2017-2 Consumer loans SC USA 1.253.794
Santander Drive Auto Receivables Trust 2017-3 Consumer loans SC USA 909.862
Santander Drive Auto Receivables Trust 2017-A Consumer loans SC USA 1.119.235
Santander Drive Auto Receivables Trust 2017-B Consumer loans SC USA 1.136.519
Santander Retail Auto Lease Trust 2017-A Leasing SC USA 1.279.706
SANT Prime Auto Issuances Notes Trust 2017-A Consumer loans SC USA 555.966
SANT Prime Auto Issuances Notes Trust 2017-B Consumer loans SC USA 425.940
SANT Prime Auto Issuances Notes Trust 2017-C Consumer loans SC USA 1.123.163
12.241.681 53,35%
Total 22.943.855
ORIGINATION BY COUNTRY
%
5%20%
14%
11%
43%3%
1%3% Spain
Germany Nordics USA UK France Poland Italy

5.1. Activities subject to market risk 175
5.2. Trading 1755.2.1. Value at risk 175
5.2.2. Stressed VaR 177
5.2.3. Incremental risk charge 178
5.2.4. Stress testing 178
5.2.5. Backtesting (MR4) 179
5.2.6. Internal validation of the models
183
5.3. Structural market risk 185
5.4. Equity investments and capital instruments not included in the trading book
185
MARKET RISK
5

2017 Pillar 3 Disclosures 175
Main summary
Chapter summary
Enhanc. table
List of tables
5. Market risk
This chapter provides information about activities subject to market risk and the performance of market risks and results in 2017, distinguishing between trading activity and structural risks. It also describes the methodologies and metrics used by Santander Group.
5.1. Activities subject to market riskThe measurement, control and monitoring of market risk extends to all operations exposed to changes in market prices. This risk arises from changes in the risk factors (interest rate, exchange rate, equities, credit spread, commodity prices and the volatility of each of these factors) and from the liquidity risk of the various products and markets in which Santander Group operates.
The activities are segmented according to the purpose of the risk taking:
a) Trading: includes financial services for customers and trading and the taking of positions, mainly in fixed-income, equities and currency products.
b) Structural risks: these are composed of the market risks inherent in the balance sheet, not including the trading portfolio, namely:
• Structural interest rate risk: this risk arises from mismatches in the maturities and repricing of all the balance sheet assets and liabilities.
• Structural foreign exchange risk (hedges of results): foreign currency risk arising from the currency in which investments in the consolidated and non-consolidated companies are made (structural exchange rate). This category also includes the positions taken to hedge the foreign currency risk on future results generated in currencies other than the euro (hedges of results).
• Structural equity risk: this includes equity investments in non-consolidated financial and non-financial companies, and the available-for-sale portfolios of equity positions.
5.2. Trading activityThe basic metric used to control market risk in trading operations at Santander Group in 2017 was value at risk (VaR). VaR measures the maximum expected loss for a given confidence level and time horizon.
VaR is used because it is easy to calculate and because it provides a good reference for the level of risk incurred. Other measures are also used to give greater control over the risks in the markets in which the Group operates.
One of these other measures is scenario analysis, which consists of defining alternative behaviours for various financial variables and determining the impact on results when these scenarios are applied to the Group’s activities. The scenarios may replicate past events (such as crises) or, conversely, they may describe plausible scenarios unrelated to past events. At least three types of scenarios are defined: plausible, severe and extreme. Together with VaR, these three types of scenario provide a much more complete understanding of the risk profile.
In line with the principle of business unit independence, the Market Risk area monitors positions daily, both at the level of the individual unit and globally, exhaustively controlling for changes in portfolios so as to detect any incidents and correct them immediately. Preparing a daily income statement is an excellent risk indicator because it helps to identify the impact that changes in financial variables have had on the portfolios.
Lastly, derivatives and credit management activities, being atypical, are controlled daily using specific measures. In the case of derivatives, controls are conducted of sensitivity to fluctuations in the price of the underlying (delta and gamma), volatility (vega) and time (theta). For credit management activities, measures such as spread sensitivity, jump-to-default and exposure concentrations by rating level are all systematically reviewed.
5.2.1. Value at RiskSantander Group’s VaR calculation methodology consists of historical simulation with a 99% confidence level and a one-day horizon for internal risk management, and a ten-day horizon when calculating own funds market risk. Statistical adjustments are made to enable swift and efficient incorporation of the most recent events affecting the levels of risk assumed. Currently, all units use historical simulation with full revaluation, except for Market Risk Spain, which, while using this methodology for certain portfolios, applies historical simulation using a Taylor series approximation for the bulk of its portfolios.

2017 Pillar 3 Disclosures
5. MARKET RISK
176
The Group uses a two-year window, or 520 daily readings, backwards in time from the VaR calculation reference date. Two figures are calculated each day, one by applying an exponential decline factor that gives a smaller weighting to the earliest readings, and another with uniform weightings for all observations. The reported VaR is the higher of these two figures.
At the end of December 2017, Santander Group had authorisation from the Bank of Spain to use the internal market risk model for calculating regulatory capital in the trading portfolios of the Spain, Chile, Portugal, United Kingdom and Mexico units.
The Group’s aim is to gradually extend this approval to the other units that have a trading portfolio, in line with the gradual implementation plan submitted to Banco de España. The total regulatory capital figure using the internal model is calculated as the linear sum of the individual regulatory capital figures of the units that have Banco de España approval, that is, without considering diversification between units.
At year-end 2017, VaR by region was as follows:
TABLE 93. VaR, STRESSED VaR AND IRC BY GEOGRAPHY (MR3)
Millions of Euros
Spain 2017 2016 Variation
VaR (10 days - 99%)
1 Maximum 37.6 62.3 -39.62%
2 Average 20.1 24.6 -18.44%
3 Minimum 13.0 15.4 -15.86%
4 End of period 18.1 23.5 -23.05%
Stressed VaR (10 days - 99%)
5 Maximum 142.0 104.6 35.76%
6 Average 81.2 69.4 17.07%
7 Minimum 60.3 46.5 29.63%
8 End of period 82.1 65.2 25.86%
Incremental Risk Charge (99.9%)
9 Maximum 516.9 413.2 25.10%
10 Average 360.5 253.3 42.35%
11 Minimum 136.6 139.7 -2.19%
12 End of period 136.6 301.4 -54.67%
UK 2017 2016 Variation
VaR (10 days - 99%)
1 Maximum 13.4 10.1 32.96%
2 Average 9.2 6.4 44.63%
3 Minimum 6.7 4.1 63.65%
4 End of period 9.4 8.0 18.21%
Stressed VaR (10 days - 99%)
5 Maximum 76.7 50.5 51.94%
6 Average 51.9 33.4 55.63%
7 Minimum 33.4 17.4 91.54%
8 End of period 73.3 37.8 94.13%
Incremental Risk Charge (99.9%)
9 Maximum – – –
10 Average – – –
11 Minimum – – –
12 End of period – – –
Chile 2017 2016 Variation
VaR (10 days - 99%)
1 Maximum 15.6 11.7 33.66%
2 Average 8.4 6.3 33.28%
3 Minimum 4.7 2.2 109.04%
4 End of period 12.4 6.8 81.48%
Stressed VaR (10 days - 99%)
5 Maximum 25.7 21.6 19.24%
6 Average 17.3 11.5 50.31%
7 Minimum 8.9 4.7 88.62%
8 End of period 19.9 11.9 67.24%
Incremental Risk Charge (99.9%)
9 Maximum 13.9 9.7 43.06%
10 Average 6.4 6.2 3.11%
11 Minimum 1.5 3.4 -54.19%
12 End of period 1.5 0.7 107.49%

2017 Pillar 3 Disclosures 177
Main summary
Chapter summary
Enhanc. table
List of tables
Mexico 2017 2016 Variation
VaR (10 days - 99%)
1 Maximum 19.8 27.4 -27.86%
2 Average 14.0 11.6 20.62%
3 Minimum 8.8 7.1 23.94%
4 End of period 17.3 18.2 -5.31%
Stressed VaR (10 days - 99%)
5 Maximum 38.3 36.9 3.89%
6 Average 26.3 22.5 17.30%
7 Minimum 14.0 15.7 -11.24%
8 End of period 21.5 21.4 0.44%
Incremental Risk Charge (99.9%)
9 Maximum 33.7 61.8 -45.38%
10 Average 23.0 42.1 -45.30%
11 Minimum 7.5 17.9 -58.22%
12 End of period 7.5 19.8 -62.37%
Portugal 2017 2016 Variation
VaR (10 days - 99%)
1 Maximum 0.05 0.09 -40.09%
2 Average 0.03 0.03 -1.67%
3 Minimum 0.01 0.01 -16.00%
4 End of period 0.02 0.02 -11.27%
Stressed VaR (10 days - 99%)
5 Maximum 0.10 0.06 67.73%
6 Average 0.04 0.03 55.47%
7 Minimum 0.01 0.01 74.70%
8 End of period 0.03 0.02 27.31%
Incremental Risk Charge (99.9%)
9 Maximum – – –
10 Average – – –
11 Minimum – – –
12 End of period – – –
By way of a summary, the Group’s average VaR for the trading business in 2017 was 21.5 million euros, despite the continued high volatility caused by Europe’s sovereign debt crisis. Also, it could be said that the Group’s trading risk profile was low in comparison to other similar financial groups. Dynamic management of risk enables Santander Group to adopt changes in strategy to unlock opportunities in an uncertain environment.
For further details see Chapter 5, section C.2 of the 2017 Annual Report on the Santander Group website.
5.2.2. Stressed VaRThe methodology for calculating stressed VaR is the same as that used to calculate VaR, but with two differences:
• Historical window for observing factors: in the stressed VaR calculation a window of 260 data readings is used, instead of the 520 used for computing the ordinary VaR measurement.
• Unlike the method used for the ordinary VaR calculation, stressed VaR is not obtained as the higher of the uniformly weighted percentile and the exponentially weighted percentile; instead, the uniformly weighted percentile is used directly.
All other aspects of the methodology and inputs for calculating the stressed VaR are the same as for the VaR.
When determining the observation period, Methodology has analysed the history of a subset of market risk factors picked on the basis of an expert analysis of the most significant positions in the books. The scope considered comprises the treasury departments for which there was approval by Banco de España for the use of the internal model at 31 December 2017: Spain, United Kingdom, Chile, Portugal and Mexico.
The windows currently used to calculate stressed VaR are:
TABLE 94. STRESS WINDOW
Periodos
Spain 25/03/2008- 25/03/2009
UK 14/07/2008 – 01/07/2009
Chile 25/03/2009 – 07/04/2010
Brazil 01/09/2008 - 31/08/2009
Mexico 23/09/2008 – 05/10/2009
Portugal 17/03/2015 – 17/03/2016
These stress windows are regularly reviewed, and a daily check is run on the validity of the window to compare both VaR and stressed VaR. This check may determine that an analysis is required of the loss and gain vectors used to calculate the VaR values in order to determine the positions and market movement that made VaR exceed stressed VaR over a continuous period of time.
The aim of the analysis is to identify and attempt to separate the causes of the exceptions into two basic categories:
• Market movements: it may be necessary to review the window.
• Significant changes in the composition of the portfolio: in this case an analysis will need to be conducted with the Business department so as to ascertain whether the new positions will be permanent, or if they are one-off transactions, and thus decide whether the window should be reviewed.
If the analysis of the exceptions of percentile VaR with respect to stressed VaR reveals that the current window used to calculate daily VaR covers a period with greater market volatility than the stress window used to calculate stressed VaR, then the stress window will be reviewed.

2017 Pillar 3 Disclosures
5. MARKET RISK
178
5.2.3. Incremental Risk ChargeFollowing the recommendations of the Basel Committee on Banking Supervision and applicable regulations, an additional metric is calculated in relation to the credit risk inherent in the trading portfolios: the incremental risk charge (IRC).
The IRC is intended to measure both rating migration risk and any incremental default risk that is not captured by VaR through changes in credit spreads. The IRC metric is calculated, where applicable, for public and private fixed-income bonds, bond derivatives and credit derivatives.
The method used to calculate the IRC, which is essentially similar to that applied to the credit risk of non-trading portfolio exposures, is based on the Merton structural model, which dictates that the default event occurs when the assets of a company fall below a certain level of its debts. This internally developed model comprises direct measurements on the distribution queues of losses caused by the different credit events it contemplates, i.e. default risk and migration of credit quality subject to a confidence interval of 99.9% and a capital horizon of one year for all positions. The assumed liquidity horizon coincides with the one-year capital horizon, there being no other liquidity horizons of less than one year. The IRC calculation methodology uses a loss distribution generated via Monte Carlo simulation, using two transition matrices; one for corporate issues and the other for sovereign issues. The transition matrices used in the IRC model are based on the historical probabilities of transition, published by the rating agencies. These probabilities are processed to remove the Non-rated category and adjusted to include the internally estimated probability of default. This calibration process is run once a year to incorporate the latest information. The model does not assume the periodical renewal of positions (roll-over); rather a model of constant positions along the one-year capital and liquidity horizon, which consists of maintaining the same positions along this horizon independently of the maturity of each of them.
It is a corporate model that incorporates the portfolios from the different regions in which the IRC has been approved to calculate independent IRC figures.
5.2.4. Stress testingVarious types of stress test scenarios are currently applied:
• VaR scenarios: market variables are simulated within three and six standard deviations either side of the mean. These scenarios help define a portfolio’s risk profile.
• Historical scenarios: scenarios are constructed on the basis of relevant historical events and are used to forecast maximum losses that would occur were these events to repeat themselves.
• Severe crisis scenarios: extreme scenarios based on movements in market variables that have no known historical precedent.
• Plausible scenarios: another alternative is to conduct the stress test using scenarios based on expectations of future market performance. These expectations are based on scenarios that are not as extreme as the stressed scenarios.
When defining the scenarios in which the portfolios are to be tested a distinction is drawn between the following:
• Global scenarios: affecting all units. These are defined globally and each unit is responsible for calculating the movements of the variables that apply to them.
• Abrupt crisis: ad hoc scenario with sudden market jolts. Rising interest rate curves, steep drops in stock markets, strong dollar appreciation against all other currencies, spikes in volatility and in lending spreads.
• Subprime crisis: historical scenario of the crisis triggered in the market on the heels of the subprime mortgage crisis in the United States. The analysis seeks to capture the impact on results of the liquidity crunch in the markets. The scenarios will have two different time horizons: 1 day and 10 days. Both scenarios posit plunges in stock markets, interest rate declines in the core markets and increases in emerging markets, and dollar appreciation against all other currencies.
• Adverse scenario: this reflects the systemic risks currently considered the greatest threats to banking stability in the European Union. Events occurring in this scenario take account of increases in global bond yields along with an incremental fall in the creditworthiness of countries with low demand; stagnation of political reforms jeopardising the sustainability of public finances and a lack of the adjustments necessary to maintain reasonable market funding.
• Reverse stress test scenarios: those scenarios that can compromise the Bank’s ongoing viability. Here, the potential vulnerabilities of the business are identified, along with hidden risks and interactions between the different risk factors. These inverse scenarios start from a known stress result (such as non-compliance with certain ratios relating to capital, liquidity or capital adequacy) and from there they identify the extreme scenarios in which the movements of the market variables can cause those events that compromise the viability of the business.
• Forward-looking scenarios: where the aim is to anticipate possible negative consequences of changes in market variables and come up with options to prevent the ensuing impacts. They help to detect signs of change in the positioning of portfolios and provide better support for decision-making.
A consolidated monthly stress test is prepared, under the supervision of the global market risk committee, with explanations of the main variations in the results for the different scenarios and units. An alert mechanism is also in place, so that when a scenario returns a loss that is high by historical standards or in terms of the capital consumed by the portfolio in question, the relevant business head is notified.
The stress test is performed by applying the same methodologies for all sub-portfolios covered by the internal market risk model.

2017 Pillar 3 Disclosures 179
Main summary
Chapter summary
Enhanc. table
List of tables
The table below shows the results as of 31 December 2017, broken down by risk factor (interest rate, equities, foreign currency, credit spread, commodities and the volatility for each), in a scenario in which volatility equivalent to six standard deviations in a normal distribution is applied. The scenario is defined by taking for each risk factor the change that produces the highest potential loss in the global portfolio.
TABLE 95. STRESS SCENARIO: MAXIMUM VOLATILITY (WORSE CASE)
Millions of Euros
2017 2016
Interest rate Equities
Foreign currency
Credit spread
Com-modities Total
Interest rate Equities
Foreign currency
Credit spread
Com-modities Total
TOTAL TRADING -32.5 -8.7 -5.3 -18.7 0.0 -65.2 -100.5 -3.1 -10.3 -10.0 -0.1 -124.0
Europe -10.3 -3.3 -1.9 -18.2 0.0 -33.7 -14.7 -1.2 -2.9 -9.2 -0.1 -28.1
Latin America -21.0 -5.4 -3.0 0.0 0.0 -29.4 -74.8 -1.9 -6.8 0.0 0.0 -83.5
USA -0.1 0.0 -0.3 0.0 0.0 -0.4 -7.5 0.0 -0.5 0.0 0.0 -8.0
Global Activities -0.1 0.0 0.0 -0.5 0.0 -0.6 -0.1 0.0 0.0 -0.8 0.0 -0.9
Asia -1.0 0.0 -0.1 0.0 0.0 -1.1 -3.4 0.0 -0.1 0.0 0.0 -3.5
The stress test reveals that the economic loss suffered by Santander Group in its trading portfolios, in terms of the mark to market (MtM) result, would be, if the stress movements defined in the scenario materialised in the market, 65 million euros. This loss would be concentrated in Europe (in the following order: interest rates, credit spread and equities) and Latin America (in the following order: interest rates, exchange rates and equities).
5.2.5. Backtesting (MR4)The general aim of backtesting is to verify the accuracy of the Value at Risk (VaR) calculation model. In other words, whether to accept or reject the model used to estimate the maximum loss on a portfolio with a given level of confidence, over a certain period of time.
Backtesting is analysed at local level by the local market risk control units. The market risk consolidation unit is responsible for backtest reporting at consolidated level. It is important to note that the backtesting methodology is applied identically to all the sub-portfolios covered by the internal market risk model.
The backtesting exercise consists of comparing the VaR forecasts, given a certain confidence level and time horizon, with the actual losses incurred over a time horizon equal to the VaR time horizon.
Three types of backtesting have been defined:• Clean backtesting: the daily VaR is compared with the results
obtained without taking into consideration intraday results or the changes in the positions of the portfolio. This method is used to check the accuracy of the individual models used for valuing and measuring the risks of various positions.
• Dirty backtesting: the daily VaR is compared with the net results for the day, including the results of intraday operations and results from fees and commissions.
• Dirty backtesting without mark-ups or fees: the daily VaR is compared with the net results for the day, including the results of intraday operations but excluding those generated by mark-ups and fees. This seeks to provide an idea of the intraday risk undertaken by the Group’s treasury departments.
In order to calibrate and control the effectiveness of the internal market risk measurement and management systems, Santander Group regularly performed the required benchmark tests and analyses throughout 2017, with the conclusion that the model was reliable.
Number of exceptionsAn exception occurs whenever the losses or gains observed in a day exceed the VaR estimate. The number (or percentage) of exceptions recorded is one of the most intuitive indicators for establishing a model’s accuracy.
The confidence level for the VaR calculation is a measure of the number of exceptions expected to occur in a given time window. For example, if the daily VaR is calculated with a confidence level of 99%, the percentiles of interest are the 1st and the 99th percentiles of the P&L distribution, so we should expect 2% of exceptions during the days studied (1% due to excess profit and 1% due to excess loss).
If there are significantly more, or fewer, exceptions, this may be (but is not necessarily) a sign of problems in the VaR model employed. With the observed P&L and estimated VaR data it is possible to construct a hypothesis test to check the validity of the VaR/P&L relationship.

2017 Pillar 3 Disclosures
5. MARKET RISK
180
Time between exceptionsThe confidence level for the VaR is also a measure of the number of days that can be expected to elapse between successive exceptions. For instance, if the daily VaR is calculated at 99% confidence (1st and 99th percentiles), we may expect a mean time of approximately 50 days between exceptions.
Similarly to what was explained in relation to the frequency of exceptions, hypothesis-testing can be done based on the time between exceptions as a means of validating the VaR model.
Breadth between exceptionsWhereas the VaR predicts with a certain probability the risk that is assumed, the average excess (or expected shortfall) is a predictor, for that probability, of the average loss once the VaR has been exceeded. This study should be included when analysing the backtesting report in order to obtain the size of the potential losses that exceed the VaR level.
Daily VaR/P&L relationshipTo validate the VaR model, it is not enough to analyse the number and type of exceptions that occur in a given time frame. Other indicators must be observed in order to ensure the model’s consistency. One such indicator is the daily VaR/P&L relationship. This relationship is defined as follows:
• The P&L figure, as a percentage of VaR, on all the days on which there are no exceptions (losses or gains).
• Calculation of the arithmetic mean of these figures.
The percentage should be close to a value determined by the VaR confidence level, because the higher the chosen confidence level, the higher the VaR estimate (and the smaller the P&L results as a percentage of that estimate).
If the percentage observed is much higher than expected, the risk is being underestimated, and the model should be reviewed. If the observed percentage is significantly larger than expected, the risk is being underestimated and the model should be reviewed. Conversely, if the percentage is significantly smaller, then the risk is being overestimated and the VaR model should be adjusted. The latter outcome may be desirable, however, if the aim is to maintain conservative risk estimates.
The following diagram shows the annual backtest at the end of December 2017 for each unit with internal model approval:

2017 Pillar 3 Disclosures 181
Main summary
Chapter summary
Enhanc. table
List of tables
SPAIN
Millions of Euros
10.0
20.0
30.0
40.0
50.0
0.0
-10.0
-20.0
31-D
ec-1
60
7-Ja
n-17
14-J
an-1
721
-Jan
-17
28-J
an-1
70
4-Fe
b-17
11-F
eb-1
718
-Feb
-17
25-F
eb-1
70
4-M
ar-1
711
-Mar
-17
18-M
ar-1
725
-Mar
-17
01-
Apr
-17
08-
Apr
-17
15-A
pr-1
722
-Apr
-17
29-A
pr-1
70
6-M
ay-1
713
-May
-17
20-M
ay-1
727
-May
-17
03-
Jun-
1710
-Jun
-17
17-J
un-1
724
-Jun
-17
01-
Jul-1
70
8-Ju
l-17
15-J
ul-1
722
-Jul
-17
29-J
ul-1
70
5-A
ug-1
712
-Aug
-17
19-A
ug-1
726
-Aug
-17
02-
Sep-
170
9-Se
p-17
16-S
ep-1
723
-Sep
-17
30-S
ep-1
70
7-O
ct-1
714
-Oct
-17
21-O
ct-1
728
-Oct
-17
04-
Nov
-17
11-N
ov-1
718
-Nov
-17
25-N
ov-1
70
2-D
ec-1
70
9-D
ec-1
716
-Dec
-17
23-D
ec-1
7
P&LVaR 95%VaR 99%VaE 99%VaE 95%
MEXICO
Millions of Euros
6.0
10.0
8.0
4.0
2.0
0.0
-2.0
-4.0
-6.0
-8.0
02-
Jan-
170
9-Ja
n-17
16-J
an-1
723
-Jan
-17
30-J
an-1
70
6-Fe
b-17
13-F
eb-1
720
-Feb
-17
27-F
eb-1
70
6-M
ar-1
713
-Mar
-17
20-M
ar-1
727
-Mar
-17
03-
Apr
-17
10-a
br-1
717
-Apr
-17
24-A
pr-1
70
1-M
ay-1
70
8-M
ay-1
715
-May
-17
22-M
ay-1
729
-May
-17
05-
Jun-
1712
-jun-
1719
-Jun
-17
26-J
un-1
70
3-Ju
n-17
10-J
un-1
717
-Jul
-17
24-J
ul-1
731
-Jul
-17
07-
Aug
-17
14-A
ug-1
721
-Aug
-17
28-A
ug-1
70
4-Se
p-17
11-S
ep-1
718
-sep
-17
25-S
ep-1
70
2-O
ct-1
70
9-O
ct-1
716
-Oct
-17
23-O
ct-1
730
-Oct
-17
06-
Nov
-17
13-N
ov-1
720
-Nov
-17
27-N
ov-1
70
4-D
ec-1
711
-Dec
-17
18-D
ec-1
725
-Dec
-17
P&LVaR 95%VaR 99%VaE 99%VaE 95%

2017 Pillar 3 Disclosures
5. MARKET RISK
182
PORTUGAL
Thousands of Euros
15
20
10
5
0
-5
-10
-15
-20
02
-Jan
-17
09-
Jan-
1716
-Jan
-17
23-J
an-1
730
-Jan
-17
06-
Feb-
1713
-Feb
-17
20-F
eb-1
727
-Feb
-17
06-
Mar
-17
13-M
ar-1
720
-Mar
-17
27-M
ar-1
70
3-A
pr-1
710
-Apr
-17
17-A
pr-1
724
-Apr
170
1-M
ay-1
70
8-M
ay-1
715
-May
-17
22-M
ay-1
729
-May
-17
05-
Jun-
1712
-Jun
-17
19-J
un-1
726
-Jun
-17
03-
Jul-1
710
-Jul
-17
17-J
ul-1
724
-Jul
-17
31-J
ul-1
70
7-A
ug-1
714
-Aug
-17
21-A
ug-1
728
-Aug
-17
04-
Sep-
1711
-Sep
-17
18-S
ep-1
725
-Sep
-17
02-
Oct
-17
09-
Oct
-17
16-O
ct-1
723
-Oct
-17
30-O
ct-1
70
6-N
ov-1
713
-Nov
-17
20-N
ov-1
727
-Nov
-17
04-
Dec
-17
11-D
ec-1
718
-Dec
-17
25-D
ec-1
7
P&LVaR 95%VaR 99%VaE 99%VaE 95%
CHILE
Millions of Euros
03-
Jan-
1710
-Jan
-17
17-J
an-1
724
-Jan
-17
31-J
an-1
70
7-Fe
b-17
14-F
eb-1
721
-Feb
-17
28-F
eb-1
70
7-M
ar-1
714
-Mar
-17
21-M
ar-1
728
-Mar
-17
04-
Apr
-17
11-A
pr-1
718
-Apr
-17
25-A
pr-1
70
2-M
ay-1
70
9-M
ay-1
716
-May
-17
23-M
ay-1
730
-May
-17
06-
Jun-
1713
-Jun
-17
20-J
un-1
727
-Jun
-17
04-
Jul-1
711
-Jul
-17
18-J
ul-1
725
-Jul
-17
1-A
ug-1
70
8-A
ug-1
715
-Aug
-17
22-A
ug-1
729
-Aug
-17
05-
Sep-
1712
-Sep
-17
19-S
ep-1
726
-Sep
-17
03-
Oct
-17
10-O
ct-1
717
-Oct
-17
24-O
ct-1
731
-Oct
-17
07-
Nov
-17
14-N
ov-1
721
-Nov
-17
28-N
ov-1
70
5-D
ec-1
712
-Dec
-17
19-D
ec-1
726
-Dec
-17
P&LVaR 95%VaR 99%VaE 99%VaE 95%
4.0
5.0
3.0
2.0
1.0
0.0
-1.0
-3.0
-2.0
-4.0
-5.0
-6.0
P&LVaR 95%VaR 99%VaE 99%VaE 95%
UK
Millions of euros
8.0
10.0
6.0
4.0
2.0
0.0
-2.0
-6.0
-4.0
-8.0
-10.0
03-
Jan-
17
17-J
an-1
7
31-J
an-1
7
14-F
eb-1
7
28-F
eb-1
7
14-M
ar-1
7
28-M
ar-1
7
11-A
pr-1
7
25-A
pr-1
7
09-
May
-17
23-M
ay-1
7
06-
Jun-
17
20-J
un-1
7
04-
Jul-1
7
18-J
ul-1
7
1-A
ug-1
7
15-A
ug-1
7
29-A
ug-1
7
12-S
ep-1
7
26-S
ep-1
7
10-O
ct-1
7
24-O
ct-1
7
07-
Nov
-17
21-N
ov-1
7
05-
Dec
-17
19-D
ec-1
7

2017 Pillar 3 Disclosures 183
Main summary
Chapter summary
Enhanc. table
List of tables
The table below shows the number of exceptions at 31 December 2017 for the units with internal model approval:
TABLE 96. EXCEPTIONS AT UNITS WITH INTERNAL MODEL
Exceptions Model Status
Spain 2 Valid
United Kingdom 3 Valid
Chile 1 Valid
Portugal 1 Valid
Mexico 0 Valid
The exception in Spain on 19 May was down to movements in the swap curve spread and the depreciation of the Brazilian real, while the exception of 7 September was down to changes in the rates curves mainly on account of German debt.
The 18 April exception in the United Kingdom was caused by changes in the interest rate market due to a combination of general elections in the UK, inflation levels and Brexit. The 14 and 22 December exceptions ocurred due to movements in the cross currency curves.
Meanwhile, the exception in Portugal on 19 May was down to movements in the currency market largely relating to the dollar and the Brazilian real.
Valuation adjustmentsThe fair value of a financial instrument is calculated using the appropriate valuation model. Valuation adjustments may be needed, however, when no market quotations are available for price comparison purposes.
Sources of risk include uncertain model parameters, illiquid issuers of underlying assets, poor quality market data or unavailable risk factors (sometimes the best alternative is to use limited models with controllable risk). In such situations, calculating and applying adjustments to the valuation is a common practice in the industry. It is done by Santander to take account of the sources of model risk described below:
• For fixed-income markets, examples of model risk include correlation between fixed-income indices, the absence of modelling of stochastic basis spreads, calibration risk and modelling volatility. Other sources of risk arise from the estimation of market data.
• In equity markets, examples of model risk include modelling the forward skew and the impact of stochastic interest rates, correlation and multi-curve modelling.
Risk may also derive from managing hedges of digital payments, callables and barriers. Also relevant are risk sources that arise from the estimation of market data such as dividends and correlations for quanto options and composites on baskets.
• For specific financial instruments pegged to home mortgage loans guaranteed by financial institutions in the United Kingdom (which are regulated and partly financed by the government) and derivatives on underlying property assets, the Halifax House Price Index (HPI)
is the main input. In these cases, the assumptions include estimates regarding the future growth and volatility of the HPI, the mortality rate and implicit credit spreads.
• Inflationary markets are exposed to model risk due to uncertainty regarding modelling of the correlation structure between different inflation rates (consumer price indices). Another source of risk may arise from the bid-offer spread of inflation-linked swaps.
• Currency markets are exposed to model risk in their modelling of forward skew and the impact of modelling stochastic interest rates and correlation for multi-asset instruments. Risk may also arise from market data, due to the existence of specific illiquid foreign exchange pairs.
5.2.6. Internal validation of the models
GLOBAL [PFE (REC), CVA, DVA and IRC]Santander Group currently uses an advanced model based on Monte Carlo simulations and an analytical model for calculating potential exposure to counterparty credit risk - PFE (REC). In Spain, Mexico and Portugal and at the US subsidiary (Santander New York Branch) and Santander Bank North America (SBNA), the two models coexist (mixed model), whereas the other units only use the analytical model.
A development and validation project was approved in 2017 to replace the existing aggregation systems. The project will be deployed from 2018 onward.
With regard to corporate CVA and DVA models, which take the expected positions of the PFE (REC) models, the recurring validation process currently in progress is due to finish in early 2018.
Meanwhile, the recurring validation process for the model of calculating regulatory capital for issuer risk (Incremental Risk Charge) was completed in April 2017 and various change recommendations on the existing model have been reviewed. These relate to improvements on the way migration losses are calculated and also on the use of regulatory LGDs and enhancing the granularity of the spread matrices employed.
The objectives of Internal Validation for 2018 will be focused on:
• Recurring validation of REC, CVA/DVA metrics.
• Monitoring of the recommendations associated with the models.
GLOBAL [setting of price of Front XVA]Work continued throughout 2017 on the process of developing and validating products and improvements to Quantia environment Framework (QeF) for the construction of the Mark-to-Future bucket. This model is one of the main inputs when calculating valuation adjustments (XVA).
The objectives of Internal Validation for 2018 will focus on validating the metrics of the new aggregation engine to be developed from 2018 onward.
GLOBAL [setting of fixed income prices by Front Office]In 2017, the Group continued to work on validating market input models (volatility for indices and interest rate curves) and model input models.

2017 Pillar 3 Disclosures
5. MARKET RISK
184
Further progress was also made in validating the FVAs for Bermuda Swaptions and the validation documentation for native Murex models was improved.
Last but not least, various improvements and new developments were made to the in-house models (accreting Bermudas and callable repos) and to the treatment of negative rates on products pegged to different indices.
The objectives of Internal Validation for 2018 will be focused on:
• Validating native and in-house models for Murex and new Fair Value Adjustment models and payoffs.
• Validating most sophisticated models for management and valuation adjustments.
GLOBAL [setting of FX price by Front Office]The Group continued its process of validating market inputs models in 2017 and meanwhile the validation documentation for the native Murex models was improved and the new implementation of local volatility models was validated.
The objectives of Internal Validation for 2018 will be focused on:
• Validating input models and new pay-offs.
• Validating most sophisticated models for management and valuation adjustments.
GLOBAL [setting of Equity and Inflation prices by Front Office]In 2017, the Group continued to work on validating market input models (volatility for indices and single stocks, dividends, repo rates, inflation volatility curves and surfaces) and model input models.
Improvements were also made to the validation documentation for the native Murex models.
Last but not least, we have various improvements and new developments in relation to in-house models (quanto options and baskets with an FX component, improvements to products valued using a scholastic volatility model and to self-cancelling products) and the treatment of negative rates on hybrid interest rate models.
The objectives of Internal Validation for 2018 will be focused on:
• Validating new payoffs.
• Validating more sophisticated models for management and valuation adjustments.
GLOBAL [setting of Risk price]In September 2017, work got under way to roll out the remediation plan to adjust pricers for AIRe with a greater level of materiality. This plan will continue to be implemented in 2018.
Dashboard [VaR and SVaR]In 2017, work continued on the quarterly validation dashboard for the Market VaR and SVaR models of Spain, UK, Brazil, Mexico, Chile and Portugal. The dashboard incorporates a number of key indicators used to monitor the quality of models, namely the SVaR/VaR ratio, the number of backtesting exceptions, the degree of consistency of P&L Front - Risks and the publication use test. These indicators are included in recurring validations, and the early monitoring thereof, constitutes proactive control of models’ functioning.
SPAIN [VaR and SVaR]Recurring validation of the VaR and SVaR models for Spain was completed in 2017. The main recommendations are essentially to continue improving the consistency of the P&Ls for Murex and AIRe while increasing the quality controls for the market data time series.
Further tests were run during this validation processes. These tests are based on a review of p-values and the validity of VaR re-scaling assumptions.
The Group also completed validation exercises based on hypothetical portfolios intended to identify weaknesses in the models.
It also reviewed a number of proposed changes for improving the VaR and SVaR models. These consist of capturing new cross and higher-order sensitivities for those portfolios whose VaR is calculated through a Taylor approximation and defining and implementing various models to capture the risks that have yet to be capture (Risks not in Model).
Meanwhile, Santander Group has validated the Fair Value Adjustments (FVA) models for liquidity in equities, along with various specific concentration FVA models.
The objectives of Internal Validation for 2018 will be focused on:
• Validating market data models (curves, surfaces, dividends, etc.).
• Validating new improvements deriving from new regulatory requirements.
• Validating new FVA models.
CHILE [VaR and SVaR]In December 2017, the recurring validation of internal VaR and SVaR models was completed for Chile. The main recommendations consist of continuing to improve MtM and P&L reconciliations, implementing a framework for calculating Risks not in VaR and continuing to improve model documentation, particularly when it comes to the set of risk factors employed in calculating P&L and their inclusion in the VaR calculation.
The objectives of Internal Validation for 2018 will be focused on:
• Validating market data models (curves, surfaces, dividends, etc.).
• Validation of improvements deriving from new regulatory requirements.
PORTUGAL [VaR and SVaR]In December 2017, the recurring validation of internal VaR and SVaR models was completed for Portugal. The main recommendations resulting from the process include the need to continue increasing the level of detail of model documentation, especially in relation to market data proxies.
The objectives of Internal Validation for 2018 will be focused on:
• Validating market data models (curves, surfaces, dividends, etc.).
• Validation of improvements deriving from new regulatory requirements.

2017 Pillar 3 Disclosures 185
Main summary
Chapter summary
Enhanc. table
List of tables
MEXICO [VaR and SVaR]In October 2017, the recurring validation of internal VaR and SVaR models was completed for Mexico. The main recommendations resulting from the process include the need to continue increasing the level of detail of model documentation, especially in relation to market data proxies, while also increasing quality controls for market data time series.
The objectives of Internal Validation for 2018 will be focused on:
• Validating market data models (curves, surfaces, dividends, etc.).
• Validation of improvements deriving from new regulatory requirements.
UNITED KINGDOM [VaR, SVaR and RNIV]The recurring validation of the VaR and SVaR models and of the Risk not in VaR (RNIV) at Santander UK is due to be completed in early 2018.
The objectives of Internal Validation for 2018 will be focused on:
• Validating market data models (curves, surfaces, dividends, etc.).
• Validation of improvements deriving from new regulatory requirements.
5.3. Structural market riskStructural risk is defined as risk caused by management of different balance sheet items. This risk includes both losses from price changes affecting available-for-sale and held-to-maturity portfolios (banking book), and losses arising from management of assets and liabilities carried at amortised cost of Santander Group.
Specifically, structural risk measures the probability of losses in different balance sheet figures deriving from a change in the levels of different market variables, specifically interest exchange rates.
The principles governing the control of structural risk at Santander Group are as follows:
• Autonomy in management, whereby each entity autonomously manages its balance sheet structure and its capital.
• Control and supervision, which means control and oversight mechanisms of risks must exist.
• Using like-for-like and aggregatable metrics.
• Using like-for-like and documented methodologies.
• Setting and limits and ensuring these are can adjusted accordingly.
• Consolidating information for adequate management of the Group’s structural risks.
• Adjusting to the global regulatory environment.
For further details see Chapter 5, section C.2.3. on the 2017 Annual Report available on the Santander Group website.
5.4. Equity investments and capital instruments not included in the trading bookThis section provides definitions of investments in associates and available-for-sale equity instruments, as well as the associated accounting policies and measurement methods. Information is also provided on the amounts of those equity instruments not included in the trading portfolio.
Investments in associates are those stakes affording Santander Group significant influence, but not control or joint control. This capacity is usually observed with 20% or more of the voting power at the investee.
Equity instruments classified as available for sale are equity instruments issued by entities other than subsidiaries, associates and jointly controlled entities, provided those instruments have not been classified as financial assets/liabilities held for trading or other financial assets at fair value through profit or loss.
Investments in associates are recognised at cost and are periodically tested for impairment.
Equity instruments classified as available-for-sale assets are measured and recorded at fair value, with changes in fair value being recognised in equity under valuation adjustments, unless there is evidence of impairment, in which case the impairment loss would be recognised in the income statement.
Equity instruments whose fair value cannot be reliably measured are carried at acquisition cost, less any impairment losses.

2017 Pillar 3 Disclosures
5. MARKET RISK
186
TABLE 97. AVAILABLE-FOR-SALE CAPITAL INSTRUMENTS
Millions of Euros
31 Dec. 2017
Carrying value Fair value Valuation adjustement
Quoted 1,890 1,890 829
Investment funds 815 815 57
Unquoted 1,541 330 122
TOTAL 4,246 3,035 1,008
For more information about the available for sale capital instruments portfolio, please consult notes 2.d.iii and 8 in the 2017 Auditors' Report and Annual Accounts.
For further details see notes 2.d.iii and 8 on the 2017 Auditor's Report and Annual Accounts available on the Santander Group website.
TABLE 98. AVAILABLE-FOR-SALE EQUITY INSTRUMENTS. CONSOLIDATED GROSS VALUATION ADJUSTMENTS
Millions of Euros
Prior-year balance 1,511
Revaluation gains and losses -365
Amounts transferred to income: -138
Of which, from sales -156
Of which, from impairment 18
Current-year balance 1,008
For more information about the available for sale capital instruments portfolio, please consult note 29.d in the 2017 Auditors' Report and Annual Accounts.
For further details see note 29.d on the 2017 Auditor's Report and Annual Accounts available on the Santander Group website.
With respect to holdings accounted for using the equity method at year-end 2017, the amounts for associates and jointly controlled entities were EUR 4,537 million and EUR 289 million respectively.
There are also investments in Group entities totalling EUR 1,816 million which in the public perimeter are accounted for using the full consolidation method.
The Group tests these investments for impairment on a regular basis. No evidence of significant impairment was found in 2017.

2017 Pillar 3 Disclosures 187
Main summary
Chapter summary
Enhanc. table
List of tables

OPERATIONAL RISK
6

2017 Pillar 3 Disclosures 189
Main summary
Chapter summary
Enhanc. table
List of tables
6. Operational risk
6.1 Definition and objectivesThe Group's objective when it comes to controlling and managing operational risk is to identify, measure/assess, monitor, control, mitigate and communicate the risk. Santander Group expressly recognises that while a certain volume of expected operational losses may indeed arise, unexpected severe losses as the result of failures in business controls are unacceptable.
The following progress was made in 2017 on the path towards these objectives: improvements to the operational risk control and management model as we migrate towards advanced models with the roll-out of the AORM programme (Advanced Operational Risk Management) and a management technology tool (Heracles); integrated implementation across the entire organisation of the new risk control and self-assessment process to better appraise and manage the mitigation of operational risks via the initial lines of defence; use of internal operational risk models for economic capital and risk appetite; better monitoring of the Group’s main risks using new appetite metrics (e.g. unauthorised trading) and a system cascading down to business units; and implementation of the advanced cyber-risk function and application of new mitigation measures.
For further details see Chapter 5, section C.3, on the 2017 Annual Report on the Santander Group website.

7.1. Liquidity risk and funding 191
7.2. Compliance and conduct risk 193
7.3. Capital risk 194
7.4. Santander Group's internal control model
194
7.4.1. Description of Santander Group's internal control model
194
7.4.2. Documentation and updating 195
7.4.3. Assessment and integration in management
196
OTHER RISKS AND INTERNAL CONTROL
7

2017 Pillar 3 Disclosures 191
Main summary
Chapter summary
Enhanc. table
List of tables
7. Other risks and internal control
This chapter provides information about liquidity and funding risk, compliance and conduct risk, and capital risk, together with Santander Group's internal control model.
For further details on other, non-financial risks see Chapter 5, sections C.5 and C.6 on the 2017 Annual Report on the Santander Group website.
7.1. Liquidity risk and fundingLiquidity risk entails the potential losses that may be incurred by an entity as a result of its inability to secure funding on the market and/or the higher borrowing costs of new sources of finance.
The aim of liquidity risk management is to guarantee that funds shall be available at the right time and cost to enable the entity to meet obligations and carry out its operations.
Risk profile:
• Management of liquidity and funding is an essential component of business strategy.
• The liquidity and funding model is decentralised, and is based on autonomous subsidiaries responsible for covering their own liquidity needs.
• Needs arising from business activity in the medium/long term must be funded by medium-term and long-term instruments.
• A large proportion of customer deposits from an essentially retail banking balance sheet.
• Diversification of sources of wholesale funding in terms of instruments/investors, markets/currencies and timelines.
• Limited calls on short-term wholesale funding.
• Availability of a sufficient liquidity reserve, including a discount capacity with central banks to be used in adverse situations.
For information on unencumbered assets (article 443 of the CRR), please see chapter 4 > Consolidated Financial Report > Liquidity and Funding Risk Management, on the 2017 Annual Report.
For further details see chapter 4 > Consolidated Financial Report > Liquidity and Funding Risk Management,on the 2017 Annual Report on the Santander Group website.

2017 Pillar 3 Disclosures
7. OTHER RISKS AND INTERNAL CONTROL
192
The table below shows quantitative information of LCR which complements Article 435(1)(f) of Regulation (EU) No 575/2013:
TABLE 99. LCR DISCLOSURE TEMPLATE*
Millions of Euros
Total unweighted value
Total weighted value
Quarter ending on (31-12-2017)
Number of data points used in the calculation of averages 12 12High-quality liquid assets
1 Total high-quality liquid assets (HQLA) – 183,745Cash outflows
2 Retail deposits and deposits from small business customers, of which: 431,521 30,8563 Stable deposits 291,603 14,573
4 Less stable deposits 139,855 16,221
5 Unsecured wholesale funding 186 87
6 Operational deposits (all counterparties) and deposits in networks of cooperative banks 51,072 11,958
7 Non-operational deposits (all counterparties) 128,452 68,292
8 Unsecured debt 6,412 6,412
9 Secured wholesale funding – 7,200
10 Additional requirements 160 36
11 Outflows related to derivative exposures and other collateral requirements 20,837 19,428
12 Outflows related to loss of funding on debt products 1,193 1,193
13 Credit and liquidity facilities 137,534 15,276
14 Other contractual funding obligations 7,303 6,675
15 Other contingent funding obligations 72,831 6,016
16 TOTAL CASH OUTFLOWS – 51
Cash inflows
17 Secured lending (eg reverse repos) 53,750 2,710
18 Inflows from fully performing exposures 47,861 30,902
19 Other cash inflows 11,920 10,239
EU-19a
(Difference between total weighted inflows and total weighted outflows arising from transactions in third countries where there are transfer restrictions or which are denominated in non-convertible currencies) –
EU-19b (Excess inflows from a related specialised credit institution) –
20 TOTAL CASH INFLOWS 114 44
EU-20a Fully exempt inflows – –
EU-20b Inflows Subject to 90% Cap – –
EU-20c Inflows Subject to 75% Cap 99,089 43,851
21 Liquidity buffer – 183,745
22 Total net cash outflows – 129,455
23 Liquidity coverage ratio (%) – 142%
* Information calculated as the consolidated LCR simple averages of month-end observations over the twelve months of 2017.
A description of the degree of centralisation of liquidity management and interaction between the group’s units:The Group has adopted a decentralised financing model through a structure of autonomous subsidiaries that are self-sufficient when it comes to liquidity. Each subsidiary is responsible for covering the liquidity needs arising from its current and future business, either through deposits captured from its customers in its area of influence or through recourse to the wholesale markets in which it operates, within a framework of management and supervision coordinated at Group level. Therefore, each subsidiary manages and monitors its
own LCR ratio, ensuring that it remains at all times within the limits specifically established for that subsidiary. These individual limits are more stringent than regulatory requirements and are reflected in the risk appetite of each subsidiary.
This financing model has proven itself to be highly effective during times of high market stress, since it effectively prevents problems at one division from impacting the borrowing capacity of other areas and therefore of the Group as a whole; this being a definite threat in the case of centralised financing models.
2017 Pillar 3 Disclosures 193
Main summary
Chapter summary
Enhanc. table
List of tables
The LCR ratio shown here is essentially the sum of the individual ratios at each Group unit, stripping out any one-off intra-group transactions.
Concentration of funding and liquidity sources: To ensure sound liquidity management, the Group seeks to diversify its sources of wholesale financing, meaning diversification by instrument, investor, market, currency and terms. The Group’s model relies on its presence in major markets, affording it a large degree of diversification. Since most Group units are commercially-oriented, they obtain a large part of their funding from deposits secured from retail customers, which are inherently more stable than wholesale sources of funding.
In view of all these considerations, there is no significant risk of concentration of funding. Even so, the Group is continuing to implement metrics and limits to control any concentration of funding sources.
Derivative exposures and potential collateral calls:Most transactions with derivatives carried out by Group entities are subject to collateral contracts covering the market value of those transactions. Group units include liquidity risk –involving the impact of an adverse market scenario leading to changes in the market values of those derivatives and therefore generating additional liquidity needs due to the need to post collateral– in their LCR ratio using the “historical look-back approach”, in which the most significant net change in 30 days over the preceding 24 months is calculated and then added as further liquidity needs.
Currency mismatch in the LCR:Santander Group prepares its consolidated LCR ratio for each of its significant currencies, which reflect the regions in which the Group’s different units operate: US dollar (USD), pound sterling (GBP), Brazilian real (BRL), Mexican peso (MXN) and Chilean peso (CLP). Individually, each of the entities draws up its own LCR ratio for its significant currency. The main risk here comes from the positions held in Latin American countries, where the local currencies are not directly convertible. Therefore, the positions held in foreign currency are monitored closely; a process that includes currency-specific stress scenarios.
Other items in the LCR calculation that are not captured in the LCR disclosure template but that the institution considers relevant for its liquidity profile: Santander Group’s consolidated ratio is largely shaped by the individual ratios of its three main units: Santander Parent, Santander UK and Santander Brazil. These units acquire most of their funding from retail deposits, which are much more stable liabilities that generate potentially fewer outflows from the LCR ratio. Most cash outflows from the LCR ratio stem from wholesale funding, which is considerably more unstable, although the Group typically minimises and diversifies the maturities. Meanwhile, the Group has a high quality “stock” of liquid assets; approximately 90% on average of its assets under the LCR numerator are Tier 1. This is because the units’ asset portfolios mainly comprise the public debt of the countries in which the Group operates or countries with a good credit rating.
For further details see Chapter 5, section C.2.4 on the 2017 Annual Report on the Santander Group website.
7.2. Compliance and conduct riskAccording to the configuration of lines of defence at Santander Group, especially within the compliance and conduct function, primary responsibility for management of this function’s risks lies with the first line of defence, jointly with the business units that directly originate those risks and the compliance and conduct function. The function is managed by allocating compliance activities or tasks to this first line of defence, or is carried out directly by compliance and conduct. The compliance and conduct function comprises all matters related to regulatory compliance, anti-money laundering and counter-terrorist financing, product governance and consumer protection, as well as reputational risk.
The compliance function fosters adherence by Santander Group to rules, supervisory requirements and principles and values of good conduct by setting standards, discussing, advising and reporting in the interests of employees, customers, shareholders and the wider community.
Santander Group’s risk appetite in this area essentially takes the form of a statement of zero appetite for risks of this type, with the clear objective of minimising any economic, regulatory or reputational impact on Santander Group. To this end, units are systematically monitored through a common methodology that establishes a number of compliance risk indicators and assessment matrices that are prepared for each local unit. With this objective in mind, the risk appetite was developed and implemented across the Group units within the established perimeter. The annual process of preparing the risk appetite was completed in late 2017 with the aim of verifying that the current model is fit for measuring the function’s risk appetite. Here, the corporate thresholds for certain indicators were lowered so as to provide a truer view and to show proper alignment with the function’s strategy and risk tolerance. These adjustments were approved by the relevant committees and passed on to the units concerned .
For further details see Chapter 5, section C.4 on the 2017 Annual Report on the Santander Group website.

2017 Pillar 3 Disclosures
7. OTHER RISKS AND INTERNAL CONTROL
194
7.3 Capital riskCapital risk means the risk of Santander Group not having a sufficient quantity or quality of capital to fulfil its internal business targets, regulatory requirements, or market expectations.
As the second line of defence, the capital risk function controls and supervises first line activities mainly through the following processes:
• Supervision of capital planning and adequacy for all component elements (balance sheet, income statement, risk-weighted assets and available capital).
• Continuous supervision of capital measurements at Santander Group.
The function aims to provide complete and regular monitoring of capital risk by verifying that capital coverage and adequacy reflect the risk profile of Santander Group.
Capital risk control revolves around the capital management model in place at Santander Group, which brings together different processes such as capital planning and adequacy and the resulting implementation and monitoring of the budget, along with the continuous measurement of capital and reporting and disclosure of information on capital, as shown below:
Capital adequacy
Implementation and monitoring
Budget
3 year plan
Planning
Capital measurement
Reporting and disclosure
For further details see chapter 4 > Consolidated Financial Report > Capital Management and Adequacy. Solvency ratios and the chapter 5 > section C.7 on the 2017 Annual Report on the Santander Group website.
7.4. Santander Group’s internal control model7.4.1. Description of Santander Group’s internal control modelSantander Group’s internal control model (ICM) comprises processes and procedures by senior management and the rest of the Group’s employees to provide reasonable assurance that the goals set by Santander Group, including goals regarding control of corporate strategy, effectiveness and efficiency of operations, reliability of financial reporting and compliance with applicable laws and regulations, are actually met.
Santander Group’s ICM complies with all legal and regulatory requirements and is in accordance with the guidelines set by the Committee of Sponsoring Organisations of the Treadway Commission (COSO) on its last Framework published in 2013 (Internal Control Integrated Framework) and the Framework for Internal Control Systems in Banking Organisations issued by the Bank for International Settlements (BIS) in Basel.
The Group’s internal control model is based on the following principles:
1. Culture of senior management control and supervision. This culture is embodied in the following aspects:
• The board of directors takes ultimate responsibility for ensuring that an adequate and effective internal control system is in place and is kept up to date.
• Senior management is responsible for establishing appropriate internal control policies, and ensuring they are put into effect and monitored.
• The board of directors and senior management are responsible for making all levels of the organisation aware of the importance of internal control. All employees of the organisation involved in internal control processes must have clearly defined responsibilities.
2. Identification and assessment of the control environment. The Group’s internal control system ensures that all the necessary controls to achieve objectives are properly identified and assessed, and that new controls are assessed on a continuous basis.
3. Establishment of adequate controls and separation of functions. A clear structure of control and allocation of responsibilities has been established and control functions are an intrinsic part of the organisation’s business and support activities, ensuring sufficient separation of functions to avoid any conflict of responsibilities.
4. Reporting and communication. The Group’s procedures and systems ensure accurate and comprehensible reporting and communication.
5. Monitoring of the control system. In addition to the continuous review of business and operations, control activities undergo regular assessments, the conclusions of which are reported to senior management and the board, along with any matters for special monitoring.
Proper documentation of the Group’s ICM is a vital component for achieving these objectives. To that end, those responsible for the

2017 Pillar 3 Disclosures 195
Main summary
Chapter summary
Enhanc. table
List of tables
organisational structure use a standard methodology to describe their processes through documentation on tasks and controls.
Controls that must be documented in the ICM are identified on the basis of senior management’s knowledge and understanding of the business and operational processes, taking into account both criteria of proportions and also qualitative criteria relating to the nature, complexity or actual structure of the business.
Santander Group has a catalogue of theoretical controls in order to guarantee the sufficiency and completeness of the internal controls established by the different functions involved in relation to the Group’s control model.
7.4.2. Documentation and updatingThe following are some of the main features of Santander Group’s ICM documentation:
• The documentation of the corporate model involves every member of the organisation with control responsibilities, through a framework of direct responsibilities that are individually assigned.
• Internal control is a decentralised process and is therefore managed at the Group’s various units. A corporate unit also coordinates all Group units and provides general criteria and guidelines for standardising documentation of procedures, tests for assessing controls, classification criteria for potential deficiencies and regulatory adaptations.
SANTANDER GROUP’S INTERNAL CONTROL MODEL STRUCTURE
Almost 130 Santander Group companies
Scope regularly reviewed
SCOPE
REGULAR REVIEW
DOCUMENTATION
RESPONSIBILITIES
Defining a documentation methodology for processes (tasks and controls)
Identifying relevant controls
Identifying and mitigating control weak-nesses
Expert staff assess and certify the ICM
Certification escalated from control officers to the Group CEO
Design and effectiveness of controls assessed every year
Subject to audit
INTERNALCONTROL
MODEL
Keeping descriptions of processes (tasks and controls) and identifying the persons responsible for them up to date is a key aspect of Santander Group's ICM.
In 2017 Santander Group’s ICM documentation evolved to meet the new regulatory requirements affecting banks' procedures and to reflect the changes in the organisation, including changes to the businesses and operational processes and changes to the Group's organisational and corporate structure.
The ICM is not only documented and updated at the business units; it is also key to identifying, documenting and assessing the risks
• The documented model is broad and therefore includes not only activities related to the generation of consolidated financial reporting, but also any other procedures carried out in the business and support areas of each entity which, while they may have no direct impact on accounting, could nevertheless give rise to losses or risks in the event of incidents, errors, infringements of regulations and/or fraud.
• The ICM is a forward-looking model and evolves by adapting to the reality of the Group’s business and support activities at any given time, clearly identifying any risks that might prevent the achievement of goals and the controls that mitigate such risks.
• It includes detailed descriptions of transactions, criteria for assessing the functioning of controls and the conclusions of an assessment of their functioning.
All the ICM documentation at each Group company is stored in a corporate computer application. This application allows processes, risks and controls to be consulted and updated by users in real time, and reviewed by external auditors or supervisory bodies. It also serves as a support tool for the internal control model assessment and certification process, automatically ensuring the model’s integrity.
The chart below shows documentation and responsibilities within the Group’s internal control model:
and controls associated with operational processes outsourced to Santander Group companies.
ICM documentation and its assessment process support compliance with certain regulatory measures such as SOx, Fatca, the Criminal Liability of Legal Entities, Dodd-Frank or Volcker, among others.
Ultimately, the ICM is examined by the Group's auditor, who reports to the audit committee and issues an opinion on the effectiveness of the internal controls applied to the generation of financial reporting in the consolidated financial statements of Santander Group as of 31 December 2017.

2017 Pillar 3 Disclosures
7. OTHER RISKS AND INTERNAL CONTROL
196
The corporate scope of Santander Group’s ICM also imposes an obligation to constantly ensure that those involved in the ICM at all levels of the organisation are kept up to date, coordinated and trained as appropriate. The corporate coordination team organises online and classroom training activities and keeps the methodology up to date, and sends proper instructions to Group entities.
7.4.3. Assessment and integration in managementSantander Group has an assessment and certification process for reviewing the performance of the ICM and the effectiveness of the established controls, processes and activities. This process starts with an assessment of the control activities by those responsible for them. Based on the conclusions of this first assessment, the various sub-processes, processes and activities related to the generation of financial information are certified. Once all these certifications have been analysed, the CEO, CFO and Controller certify the effectiveness of the ICM as a whole.
In 2017, the Group worked to integrate the operational risk control and self-assessment (RCSA) with the process for assessing and certifying the control model. Combining both processes makes the exercise more efficient, consistent and robust and enables the certification process to be brought fully within the Group’s risk management.
The annual exercise identifies and assesses the criticality of the risks and the effectiveness of the controls in place across Santander Group.
Moreover, the system that supports the integrated risk control and self-assessment exercise also integrates relevant information from other instruments used to manage operational risk: loss events and the readings of indicators tracked by the specialised first and second lines of defence functions.

2017 Pillar 3 Disclosures 197
Main summary
Chapter summary
Enhanc. table
List of tables

8.1. Relevant information contained in other documents
199
8.2. Remuneration policy applicable to categories of staff that may have a significant impact on the risk profile of Santander Group
199
8.3. Main characteristics of the criteria for identifying categories of staff that may have a material impact on the risk profile of Santander Group
200
8.4. Specific features of the remuneration policy applicable to Identified Staff members
201
8.5. Application of the remuneration policy for the Identified Staff in 2017
202
8.6. Total remuneration of the Identified Staff in 2017
203
8.7. Remuneration policy for 2018 and following years
206
REMUNERATION POLICIES
8

2017 Pillar 3 Disclosures 199
Main summary
Chapter summary
Enhanc. table
List of tables
8. Remuneration policies
8.1. Relevant information contained in other documentsThe 2017 remuneration committee report, which is published alongside the notice of the 2018 General Shareholders’ Meeting, describes:
• The functions of the committee regarding the remuneration of directors, members of senior management and other executives whose work could have a significant impact on the Group’s risk profile.
• The composition of the committee, directors’ attendance at meetings, the involvement of board members on other committees, the approximate time dedicated to each function and how the committee operates.
• The remuneration policy for both executive and non-executive board members and the corporate governance principles regulating the subject of remuneration.
• The 2017 remuneration policy for directors and senior management, focusing especially on variable remuneration and how it was applied in the year.
The board of directors is responsible for approving director and senior management remuneration, as well as the core payment terms of other executives or employees who, while not belonging to senior management, take on risks, carry out control functions (i.e. internal audit, risk management and compliance) or who receive global remuneration that places them in the same remuneration bracket as senior management and employees who take on risk and whose professional activities may have a significant impact on the Group’s risk profile (all of these together with the senior management and the Company’s board of directors comprise the so-called “Identified Staff”).
Furthermore, the committee report also includes the following Pillar 3 significant information:
• The decision making process for setting the remuneration policy of directors, senior managers and the core elements of the remuneration of the identified staff.
• The basic features of the different compensation policies.
• Information on the criteria applied for assessing the metrics that determine director and senior management variable remuneration and their adjustment according to risk, as well as the results of director metrics.
• The deferral policy and other conditions linked to the payment of variable remuneration, including the application of malus and clawback provisions.
For further information see the 2017 Report of the Remuneration Comittee available on the Santander Group website
8.2. Remuneration policy applicable to categories of staff that may have a significant impact on the risk profile of Santander GroupSantander Group has specific guidelines in its remuneration policy in regard to those professionals qualified as material risk takers. These guidelines contain:
• The principles and criteria that determine which people have a material impact on the Group’s risk profile, based on Commission Delegated Regulation (EU) 604/2014 of 4 March 20141 , as indicated below.
• The specifics that modify the general remuneration policy for its application to this staff, taking into account all applicable rules and European Banking Authority (EBA) guidelines are described below.
• The general mandate to apply the Group’s general remuneration policy, as adapted in each case so as to comply with local regulatory requirements and recommendations issued by supervisory bodies.
The remuneration of the identified staff in 2017 is in line with the criteria set out in the Group’s remuneration policy.
Note 1: The Identified Staff have been defined in accordance with Spanish Law 10/2014, of 26 June, on the regulation, supervision and solvency of credit institutions, (Law 10/2014), which transposed into Spanish law Directive 2013/36/EU of the European Parliament and of the Council of 26 June 2013, on access to the activity of credit institutions and the prudential supervision of credit institutions and investment firms (Directive CRD IV). Article 32.1 of Law 10/2014 defines this group as consisting of those “staff members whose professional activities have a significant impact on the risk profile of the institution, its group, parent company or subsidiaries” (Identified Staff). That definition derives from article 92(2) of Directive CRD IV and has been implemented by Commission Delegated Regulation (EU) 604/2014 supplementing Directive 2013/36/EU of the European Parliament and of the Council with regard to regulatory technical standards with respect to qualitative and appropriate quantitative criteria to identify categories of staff whose professional activities have a material impact on an institution's risk profile (the Delegated Regulation).

2017 Pillar 3 Disclosures
8. REMUNERATION POLICIES
200
8.3. Main characteristics of the criteria for identifying categories of staff that may have a material impact on the risk profile of Santander GroupThe identified members of the firm have been defined according to the provisions of Law 10/2014, of 26 June, on the restructuring, supervision and solvency of credit institutions, (Law 10/2014 or LOSS), transposing into Spanish law the text of Directive 2013/36/EU of the European Parliament and Council of 26 June 2013 on access to the activity of credit institutions and the prudential supervision of credit institutions and investment firms (CRD IV).
In accordance with that established in the LOSS, professionals that may have a material impact on the bank’s risk profile will be deemed to include senior management, employees that assume risks, employees that exercise control functions, and all employees that receive global remuneration that includes them in the same remuneration bracket as senior management and employees that assume risks. In addition to the previous definition, European legislation, through the publication of Commission Delegated Regulation (EU) No 604/2014, of 4 March, supplementing CRD IV with regard to regulatory technical standards with respect to qualitative and appropriate quantitative criteria to identify categories of staff whose professional activities have a material impact on an institution’s risk profile (hereinafter, “Delegated Regulation 604/2014”), has established a closed list of specific criteria that entities must take into consideration in the identification process.
The Group has implemented the quantitative and qualitative criteria provided in the regulation in order to determine the members of the identified staff and has further supplemented these criteria with additional internal criteria. The following persons generally qualify as identified staff based on this set of criteria:
• Based on qualitative criteria, staff members who work at a material business unit, such as:
• Members of management, executive or supervisory committees.
• The first line of the unit.
• Heads of material business sub-units in that country or business.
• Heads of risk, audit and compliance and their direct superiors.
• Heads of legal or tax advisory services, audit, budget, human resources, compensation and technology and operations.
• Members of senior risk committees, executives with powers to approve risk proposals and those responsible for making significant risk proposals.
• Traders authorised to take substantial positions in market risk.
• Members of the new products committee.
• By quantitative criteria:
• Executives receiving total remuneration of over 500 thousand euros in 2017.
• Executives whose remuneration falls within the top 0.3% band at the Group or in their country.
• Executives who in the past year earned more than the member of the identified staff collective who earned the least remuneration, factoring in the business positions identified in the qualitative criteria.
• Based on internal criteria:
• Executives with significant responsibility for representing the Group at non-material units.
• Executives with a given level of credit or market risk responsibility at certain non-material units.
Additional criteria has also been defined in order to identify and classify the units at which the above criteria is applied. These criteria are based on simple and widely recognised parameters, such as capital and gross income, and reflect the relative importance of each identified unit that has an impact on the risk profile of Santander Group.
Current legislation, best practices and market trends are taken into account when defining the proportionality standards. These apply to both the relative importance of the units, as well as the different degrees of responsibility of the positions occupied by the individuals, and facilitate its implementation.
According to it, the identified staff comprised 1,255 executives across Santander Group at year-end 2017, accounting for approximately 0.62% of total staff.

2017 Pillar 3 Disclosures 201
Main summary
Chapter summary
Enhanc. table
List of tables
8.4. Specific features of the remuneration policy applicable to Identified Staff membersIn general:
• Fixed remuneration must represent a significant proportion of total compensation.
• In no event may variable remuneration exceed 200% of fixed remuneration, or 100% of fixed remuneration at independent control units.
Variable remuneration will typically comprise:
• An incentive to be received partly in cash and partly in shares or other eligible financial instruments. Payment of this incentive is deferred for a period of three to five years (up to seven years in the United Kingdom).
• Performance measurement elements in line with the strategy and long-term interests of shareholders. These elements, which are both short term and, for certain categories, long term oriented, take into consideration quantitative and qualitative criteria that reflect the entity’s results, return, capital performance, conduct in respect of customers and quality of the services provided thereto, risk management and compliance with legislation.
• Malus and clawback clauses, which are triggered in situations in which there is poor financial performance of either, the bank as a whole, a specific division or area thereof, or the exposure generated. Following factors should, at least, be taken into account:
(i) Significant failures in risk management by the bank, or by a business or risk control unit.
(ii) An increase in capital requirements at the bank or one of its business units not planned at the time that exposure was generated.
(iii) Regulatory penalties or legal convictions for events that might be attributable to the unit or staff responsible for them. Likewise, failure to comply with the Bank’s internal codes of conduct.
(iv) Improper conduct, whether individual or collective. Negative effects deriving from the marketing of unsuitable products and the liability of persons or bodies making such decisions will be considered especially significant.
• Ban on hedging deferred or retained shares or instruments and on transferring these in the twelve months following their delivery.

2017 Pillar 3 Disclosures
8. REMUNERATION POLICIES
202
8.5. Application of the remuneration policy for the Identified Staff in 2017The total remuneration package for positions involving control functions must be competitive within the market in order to attract sufficiently qualified and experienced employees to the position. The individual objectives of these positions must be pegged solely to the performance of the control function rather than business results. Performance of the control function must be assessed by staff members who are independent of the supervised business units.
The remuneration policy and the essential remuneration conditions of the individuals who belong to the Identified Staff have been approved by the Group’s board of directors on a proposal from the remuneration committee. The human resources function, jointly with the risk and
compliance functions of each Group company, have duly confirmed that this policy and their remuneration practices comply with applicable law and regulations. The board risk committee supervises the remuneration policy and large-impact remuneration schemes so as to ensure that they are suitably aligned with risk management.
With regard to variable remuneration, the essential elements include:
• Metrics for determining the variable remuneration of the senior management and other top executives. These metrics are also used to determine the variable remuneration of other members of the Identified Staff and are described in section 3 of the report of the remuneration committee.
• Deferral percentages and periods for the Identified Staff based on their category:
Percentage paid immediately
Deferred percentage Deferral period *
"Executive directors and members of the material risk takersgroup with total variable remuneration of ≥ 2.7 million Euros.(**)" 40% 60% 5 years
Executive vice-presidents and country heads of countries accounting for at least 1% of the Group’s economic capital and other members of the material risk takers with total variable remuneration of over ≥ 1.7 million Euros (< 2.7 million Euros). (**) 50% 50% 5 years
Other members belonging to the material risk takers 60% 40% 3 years
*Up to 7 years in certain jurisdictions.
• Pegging a part of the deferred amounts to fulfilment of multi-year objectives for executive directors, senior management and other executives based on their category. These metrics are described in section 2.3 of the report of the remuneration committee.
• The suitability of financial instruments used for the portion of deferred remuneration in financial instruments: use of shares in Banco Santander S.A. or in any of its listed subsidiaries (such as Brazil, Chile, Mexico and Santander Consumer USA) or equivalent instruments (Poland); as well as the ratio between different instruments.
• Defining the events that might trigger the application of malus and clawback provisions on the variable remuneration accruing in 2017. These events, which apply to all members of the Identified Staff, are described above in this chapter.
• No discount is applied to deferred variable remuneration when calculating the ratio of variable to fixed components.
In addition to the general scheme of variable remuneration metrics, Global Corporate Banking (GCB) follows a model that is widely applied across all regions in which the division operates. The model provides remuneration for achieving results using a partial pay-out system, pegging variable remuneration to the division’s ordinary net profit, including provisions and other assimilated costs, as well as the previously established budgetary objectives. The model includes the same categories of metrics –including capital, risks and customers– as those used for the senior management, although they may be adapted accordingly to the needs and requirements of the individual business.
For further information see the 2017 Report of the Remuneration Comittee available on the Santander Group website

2017 Pillar 3 Disclosures 203
Main summary
Chapter summary
Enhanc. table
List of tables
8.6. Total remuneration of the Identified Staff in 2017The following table shows the total remuneration of the Identified Staff in 2017:
TABLE 100. TOTAL REMUNERATION
Thousands of Euros
2017 2016
Identified staffAdmin.
Executives
Other senior
managers5Rest
of staff6 TotalAdmin.
Executives
Other senior
managers5Rest
of staff6 Total
Number of persons 4 19 1,232 1,255 4 18 1,108 1,130
Total fixed remuneration1 14,923 36,222 408,761 459,907 14,661 32,503 357,112 404,276
Total remuneration2;3 16,495 34,084 364,213 414,792 14,893 31,608 344,890 391,391
Payable immediately
In cash 3,699 8,786 111,404 123,888 3,339 8,126 104,829 116,294
in instruments4 3,699 8,786 109,634 122,118 3,339 8,126 103,904 115,370
Deferred payment
In cash 4,549 8,256 71,588 84,393 4,107 7,678 68,079 79,864
in instruments4 4,549 8,256 71,588 84,393 4,107 7,678 68,079 79,864
Payments for new contracts
Total guaranteed remuneration – 2,800 5,062 7,862 – – 7,345 7,345
Number of beneficiaries – 1 10 11 – 10 10
1. Includes fixed salary and supplements, attendance fees and by law-stipulated allotments for executive directors, as well as benefits (including pensions classified as fixed in nature).
2. The variable remuneration of the executive directors and the rest of senior management does not include €2.824 thousand in variable component pensions; the variable remuneration of other employees does not include €10.935 thousand in buyouts or sign on amounts. The variable remuneration components subject to local regulations amounting to 847 thousand Euros are also not included in any of the categories.
3. Variable remuneration is included at its fair value. Fair value has been determined on the date it was awarded, based on an expert assessment report and taking account of different possible scenarios for the performance of the different variables set out in the plan during the measurement periods.
4. The following charts show the distribution of instruments according to the companies of the Santander Group to which they correspond.
5. This column includes the remuneration of the members of senior management (excluding executive directors) as of 31 December 2017.
6. This column includes the remuneration of senior management who resigned their duties during 2017.
The following table shows the distribution of deferred instruments among qualifying Santander Group companies:
THE DISTRIBUTION OF THE DEFERRAL INSTRUMENTS ACCORDING TO THE COMPANY OF SANTANDER GROUP TO WHICH THEY CORRESPOND IS THE FOLLOWING:
Banco Santander, S.A. Santander Brazil Santander Chile Santander Mexico Santander Poland Santander Consumer USA
72%
3%5% 2%1%
17 %
72%
3% 5% 2%1%
17%
INMEDIATE PAYMENT DEFERRED PAYMENT
The total amount of severance payments and other benefits associated with contract termination, including lump-sum early retirement payments, awarded during the year to members of the Identified Staff amounted to 30 million euros for a total of 33 people with an average time spent in the company of 13 years. No severance payments have been made to executive directors active in 2017. The maximum amount of a single pay item amounted to 4.370 million Euros.

2017 Pillar 3 Disclosures
8. REMUNERATION POLICIES
204
The breakdown of total remuneration by area of activity is as follows:
TABLE 101. REMUNERATION BY ACTIVITY AREA
Thousands of Euros
Admin. Executives
Non-executive directors
Investment banking
Commercial Banking
Asset Management
Corporate functions
Independent control
functions Other Total
No. of persons 4 10 263 643 – 98 237 – 1,255
Top-Management 4 – 1 7 – 7 4 – 23
Rest of Identified Staff – 10 262 636 – 91 233 – 1,232
Total remuneration 31,419 3,470 211,519 404,819 – 90,607 132,865 – 874,699
Top-Management 31,419 – 3,296 23,260 – 29,162 14,587 – 101,725
Rest of Identified Staff – 3,470 208,223 381,558 – 61,445 118,278 – 772,975
Areas' fix/variable average ratio 132% 0% 127% 91% – 85% 71% – 95%
The investment banking area includes those professionals that give support to businesses related to wholesale banking (Global Corporate Banking).
The commercial banking area covers all customer banking businesses, including all their supported teams in the diverse geographies, whether they are local management of the related local units or other categories.
The independent control function includes all functions related to risk management, internal audit, compliance or accounting and financial control, as well as others associated to the control of regulatory capital requirements.
Corporate functions include employees involved in both the corporate support areas (such as human resources, technology and operations, communication, general secretariat, strategy, finance planning, etc.) as well as executive directors.
The sum of variable components in 2017 for each member of the Identified Staff did not exceed the limit established in each case for 2017, which was either 100% or 200% when authorised by the General Shareholders’ Meeting. Specifically, the ratio of variable components of remuneration to fixed components for the entire Identified Staff collective was 95% and the limits prescribed for each component were duly observed in all cases.
The following table shows the remuneration schemes for Identified Staff members in which the right to receive shares originated in previous years and for which the vesting targets and/or conditions were fulfilled in 2017 or are pending fulfilment.

2017 Pillar 3 Disclosures 205
Main summary
Chapter summary
Enhanc. table
List of tables
TABLE 102. VESTED RIGHTS
Thousands of Euros
2017 2016
Other remuneration entitlement from previous years:Consolidated and unpaid to be consolidated from 2018
Admin.Executives
Other senior
managersOther
employees TotalAdmin.
Executives
Other senior
managersOther
employees Total
Cash 979 2,417 54,400 57,796 2,129 4,412 40,078 46,619
Number of Santander shares 201,713 500,884 7,698,915 8,401,512 400,871 802,981 5,723,755 6,927,607
Number of Santander Brazil shares – – 2,120,698 2,120,698 – – 2,590,399 2,590,399
Number of Santander Chile shares – – 27,895,424 27,895,424 – – 26,352,098 26,352,098
Number of Santander Mexico shares – – 1,529,930 1,529,930 – – 925,072 925,072
Number of Santander Poland shares* – – 2,289 2,289 – – 5,723 5,723
Number of Santander Consumer USA – – 55,916 55,916 – – 30,873 30,873
* An instrument of Santander Poland (Zachodni WBK) has a value equal to one share of the company.
TABLE 103. UNVESTED RIGHTS
Thousands of Euros
2017 2016
Other remuneration entitlement from previous years:Non-consolidated and unpaid (to be consolidated from 2018)
Admin.Executives
Other senior
managersOther
employees TotalAdmin.
Executives
Other senior
managersOther
employees Total
Cash 2,473 5,667 83,031 91,171 3,685 6,592 54,329 64,606
Number of Santander shares 1,095,768 2,126,614 21,327,509 24,549,891 854,314 1,502,293 8,616,127 10,972,734
Number of Santander Brazil shares – – 2,291,971 2,291,971 – – 3,654,296 3,654,296
Number of Santander Chile shares – – 73,881,690 73,881,690 – – 34,492,583 34,492,583
Number of Santander Mexico shares – – 3,431,283 3,431,283 – – 1,328,889 1,328,889
Number of Santander Poland shares* – – 4,581 4,581 – – 6,121 6,121
Number of Santander Consumer USA – – 96,191 96,191 – – 71,132 71,132
* An instrument of Santander Poland (Zachodni WBK) has a value equal to one share of the company.

2017 Pillar 3 Disclosures
8. REMUNERATION POLICIES
206
The following table shows remuneration by salary band for members of the Identified Staff across the entire Group.
TABLE 104. REMUNERATION BY SALARY BAND
Millions of Euros
Salary band No. of persons
1.0 - 1.5 73
1.5 - 2.0 32
2.0 - 2.5 18
2.5 - 3.0 13
3.0 - 3.5 7
3.5 - 4.0 6
4.0 - 4.5 4
4.5 - 5.0 1
5.0 - 6.0 3
6.0 - 7.0 1
7.0 - 8.0 1
8.0 - 9.0 1
9.0 - 10.0 –
10.0 - 11.0 1
Total 161
* Does not include the deferred part of the 2017 incentive subject to multi-year objectives, the performance and attainment of which will be reviewed at the end of 2019. Payment will be made from 2021 onward, but may be zero, depending on the extent to which the objectives have been met. Notes 5 and 47 of the Group s annual report contain further information on how the plan works, and amount of the deferred remuneration.
8.7. Remuneration policy for 2018 and following yearsThe 2018 remuneration policy for directors is described in section 2.5 of the report issued by the remuneration committee. The main principles of the policy, along with the fixed and variable remuneration components and the variable remuneration policy for members of the Identified Staff, will follow the rules and procedures for executive directors as set out in the report just mentioned. In particular, as regards the variable remuneration policy:
• The existence of a single incentive, which will be determined by a set of quantitative and qualitative metrics.
• Short-term metrics, which include customer, capital, risk and profitability elements.
• Long-term metrics for senior managers: earnings per share, total shareholder return and capital ratio (fully-loaded CET1).
• Part payment in cash and in shares or other instruments.
• Continued-employment, malus and clawback provisions.
• Other conditions, such as the ban on hedging and transferring shares in the twelve months following their delivery.
For further information see the 2017 Report of the Remuneration Comittee available on the Santander Group website
Deferral periods for members of the Identified Staff will be as follows:
2017 2016
Percentage paid
immediatelyDeferred
percentageDeferral period *
Percentage paid
immediatelyDeferred
percentageDeferral period *
Executive directors and members of the material risk takers of thegroup with total target variable remuneration of ≥ 2.7 million Euros.(**) 40% 60% 5 years 40% 60% 5 years
Executive vice-presidents and country heads of countries accounting for at least 1% of the Group’s economic capital and other members of the material risk takers with total target variable remuneration of over ≥ 1.7 million Euros (< 2.7 million Euros). (**) 50% 50% 5 years 50% 50% 5 years
Other members belonging to the material risk takers 60% 40% 3 years 60% 40% 3 years
*Up to 7 years in certain jurisdictions.
** Variable remuneration not denominated in Euros is calculated using the average closing exchange rates in the fifteen trading sessions immediately prior to the Friday, exclusive, of the week before the date on which the board of directors agrees the variable remuneration of the Bank’s executive directors for 2017.

2017 Pillar 3 Disclosures 207
Main summary
Chapter summary
Enhanc. table
List of tables

2017 Pillar 3 Disclosures
APPENDICES
208
I. CRR Mapping 209
II. List of tables 218
III. Glossary 220
APPENDICES
9
Appendices available on the Santander Group website:
IV. Outline of the differences in the scopes of consolidation – entity by entity (Table LI3)
V. Reconciliation public balance sheet /non-public balance sheet
VI. Capital instruments main features template
VII. Transitional own funds disclosure template
VIII. List of specialised management companies (SPVs)
IX. Leverage ratio (LRSum, LRCom and LRSpl tables)
X. Amount of institution-specific countercyclical capital buffer
Access file2017 Pillar 3 Appendicesavailable on the Santander Group website

2017 Pillar 3 Disclosures 209
Main summary
Chapter summary
Enhanc. table
List of tables
Article Brief Description 2017 Pillar 3 TablesAnnual Report 2017 Location
431. Scope of disclosures requirements
431.1 Requirement to publish Pillar 3 disclosures. Information with Prudential RelevanceSantander Group website
431.2 Firms with permission to use specific operational risk methodologies must disclose operational risk information.
Information with Prudential RelevanceSantander Group website
431.3 Institution must have a policy covering the frequency of disclosures, their verification, comprehensiveness and appropriateness., as well as policies for assuring the overall comprehension of their risk profile by market participants.
Sections 1.2.3 and 1.2.4
431.4 Explanation of SMEs ratings decision upon request. Section 3.3
432. Non-material, proprietary or confidential information
432.1 Institutions may omit information that is not material if certain conditions are respected.
N/ASections 1.2.1 and 1.2.3
432.2 Institutions may omit information that is proprietary or confidential if certain conditions are respected.
N/ASection 1.2.3
432.3 Where 432.2 applies this must be stated in the disclosures, and more general information must be disclosed.
N/A
432.4 Use of 432.1, 432.2 or 432.3 is without prejudice to scope of liability for failure to disclose material information.
N/A
433. Frequency of disclosure
433 Disclosures must be published on an annual basis at a minimum, and more frequently if necessary.
Section 1.2.3
434. Means of disclosure
434.1 To include all disclosures in one appropriate medium, or provide clear cross-references to the synonymus information in the other media.
Chapter 1.2.2
434.2 Disclosures made under other requirements (e.g. accounting, listing) can be used to satisfy Pillar 3 requirements, if appropriate.
Chapter 1.2.2
435. Risk management objectives and policies
435.1 Disclose information on:
435.1.a The strategies and processes to manage risks. Chapters 3, 4.3, 5, 6 and Chapter 7
5. Risk Management report.B. Risk Control and Management Model.
Appendix I CRR MappingThe following table links the CRR’s articles on divulging information (Part 8) to the various sections of the document that provide the information required. The ‘Location’ column specifies the section of Pillar 3 or other public document in which the information is dealt with, in whole or in part. This information may be distributed throughout the document on a piecemeal basis.

2017 Pillar 3 Disclosures
APPENDICES
210
Article Brief Description 2017 Pillar 3 TablesAnnual Report 2017 Location
435.1.b Structure and organization of the risk management function.
Chapters 3, 4.3, 5, 6 and Chapter 7
5. Risk Management report.B. Risk Control and Management Model.
435.1.c Risk reporting and measurement systems. Chapters 3, 4.3, 5, 6 and Chapter 7
5. Risk Management report.B. Risk Control and Management Model.
435.1.d Hedging and mitigating risk - policies, strategies and processes.
3.11 Credit risk mitigation techniques5.2.6 Internal Validation of the Models
5. Risk Management report.C.1.4.1. Credit risk by activity in the financial markets.C.1.5.4. Decisions on operations.
435.1.e A declaration of adequacy of risk management arrangements approved by the Board.
3.11 Credit risk mitigation techniques5.2.6 Internal Validation of the Models
5. Risk Management report.B. Risk Control and Management Model.C. Risk profile.
435.1.f Inclusion of a concise risk statement approved by the Board.
3.11 Credit risk mitigation techniques5.2.6 Internal Validation of the Models
5. Risk Management report.B. Risk Control and Management Model.C. Risk profile.
435.2 Information on governance arrangements, including information on Board composition and recruitment, and risk committees.
435.2.a Number of directorships held by Board members. 3. Corporate Governance Report
435.2.b Recruitment policy for the selection of Board members, their actual knowledge, skills and expertise.
3. Corporate Governance Report
435.2.c Policy on diversity of Board membership, objectives, and achievement status.
3. Corporate Governance Report
435.2.d Existence of a dedicated risk committee, and number of meetings during the year.
3. Corporate Governance Report 5. Risk Management report.
435.2.e Description of the information flow on risk to the Board. 3. Corporate Governance Report 5. Risk Management report.
436. Scope of application of the requirements
436 Institutions shall disclose the following information regarding the scope of application of the requirements of this Regulation in accordance with Directive 2013/36/EU:
436.a Name of institution to which the requirements of this Regulation applies.
Section 1.2.1
436.b Difference in the basis of consolidation for accounting and prudential purposes, briefly describing entities that are:(i) fully consolidated;(ii) proportionally consolidated;(iii) deducted from own funds;(iv) neither consolidated nor deducted.
Sections 1.2.1, 1.2.5 and 1.2.6
Table 2 (LI1)Table 3 (LI2)LI3 (Appendix IV)Appendix V
436.c Impediments to transfer of own funds between parent and subsidiaries.
Section 2.1.3
436.d Capital shortfalls in any subsidiaries outside the scope of consolidation.
N/A: Section 1.2.1
436.e The circumstance of making use of articles on derogations from:a) Prudential requirements; orb) Liquidity requirements for individual subsidiaries/entities.
Section 1.2.1

2017 Pillar 3 Disclosures 211
Main summary
Chapter summary
Enhanc. table
List of tables
Article Brief Description 2017 Pillar 3 TablesAnnual Report 2017 Location
437. Own funds
437.1 Institutions shall disclose the following information regarding their own funds:
437.1.a a full reconciliation of Common Equity Tier 1 items, Additional Tier 1 items, Tier 2 items and filters and deductions applied pursuant to Articles 32 to 35, 36, 56, 66 and 79 to own funds of the institution and the balance sheet in the audited financial statements of the institution.
Section 2.2.1 Tables 7 -8Appendix VII
437.1.b Description of the main features of the Common Equity Tier 1 and Additional Tier 1 instruments and Tier 2 instruments issued by the institution.
Section 2.2.1 Appendix VIAppendix VII
437.1.c Full terms and conditions of all Common Equity Tier 1, Additional Tier 1 and Tier 2 instruments.
Section 2.2.1 Appendix VI
437.1.d Disclosure of the nature and amounts of the following:
437.1.d.i Each prudential filter applied pursuant to Articles 32 to 35;
Appendix VII
437.1.d.ii Each deduction made pursuant to Articles 36, 56 and 66; Appendix VII
437.1.d.iii Items not deducted in accordance with Articles 47, 51, 56, 66 and 79.
Appendix VII
437.1.e Description of all restrictions applied to the calculation of own funds in accordance with this Regulation and the instruments, prudential filters and deductions to which those restrictions apply.
Section 2.2.1 Appendix VII
437.1.f Explanation of the calculation basis of the disclosed capital ratios estimated using elements of own funds determined, on a basis other than that laid down in this Regulation.
N/A Appendix VII
438. Capital requirements
438 Institutions shall disclose the following information regarding the compliance by the institution with the requirements laid down in Article 92 of this Regulation and in Article 73 of Directive 2013/36/EU:
438.a Summary of the institution's approach to assessing adequacy of capital levels.
Section 2.1 y 2.3
438.b Result of ICAAP on demand from authorities. Section 2.1.5
438.c Capital requirements for each Standardised approach credit risk exposure class.
Section 2.2.22.2.2.1.3
Tables 10-12Tables 27-29
438.d Capital requirements for each Internal Ratings Based Approach credit risk exposure class.
Section 2.2.22.2.2.1.1
Tables 10-26
438.e Capital requirements for market risk or settlement risk. Section 2.2.2Section 2.2.2.3
Table 10 (OV1) Tables 39-44
438.f Capital requirements for operational risk, separately for the Basic Indicator Approach, the Standardised Approach, and the Advanced Measurement Approaches as applicable.
Section 2.2.2Section 2.2.2.4
Table 10 (OV1) Table 45
438 last paragraph
Requirement to disclose specialised lending exposures and equity exposures in the banking book falling under the simple risk weight approach.
Section 2.2.2.1 Table 22 and 23 (CR10)

2017 Pillar 3 Disclosures
APPENDICES
212
Article Brief Description 2017 Pillar 3 TablesAnnual Report 2017 Location
439. Exposure to counterparty credit risk
439 Institutions shall disclose the following information regarding the institution's exposure to counterparty credit risk as referred to in Part Three, Title II, Chapter 6:
439.a Description of process to assign internal capital and credit limits to CCR exposures.
Section 3.10
439.b Discussion of policies for securing collateral and establishing credit reserves.
Section 3.10
439.c Discussion of management of wrong-way risk exposures. Section 3.10
439.d Disclosure of collateral to be provided (outflows) in the event of a ratings downgrade.
Section 3.10
439.e Derivation of net derivative credit exposure. Section 3.10 Table 70 (CCR1), Table 71 (CCR-5A) Table 73 (CCR2) Table 78 (CCR5-B) Table 83 (CCR8)
439.f Exposure values for mark-to-market, original exposure, standardised and internal model methods.
Section 3.10 Table 70 (CCR1)Table 73 (CCR2)Table 83 (CCR8)
439.g Notional value of credit derivative hedges and distribution of current credit exposure by type of exposure.
Section 3.10 Table 79 (CCR6)
439.h Notional amounts of credit derivative transactions. Section 3.10 Table79 (CCR6)
439.i Estimate of alpha, if applicable. N/A Table 70 (CCR1)
440. Capital buffers
440
Disclosure of the following information inrelation to its compliance with the requirement for a countercyclical capital buffer referred to in Title VII, Chapter 4 of Directive2013/36/EU:
440.aGeographical distribution of credit exposures relevant for the calculation of countercyclical capital buffer. Section 2.1.5 Appendix X
440.b Amount of the specific countercyclical capital buffer. Section 2.1.5 Appendix X
441. Indicators of global systemic importance
441 Disclosure of the indicators of global systemic importance.
Section 2.1.5.1 Tables 5-6
442. Credit risk adjustments
442 Institutions shall disclose the following information regarding the institution's exposure to credit risk and dilution risk:
442.a Definitions, for accounting purposes, of past due and impaired exposures.
Section 3.2 5. Risk Management report.C.1.2.4. Non-performing loans and provisions.
442.b Description of the approaches adopted for calculating specific and general credit risk adjustments.
Section 3.2 5. Risk Management report.C.1.2.4. Non-performing loans and provisions.
442.c Disclosure of pre-CRM EAD by exposure class. Section 3.2 Table 50 (CR1-A)Table 51 (CRB-B)
442.d Disclosure of pre-CRM EAD by geography and exposure class.
Section 3.2 Table 53 (CRB-C) 5. Risk Management report.C.1.2.2. Main figures in 2017.
442.e Disclosure of pre-CRM EAD by industry and exposure class.
Section 3.2 Table 54 (CRB-D) 5. Risk Management report.C.1.2.2. Main figures in 2017.

2017 Pillar 3 Disclosures 213
Main summary
Chapter summary
Enhanc. table
List of tables
Article Brief Description 2017 Pillar 3 TablesAnnual Report 2017 Location
442.f Disclosure of pre-CRM EAD by residual maturity and exposure class.
Section 3.2 Table 55 (CRB-E)
442.g. (i-iii)
Breakdown of impaired, past due, specific and general credit risk adjustments, and impairment charges for the period, by industry.
Section 3.2 Table 50 (CR1-A)Table 56 (CR1-B) table 58 (CR1-E)
5. Risk Management report.C.1.2.2. Main figures in 2017.
442.h Impaired and past due exposures, broken down by geographical area, and the amounts of specific and general credit risk adjustments related to each geographical area.
Section 3.2 Table 50 (CR1-A)Table 56 (CR1-B) Table 57 (CR1-C)
5. Risk Management report.C.1.2.2. Main figures in 2017.
442.i.(i-v) Reconciliation of changes in specific and general credit risk adjustments for impaired exposures.
Section 3.2 Table 58 (CR1-E)Table 59 (CR2-B)Table 60 (CR2-B)
442 last paragraph
Specific credit risk adjustments recorded to income statement are disclosed separately.
Section 3.2 Table 58 (CR1-E)Table 59 (CR2-B)Table 60 (CR2-B)
443. Unencumbered assets
443 Disclosures of unencumbered assets. Section 7.1 4. Economic and Financial ReviewConsolidated financial Report:Liquidity and funding risk management
444. Use of ECAIs
444 For institutions calculating the risk-weighted exposure amounts in accordance with Part Three, Title II, Chapter 2, the following information shall be disclosed for each of the exposure classes specified in Article 112:
444.a Names of the ECAIs used in the calculation of Standardised approach risk-weighted assets and reasons for any changes.
Section 2.2.2.1.3
444.b Exposure classes associated with each ECAI. Section 2.2.2.1.3
444.c Description of the process used to transfer credit assessments to non-trading book items.
N/ASection 2.2.2.1.3
444.d Mapping of external rating to credit quality steps (CQS). Section 2.2.2.1.1Section 2.2.2.1.3
Tables 14-20 (Table CR6)
444.e Exposure value pre and post-credit risk mitigation, by CQS.
Section 2.2.2.1.3Section 3.2
Tables 27 (CR5) and 28 (CCR3)Table 51
445. Exposure to market risk
445 Disclosure of position risk, large exposures exceeding limits, FX, settlement and commodities risk.
Section 2.2.2.3 Table 43 (MR1)
446. Operational risk
446 Scope of approaches used to calculate operational risk. Section 2.2.2.4
447. Exposures in equities not included in the trading book
447 Institutions shall disclose the following information regarding the exposures in equities not included in the trading book:
447.a Differentiation of exposures based on their objectives and an overview of accounting techniques and valuation methodologies used.
Section 5.4 Tables 97 and 98
447.b The balance sheet value, the fair value and, for those exchange-traded, a comparison to the market price where it is materially different from the fair value.
Section 5.4 Tables 97 and 98
447.c The types, nature and amounts of exchange-traded exposures, private equity exposures in sufficiently diversified portfolios, and other exposures.
Section 5.4 Tables 97 and 98
447.d Cumulative realised gains or losses arising from sales and liquidations in the period.
Section 5.4 Tables 97 and 98
447.e Total unrealised gains or losses, the total latent revaluation gains or losses, and any of these amounts included in the original or additional own funds.
Section 5.4 Tables 97 and 98

2017 Pillar 3 Disclosures
APPENDICES
214
Article Brief Description 2017 Pillar 3 TablesAnnual Report 2017 Location
448. Exposure to interest rate risk on positions not included in the trading book
448 Institutions shall disclose the following information on their exposure to interest rate risk on positions not included in the trading book:
448.a Nature of the interest rate risk and the key assumptions, and frequency of measurement of the interest rate risk.
Section 5.3 5. Risk Management report.C.2.3. Structural balance sheet risks.
448.b Variation in earnings, economic value or other relevant measure used by the bank for upward and downward rate shocks according to the banks method for measuring the interest rate risk, broken down by currency.
Section 5.3 5. Risk Management report.C.2.3. Structural balance sheet risks.
449. Exposure to securitisation positions
449 Institutions calculating risk weighted exposure amounts in accordance with Part Three, Title II, Chapter 5 or own funds requirements in accordance with Article 337 or 338 shall disclose the following information, where relevant, separately for their trading and non-trading book:
449.a Objectives in relation to securitisation activity. Section 4.3.1
449.b Nature of other risks in securitised assets, including liquidity.
Section 4.3.3
449.c Risks in re-securitisation activity stemming from seniority of underlying securitisations and ultimate underlying assets.
Section 2.2.2.2Section 4.3.4
Tables 33-34 and 36-38Tables 84-87 and 89-90
449.d Roles played by the institution in the securitisation process.
Section 4.3.2
449.e Extent of the institution's involvement in each of the securitisation roles
Sections 4.3.2. and 4.3.4 Tables 32-36Tables 84-87
449.f Processes in place to monitor changes in credit and market risks of securitisation exposures, and how the processes differ for re-securitisation exposures.
Section 4.3.4
449.g Description of the institution's policies with respect to hedging and unfunded protection, and identification of material hedge counterparties, by relevant type of risk exposure.
N/ASection 3.11
N/ATable 3
449.h Approaches to the calculation of risk-weighted assets for securitisations mapped to types of exposures.
Section 2.2.2.2 Tables 32-36
449.i Types of SSPEs used to securitise third-party exposures as a sponsor.
Section 2.2.2.2Sections 4.3.2 and 4.3.4
Tables 32-36Tables 84-87Appendix VIII
449.j A summary of the institution's accounting policies for securitisation activities, including:
449.j.i Whether the transactions are treated as sales or financings;
Section 4.2
449.j.ii The recognition of gains on sales; Section 4.2
449.j.iii The methods, key assumptions, inputs and changes from the previous period for valuing securitisation positions;
Section 4.2
449.j.iv The treatment of synthetic securitisations if not covered by other accounting policies;
Section 4.2
449.j.v How assets awaiting securitisation are valued and whether they are recorded in the institution's non-trading book or the trading book;
Section 4.2
449.j.vi Policies for recognising liabilities on the balance sheet for arrangements that could require the institution to provide financial support for securitised assets;
Section 4.2
449.k Names of ECAIs used for securitisations and type. Section 4.3.4
449.l Full description of Internal Assessment Approach. N/ASection 2.2.2.2
Table 10 (OV1)
449.m Explanation of significant changes in quantitative disclosures, since the last reporting period.
Sections 2.2.2.2 and 4.3.4
449.n As appropriate, separately for the Banking and trading book securitisation exposures:
449.n.i Amount of outstanding exposures securitised; Sections 2.2.2.2 and 4.3.4
Tables 32-38Tables 84-87 and 89-90
449.n.ii On balance sheet securitisation retained or purchased, and off balance sheet exposures;
Section 2.2.2.2 Tables 32-34

2017 Pillar 3 Disclosures 215
Main summary
Chapter summary
Enhanc. table
List of tables
Article Brief Description 2017 Pillar 3 TablesAnnual Report 2017 Location
449.n.iii Amount of assets awaiting securitisation; N/ASection 4.3.4
449.n.iv Early amortisation treatment, aggregate drawn exposures and capital requirements for securitised facilities;
N/ASection 4.3.3
449.n.v Deducted or 1,250%-weighted securitisation positions; Section 2.2.2.2Section 4.3.4
Tables 33-35Tables 89-90
449.n.vi Summary of the securitisation activity of the current period.
Section 2.2.2.2Section 4.3.4
Tables 32-38Tables 84-92
449.o Banking and trading book securitisations:
449.o.i Retained and purchased positions and associated capital requirements, broken down by risk-weight bands;
Section 2.2.2.2Section 4.3.4
Tables 33-35Tables 89-90
449.o.ii Retained and purchased re-securitisation positions before and after hedging and insurance; exposure to financial guarantors broken down by guarantor credit worthiness.
N/A: non-representative amountSection 2.2.2.2Section 4.3.4
Tables 33-34 and 36-38Tables 84-87 and 89-90
449.p Impaired assets and recognised losses related to banking book securitisations, by exposure type.
Section 2.2.2.2 Table 37
449.q Exposure and capital requirements for trading book securitisations, separated into traditional and synthetic, and exposure type.
Section 2.2.2.2Section 4.3.4
Tables 35,86 and 87
449.r Whether the institution has provided non-contractual financial support to securitisation vehicles.
N/A
450. Remuneration policy
450 Remuneration disclosures (Material Risk Takers): Section 8 Tables 100-104 Remuneration Committee report.
451. Leverage
451.(a,b) Leverage ratio, and breakdown of the total exposure measures, including the reconciliation to financial statements.
Section 2.2.3 Tables 46 y 47Appendix IX
451.c If applicable, the total amount of the derecognized fiduciary items.
N/A
451.(d,e) Description of the processes used to manage the risk of excessive leverage, and factors that impacted the leverage ratio during the year.
Section 2.2.3
452. Use of the IRB Approach to credit risk
452 Institutions calculating the risk-weighted exposure amounts under the IRB Approach shall disclose the following information:
452.a Permission for use of the IRB approach from the competent authority.
Section 2.2.2.1.2
452.b Explanation and review of: Sections 2.2.2.1.1, 3.3 and 3.9
452.b.i Structure of internal rating systems and relation between internal and external ratings;
Sections 2.2.2.1.1, 3.3 and 3.9
Tables 14-23 (Tables CR6 and CR10)
452.b.ii Use of internal ratings for purposes other than capital requirement calculations;
Section 3.5
452.b.iii Management and recognition of credit risk mitigation process;
Section 3.6
452.b.iv Controls mechanisms for rating systems; Section 3.7
452.c.(i-v) Description of ratings processes for each IRB asset class, provided separately.
Sections 2.2.2.1.1 and 3.4 Table 14Tables 15 and 19Tables 16,20 and 22 Table 17Table 23
452.d Exposure values by IRB exposure class, separately for Advanced and Foundation IRB.
Tables 14-23 (Tables CR6 and CR10)
452.e. (i-iii)
For each exposure class, disclosed separately by obligor grade, institutions shall disclose: total exposure, separating loans and undrawn exposures where applicable, and exposure-weighted average risk weight.
Section 2.2.2.1.1 Tables 14-23 (Tables CR6 and CR10)(On and Off Balance and EAD)(RWA Density)
452.f For retail exposure classes, same disclosures as under article 452.e, by risk grade.
Section2.2.2.1.1 Table 17(On and Off Balance and EAD)

2017 Pillar 3 Disclosures
APPENDICES
216
Article Brief Description 2017 Pillar 3 TablesAnnual Report 2017 Location
452.g Actual specific risk adjustments for the period and explanation of changes.
Section 2.2.2.1.1Section 3.1
Tables 14-20 and 50
452.h Description of the factors that impacted on the loss experience in the preceding period.
Section 2.2.2.1.1 Section 2.2.2.1.3Sections 3.8 and 3.10
Tables 14-23 (Tables CR6 and CR10)Tables 27 y 28
452.i Analysis of the historical estimates of losses against actual losses in each exposure, to help assess the performance of the rating system over a sufficient period.
Section 3.9 Table 65 (CR9)
452.j For all IRB exposure classes: Table 21
452.j.(i-ii) Where applicable, PD and LGD by each country where the bank operates.
Section 2.2.2.1.1 Table 21
453. Use of credit risk mitigation techniques
453 Institutions applying credit risk mitigation techniques shall disclose the following information:
Sections 3.6, 3.11
453.a Use of on and off-balance sheet netting. Sections 3.6, 3.11.1 y 3.11.2 5. Risk Management report.C.1.5.4. Decision-making on transactions
453.b How collateral valuation is managed. Sections 3.6, 3.11.1 y 3.11.2 5. Risk Management report.C.1.5.4. Decision-making on transactions
453.c Description of types of collateral used by the institution. Sections 3.6, 3.11.1 y 3.11.2 5. Risk Management report.C.1.5.4. Decision-making on transactions
453.d Main types of guarantor and credit derivative counterparty, creditworthiness.
Sections 3.6, 3.11.1 y 3.11.2
453.e Market or credit risk concentrations within risk mitigation exposures.
Sections 3.6, 3.11.1, 3.11.2 y 3.11.3
Table 81
453.f Standardised or Foundation IRB Approach, exposure value covered by eligible collateral.
Section 3.2 and 3.11.4 Table 51 (CR4)Table 81 (CR3)
453.g Exposures covered by guarantees or credit derivatives. Section 3.2, 3.10 and 3.11.4
Table 51 (CR4)Table 77 (CR7)Table 81 (CR3)
454. Use of the Advanced Measurement Approaches to operational risk
454 Description of the use of insurance or other risk transfer mechanisms to mitigate operational risk.
N/ASection 2.2.2Section 2.2.2.4
Table 10
455. Use of Internal Market Risk Models
455 Institutions calculating their capital requirements in accordance with Article 363 shall disclose the following information:
455.a For each sub-portfolio covered: Section 2.2.2.3 y 5.2
455.a.i Disclosure of the characteristics of the market risk models used;
Section 2.2.2.3 y 5.2
455.a.ii Disclosure of the methodologies used to measure incremental default and migration risk;
Section 2.2.2.3 y 5.2
455.a.iii Descriptions of stress tests applied to the portfolios; Section 2.2.2.3 y 5.2.4
455.a.iv Methodology for back-testing and validating the models. Section 2.2.2.3, 5.2.5 and 5.2.6
455.b Scope of permission for use of the models. Sections 2.2.2.1.2 and 2.2.2.3
Table 25

2017 Pillar 3 Disclosures 217
Main summary
Chapter summary
Enhanc. table
List of tables
Article Brief Description 2017 Pillar 3 TablesAnnual Report 2017 Location
455.c Policies and processes to determine trading book classification, and to comply with prudential valuation requirements.
Section 5.2
455.d. (i-iii)
High/Low/Mean values over the year of VaR, SVaR and incremental risk charge.
Section 5.2.1 Table 93 (MR3)
455.e The elements of the own fund calculation. Sections 2.2.1 and 2.2.2.3 Tables 10 (OV1), 40, 41 (MR2-A) and 42 (MR2-B)
455.f Weighted average liquidity horizons for each sub-portfolio covered by internal models.
Sections 5.2.2, 5.2.3, and 5.2.4
455.gComparison of end-of-day value-at-risk (VaR) measures compared with one-day changes in the portfolio's value. Section 5.2.5 Graph MR4

2017 Pillar 3 Disclosures
APPENDICES
218
Appendix II List of tables
Num. Name Page Num. Name Page
CHAPTER 1. INTRODUCTION
Table 1 Transparency enhancements 15
Table 2
Differences between accounting and regulatory scopes of consolidation and mapping of financial statements categories with regulatory risk categories (LI1) 17
Table 3
Main sources of differences between regulatory exposure amounts and carrying values in financial statements (LI2) 18
CHAPTER 2. CAPITAL
Table 4 Main capital figures and capital adequacy ratios 25
Table 5 Indicators for systemically important institutions 32
Table 6 Global systemically important institutions 32
Table 7Reconciliation of accounting capital with regulatory capital 34
Table 8 Eligible capital 34
Table 9 Regulatory capital. Changes 35
Table 10 Overview of RWAs (OV1) 37
Table 11 Capital requirements for credit risk 38
Table 12 Capital requirements by geographical region 39
Table 13RWA flow statement of credit risk exposures under IRB (CR8) 40
Table 14AIRB approach. Central banks and central governments (CR6) 41
Table 15 AIRB approach. Institutions (CR6) 42
Table 16 AIRB approach. Corporates (CR6) 43
Table 17 AI RB approach. Retail portfolios (CR6) 44
Table 18 FIRB approach. Sovereign (CR6) 45
Table 19 FIRB approach. Institutions (CR6) 46
Table 20 FIRB approach. Corporates (CR6) 47
Table 21Exposures and parameters by segment and geography 48
Table 22 Specialised lending (CR10) 49
Table 23 Equities (CR10) 50
Table 24 List of authorised IRB models by legal entity 54
Table 25 List of authorised IMA models by legal entity 54
Table 26Breakdown of exposure by approach to calculating capital employed 55
Table 27
Standardised approach (including a breakdown of exposures post conversion factor and post mitigation techniques) (CR5) 64
Table 28Standardised approach – CCR exposures by regulatory portfolio and risk (CCR3) 65
Table 29RWs of securitisations for the standardised approach 66
Table 30RWs of securitisations with long-term rating (RBA-IRB approach) 67
Table 31RWs of securitisations with short-term rating (RBA-IRB approach) 67
Table 32
Breakdown of repurchased positions in SSPEs with risk transfer, distributed by function and approach used 68
Table 33
Aggregate amount of securitisation positions purchased and retained with risk transfer. Banking book IRB approach 70
Table 34
Aggregate amount of securitisation positions purchased and retained with risk transfer. Investment portfolio standardised approach 71
Table 35Agregate amount of securitisation positions purchased and retained. Trading book 72
Table 36
Securitisation positions purchased and retained with risk transfer by exposure type in the banking book 73
Table 37 Securitisation structures with risk transfer 74
Table 38 Securitisation structures without risk transfer 75
Table 39 Regulatory capital requirements for market risk 75
Table 40Capital requirements for market risk. Internal model 76
Table 41 Market risk under IMA approach (MR2-A) 77
Table 42RWA flow statements of market risk exposures under IMA (MR2-B) 77
Table 43 Market risk under standardised approach (MR1) 78
Table 44Capital requirements for market risk. Standardised approach* 78
Table 45Changes in capital requirements for operational risk 80
Table 46 Leverage ratio 81
Table 47 Leverage ratio details 81
Table 48 Available economic capital 82
Table 49 RoRAC and value creation 84
CHAPTER 3. CREDIT RISK
Table 50Credit quality of exposures by exposure classes and instruments (CR1-A) 92
Table 51Credit risk exposure and CRM effects (Standardised and IRB approach) (CR4) 93
Table 52 Net amount of exposures (CRB-B) 94
Table 53 Geographical breakdown of exposures (CRB-C) 95
Table 54Concentration of exposures by industry or counterparty type (CRB-D) 96
Table 55 Maturity of exposures (CRB-E) 97
2017 Pillar 3 Disclosures 219
Main summary
Chapter summary
Enhanc. table
List of tables
Num. Name Page Num. Name Page
CHAPTER 4. SECURITISATIONS
Table 84Securitisation positions purchased or retained. Banking book 165
Table 85Securitisation exposures in the banking book (SEC1) 166
Table 86Securitisation positions purchased or retained. Trading portfolio 167
Table 87Securitisatioin exposures in the trading book (SEC2) 168
Table 88Inventory of originated securitisations with largest outstanding balance 169
Table 89
Securitisation exposures in the banking book and associated regulatory capital requirements (Bank acting as originator or sponsor) (SEC3) 170
Table 90
Securitisation exposures in the banking book and associated regulatory capital requirements (Bank acts as an investor) (SEC4) 171
Table 91Initial balance of securitisation funds in 2017, by type of securitised asset 172
Table 92
List of new securitisations originated in 2017, organised by country and originating institution and ordered by initial issue volume 173
CHAPTER 5. MARKET RISK
Table 93 VaR, Stressed VaR and IRC by geography (MR3) 176
Table 94 Stress window 177
Table 95 Stress scenario: Maximum volatility (worst case) 179
Table 96 Exceptions at units with internal model 183
Table 97 Available-for-sale capital instruments 186
Table 98Available-for-sale equity instruments. Consolidated gross valuation adjustments 186
CHAPTER 7. OTHER RISKS AND INTERNAL CONTROL
Table 99 LCR disclosure template 192
CHAPTER 8. REMUNERATION POLICIES
Table 100 Total remuneration 203
Table 101 Remuneration by activity area 204
Table 102 Vested rights 205
Table 103 Unvested rights 205
Table 104 Remuneratio by salary band 206
Table 56Credit quality of exposures by industry or counterparty type (CR1-B) 98
Table 57 Credit quality of exposures by geography (CR1-C) 99
Table 58 Non-performing and forborne exposures (CR1-E) 99
Table 59Changes in stock of general and specific credit risk (CR2-A) 100
Table 60Changes in stock of non-performing and impaired loans and debt securities (CR2-B) 101
Table 61 Ageing of past-due exposures (CR1-D) 101
Table 62 Mapping of internal ratings and PD 102
Table 63 IRB parameters model by region 105
Table 64Key figures of credit risk arising from activity with customers 121
Table 65IRB approach - Backtesting of PD per exposure class (CR9) 131
Table 66 Retail mortgages 143
Table 67 Non-standardised companies 143
Table 68 Total exposure to counterparty risk 144
Table 69 Derivatives exposure 145
Table 70Analysis of the counterparty credit risk (CCR) exposure by approach (CCR1) 146
Table 71Impact of netting and collateral held on exposure values (CCR5-A) 146
Table 72IRB - CCR exposures by portfolio and PD scales (CCR4) 147
Table 73Credit valuation adjustment (CVA) capital charge (CCR2) 152
Table 74 Credit derivative hedge under IRB 153
Table 75Counterparty risk. Credit derivative classification. Bought protection 153
Table 76Counterparty risk. Credit derivative classification. Sold protection 153
Table 77Effect on RWA of credit derivatives used as CRM techniques (CR7) 154
Table 78Composition of collateral for exposures to counterparty credit risk (CCR5-B) 155
Table 79 Credit derivatives exposures (CCR6) 156
Table 80 Guarantees by external rating 156
Table 81Credit risk mitigation techniques - Overview (CR3) 157
Table 82IRB approach. Credit risk mitigation techniques: credit derivatives and personal guarantees 157
Table 83Exposures to central counterparties (CCPS) (CCR8) 158

2017 Pillar 3 Disclosures
APPENDICES
220
Appendix III Glossary
AMA (Advanced Measurement Approach): an operational risk measurement technique set forth in Basel capital adequacy norms, based on an internal modelling methodology.
Advanced IRB approach: all the credit risk parameters are estimated internally by the entity, including the CCFs for calculating the EAD.
AQR (Asset Quality Review): asset quality review exercise per-formed by the European Central Bank.
Asset liability management (ALM): a series of techniques and procedures to ensure correct decision-making on investments and funding at the entity, taking into consideration the interrelation between the various on- balance-sheet and off-balance-sheet items.
Asset securitisation: a financial mechanism that consists of converting certain assets into fixed-income securities that can be traded on a secondary securities market.
ARM: Advanced Risk Management.
AT1 (Additional Tier 1): capital which consists primarily of hybrid instruments.
Back-testing: the use of historical data to monitor the performance of the risk models.
Basel III: a set of amendments to the Basel II regulations published in December 2010, scheduled to take effect in January 2013 and to be gradually implemented until January 2019.
Basic IRB approach: all the risk parameters are determined by the regulator except for the probability of default, which is estimated internally by the bank. The CCFs required to calculate EAD are determined by the regulator.
BIS: Bank for International Settlements.
BCBS: Basel Committee on Banking Supervision.
BRRD (Bank Recovery and Resolution Directive): approved in 2014, the BRRD establishes the framework for the recovery and resolution of banks with the objective of minimising the costs for taxpayers.
CBE 3/2008: Bank of Spain Circular of 22 May 2008 on the calculation and control of minimum capital requirements.
CBE 9/2010: Bank of Spain Circular of 22 December 2010 amending Circular 3/2008.
CBE 4/2004: Bank of Spain Circular of 22 December 2004 on public and confidential financial reporting standards and model financial statement forms.
CBE 2/2016: Bank of Spain Circular of 2 February 2016 on the supervision and solvency of credit institutions, which completes the adaptation to Spanish law of Directive 2013/36/EU and Regulation (EU) No 575/2013. The new Circular repeals Bank of Spain Circular 3/2008 to credit institutions on the determination and control of minimum own funds (except the parts referred to in Circular 5/2008 regarding the regime established therein) and section 11 of Bank of Spain Circular 2/2014.
CCoB (Conservation Buffer): a capital buffer equal to 2.5% of risk-weighted assets (and comprised fully of high-quality liquid assets) to absorb losses generated from the business.
CCyB (Counter Cyclical Buffer): a buffer whose objective is to mitigate or prevent cyclical risks arising from excessive credit growth at aggregate level. Accordingly, the CCB is designed to build up capital buffers during expansionary phases with a dual objective: to enhance the solvency of the banking system and to stabilise the credit cycle.
CCAR (Comprehensive Capital Analysis Review): a framework introduced by the Federal Reserve to review the capital planning and adaptation processes of the main US financial institutions.
CCP (Central Counterparty Clearing House): entity defined in article 2.1 of Regulation (EU) no. 648/2012.
CET1 (Common Equity Tier 1): the highest quality capital of a bank.
CoCos (Contingent Convertible Bonds): debt securities that are convertible into capital if a specified event occurs.
Common equity: a capital measure that considers, among other components, ordinary shares, the share premium and retained profits. It does not include preference shares.
Concentration risk: the risk of loss due to large exposures to a small number of debtors to which the entity has lent money.
Confidence level: in the context of value at risk (VaR) and economic capital, this is the level of probability that the actual loss will not exceed the potential loss estimated by value at risk or economic capital.
Counterparty credit risk: the risk that a counterparty will default on a derivatives contract before its maturity. The risk could arise from derivatives transactions in the trading portfolio or the banking
2017 Pillar 3 Disclosures 221
Main summary
Chapter summary
Enhanc. table
List of tables
portfolio and, as with other credit exposures, it is subject to a credit limit.
CCF (Credit conversion factor): a conversion factor used for converting off-balance-sheet credit risk balances into credit exposure equivalents. Under the AIRB approach Santander Group applies the CCFs in order to calculate the EAD value of the items representing contingent liabilities and commitments.
Credit default swap: a derivatives contract that transfers the credit risk of a financial instrument from the buyer (who receives the credit protection) to the seller (who guarantees the solvency of the instrument).
Credit risk: the risk that customers are unable to meet their contractual payment obligations. Credit risk includes default, country and settlement risk.
Credit risk mitigation: a technique for reducing the credit risk of a transaction by applying coverage such as personal guarantees or collateral.
CRM (Comprehensive Risk Measure): the estimate of risk in the correlation trading portfolio.
CSP: Commercial strategic plan.
ECAI: External Credit Assessment Institution, such as Moody’s Investors Service, Standard & Poor’s Ratings Group and Fitch Group.
ECB Supervisory Board: the body which undertakes the planning and execution of the ECB’s supervisory tasks, carrying out preparatory work and making proposals for decisions for approval by the ECB Governing Board.
ECB Governing Council: the main decision-making body of the ECB, consisting of all members of the Executive Board and the governors of the national central banks of the Euro area countries.
Economic capital: the figure that demonstrates to a high degree of certainty the quantity of capital resources that Santander Group needs at a given point in time to absorb unexpected losses arising from its current exposure.
EDTF (Enhanced Disclosure Task Force): task force that issues recommendations to enhance the transparency of financial institution disclosures to the market.
ESRB (European Systemic Risk Board): the body that has been charged with macroprudential supervision of the financial system in the European Union in order to contribute to preventing or mitigating to systemic risks to financial stability.
EPS (earnings per share): an indicator used to measure a company’s profitability over a specified period of time. EPS is calculated by dividing the company’s profit for the period by the number of shares comprising its share capital.
ERWM: Enterprise Wide Risk Management.
CRR (Capital Requirements Regulation) and CRD IV (Capital Requirements Directive): directive and regulation transposing the Basel II framework into European Union law.
CVA (Credit Valuation Adjustment): the difference between the value of the risk-free portfolio and the true portfolio value, taking into account counterparty risk.
Default risk: the risk that counterparties will not meet their contractual payment obligations.
Derivatives: financial instruments that derive their value from one or more underlying assets, e.g. bonds or currencies.
DLGD (Downturn LGD): the LGD estimated in adverse economic conditions.
D-SIIs: Domestic Systemically Important Institutions.
DTA: deferred tax assets.
EBA: European Banking Authority. Created in 2010, it entered into operation in 2011. The EBA acts as a coordinator between the national entities responsible for safeguarding values such as the stability of the financial system, transparency of markets and financial products, and the protection of bank customers and investors.
EL (Expected loss): a regulatory calculation of the average amount expected to be lost on an exposure, using a 12-month time horizon. EL is calculated by multiplying probability of default (a percentage) by exposure at default (an amount) and LGD (a percentage).
Exposure: the gross amount that the entity could lose if the counterparty is unable to meet its contractual payment obligations, without taking into consideration any guarantees, credit enhancements or credit risk mitigation transactions.
EAD (Exposure at Default): the amount that the entity could lose in the event of counterparty default.
FEVE: Spanish acronym for “firmas en vigilancia especial”, that is, companies on special watch.

2017 Pillar 3 Disclosures
APPENDICES
222
FSB (Financial Stability Board): international institution that monitors and makes recommendations on the global el financial system.
Fully-Loaded: denotes full compliance with Basel III solvency requirements (which become mandatory in 2019).
GHOS (Group of Governors and Heads of Supervision): supervisory body of the Basel Committee.
Global rating tools: these assign a rating to each customer using a quantitative or automatic module.
G-SIB (Global Systemically Important Bank) or SIFI (Systemically Important Financial Institution): financial institutions which, because of their size, complexity and systemic interconnectedness, if allowed to fail could cause major disruptions to the financial system and economic activity.
HQLA: High Quality Liquid Assets.
HVCRE: High Volatility Commercial Real Estate.
ICAAP: internal capital adequacy assessment process.
IFRS: International Financial Reporting Standards.
ILAAP (Internal Liquidity Adequacy Assessment Process): process for the identification, measurement, management and control of liquidity implemented by the entity in compliance with article 86 of Directive 2013/36/EU.
Implicit LGD: this is used to back-test the regulatory LGD estimates. It is based on taking NPLMV as proxy for the Observed Loss, and then dividing the Observed Loss by the PD gives an implicit or observed LGD that can be compared to the regulatory LGD.
Interest rate risk: exposure of the bank’s financial position to adverse movements in interest rates. Acceptance of this risk is a normal part of the banking business and can be a source of significant returns and creation of shareholder value.
Internal ratings-based approach (IRB): an approach based on internal ratings for the calculation of risk-weighted exposures.
Internal validation: a pre-requisite for the supervisory validation process. A sufficiently independent specialised unit of the entity obtains an expert opinion on the adequacy of the internal models for the relevant internal and regulatory purposes, and issues a conclusion on their usefulness and effectiveness.
IRRBB: Interest Rate Risk in the Banking Book.
IRC (Incremental Risk Charge): an estimate of the credit risk associated with unsecuritised positions in the trading book.
IRP: This report, titled Pillar III Disclosures in the English version. (the acronym is for the Spanish Informe de Relevancia Prudencial).
ISDA (International Swaps and Derivatives Association): OTC derivative transactions between financial institutions are usually carried out under a master agreement established by this organisation which details the definitions and general terms and conditions of the contract.
ITS: Implementing Technical Standards.
JST (Joint Supervisory Team): one of the main forms of cooperation between the ECB and the national supervisors.
LCR (Liquidity Coverage Ratio): a ratio that ensures that a bank has an adequate stock of unencumbered high quality liquid assets that can be converted, easily and immediately, into cash in private markets, to meet its liquidity needs for a 30 calendar day liquidity stress scenario.
LDP: low-default portfolio.
Leverage Ratio: a complementary (non-risk based) regulatory capital measure that attempts to guarantee banks’ financial resilience. The ratio is calculated by dividing eligible Tier 1 capital by exposure.
Liquidity risk: the risk that Santander Group might be unable to meet all its payment obligations when they fall due or might only be able to meet them at an excessive cost.
LGD (Loss Given Default): the portion of EAD not recovered at the end of the loan recovery process. It is equal to 1 minus the recovery rate (i.e.: LGD = 1 - recovery rate). The definition of loss used to estimate LGD must be a definition of economic loss, not an accounting loss.
LTV (Loan to value): amount of credit extended / value of guarantees and collateral.
MDA: Maximum Distributable Amount.
Mark-to-market approach: in regulatory terms, an approach for calculating the value of the credit risk exposure of counterparty derivatives (present market value plus a margin, i.e. the amount that takes into consideration the potential future increase in market value).
Market risk: the risk arising from uncertainty regarding changes in market prices and rates (including interest rates, share prices, exchange rates and commodity prices), the correlations between them and their levels of volatility.

2017 Pillar 3 Disclosures 223
Main summary
Chapter summary
Enhanc. table
List of tables
MPE (Multiple Point of Entry): a resolution approach based on multiple points of entry.
Model validation: the process of assessing the effectiveness of a credit risk model using a pre-defined set of criteria, such as the model’s discriminatory power, the appropriateness of the inputs and expert opinions.
MREL (Minimum Requirement of Eligible Liabilities): the final loss absorption requirement established in European legislation for institutions based on an assessment of their resolution plans.
Netting: a bank’s ability to reduce its credit risk exposure by set-ting off the value of its rights against its obligations with the same counterparty.
Non-standardised customers: customers who have been assigned a risk analyst due to the risk assumed. This category includes wholesale banking customers, financial institutions and certain enterprises in retail banking.
NSFR (Net Stable Funding Ratio): a ratio designed to ensure a bank has a balanced balance sheet structure, in which stable funding requirements are funded by stable liabilities.
Operational risk: the risk of incurring losses with regard to employees, contractual specifications and documentation, technology, infrastructure failures and disasters, projects, external influences and customer relations. This definition includes legal and regulatory risk but does not include business and reputational risk.
Over-the-counter (OTC): off-exchange, that is, trading done between two parties (in derivatives, for example) without the supervision of an organised exchange.
Phased-In: refers to compliance with current solvency requirements bearing in mind the transitional period for Basel III implementation.
Pillar 1 Minimum Capital Requirements: the part of the New Basel Capital Accord that establishes the minimum regulatory capital requirements for credit, market and operational risk.
Pillar 2: Supervisory Review Process: an internal capital adequacy assessment process reviewed by the supervisor with possible additional capital requirements for risk that are not included in Pillar I and the use of more sophisticated methodologies than Pillar I.
Pillar 3: Market Discipline: this pillar is designed to complete the minimum capital requirements and the supervisory review process and, accordingly, enhance market discipline through the regulation of public disclosure by the entities.
Point-in-time (PIT) PD: the probability of default at a particular point in time or in particular state of the economic cycle.
Probability of default (PD): this represents the likelihood that a customer or a transaction will fall into default. It is the probability that an event (the default) will occur within a given time horizon.
QIS (Quantitative Impact Study): ad-hoc requests by the EBA for studies analysing and calibrating the impact of new changes in regulation.
Qualifying central counterparty (QCCP): a central counterparty that has either been authorised under article 14 of Regulation (EU) no. 648/2012, or been recognised under article 25 of said Regulation.
Rating: the result of the objective assessment of the counterparties’ future economic situation based on current characteristics and assumptions. The methodology for assigning the ratings depends largely on the type of customer and the available data. A wide range of methodologies for assessing credit risk is applied, such as expert systems and econometric methods.
RDL: Royal Decree Law.
Risk appetite: the amount and type of risks considered reasonable to assume in the execution of its business strategy, so that Santander Group can maintain its ordinary activity in the event of unexpected circumstances. Severe scenarios are taken into account that could have a negative impact on the levels of capital, liquidity, profitability and/or the share price.
Risk limits: approval tools for certain risk types and levels.
Risk-weighted assets (RWA): calculated by assigning a level of risk, expressed as a percentage (risk weighting), to an exposure in accordance with the relevant rules under the standardised approach or the IRB approach.
RoRAC: return on risk-adjusted capital.
RoRWA: Return on risk weighted assets.
RTS: Regulatory Technical Standards.
RWA density: ratio that compares institutions’ total weighted assets and their total balance sheet, and can be interpreted as an average relative risk measure -according to regulatory criteria- of a bank’s overall operations.
SFT (Securities Financing Transactions): any transaction where securities are used to borrow cash, or vice versa. They mostly include repurchase agreements (repos), securities lending activities and sell/buy-back transactions.
Slotting Criteria: an approach used for calculating risk weights for specialised lending exposures, which consists of mapping the internal ratings to five supervisory categories, each with its own specific risk weight.

2017 Pillar 3 Disclosures
APPENDICES
224
SRB (Single Resolution Board): the single resolution authority, which is the second pillar of the Banking Union after the Single Supervisory Mechanism.
SRB: Systemic Risk Buffer applicable to G-SIBs.
Special-purpose vehicle (SPV): a company created for the sole purpose of acquiring certain assets or derivative exposures and of issuing liabilities that are associated solely with these assets or exposures.
SRF: Single Resolution Fund.
SRM: Single Resolution Mechanism.
SREP (Supervisory Review and Evaluation Process): a review of the systems, strategies, processes and mechanisms applied by credit institutions and of their risks.
SSM (Single Supervisory System): the system of banking supervision in Europe. It comprises the ECB and the competent supervisory authorities of the participating EU countries.
Standardised approach: an approach for calculating credit risk capital requirements under Pillar I of Basel II. Under this approach, the risk weightings used in the capital calculation are determined by the regulator.
Standardised customers: customers which have not been expressly assigned a risk analyst. This category generally includes individuals, individual entrepreneurs and retail banking enterprises not classified as non-standardised customers.
Stress testing: used to describe various techniques for measuring the potential vulnerability to exceptional but plausible events.
Stressed VaR: measures the level of risk in stressed historical or simulated market situations.
Synthetic securitisation: transactions that involve a basket of credit swap agreements and bonds serving as collateral. They are called synthetic as rather than containing physical bonds, they carry credit derivatives, also known as synthetic contracts.
Through-the-cycle (TTC) PD: probability of default adjusted to a full economic cycle. It may be taken as a long-term average of the point-in-time PD.
Tier 1: core capital less hybrid instruments.
Tier 2: supplementary capital instruments, mainly subordinated debt and general loan loss allowances, which contribute to the robustness of financial institutions.
TLAC (Total Loss Absorbency Capacity): an additional requirement to the minimum capital requirements set out in the Basel III framework for the absorption of total losses and effecting a recapitalisation that minimises any impact on financial stability, ensures the continuity of critical functions and avoids exposing taxpayers to losses. This requirement is applicable to all G-SIBs.
TLTRO: Targeted Longer-Term Refinancing Operations.
TRIM: Targeted Review of Internal Models.
TSR (Total Shareholder Return): relative performance of total shareholder returns. An indicator of the returns obtained by owners of a company over a period of one year on capital provided to the company.
Unexpected loss: unexpected losses (not covered by allowances) must be covered by capital.
VaR (Value at Risk): estimate of the potential losses that could arise in risk positions as a result of movements in market risk factors within a given time horizon and for a specific confidence level.

2017 Pillar 3 Disclosures 225
Main summary
Chapter summary
Enhanc. table
List of tables
